Embed Size (px)
Citation preview
January 2021
MONGOLIA | South Gobi Region
HYDRO-ECONOMIC ANALYSIS: Prioritized solutions for demand reduction and supply augmentation in the mining and heavy industry region in South Gobi
Hydro-Economic Analysis of the water-supply demand gap reduction in the South Gobi mining and heavy industry
region, Mongolia
-----------------------------------------------------------------------------------------------------------------------------------------
ii
DISCLAIMER
This report is a product of the 2030 Water Resources Group. The findings, interpretations,
conclusion, and recommendations expressed in the report do not necessarily reflect the views of the
World Bank, the Executive Directors of the World Bank or the governments they represent. The
World Bank does not guarantee the accuracy of the data included in this report.
This report is reviewed and accepted by the Steering Board of the Multi-Stakeholder Platform of
the 2030 Water Resources Group in Mongolia.
Water Resources Group 2030 ׀ 2020©
14241, Seoul Street 4, MCS Plaza
Ulaanbaatar, Mongolia 14241
Tel: +976 70078235
Webpage: www.2030wrg.org
Email: [email protected]
Hydro-Economic Analysis of the water-supply demand gap reduction in the South Gobi mining and heavy industry
region, Mongolia
-----------------------------------------------------------------------------------------------------------------------------------------
iii
Developed by:
G. Dolgorsuren, PhD
National consultant, 2030 Water Resources Group
B. Orkhontuul, PhD
National consultant, 2030 Water Resources Group
Ilona Kirhensteine
International consultant, Wood PLC
Chris Fawcett,
International consultant, Wood PLC
Contributed by:
B. Odbayar
Mongolia Country Partnership Coordinator,
2030 Water Resources Group
D. Dorjsuren
Mongolia Country Coordinator
2030 Water Resources Group
Led by:
Rochi Khemka
Global Partnerships Coordinator
2030 Water Resources Group/ World Bank
Hydro-Economic Analysis of the water-supply demand gap reduction in the South Gobi mining and heavy industry
region, Mongolia
-----------------------------------------------------------------------------------------------------------------------------------------
iv
EXECUTIVE SUMMARY
The 2030 Water Resources Group have been working in partnership with the Mongolian government since 2013 with the aim to enable sustainable resources management across the country. The Mongolian Government recently published its “Vision 2050” which sets out a long-term development policy and related objectives for the country. The Vision recognises the critical role that the mining sector will play to support the continued growth of the Mongolian economy. The Vision highlights that mining is expected to accelerate in the Southern Gobi region, which is endowed with copper, gold, coal and includes the country’s largest coal reserve found at Tavan Tolgoi, and the world’s largest known copper and gold deposit at Oyu Tolgoi. However, it recognises that the availability of a sustainable water supply to the region is a key limiting factor to this growth as well as an opportunity.
The focus of this analysis is on Tavan Tolgoi and Oyu Tolgoi which are set to experience additional investment to exploit these known deposits and to support value added industries including coal washing, power plants and copper smelting. To support the Ministry of Mining and Heavy Industry, this study assesses the water supply-demand gap across the 2020-2050 time horizon, identifies potential solutions that could be used to increase the water supply or reduce the water demand, and priorities implementable solutions to close the gap to support sustainable economic growth across both regions.
Future water supply-demand gap
The combined total annual water demand was estimated for both regions for 2030, 2040 and 2050 for three scenarios of low, medium and high growth. Whilst the scope of the analysis focused on water use in the mining and related heavy industry sectors, the demand assessment included water use for domestic, livestock, irrigated agriculture, social services and the food industry. Water availability was estimated based on the continued use of existing approved groundwater reserves, current levels of wastewater reuse and rates of mine dewatering. If all existing mines expand and new projects are implemented in the high growth scenario, and if there is no intervention, the water supply demand gap will be 20,227 TCM/year (34%) in 2040 and 20,176 TCM (34%) in 2050. In the low growth scenario, the available water resources exceed demand, but in the medium growth scenario the water supply demand gap will be 7,226 TCM/year in 2050. m3
HEA of water demand reduction and supply augmentation options
A wide range of water demand reduction and water supply augmentation options were identified as potential options to close the gap. Following stakeholder engagement, the following prioritisation hierarchy of potential solutions and measures was followed:
1. Assessment and ranking of technological solutions aiming to reduce water demand;
2. Assessment and ranking of existing and potential groundwater deposits;
3. Assessment and ranking of surface water storage and transfer projects.
Water demand and supply augmentation options were assessed in line with the above hierarchy, using a holistic set of environmental, economic and social criteria. For each category a bespoke list of holistic prioritisation criteria, scale and weights was developed and validated by stakeholders.
In line with the assessment hierarchy and approach, potential technological options that aim to reduce water demand have been considered in the first instance. Such options include the use of combined dry-wet technology in coal washing plants, water efficient technologies at copper smelter and mineral processing plants, use of calcium chloride for dust suppression and improved domestic wastewater treatment (to enable water reuse). The assessment considered financial costs and technical efficiency of proposed solutions (water savings) to calculate cost-effectiveness ratios and rank alternative options. Potential technological options were then prioritised.
Overall, the analysis concluded that the water demand and supply gap under the high growth scenario can be reduced by 48% or 9,687 TCM/year if the proposed technological solutions are fully implemented. Contribution of technological solutions to closing the gap including additional dewatering would reach 54% or 10,843 TCM/year.
Hydro-Economic Analysis of the water-supply demand gap reduction in the South Gobi mining and heavy industry
region, Mongolia
-----------------------------------------------------------------------------------------------------------------------------------------
v
Full implementation of technological measures would be associated with equivalent annual costs of $ 103.3 million. However, if financial savings from implementation of these measures are considered, this would result in a net saving of $ 42.2 million (in comparison to the baseline).
Next, the analysis considered 20 potential groundwater deposits that can be used to meet the demand for water for mining and heavy industry in the Southern Gobi and contribute to closing the water demand and supply gap. Exploitation of existing and new groundwater deposits was evaluated and prioritised according to four holistic criteria including survey level, exploitable deposit size, environmental impact and distance from the mines. Exploitation of the top five ranking groundwater deposits would contribute 44,896 TCM/year to closing the water gap. In particular, it is proposed that two new groundwater deposits of Tsagaan Tsav and Zagyn Us Khooloi should be developed. Use and further exploitation of these four groundwater deposits would be sufficient to meet the high growth scenario in 2030-2050 and contribute to closing the gap (at an equivalent annual cost of $125 million).
In the short-term there is no alternative to the use of groundwater deposits in order to continue ongoing projects and economic activity. It should, however, be noted that potential emergence of new water users of groundwater deposits in the following decades up to 2050 necessitate diversification of water supply sources and implementation of other measures including surface water transfers.
Surface water transfer projects were evaluated and prioritised according to seven holistic criteria. The criteria applied included level of research and development of the project, possibility to close the water supply and demand gap, transboundary issues and potential conflicts, unit costs of water transfer, as well as social, economic and environmental impacts.
The results of holistic prioritisation based on technical, economic, environmental and social criteria suggest that the Orkhon Water Complex surface water transfer project represents the most viable option to meet the demand for water for mining and heavy industry in the Southern Gobi and contribute to closing the water gap. In particular, at an equivalent annual cost of $212 million, the project would provide 78,840 TCM per year (over and above the highest water demand and supply gap of 20,227 TCM per year). It should be noted that a surface water transfer would support longer term sustainable groundwater abstractions and provide supply for the emergence of potential new water users within and beyond the immediate study area.
Overall, the analysis shows that implementation of only one of the surface water transfer projects would be sufficient to close the highest water demand and supply gap between 2040 and 2050.
Next steps
The Government, investors, private sector companies and stakeholders should prioritise the implementation of options in the order outlined above. The following five key activities have been identified to support the outcomes of this assessment:
• Activity 1: Finalise detailed feasibility studies for the major projects identified in the assessment to include detailed investigations of suggested demand side reduction options, estimates of the investment required and potential funding sources.
• Activity 2: Increase stakeholder participation in the decision on which suggested solutions are most fitting for the context.
• Activity 3: Facilitate the implementation of solutions and measures including considering the robust and transparent consideration of the trade-offs of a long-distance surface water transfer project and of the use of new groundwater sources for water supply of the Southern Gobi and safeguarding the use of non-renewable groundwater resources.
• Activity 4: Identify financing of options including connecting with private sector companies and key national and international financial institutions to create financing solutions for projects that are implementing best practices solutions.
• Activity 5: Improve the legal environment including creating a sound legal environment for issuing water use permits to companies and providing economic incentives for introducing

Hydro-Economic Analysis of the water-supply demand gap reduction in the South Gobi mining and heavy industry
region, Mongolia
-----------------------------------------------------------------------------------------------------------------------------------------
vi
new water management, good practices and advanced technologies in the mining and heavy industry sectors.
Hydro-Economic Analysis of the water-supply demand gap reduction in the South Gobi mining and heavy industry
region, Mongolia
-----------------------------------------------------------------------------------------------------------------------------------------
vii
Table of Contents
Executive Summary ....................................................................................................................... iv
TABLES ......................................................................................................................................... viii
FIGURES ......................................................................................................................................... ix
Acronyms ......................................................................................................................................... x
1. BACKGROUND............................................................................................................................ 1
1.1. 2030 Water Resources Group Mongolian Partnership.................................................. 1
1.2. Objectives ...................................................................................................................... 2
1.3. Approach ........................................................................................................................ 2
2. CURRENT AND FUTURE DEVELOPMENT OF MINING AND HEAVY INDUSTRY IN THE STUDY REGIONS ............................................................................................................................ 4
2.1. Introduction to the study region ..................................................................................... 4
2.2. Mining............................................................................................................................. 5
2.3. Mineral Processing Plants in the study regions ............................................................. 7
2.4. Power Plants in the study regions ................................................................................ 8
3. TAVAN TOLGOI AND OYU TOLGOI: ASSESSMENT OF THE WATER SUPPLY-DEMAND GAP ................................................................................................................................................... 9
3.1. Water demand assessment and scenario development ............................................... 9
3.2. Water availability assessment ..................................................................................... 12
3.3. Water supply-demand balance .................................................................................... 14
4. IDENTIFICATION OF DEMAND AND SUPPLY SIDE OPTIONS TO CLOSE THE WATER GAP ................................................................................................................................................. 16
4.1. Water demand reduction options ................................................................................. 16
4.2. Water supply augmentation options ............................................................................ 19
5. HYDROECONOMIC ANALYSIS ASSESSMENT FRAMEWORK............................................ 24
5.1. Framework and approach to the assessment ............................................................. 24
5.2. Concept of Closing the water supply demand gap and high-level analysis of potential solutions and measures .................................................................................................................. 25
5.3. Hydro-Economic analysis of technological solutions ................................................... 26
5.4. Hydro-Economic analysis of groundwater deposits .................................................... 29
5.5. Hydro-Economic analysis of surface water transfer projects ...................................... 33
6. HYDROECONOMIC ANALYSIS RESULTS AND RECOMMENDED ACTIONS ................... 38
6.1. The main results of the water demand-water supply assessment .............................. 38
6.2. Factors for consideration ............................................................................................. 41
6.3. Recommendations ....................................................................................................... 42
6.4. Overall conclusions ...................................................................................................... 43
ANNEX A. ....................................................................................................................................... 44
A1. Introduction to the study regions .................................................................................. 44
A2. Mining in the study regions ........................................................................................... 45
A3. Mineral Processing Plants in the study regions ........................................................... 47
A4. Power Plants in the study regions ............................................................................... 49
Hydro-Economic Analysis of the water-supply demand gap reduction in the South Gobi mining and heavy industry
region, Mongolia
-----------------------------------------------------------------------------------------------------------------------------------------
viii
ANNEX B. Water Demand Assessment ...................................................................................... 50
B1. Mining Water Demand .................................................................................................. 50
B2. Power Plant Water Demand ......................................................................................... 50
B3. Copper Smelter ............................................................................................................ 51
B4. Water Demand for Population, Agriculture and Other Sectors in the Impact Zone ..... 51
B5. Total Water Use in Tavan Tolgoi and Oyu Tolgoi Impact Zones, 2019 ....................... 54
ANNEX C. Current Water use and availability ........................................................................... 56
C1. Current Water Use ....................................................................................................... 56
C2. Current Mining Water Supply ....................................................................................... 59
ANNEX D. FULL LIST OF PRIORITIZED SOLUTIONS ............................................................... 61
TABLES
Table 2.1. List of projects included in the assessment……………………………………………….. 5
Table 2.2. Brief details of mines at Tavan Tolgoi which are considered in this study……….….… 6
Table 2.3. Brief details of coal washing plants at Tavan Tolgoi…………………………………...… 7
Table 3.1 Method for water demand assessment by sector …………………………………….….. 9
Table 3.2 Growth scenarios based on production for mining and heavy industry ………………. 11
Table 3.3. Total water demand in the Tavan Tolgoi and Oyu Tolgoi region …………………..…. 12
Table 3.4. Total water demand for mining in the Tavan Tolgoi and Oyu Tolgoi region ……….... 12
Table 3.5 Groundwater availability and current use in 2019 in Tavan Tolgoi and Oyu Tolgoi … 13
Table 3.6 Current water availability from mine dewatering and from domestic wastewater
reuse ………………………………………………………………………………………….13
Table 3.7 Total current water availability ……………………………………………………………. 14
Table 3.8 Overview of the water supply and demand across three growth
scenarios 2019 -2050 ………………………………………………………………………. 15
Table 4.1. Water demand for dust suppression in Tavan Tolgoi and Oyu Tolgoi region ………...18
Table 4.2. Dewatering volumes from mines in Tavan Tolgoi and Oyu Tolgoi region ……………..18
Table 4.3. Potential groundwater reserves for water supply of TT and OT Mining and Heavy
industry region …………………………………………………………………………..…. 20
Table 4.4. Surface water transfer to Gobi ………………………………………………………..….. 23
Table 4.5. Reuse of treated domestic wastewater ……………………………………………….…. 23
Table 5.1. Holistic prioritisation of demand reduction and supply augmentation measures …….26
Table 5.2. Financial cost-effectiveness of potential technological solutions ………………………28
Table 5.3. Overview of potential water savings through the implementation of technological
solutions ……………………………………………………………………………………...28
Table 5.4.Holistic prioritisation criteria for technological solutions ………………………………... 29
Table 5.5. Holistic prioritisation – results of the assessment of technological solutions….………29
Hydro-Economic Analysis of the water-supply demand gap reduction in the South Gobi mining and heavy industry
region, Mongolia
-----------------------------------------------------------------------------------------------------------------------------------------
ix
Table 5.6. Financial cost-effectiveness of groundwater deposits………………………………..… 30
Table 5.7 Holistic prioritisation criteria for Groundwater deposits ……………………………..….31
Table 5.8. Holistic prioritisation – results of the assessment of exploitable
groundwater deposits …………………………………………………………………..….32
Table 5.9. Estimation to meet water demand from groundwater resources………………….…...33
Table 5.10. Information sources for surface water transfer projects…………………………….....34
Table 5.11. Financial cost-effectiveness of surface water transfer projects ………………………35
Table 5.12. Holistic prioritisation criteria for surface water transfer projects …………………..….36
Table 5.13. Holistic prioritisation – results of the assessment of surface
water transfer projects ………………………………………………………………………………..36
Table A.1. List of projects included in the assessment……………………………………..………..44
Table B.1. Mining water demand……………………………………………………………...………..50
Table B.2. Power plants water demand ………………………………………………………….……50
Table B.3. Copper smelting plant water demand……………………………………………….…….51
Table B.4. Impact zone of Tavan Tolgoi and Oyu Tolgoi mine…………………………….………..51
Table B.5. Domestic water demand …………………………………………………………….……..52
Table B.6. Water demand of social services/public utilities ……………………………………….. 53
Table B.7. Livestock water demand ……………………………………………………………….…. 53
Table B.8. Irrigated agricultural water demand ……………………..…………………………….… 54
Table B.9. Food production water demand ……………………………………………………….…. 54
Table B.10. Total water use in Tavan Tolgoi and Oyu Tolgoi in impact zone, 2019 …………..... 55
Table C.1. Water Use Permits for mining ……………………………………………………….…… 57
Table C.2. Water use and Water Use Fee of Tavan Tolgoi region, 2019 ……………………..…. 57
Table C.3. Water use and Water Use Fee of Oyu Tolgoi LCC, 2019 ………………………….…. 58
Table C.4. Mining Water Use and Water Use Fee of Tavan Tolgoi and Oyu
Tolgoi region, 2019 ………………………………………………………………….……..59
Table D.2. Full list of appraised solutions and their financial cost-effectiveness …………….….. 61
FIGURES
Figure 2.1. Location of Tavan Tolgoi and Oyu Tolgoi …………………………………………….... 5
Figure 2.2. Mining licence areas at the Tavan Tolgoi coal deposit …………………………….…...6
Figure 3.1. Future water demand and existing water availability …………………………………. 15
Figure 4.1. Location of selected potential groundwater reserves for water supply in the Tavan
Tolgoi and Oyu Tolgoi region ……………………………………………………………. 21
Figure 4.2. Distance of selected potential groundwater reserves from Tavan Tolgoi ………..…. 21
Figure 4.3. Surface water transfer to a remote area – Gobi water supply …………………….…. 22
Figure 5.1. Sets of criteria for technological solutions, groundwater deposits and surface water
Hydro-Economic Analysis of the water-supply demand gap reduction in the South Gobi mining and heavy industry
region, Mongolia
-----------------------------------------------------------------------------------------------------------------------------------------
x
transfers …………………………………………………………………………………… 24
Figure A.2. Brief introduction of the copper smelter project ……………………………………….. 48
Figure B.1. Total water use in Tavan Tolgoi and Oyu Tolgoi impact zone, 2019 ……………….. 55
ACRONYMS
CAPEX Capital expenditure
EAC Equivalent Annual Cost
EIA Environmental Impact Assessment
ETT Erdenes Tavan Tolgoi
FS Feasibility Study
GDP Gross Domestic Product
GoM Government of Mongolia
JORC Joint Ore Resources Commission JSC Joint Stock Company
km Kilometer
LLC Limiter Liability Company
MET Ministry of Environment and Tourism
MMC Mongolian Mining Cooperation
MMHI Ministry of Mining and Heavy Industry
MRPAM Mineral Resources and Petroleum Agency of Mongolia
MSP` Multi-Stakeholder Platform
OPEX Operational Expenditure
OT Oyu Tolgoi
RBA River Basin Authority
SOE State-Owned Enterprise
TT Tavan Tolgoi
USD United States Dollar
WWTP Wastewater Treatment Plant
ZLD Zero Liquid Discharge
WEIGHTS AND MEASURES
l Liter
l/s liter/second
m Meter
Mil.m3/year Million cubic meter/year
MW Megawatt
TCM Ton Cubic Meter
Thou. m3/year Thousand m3/year
Mil. m3/year Million cubic meter /year
Hydro-Economic Analysis of the water-supply demand gap reduction in the South Gobi mining and heavy industry
region, Mongolia
-----------------------------------------------------------------------------------------------------------------------------------------
1. BACKGROUND
The Mongolian economy is growing rapidly and is fuelled largely by the mining sector. Mongolia has world class copper and coal deposits and excellent exploration potential for metals. In 2019 the mining industry accounted for 24% of GDP, 26% of the state budget and 89% of export value. Export revenues by commodity are 40%, 24% and 5.5% for coal, copper and gold respectively. Large fluctuations in the prices of these commodities have been observed over the last 10 years impacting on existing mining projects and investment. Technological strategies that can add value to these commodities are key to achieving higher and more stable earnings, such as power plants, coal washing and copper processing plants.
Mongolia’s Southern Gobi region is endowed with copper, gold, and coal and includes the country’s largest coal reserve found at Tavan Tolgoi, and the world’s largest known copper and gold deposit at Oyu Tolgoi. The growth of mining at these reserves over the last decade and at Shivee Ovoo, where Mongolia’s second largest coal reserve is located, has triggered population migration and initiated the construction of largescale heavy industry. The Southern Gobi is set to experience additional exploitation of known deposits, expansion of mineral exploration and related heavy industry promoting continued economic growth. This and wider commercial and agricultural development around the mines will all contribute to increased water demand.
Water is a key requirement for mining operations and for processes in heavy industry and as such a secure, long term and sustainable water supply is therefore a fundamental enabler to allow future economic growth.
Despite the large renewable water resources of Mongolia, its availability is unevenly and thinly distributed across the country’s three continental and oceanic basins presenting the challenge of matching this supply to the areas of demand. Over-exploitation of groundwater and surface water resources and inadequate water supply and sanitation services are major issues faced by Mongolia, associated with rapid urbanization and increased mining activity, exacerbated by climate change. Groundwater is the main source of water in the Southern Gobi region, with almost all in deep non-renewable ‘fossil’ aquifers, with the limited rainfall in the region providing recharge to upper streambed and shallow aquifers.
1.1. 2030 Water Resources Group Mongolian Partnership
The 2030 WRG have been working in partnership with the Mongolian government since 2013. Since then, two hydro-economic analysis (HEA) have been completed, the latest of which was undertaken in 2016, and which included a deep dive analysis in the Southern Gobi to quantify the scale and urgency of the water challenge in the Shivee Ovoo and Tavan Tolgoi coal mining areas. For each region, water demand was estimated for three growth scenarios and compared against water supply for 2030 and 2040. In the Tavan Tolgoi region, the analysis showed that if the implementation of all planned projects was left unaddressed, it would result in a water supply-demand gap of 60% (18.85 Mm3/year) in the high growth demand scenario and 33% in the medium growth scenario. Potential supply augmentation and water demand reduction measures were identified and prioritised to close the supply-demand gap and formed a set of concrete recommendations for action.
Mongolia’s recently published Vision 2050 sets out a long-term development policy with related objectives. The Vision recognises the continued importance and growth of the mining sector to the Mongolian economy. It also highlights that mining growth is expected to accelerate in the Southern Gobi but recognises the availability of a sustainable water supply as a key limiting factor. Aligned to the Vision 2050, the Ministry of Mining and Heavy Industry is looking to develop a Mining and Heavy Industry Development Plan extending to 2050 to achieve full productive capacity but whilst maintaining sustainable use of water resources.
Hydro-Economic Analysis of the water-supply demand gap reduction in the South Gobi mining and heavy industry
region, Mongolia
-----------------------------------------------------------------------------------------------------------------------------------------
2
Mongolia’s “Vision 2050”
Mongolia’s “Vision 2050” long-term development policy document was approved by the Parliament Resolution No. 52 on 13th May 2020. It highlights the objective to “develop responsible mining, increase the levels of processing, develop large mining deposits, and develop value-added heavy industry”. Examples of schemes to meet this objective quoted in the Vision 2050 include a copper concentrate processing plant, coal washing plants, Tavan Tolgoi coal deposit and power plant, Oyu Tolgoi underground mine, and Kharmagtai deposit.
Sustainable Development Concept 2030
Mongolia's “Sustainable Development Concept 2030” also sets out the objectives of “capturing the full production capacity of major mining projects, initiating new construction of large projects, increasing the competitiveness of transparent and accountable mining, and implementing reliable water supply projects”.
National Heavy Industry Development Program
According to the Resolution No. 214 of the Government of Mongolia the “National Heavy Industry Development Program” and its implementation plan include the construction of a power plant based on the Tavan Tolgoi deposit to meet the energy needs of mining and heavy industry projects in the Southern Gobi region. It is planned to establish an industrial and technology park taking advantage of the Tavan Tolgoi coal deposit, and to build a copper concentrate processing plant based close to the Oyu Tolgoi deposit to enable Mongolia to become a copper exporter”.
1.2. Objectives
In order to assist the Ministry of Mining and Heavy Industry develop this plan, the 2030 WRG commissioned a rapid update to the 2016 hydro-economic assessment. The update specifically aimed to: understand the current and future growth in water demand to 2050 in the Tavan Tolgoi and Oyu Tolgoi regions, with a focus on the mining and heavy industry sector; compare the current water supply providing an understanding of any future supply-demand gap; identify potential water demand reduction and supply augmentation interventions; prioritise these interventions to close the supply-demand gap; and develop recommendations and concrete actions.
The key sources of information used for this assignment were national policies, programmes and planning documents approved by the Parliament and the Government of Mongolia, supplemented by information obtained from stakeholder groups.
1.3. Approach
A multi-stage approach was followed to structure the analysis to deliver the objectives of this study. Section 1 provides background information and a brief introduction to the study. Section 2 focuses on the identification of existing and planned mining and related heavy industry projects within the Tavan Tolgoi and Oyu Tolgoi regions, taking into account discussions with stakeholders including government officials and mining operators and a review of government reports, policies and plans and other literature. This sets out the current and future context of industry in both regions from which to assess future water needs.
In Section 3, an assessment of the current water use in the regions and existing water availability is made. Existing water availability is estimated based on current abstractions from approved government groundwater reserves in production and from mine dewatering and recycled water. An assessment of the future water demand in the regions across the time horizons of 2030, 2040 and 2050 is made taking into account three scenarios of low, medium and high growth. Whilst the mining and related heavy industry sectors provide the focus of the study, water demand for domestic, livestock, irrigated agriculture, social service sector and industry is also considered. Comparison of the future water demand and current water availability across the low, medium and high growth scenarios provides an understanding of the water supply-demand gap, highlights the challenge to be faced and provides the setting for the mitigation option identification and prioritisation.
Hydro-Economic Analysis of the water-supply demand gap reduction in the South Gobi mining and heavy industry
region, Mongolia
-----------------------------------------------------------------------------------------------------------------------------------------
3
Section 4 identifies potential water demand reduction and supply augmentation options that could be implemented to help close the water supply and demand gap. Demand side options are tailored to the specifics of mining and heavy industry, taking into account our understanding of the existing and planned process technologies. Supply side options include potential groundwater deposits, water reuse and surface water transfer schemes that are currently being considered.
Section 5 highlights the multi-criteria assessment framework that was developed through stakeholder consultation and used to prioritise the list of potential supply augmentation and demand reduction options that will close the water supply gap across 2030, 2040, 2050 for the low, medium and high growth scenarios.
A set of concluding recommendations and actions are highlighted in the final stage in Section 6, setting out what steps are required to close the supply and demand gap and how the challenges will be overcome.
Hydro-Economic Analysis of the water-supply demand gap reduction in the South Gobi mining and heavy industry
region, Mongolia
-----------------------------------------------------------------------------------------------------------------------------------------
4
2. CURRENT AND FUTURE DEVELOPMENT OF MINING AND HEAVY INDUSTRY IN THE STUDY REGIONS
2.1. Introduction to the study region
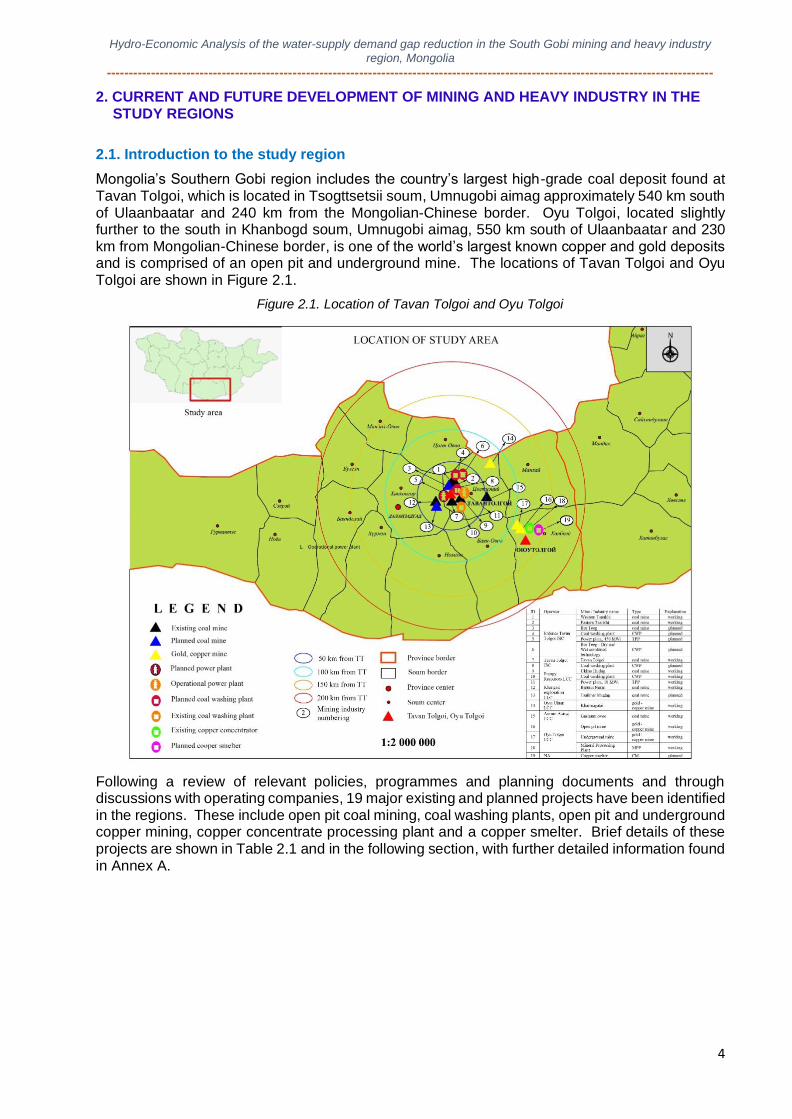
Mongolia’s Southern Gobi region includes the country’s largest high-grade coal deposit found at Tavan Tolgoi, which is located in Tsogttsetsii soum, Umnugobi aimag approximately 540 km south of Ulaanbaatar and 240 km from the Mongolian-Chinese border. Oyu Tolgoi, located slightly further to the south in Khanbogd soum, Umnugobi aimag, 550 km south of Ulaanbaatar and 230 km from Mongolian-Chinese border, is one of the world’s largest known copper and gold deposits and is comprised of an open pit and underground mine. The locations of Tavan Tolgoi and Oyu Tolgoi are shown in Figure 2.1.
Figure 2.1. Location of Tavan Tolgoi and Oyu Tolgoi
Following a review of relevant policies, programmes and planning documents and through discussions with operating companies, 19 major existing and planned projects have been identified in the regions. These include open pit coal mining, coal washing plants, open pit and underground copper mining, copper concentrate processing plant and a copper smelter. Brief details of these projects are shown in Table 2.1 and in the following section, with further detailed information found in Annex A.
Hydro-Economic Analysis of the water-supply demand gap reduction in the South Gobi mining and heavy industry
region, Mongolia
-----------------------------------------------------------------------------------------------------------------------------------------
5
Table 2.1. List of projects included in the assessment
ID Operator Project type/details Status Data source
1
Erdenes Tavan Tolgoi JSC
Coal mine - West Tsankhi Existing Company
2 Coal mine - East Tsankhi Existing Company
3 Coal mine - Borteeg Planned Feasibility study /MRPAM1
4 Coal washing plant Planned Company
5 Power plant - Tavan Tolgoi 450 MW Planned Feasibility study
6 Coal washing plant (Bor Teeg) - dry and wet combined technology
Planned Feasibility study
7 Tavan Tolgoi JSC
Coal mine - Tavan Tolgoi Existing Company /MRPAM
8 Coal washing plant Planned Feasibility study /MRPAM
9 Energy Resources LLC
Coal mine - Ukhaa Khudag Existing Feasibility study /MRPAM
10 Coal washing plant Existing Feasibility study /MRPAM
11 Power Plant - Ukhaa Khudag 18 MW Existing Feasibility study /MRPAM
12 Khangad Exploration LLC
Coal mine - Baruun Naran Existing Feasibility study
13 Coal mine - Tsaikhar Khudag Existing
14 Oyut Ulaan LLC Copper/gold mine - Kharmagtai Planned MRPAM
15 Aurum Aurug LLC Coal mine - Gashuun ovoo Existing Feasibility study /MRPAM
16
Oyu Tolgoi LLC
Copper mine - open pit Existing MRPAM
17 Copper mine - underground Planned MRPAM
18 Mineral processing plant Existing MRPAM
19 NA Copper smelter Planned Prefeasibility study /MMHI
2.2. Mining
2.2.1. Mining at Tavan Tolgoi
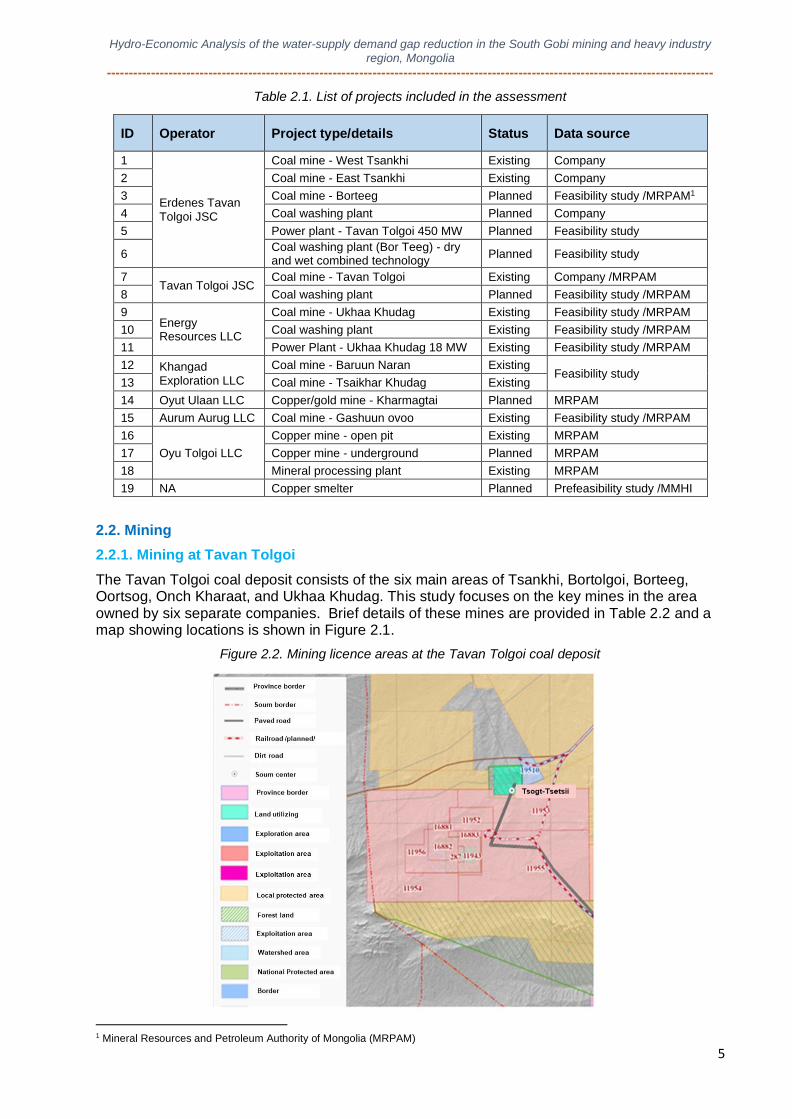
The Tavan Tolgoi coal deposit consists of the six main areas of Tsankhi, Bortolgoi, Borteeg, Oortsog, Onch Kharaat, and Ukhaa Khudag. This study focuses on the key mines in the area owned by six separate companies. Brief details of these mines are provided in Table 2.2 and a map showing locations is shown in Figure 2.1.
Figure 2.2. Mining licence areas at the Tavan Tolgoi coal deposit
1 Mineral Resources and Petroleum Authority of Mongolia (MRPAM)
Hydro-Economic Analysis of the water-supply demand gap reduction in the South Gobi mining and heavy industry
region, Mongolia
-----------------------------------------------------------------------------------------------------------------------------------------
6
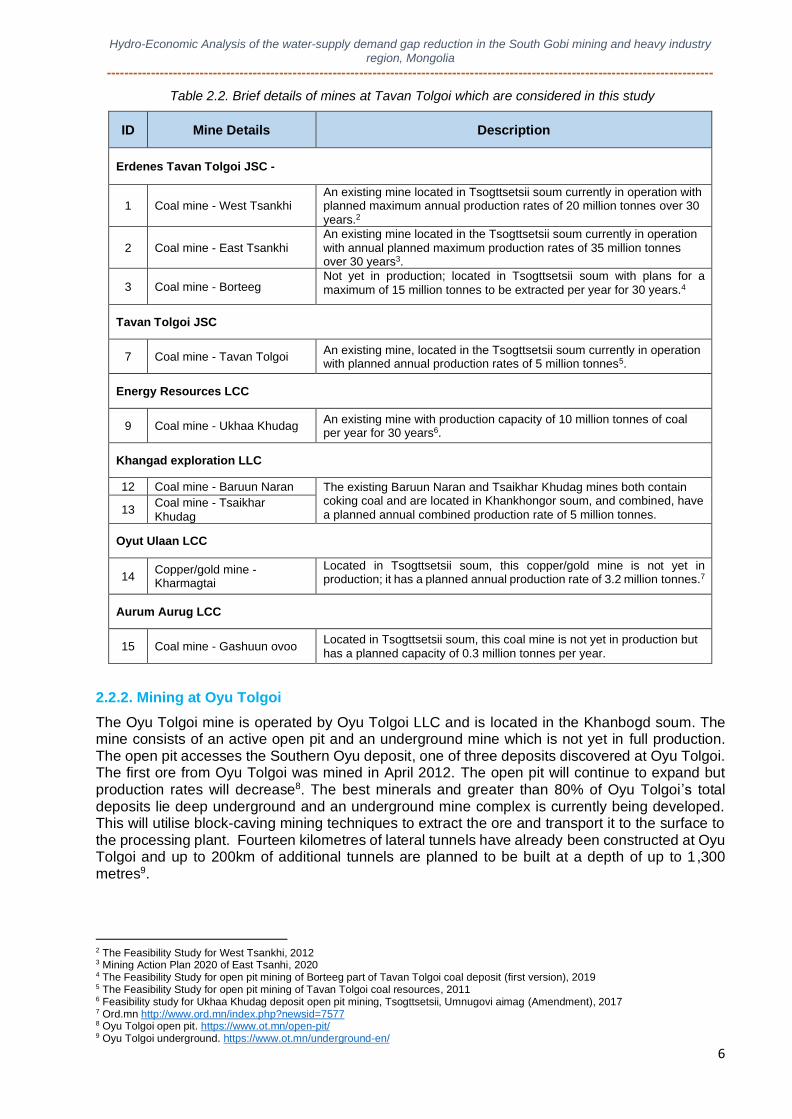
Table 2.2. Brief details of mines at Tavan Tolgoi which are considered in this study
ID Mine Details Description
Erdenes Tavan Tolgoi JSC -
1 Coal mine - West Tsankhi An existing mine located in Tsogttsetsii soum currently in operation with planned maximum annual production rates of 20 million tonnes over 30 years.2
2 Coal mine - East Tsankhi An existing mine located in the Tsogttsetsii soum currently in operation with annual planned maximum production rates of 35 million tonnes over 30 years3.
3 Coal mine - Borteeg Not yet in production; located in Tsogttsetsii soum with plans for a maximum of 15 million tonnes to be extracted per year for 30 years.4
Tavan Tolgoi JSC
7 Coal mine - Tavan Tolgoi An existing mine, located in the Tsogttsetsii soum currently in operation with planned annual production rates of 5 million tonnes5.
Energy Resources LCC
9 Coal mine - Ukhaa Khudag An existing mine with production capacity of 10 million tonnes of coal per year for 30 years6.
Khangad exploration LLC
12 Coal mine - Baruun Naran The existing Baruun Naran and Tsaikhar Khudag mines both contain coking coal and are located in Khankhongor soum, and combined, have a planned annual combined production rate of 5 million tonnes. 13
Coal mine - Tsaikhar Khudag
Oyut Ulaan LCC
14 Copper/gold mine - Kharmagtai
Located in Tsogttsetsii soum, this copper/gold mine is not yet in production; it has a planned annual production rate of 3.2 million tonnes.7
Aurum Aurug LCC
15 Coal mine - Gashuun ovoo Located in Tsogttsetsii soum, this coal mine is not yet in production but has a planned capacity of 0.3 million tonnes per year.
2.2.2. Mining at Oyu Tolgoi
The Oyu Tolgoi mine is operated by Oyu Tolgoi LLC and is located in the Khanbogd soum. The mine consists of an active open pit and an underground mine which is not yet in full production. The open pit accesses the Southern Oyu deposit, one of three deposits discovered at Oyu Tolgoi. The first ore from Oyu Tolgoi was mined in April 2012. The open pit will continue to expand but production rates will decrease8. The best minerals and greater than 80% of Oyu Tolgoi’s total deposits lie deep underground and an underground mine complex is currently being developed. This will utilise block-caving mining techniques to extract the ore and transport it to the surface to the processing plant. Fourteen kilometres of lateral tunnels have already been constructed at Oyu Tolgoi and up to 200km of additional tunnels are planned to be built at a depth of up to 1,300 metres9.
2 The Feasibility Study for West Tsankhi, 2012 3 Mining Action Plan 2020 of East Tsanhi, 2020 4 The Feasibility Study for open pit mining of Borteeg part of Tavan Tolgoi coal deposit (first version), 2019 5 The Feasibility Study for open pit mining of Tavan Tolgoi coal resources, 2011 6 Feasibility study for Ukhaa Khudag deposit open pit mining, Tsogttsetsii, Umnugovi aimag (Amendment), 2017 7 Ord.mn http://www.ord.mn/index.php?newsid=7577 8 Oyu Tolgoi open pit. https://www.ot.mn/open-pit/ 9 Oyu Tolgoi underground. https://www.ot.mn/underground-en/
Hydro-Economic Analysis of the water-supply demand gap reduction in the South Gobi mining and heavy industry
region, Mongolia
-----------------------------------------------------------------------------------------------------------------------------------------
7
2.3. Mineral Processing Plants in the study regions
2.3.1. Coal Washing Plants at Tavan Tolgoi
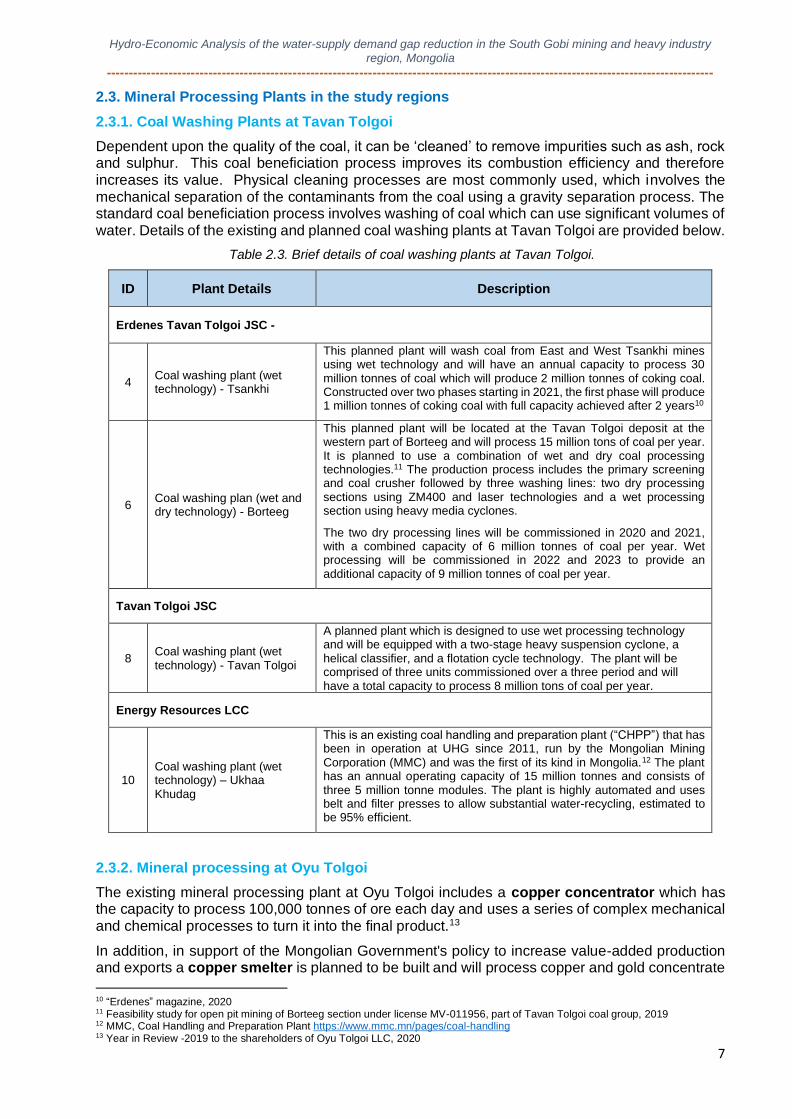
Dependent upon the quality of the coal, it can be ‘cleaned’ to remove impurities such as ash, rock and sulphur. This coal beneficiation process improves its combustion efficiency and therefore increases its value. Physical cleaning processes are most commonly used, which involves the mechanical separation of the contaminants from the coal using a gravity separation process. The standard coal beneficiation process involves washing of coal which can use significant volumes of water. Details of the existing and planned coal washing plants at Tavan Tolgoi are provided below.
Table 2.3. Brief details of coal washing plants at Tavan Tolgoi.
ID Plant Details Description
Erdenes Tavan Tolgoi JSC -
4 Coal washing plant (wet technology) - Tsankhi
This planned plant will wash coal from East and West Tsankhi mines using wet technology and will have an annual capacity to process 30 million tonnes of coal which will produce 2 million tonnes of coking coal. Constructed over two phases starting in 2021, the first phase will produce 1 million tonnes of coking coal with full capacity achieved after 2 years10
6 Coal washing plan (wet and dry technology) - Borteeg
This planned plant will be located at the Tavan Tolgoi deposit at the western part of Borteeg and will process 15 million tons of coal per year. It is planned to use a combination of wet and dry coal processing technologies.11 The production process includes the primary screening and coal crusher followed by three washing lines: two dry processing sections using ZM400 and laser technologies and a wet processing section using heavy media cyclones.
The two dry processing lines will be commissioned in 2020 and 2021, with a combined capacity of 6 million tonnes of coal per year. Wet processing will be commissioned in 2022 and 2023 to provide an additional capacity of 9 million tonnes of coal per year.
Tavan Tolgoi JSC
8 Coal washing plant (wet technology) - Tavan Tolgoi
A planned plant which is designed to use wet processing technology and will be equipped with a two-stage heavy suspension cyclone, a helical classifier, and a flotation cycle technology. The plant will be comprised of three units commissioned over a three period and will have a total capacity to process 8 million tons of coal per year.
Energy Resources LCC
10 Coal washing plant (wet technology) – Ukhaa Khudag
This is an existing coal handling and preparation plant (“CHPP”) that has been in operation at UHG since 2011, run by the Mongolian Mining Corporation (MMC) and was the first of its kind in Mongolia.12 The plant has an annual operating capacity of 15 million tonnes and consists of three 5 million tonne modules. The plant is highly automated and uses belt and filter presses to allow substantial water-recycling, estimated to be 95% efficient.
2.3.2. Mineral processing at Oyu Tolgoi
The existing mineral processing plant at Oyu Tolgoi includes a copper concentrator which has the capacity to process 100,000 tonnes of ore each day and uses a series of complex mechanical and chemical processes to turn it into the final product.13
In addition, in support of the Mongolian Government's policy to increase value-added production and exports a copper smelter is planned to be built and will process copper and gold concentrate
10 “Erdenes” magazine, 2020 11 Feasibility study for open pit mining of Borteeg section under license MV-011956, part of Tavan Tolgoi coal group, 2019 12 MMC, Coal Handling and Preparation Plant https://www.mmc.mn/pages/coal-handling 13 Year in Review -2019 to the shareholders of Oyu Tolgoi LLC, 2020
Hydro-Economic Analysis of the water-supply demand gap reduction in the South Gobi mining and heavy industry
region, Mongolia
-----------------------------------------------------------------------------------------------------------------------------------------
8
at the Oyu Tolgoi mine up to a capacity of 1 million tonnes of copper concentrate. It will be built through a public-private partnership including foreign and domestic investment. According to preliminary estimates, the copper smelter will cost $ 2.1 billion.14
2.4. Power Plants in the study regions
There is an existing 18 MW power plant built in 2011-2013 by Energy Resources LLC to provide energy supply to Ukhaa Khudag mine and Tsogttsetsii soum and this power plant is air cooled so has only low water requirements.15
The Mongolian government has confirmed the planned construction of a 450 MW power plant based at the Tavan Tolgoi which will provide reliable power to the large mining and heavy industry complexes in the Oyu Tolgoi and Tavan Tolgoi regions. The power plant will be built with an air-cooled condenser, circulating fluidized bed furnace and water treatment technologies, so will also have low water requirements.16 At the present moment the Mongolian government will build this
power plant with state funds.
As both these power plants will utilise dry/air cooling and other best practice technologies, no additional solutions to reduce water use were considered in this study.
14 Ministry of Mining and Heavy Industry, brief introduction of the project http://www.mmhi.gov.mn/uploads/files/ХАВСРАЛТ-Монгол.pdf 15 Feasibility study for Ukhaa Khudag deposit open pit mining, Tsogttsetsii, Umnugovi aimag (Amendment), 2017 16 Ministry of Energy. Tavan tolgoi power plant project unit. http://ttpp.mn/
Hydro-Economic Analysis of the water-supply demand gap reduction in the South Gobi mining and heavy industry
region, Mongolia
-----------------------------------------------------------------------------------------------------------------------------------------
9
3. TAVAN TOLGOI AND OYU TOLGOI: ASSESSMENT OF THE WATER SUPPLY-DEMAND GAP
3.1. Water demand assessment and scenario development
This section provides an assessment of the water demand for the current baseline in 2019 and for the years 2030, 2040 and 2050. The assessment includes three different scenarios of future water demand, based on low, medium and high growth.
3.1.1 Water demand assessment
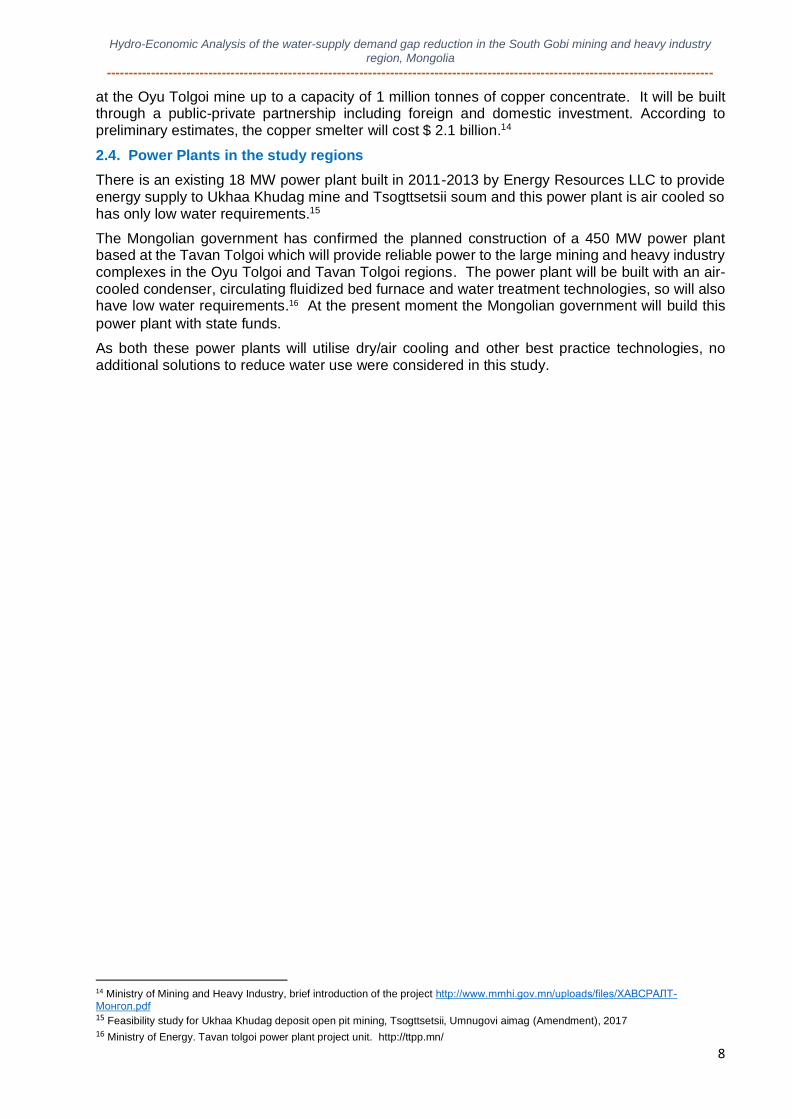
An assessment of the current and future water demand is made for the Tavan Tolgoi and Oyu Tolgoi regions across the time horizon of 2019-2050. Whilst the mining and related heavy industry sectors provide the focus of this work, water demand for domestic, livestock, irrigated agriculture, social services sector and other key industry in the regions is also estimated. Water demand is assessed based on primary data collected, secondary data and making the use of relevant water use norms taken from Ministry of Environment, Green Development and Tourism Order A301 where actual data was not available. The water demand assessment covered the study area only and estimates were calculated based on the percentage of the soum area if it was partially in the impact zone. Table 3.1 provides a summary of how water demand was assessed for each sector for the baseline year of 2019 and a detailed description can be found in Annex B.
Table 3.1 Method for water demand assessment by sector
Sector Description Sources of data
Mining
Water demand for all key existing and planned mining licences, coal washing plants and mineral processing plants. Current water use was based on actual water use reported in the most recent company water use reports. Future water use was estimated based on information on future annual production taken from feasibility reports, discussions with the companies and water usage per unit of production.
• Company annual water use reports
• Water use permits
• Feasibility reports
• River Basin Administrations
• Ministry of Mines and Heavy Industry
• Mineral Resources and Petroleum Authority.
Power plants
Water demand was assessed for the existing 8MW power plant at Ukhaa Khudag and the planned 450MW power plant at Tavan Tolgoi. Current water use for the Ukhaa Khudag power plant was taken from the annual water use report and the feasibility report provided planned water use estimates for the 450MW plant.
• Water use permits
• Feasibility report
Copper smelter
Estimated water demand for the planned copper smelter at Oyu Tolgoi is taken from the 2018 feasibility report. Future water demand was estimated base on future annual production and water usage per unit of production.
• Feasibility report
Domestic
Water demand for domestic purposes was calculated using population values for the 2019 baseline differentiated by urban and rural population and soum areas in the study area. Estimates also took account of the % of the population receiving water from the water supply network, deep wells and from rivers and spring.
• Mongolia National Statistics Office
• Growth rates from National Statistics Office and River Basin Management Plans for Galba-Oosh and Dolood Gobi
• Water norms: Annex 12, Order A301
Livestock
Water demand was calculated using actual livestock numbers for 2019 and using water norms for 5 livestock categories. Future water demand was calculated using livestock growth factors taken from Vision 2050.
• Mongolia National Statistics Office
• Growth factors from Vision 2050
• Water norms: Annex 11, Order A301
Crop irrigation
Water demand was calculated using actual cropping areas for three cropping categories for 2019 and using water norms. Future water demand was calculated from growth factors set out in the Unmugovi Aimag Regional Development Plan
• Mongolia National Statistics Office
• Growth factors Umnugovi Aimag Regional Development Progam
• Water norm: Annex 11 Order A301
Social services
Actual water usage data for schools, kindergartens, hospitals, hotels, restaurants, shopping malls, banks and financial institutions operating in the study area was selected from the 2019 year-end compilation of Umnugovi aimag. The sector's growth is estimated based on the social service objectives set out in the Umnugovi Aimag Regional Development Program.
• Mongolia National Statistics Office
• Growth factors Umnugovi Aimag Regional Development Program
• Water norms: Annex 14, Order A301
Food industry
The food industry is the main additional industry in the study area. Water demand was calculated using actual production data for 2019 and using water norms. Industry growth factors were taken from the Vision 2050 & Umnugovi Aimag Regional Development Plan
• Mongolia National Statistics Office
• Growth factors from Vision 2050 & Umnugovi Aimag Regional Development Program
• Water norms: Annex 3, Order A301
Hydro-Economic Analysis of the water-supply demand gap reduction in the South Gobi mining and heavy industry
region, Mongolia
-----------------------------------------------------------------------------------------------------------------------------------------
10
3.1.2 Development of water demand scenarios
Water demand scenarios were developed in order to provide a more differentiated analysis based on estimates of low, medium and high growth over the 2030-2050 time horizon. Growth scenarios for the domestic, livestock, crop irrigation, social services and the food industry used existing data reported in Mongolia’s Vision 2050, Umnugovi Aimag Regional Development Program and Integrated Water Resources Management Plans.
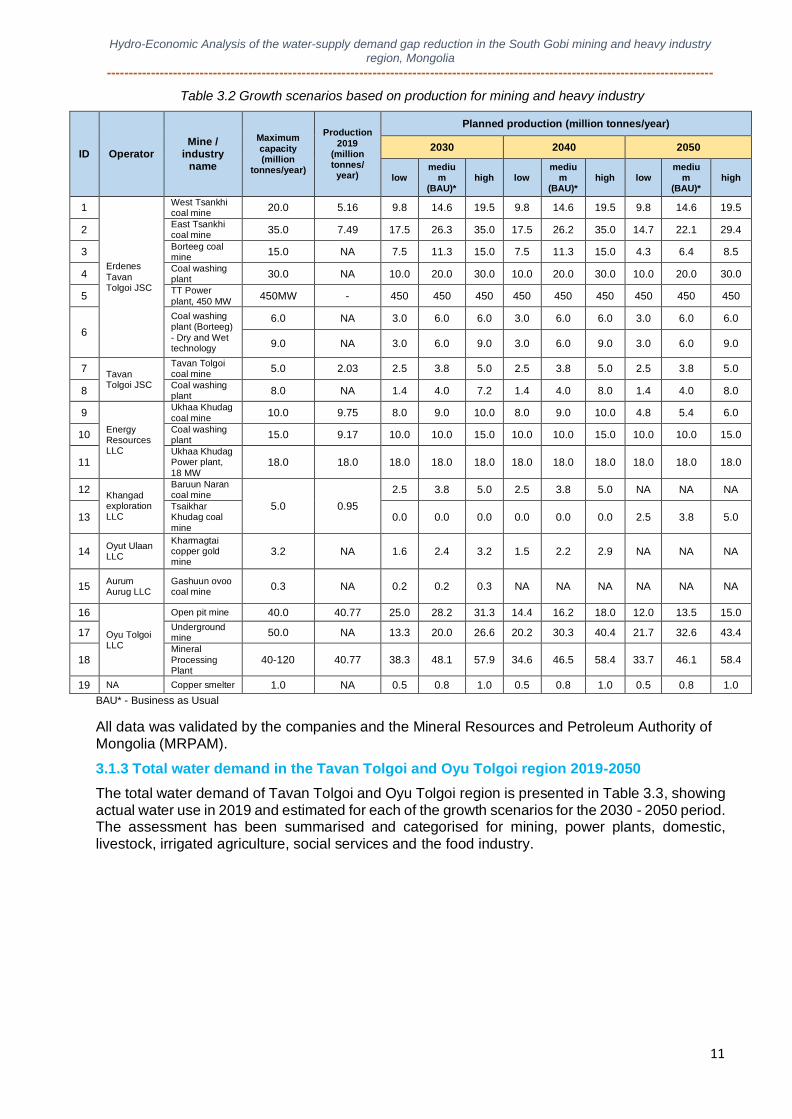
For mining and heavy industry, the project team developed scenarios based on production estimates taken from feasibility plans for each of the existing and planned projects, from discussions with stakeholders and considering economic growth estimates. In all instances the high growth scenario was based on the maximum production rate highlighted in the feasibility plans. Variations from this were as follows:
• Existing mines where current production is lower than the high growth scenario. In these instances, 50% and 75% of the maximum production rate was used for low and medium growth respectively.
• Existing mines where current production is higher than the high growth scenario. In these instances, 80% and 90% of the maximum production rate was used for low and medium growth respectively.
• For new mines. In these instances, 50% and 75% of the maximum production rate was used for low and medium growth respectively.
• For coal washing plants and the copper smelter. Factors to modify the maximum production rate were developed through expert judgement of the project team and applied to low and medium scenarios.
Table 3.2 shows the resulting forecast production for mining and heavy industry for the three growth scenarios across the 2030-2050-time horizon.
Hydro-Economic Analysis of the water-supply demand gap reduction in the South Gobi mining and heavy industry
region, Mongolia
-----------------------------------------------------------------------------------------------------------------------------------------
11
Table 3.2 Growth scenarios based on production for mining and heavy industry
ID Operator Mine /
industry name
Maximum
capacity (million
tonnes/year)
Production
2019 (million tonnes/
year)
Planned production (million tonnes/year)
2030 2040 2050
low mediu
m (BAU)*
high low mediu
m (BAU)*
high low mediu
m (BAU)*
high
1
Erdenes
Tavan Tolgoi JSC
West Tsankhi coal mine
20.0 5.16 9.8 14.6 19.5 9.8 14.6 19.5 9.8 14.6 19.5
2 East Tsankhi coal mine
35.0 7.49 17.5 26.3 35.0 17.5 26.2 35.0 14.7 22.1 29.4
3 Borteeg coal mine
15.0 NA 7.5 11.3 15.0 7.5 11.3 15.0 4.3 6.4 8.5
4 Coal washing plant
30.0 NA 10.0 20.0 30.0 10.0 20.0 30.0 10.0 20.0 30.0
5 TT Power
plant, 450 MW 450MW - 450 450 450 450 450 450 450 450 450
6
Coal washing plant (Borteeg)
- Dry and Wet technology
6.0 NA 3.0 6.0 6.0 3.0 6.0 6.0 3.0 6.0 6.0
9.0 NA 3.0 6.0 9.0 3.0 6.0 9.0 3.0 6.0 9.0
7 Tavan Tolgoi JSC
Tavan Tolgoi coal mine
5.0 2.03 2.5 3.8 5.0 2.5 3.8 5.0 2.5 3.8 5.0
8 Coal washing plant
8.0 NA 1.4 4.0 7.2 1.4 4.0 8.0 1.4 4.0 8.0
9
Energy Resources LLC
Ukhaa Khudag
coal mine 10.0 9.75 8.0 9.0 10.0 8.0 9.0 10.0 4.8 5.4 6.0
10 Coal washing plant
15.0 9.17 10.0 10.0 15.0 10.0 10.0 15.0 10.0 10.0 15.0
11 Ukhaa Khudag Power plant,
18 MW 18.0 18.0 18.0 18.0 18.0 18.0 18.0 18.0 18.0 18.0 18.0
12 Khangad exploration LLC
Baruun Naran coal mine
5.0 0.95
2.5 3.8 5.0 2.5 3.8 5.0 NA NA NA
13 Tsaikhar Khudag coal
mine 0.0 0.0 0.0 0.0 0.0 0.0 2.5 3.8 5.0
14 Oyut Ulaan LLC
Kharmagtai copper gold mine
3.2 NA 1.6 2.4 3.2 1.5 2.2 2.9 NA NA NA
15 Aurum Aurug LLC
Gashuun ovoo coal mine
0.3 NA 0.2 0.2 0.3 NA NA NA NA NA NA
16
Oyu Tolgoi LLC
Open pit mine 40.0 40.77 25.0 28.2 31.3 14.4 16.2 18.0 12.0 13.5 15.0
17 Underground mine
50.0 NA 13.3 20.0 26.6 20.2 30.3 40.4 21.7 32.6 43.4
18 Mineral
Processing Plant
40-120 40.77 38.3 48.1 57.9 34.6 46.5 58.4 33.7 46.1 58.4
19 NA Copper smelter 1.0 NA 0.5 0.8 1.0 0.5 0.8 1.0 0.5 0.8 1.0
BAU* - Business as Usual
All data was validated by the companies and the Mineral Resources and Petroleum Authority of Mongolia (MRPAM).
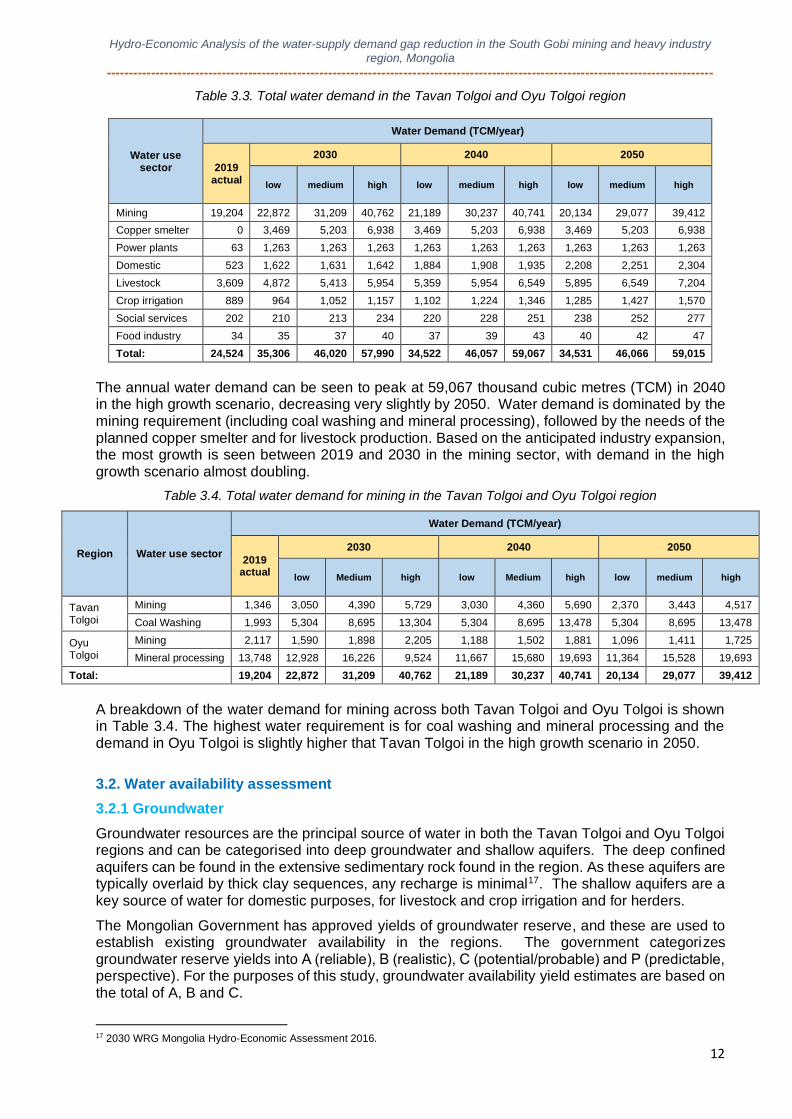
3.1.3 Total water demand in the Tavan Tolgoi and Oyu Tolgoi region 2019-2050
The total water demand of Tavan Tolgoi and Oyu Tolgoi region is presented in Table 3.3, showing actual water use in 2019 and estimated for each of the growth scenarios for the 2030 - 2050 period. The assessment has been summarised and categorised for mining, power plants, domestic, livestock, irrigated agriculture, social services and the food industry.
Hydro-Economic Analysis of the water-supply demand gap reduction in the South Gobi mining and heavy industry
region, Mongolia
-----------------------------------------------------------------------------------------------------------------------------------------
12
Table 3.3. Total water demand in the Tavan Tolgoi and Oyu Tolgoi region
Water use sector
Water Demand (TCM/year)
2019 actual
2030 2040 2050
low medium high low medium high low medium high
Mining 19,204 22,872 31,209 40,762 21,189 30,237 40,741 20,134 29,077 39,412
Copper smelter 0 3,469 5,203 6,938 3,469 5,203 6,938 3,469 5,203 6,938
Power plants 63 1,263 1,263 1,263 1,263 1,263 1,263 1,263 1,263 1,263
Domestic 523 1,622 1,631 1,642 1,884 1,908 1,935 2,208 2,251 2,304
Livestock 3,609 4,872 5,413 5,954 5,359 5,954 6,549 5,895 6,549 7,204
Crop irrigation 889 964 1,052 1,157 1,102 1,224 1,346 1,285 1,427 1,570
Social services 202 210 213 234 220 228 251 238 252 277
Food industry 34 35 37 40 37 39 43 40 42 47
Total: 24,524 35,306 46,020 57,990 34,522 46,057 59,067 34,531 46,066 59,015
The annual water demand can be seen to peak at 59,067 thousand cubic metres (TCM) in 2040 in the high growth scenario, decreasing very slightly by 2050. Water demand is dominated by the mining requirement (including coal washing and mineral processing), followed by the needs of the planned copper smelter and for livestock production. Based on the anticipated industry expansion, the most growth is seen between 2019 and 2030 in the mining sector, with demand in the high growth scenario almost doubling.
Table 3.4. Total water demand for mining in the Tavan Tolgoi and Oyu Tolgoi region
Region Water use sector
Water Demand (TCM/year)
2019 actual
2030 2040 2050
low Medium high low Medium high low medium high
Tavan Tolgoi
Mining 1,346 3,050 4,390 5,729 3,030 4,360 5,690 2,370 3,443 4,517
Coal Washing 1,993 5,304 8,695 13,304 5,304 8,695 13,478 5,304 8,695 13,478
Oyu Tolgoi
Mining 2,117 1,590 1,898 2,205 1,188 1,502 1,881 1,096 1,411 1,725
Mineral processing 13,748 12,928 16,226 9,524 11,667 15,680 19,693 11,364 15,528 19,693
Total: 19,204 22,872 31,209 40,762 21,189 30,237 40,741 20,134 29,077 39,412
A breakdown of the water demand for mining across both Tavan Tolgoi and Oyu Tolgoi is shown in Table 3.4. The highest water requirement is for coal washing and mineral processing and the demand in Oyu Tolgoi is slightly higher that Tavan Tolgoi in the high growth scenario in 2050.
3.2. Water availability assessment
3.2.1 Groundwater
Groundwater resources are the principal source of water in both the Tavan Tolgoi and Oyu Tolgoi regions and can be categorised into deep groundwater and shallow aquifers. The deep confined aquifers can be found in the extensive sedimentary rock found in the region. As these aquifers are typically overlaid by thick clay sequences, any recharge is minimal17. The shallow aquifers are a key source of water for domestic purposes, for livestock and crop irrigation and for herders.
The Mongolian Government has approved yields of groundwater reserve, and these are used to establish existing groundwater availability in the regions. The government categorizes groundwater reserve yields into А (reliable), В (realistic), C (potential/probable) and Р (predictable, perspective). For the purposes of this study, groundwater availability yield estimates are based on the total of A, B and C.
17 2030 WRG Mongolia Hydro-Economic Assessment 2016.
Hydro-Economic Analysis of the water-supply demand gap reduction in the South Gobi mining and heavy industry
region, Mongolia
-----------------------------------------------------------------------------------------------------------------------------------------
13
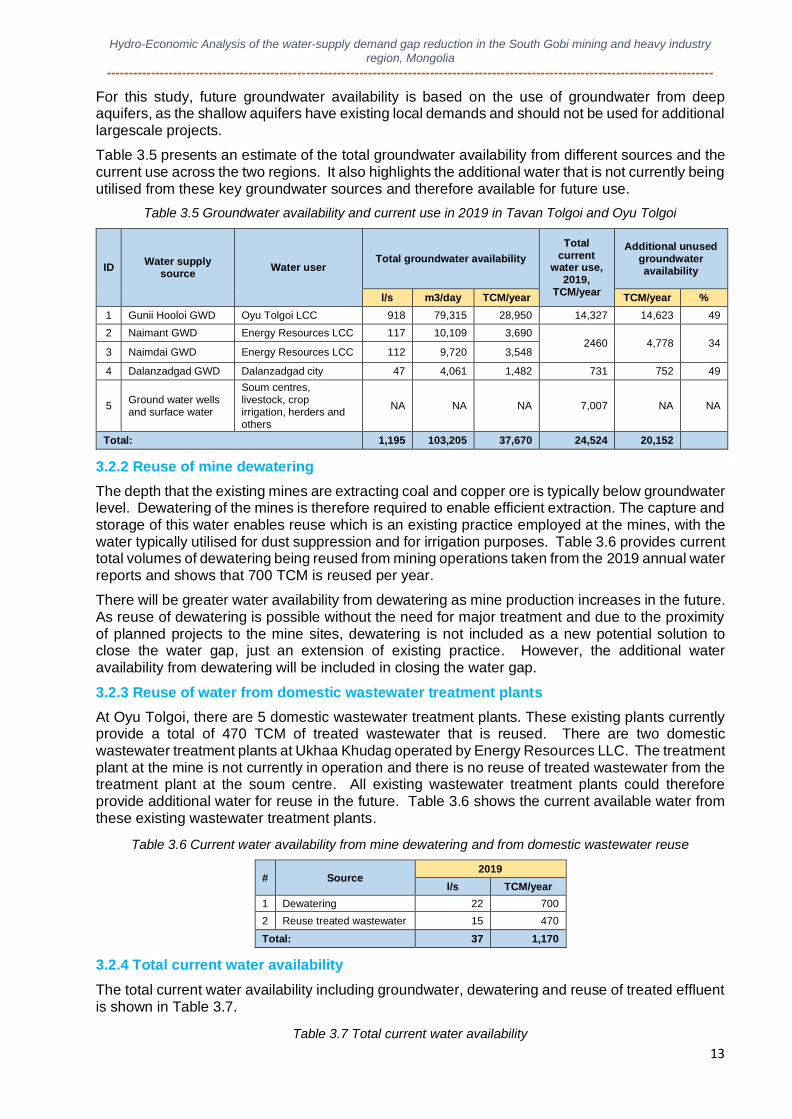
For this study, future groundwater availability is based on the use of groundwater from deep aquifers, as the shallow aquifers have existing local demands and should not be used for additional largescale projects.
Table 3.5 presents an estimate of the total groundwater availability from different sources and the current use across the two regions. It also highlights the additional water that is not currently being utilised from these key groundwater sources and therefore available for future use.
Table 3.5 Groundwater availability and current use in 2019 in Tavan Tolgoi and Oyu Tolgoi
ID Water supply
source Water user
Total groundwater availability
Total current
water use, 2019,
TCM/year
Additional unused groundwater availability
l/s m3/day TCM/year TCM/year %
1 Gunii Hooloi GWD Oyu Tolgoi LCC 918 79,315 28,950 14,327 14,623 49
2 Naimant GWD Energy Resources LCC 117 10,109 3,690 2460 4,778 34
3 Naimdai GWD Energy Resources LCC 112 9,720 3,548
4 Dalanzadgad GWD Dalanzadgad city 47 4,061 1,482 731 752 49
5 Ground water wells and surface water
Soum centres, livestock, crop irrigation, herders and others
NA NA NA 7,007 NA NA
Total: 1,195 103,205 37,670 24,524 20,152
3.2.2 Reuse of mine dewatering
The depth that the existing mines are extracting coal and copper ore is typically below groundwater level. Dewatering of the mines is therefore required to enable efficient extraction. The capture and storage of this water enables reuse which is an existing practice employed at the mines, with the water typically utilised for dust suppression and for irrigation purposes. Table 3.6 provides current total volumes of dewatering being reused from mining operations taken from the 2019 annual water reports and shows that 700 TCM is reused per year.
There will be greater water availability from dewatering as mine production increases in the future. As reuse of dewatering is possible without the need for major treatment and due to the proximity of planned projects to the mine sites, dewatering is not included as a new potential solution to close the water gap, just an extension of existing practice. However, the additional water availability from dewatering will be included in closing the water gap.
3.2.3 Reuse of water from domestic wastewater treatment plants
At Oyu Tolgoi, there are 5 domestic wastewater treatment plants. These existing plants currently provide a total of 470 TCM of treated wastewater that is reused. There are two domestic wastewater treatment plants at Ukhaa Khudag operated by Energy Resources LLC. The treatment plant at the mine is not currently in operation and there is no reuse of treated wastewater from the treatment plant at the soum centre. All existing wastewater treatment plants could therefore provide additional water for reuse in the future. Table 3.6 shows the current available water from these existing wastewater treatment plants.
Table 3.6 Current water availability from mine dewatering and from domestic wastewater reuse
# Source 2019
l/s TCM/year
1 Dewatering 22 700
2 Reuse treated wastewater 15 470
Total: 37 1,170
3.2.4 Total current water availability
The total current water availability including groundwater, dewatering and reuse of treated effluent is shown in Table 3.7.
Table 3.7 Total current water availability
Hydro-Economic Analysis of the water-supply demand gap reduction in the South Gobi mining and heavy industry
region, Mongolia
-----------------------------------------------------------------------------------------------------------------------------------------
14
# Source 2019
l/s TCM/year
1 Groundwater 1,195 37,670
2 Dewatering 22 700
3 Reuse treated wastewater 15 470
Total: 1,232 38,840
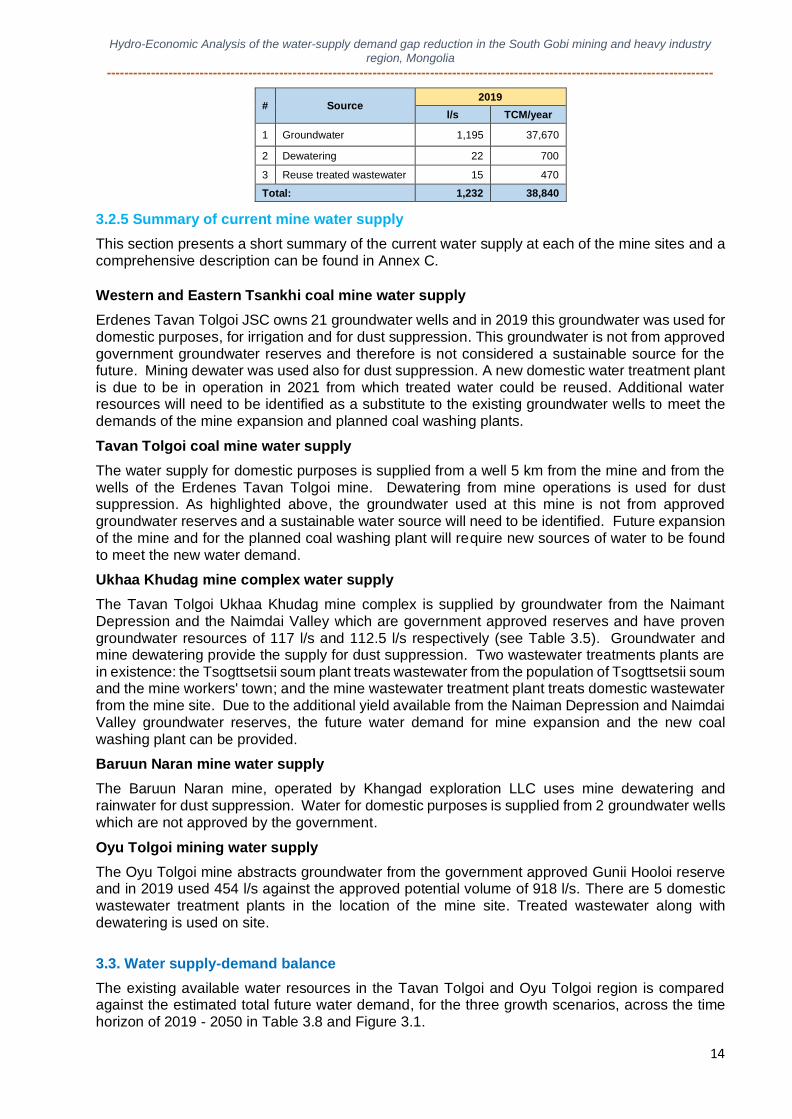
3.2.5 Summary of current mine water supply
This section presents a short summary of the current water supply at each of the mine sites and a comprehensive description can be found in Annex C. Western and Eastern Tsankhi coal mine water supply
Erdenes Tavan Tolgoi JSC owns 21 groundwater wells and in 2019 this groundwater was used for domestic purposes, for irrigation and for dust suppression. This groundwater is not from approved government groundwater reserves and therefore is not considered a sustainable source for the future. Mining dewater was used also for dust suppression. A new domestic water treatment plant is due to be in operation in 2021 from which treated water could be reused. Additional water resources will need to be identified as a substitute to the existing groundwater wells to meet the demands of the mine expansion and planned coal washing plants. Tavan Tolgoi coal mine water supply
The water supply for domestic purposes is supplied from a well 5 km from the mine and from the wells of the Erdenes Tavan Tolgoi mine. Dewatering from mine operations is used for dust suppression. As highlighted above, the groundwater used at this mine is not from approved groundwater reserves and a sustainable water source will need to be identified. Future expansion of the mine and for the planned coal washing plant will require new sources of water to be found to meet the new water demand.
Ukhaa Khudag mine complex water supply
The Tavan Tolgoi Ukhaa Khudag mine complex is supplied by groundwater from the Naimant Depression and the Naimdai Valley which are government approved reserves and have proven groundwater resources of 117 l/s and 112.5 l/s respectively (see Table 3.5). Groundwater and mine dewatering provide the supply for dust suppression. Two wastewater treatments plants are in existence: the Tsogttsetsii soum plant treats wastewater from the population of Tsogttsetsii soum and the mine workers' town; and the mine wastewater treatment plant treats domestic wastewater from the mine site. Due to the additional yield available from the Naiman Depression and Naimdai Valley groundwater reserves, the future water demand for mine expansion and the new coal washing plant can be provided.
Baruun Naran mine water supply
The Baruun Naran mine, operated by Khangad exploration LLC uses mine dewatering and rainwater for dust suppression. Water for domestic purposes is supplied from 2 groundwater wells which are not approved by the government.
Oyu Tolgoi mining water supply
The Oyu Tolgoi mine abstracts groundwater from the government approved Gunii Hooloi reserve and in 2019 used 454 l/s against the approved potential volume of 918 l/s. There are 5 domestic wastewater treatment plants in the location of the mine site. Treated wastewater along with dewatering is used on site.
3.3. Water supply-demand balance
The existing available water resources in the Tavan Tolgoi and Oyu Tolgoi region is compared against the estimated total future water demand, for the three growth scenarios, across the time horizon of 2019 - 2050 in Table 3.8 and Figure 3.1.
Hydro-Economic Analysis of the water-supply demand gap reduction in the South Gobi mining and heavy industry
region, Mongolia
-----------------------------------------------------------------------------------------------------------------------------------------
15
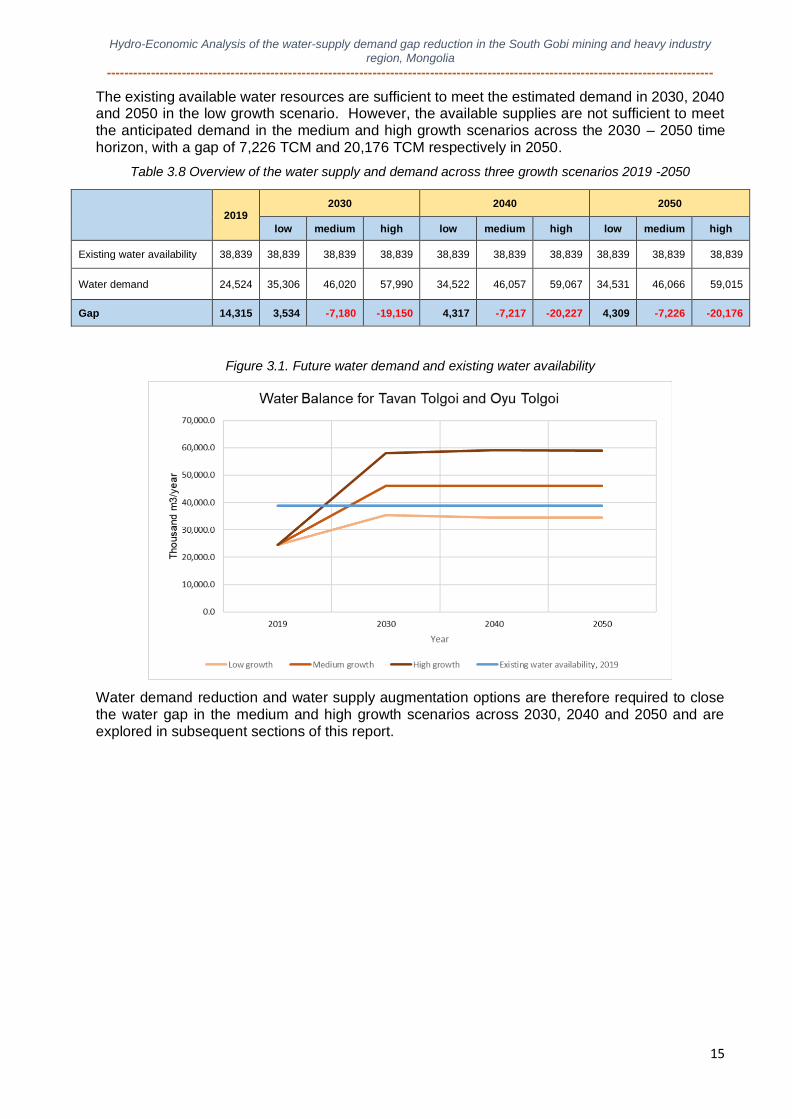
The existing available water resources are sufficient to meet the estimated demand in 2030, 2040 and 2050 in the low growth scenario. However, the available supplies are not sufficient to meet the anticipated demand in the medium and high growth scenarios across the 2030 – 2050 time horizon, with a gap of 7,226 TCM and 20,176 TCM respectively in 2050.
Table 3.8 Overview of the water supply and demand across three growth scenarios 2019 -2050
2019 2030 2040 2050
low medium high low medium high low medium high
Existing water availability 38,839 38,839 38,839 38,839 38,839 38,839 38,839 38,839 38,839 38,839
Water demand 24,524 35,306 46,020 57,990 34,522 46,057 59,067 34,531 46,066 59,015
Gap 14,315 3,534 -7,180 -19,150 4,317 -7,217 -20,227 4,309 -7,226 -20,176
Figure 3.1. Future water demand and existing water availability
Water demand reduction and water supply augmentation options are therefore required to close the water gap in the medium and high growth scenarios across 2030, 2040 and 2050 and are explored in subsequent sections of this report.
Hydro-Economic Analysis of the water-supply demand gap reduction in the South Gobi mining and heavy industry
region, Mongolia
-----------------------------------------------------------------------------------------------------------------------------------------
16
4. IDENTIFICATION OF DEMAND AND SUPPLY SIDE OPTIONS TO CLOSE THE WATER GAP
As highlighted in Section 3, the required water demand for 2030, 2040, and 2050 over three growth scenarios was estimated for the expansion of existing projects and new planned projects. This assessment used information on maximum production rates for each of these projects obtained from feasibility reports. With the exception of Ukhaa Khudag and Oyu Tolgoi mine complexes, the feasibility studies did not provide detailed information as to where the required water could be sourced.
This section identifies and describes potential options that could be applied to existing and planned mining and heavy industry projects to reduce the water demand within the study area. It also highlights potential solutions to increase water supply into the region.
4.1. Water demand reduction options
4.1.1. Use of dry-wet combined technology in coal washing plants
The water demand assessment shows that the four coal washing plants due to be in production at Tavan Tolgoi have the highest water requirement accounting for 75% of total mining water demand in 2050. The opportunity to introduce water-saving technologies at these plants provide a considerable opportunity. Due to the high water consumption in ‘wet’ gravity-flotation washing commonly used in coal washing plants, considerable research in the use of dry coal washing technologies have been conducted in China, Russia, Germany, Korea, Japan and the United States in recent years.
The type of dry coal beneficiation technology required depends on the physical properties of the coal, such as density, particle size, rock and ash content, magnetic and electrical conductivity, and coefficient of friction. Zhao et al.18 provides a review of dry coal beneficiating mechanisms that have been reported in the recent literature which can be classified into the following five categories: air dense medium fluidised bed separation with/without external force field; fluidised bed separation based on different settling velocities; electrostatic separation; compound dry separation and magnetic separation. Optical separation could also be included.
There are a wide range of different advanced dry coal preparation technologies available. For example, the dry processing technology developed by Shenzhou Manufacturing, a Chinese company that holds patents for the FGX and ZM dry coal concentrators, is one of the world’s leading coal washing processes. It provides an efficient, dry, and gravity-based separation process by integrating two separation mechanisms including an autogenous fluidized bed and a conventional table separator. In another example, the Korea Institute of Geoscience and Mineral Resources (KIGAM) have developed a commercial scale KAT table which separates the components in the ROM coal according to their specific density differences. Over the past 20 years, more than 2,300 coal washing plants have been built in China, with more than 100 of which use dry technologies, with a total annual capacity of more than 200 million tons, accounting for 8% of the domestic market.
Dry processing technology can be used in combination with wet processing by improving the feed quality and reducing the size of the wet concentrate and therefore reducing the wet processing required.
In recognition of the limited water resource availability in the Southern Gobi, Erdenes Tavan Tolgoi LLC has been working with accredited laboratories in the United States, Germany and China since 2012 and research has shown that due to the properties of Tavan Tolgoi coal, it is more effective to use a combination of dry and wet technology. Based on its research and these results it is planning to build a 15 million tonne per year dry-wet combined coal washing plant at the Borteeg area of the Tavan Tolgoi.
The use of dry-wet combined technology can reduce the water demand of the concentrator by 40-45% compared to traditional wet processing. For the purpose of this assessment we have
18 Zhao, Y, X Yang, Z Luo and C. Duan (2014). Progress in developments of dry coal beneficiation Int J Coal Sci Technol 1(1):103–112 DOI 10.1007/s40789-014-0014-5
Hydro-Economic Analysis of the water-supply demand gap reduction in the South Gobi mining and heavy industry
region, Mongolia
-----------------------------------------------------------------------------------------------------------------------------------------
17
assumed this combined dry and wet processing at best practice for the region and recommend that this is used at the additional planned coal washing plants.
Dewatering of the wet clean coal and recycling of water at Energy Resources existing coal washing facility at Ukhaa Khudag is achieved through the use of state-of-the-art belt and filter presses. This is a highly efficient process that enables 95% of the water to be reused. It is recommended that this technology is applied to the wet processing component at all of the proposed combined dry-wet coal washing plants.
4.1.2. Water reduction measures at the mineral processing plant
From a review of the site water balance at the copper concentrator, wastewater from the truck wash, heating and power production, and from other industrial processes goes to the wastewater treatment plant, of which only 3l/s of treated water is recycled to the process water pond. It would therefore be possible to implement tertiary treatment, to improve the quality of the treated wastewater, to be able to recycle it. This could be achieved through a zero liquid discharge system (ZLD). ZLD systems combine different stages of treatment, such as membrane filtration or evaporation units with final disinfection. The potential water savings from implementing this option are 12 l/sec.
4.1.3. Reducing the demand for mining dust suppression
Companies operating in the Tavan Tolgoi and Oyu Tolgoi regions use water to suppress dust generated by core mining operations such as stripping, blasting, excavation, transportation, and stockpiling. The sources of water vary across the mines but can include rainwater, groundwater from deep wells and from mine dewatering. The demand for water to suppress dust depends not only on the size of the mine site and the size of the transport route, but also on the climate, soil and geological conditions of the area. Water consumption to suppress dust increases in spring and summer due to evaporation and higher wind speeds and conversely decreases in winter months. Table 4.1 presents an estimate of the water used for dust suppression for each of the mines. The mines currently use 1,045 TCM and is expected to peak in 2030 in the high growth scenario to 3,021 TCM before dropping to 2,148 TCM in 2050. Stakeholders at the mining companies recognise the need to adopt alternative water saving technologies related to dust suppression, as this is a key water using process.
Use binders to suppress dust
In addition to the careful preparation and grading of unpaved roads and through regular watering, a range of suppression or palliative treatment practices are available to reduce dust emissions to modify the erodability or erosivity of the road surface. These include: chemical dust palliatives, armouring of the surface; application of a seal to the road; and the use of a tightly bound, high strength wearing course material19. The use of chemical dust suppressants is considered as key viable alternatives to watering alone. The broad class of chemical products are hygroscopic salts, lignosulphonates (organic binders), petroleum resins, polymer emulsions and tar and bitumen-emulsion products. For the purpose of this study we have considered the following suppression treatments:
19 Thompson, R.J and A. T. Visser (2007). Selection, performance and economic evaluation of dust palliatives on surface mine haul
roads. Journal of the Southern Africa Institute of Mining and Metallurgy. Vol. 107.
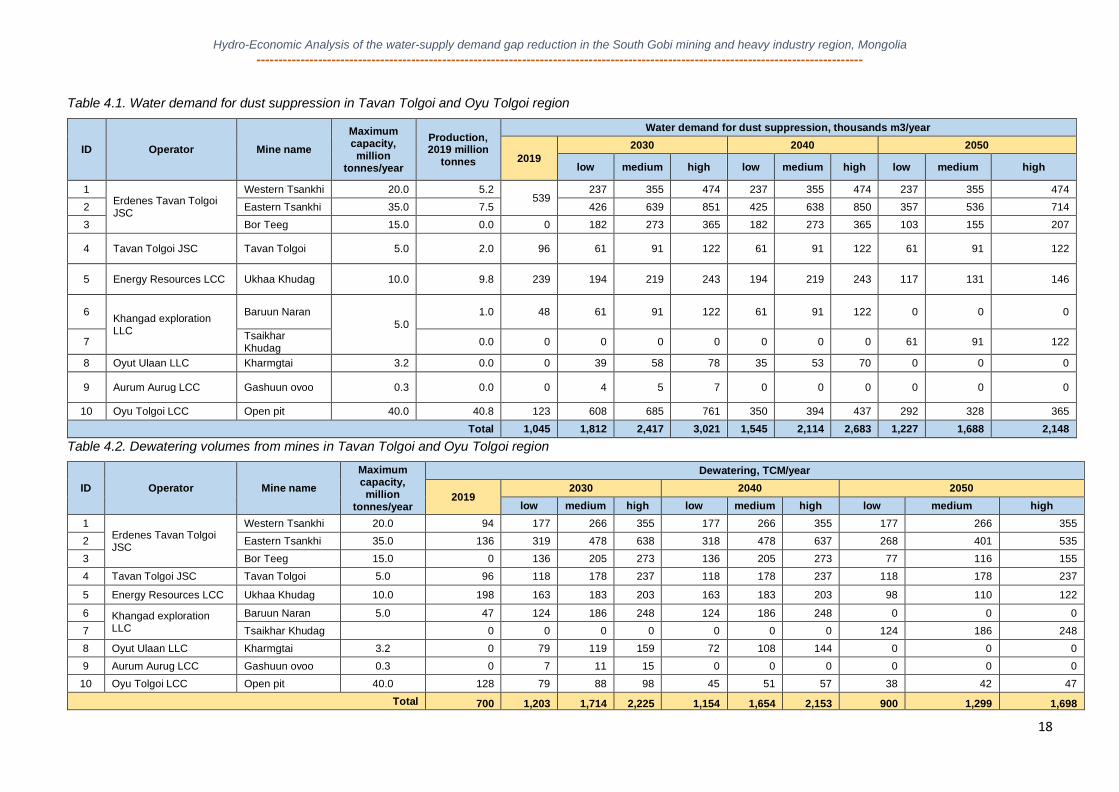
Hydro-Economic Analysis of the water-supply demand gap reduction in the South Gobi mining and heavy industry region, Mongolia
-----------------------------------------------------------------------------------------------------------------------------------------
18
Table 4.1. Water demand for dust suppression in Tavan Tolgoi and Oyu Tolgoi region
ID Operator Mine name
Maximum capacity, million
tonnes/year
Production, 2019 million
tonnes
Water demand for dust suppression, thousands m3/year
2019
2030 2040 2050
low medium high low medium high low medium high
1 Erdenes Tavan Tolgoi JSC
Western Tsankhi 20.0 5.2 539
237 355 474 237 355 474 237 355 474
2 Eastern Tsankhi 35.0 7.5 426 639 851 425 638 850 357 536 714
3 Bor Teeg 15.0 0.0 0 182 273 365 182 273 365 103 155 207
4 Tavan Tolgoi JSC Tavan Tolgoi 5.0 2.0 96 61 91 122 61 91 122 61 91 122
5 Energy Resources LCC Ukhaa Khudag 10.0 9.8 239 194 219 243 194 219 243 117 131 146
6 Khangad exploration LLC
Baruun Naran
5.0
1.0 48 61 91 122 61 91 122 0 0 0
7 Tsaikhar Khudag
0.0 0 0 0 0 0 0 0 61 91 122
8 Oyut Ulaan LLC Kharmgtai 3.2 0.0 0 39 58 78 35 53 70 0 0 0
9 Aurum Aurug LCC Gashuun ovoo 0.3 0.0 0 4 5 7 0 0 0 0 0 0
10 Oyu Tolgoi LCC Open pit 40.0 40.8 123 608 685 761 350 394 437 292 328 365
Total 1,045 1,812 2,417 3,021 1,545 2,114 2,683 1,227 1,688 2,148
Table 4.2. Dewatering volumes from mines in Tavan Tolgoi and Oyu Tolgoi region
ID Operator Mine name
Maximum capacity, million
tonnes/year
Dewatering, TCM/year
2019 2030 2040 2050
low medium high low medium high low medium high
1 Erdenes Tavan Tolgoi JSC
Western Tsankhi 20.0 94 177 266 355 177 266 355 177 266 355
2 Eastern Tsankhi 35.0 136 319 478 638 318 478 637 268 401 535
3 Bor Teeg 15.0 0 136 205 273 136 205 273 77 116 155
4 Tavan Tolgoi JSC Tavan Tolgoi 5.0 96 118 178 237 118 178 237 118 178 237
5 Energy Resources LCC Ukhaa Khudag 10.0 198 163 183 203 163 183 203 98 110 122
6 Khangad exploration LLC
Baruun Naran 5.0 47 124 186 248 124 186 248 0 0 0
7 Tsaikhar Khudag 0 0 0 0 0 0 0 124 186 248
8 Oyut Ulaan LLC Kharmgtai 3.2 0 79 119 159 72 108 144 0 0 0
9 Aurum Aurug LCC Gashuun ovoo 0.3 0 7 11 15 0 0 0 0 0 0
10 Oyu Tolgoi LCC Open pit 40.0 128 79 88 98 45 51 57 38 42 47
Total 700 1,203 1,714 2,225 1,154 1,654 2,153 900 1,299 1,698
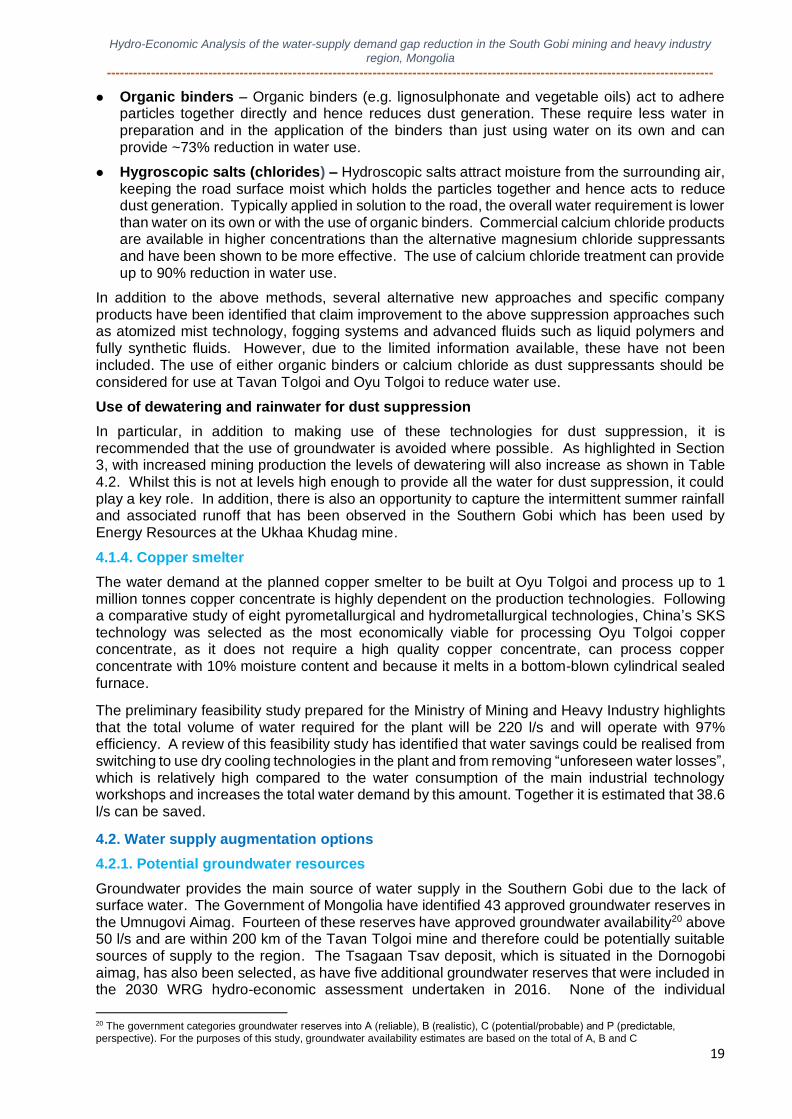
Hydro-Economic Analysis of the water-supply demand gap reduction in the South Gobi mining and heavy industry
region, Mongolia
-----------------------------------------------------------------------------------------------------------------------------------------
19
⚫ Organic binders – Organic binders (e.g. lignosulphonate and vegetable oils) act to adhere particles together directly and hence reduces dust generation. These require less water in preparation and in the application of the binders than just using water on its own and can provide ~73% reduction in water use.
⚫ Hygroscopic salts (chlorides) – Hydroscopic salts attract moisture from the surrounding air, keeping the road surface moist which holds the particles together and hence acts to reduce dust generation. Typically applied in solution to the road, the overall water requirement is lower than water on its own or with the use of organic binders. Commercial calcium chloride products are available in higher concentrations than the alternative magnesium chloride suppressants and have been shown to be more effective. The use of calcium chloride treatment can provide up to 90% reduction in water use.
In addition to the above methods, several alternative new approaches and specific company products have been identified that claim improvement to the above suppression approaches such as atomized mist technology, fogging systems and advanced fluids such as liquid polymers and fully synthetic fluids. However, due to the limited information available, these have not been included. The use of either organic binders or calcium chloride as dust suppressants should be considered for use at Tavan Tolgoi and Oyu Tolgoi to reduce water use.
Use of dewatering and rainwater for dust suppression
In particular, in addition to making use of these technologies for dust suppression, it is recommended that the use of groundwater is avoided where possible. As highlighted in Section 3, with increased mining production the levels of dewatering will also increase as shown in Table 4.2. Whilst this is not at levels high enough to provide all the water for dust suppression, it could play a key role. In addition, there is also an opportunity to capture the intermittent summer rainfall and associated runoff that has been observed in the Southern Gobi which has been used by Energy Resources at the Ukhaa Khudag mine.
4.1.4. Copper smelter
The water demand at the planned copper smelter to be built at Oyu Tolgoi and process up to 1 million tonnes copper concentrate is highly dependent on the production technologies. Following a comparative study of eight pyrometallurgical and hydrometallurgical technologies, China’s SKS technology was selected as the most economically viable for processing Oyu Tolgoi copper concentrate, as it does not require a high quality copper concentrate, can process copper concentrate with 10% moisture content and because it melts in a bottom-blown cylindrical sealed furnace.
The preliminary feasibility study prepared for the Ministry of Mining and Heavy Industry highlights that the total volume of water required for the plant will be 220 l/s and will operate with 97% efficiency. A review of this feasibility study has identified that water savings could be realised from switching to use dry cooling technologies in the plant and from removing “unforeseen water losses”, which is relatively high compared to the water consumption of the main industrial technology workshops and increases the total water demand by this amount. Together it is estimated that 38.6 l/s can be saved.
4.2. Water supply augmentation options
4.2.1. Potential groundwater resources
Groundwater provides the main source of water supply in the Southern Gobi due to the lack of surface water. The Government of Mongolia have identified 43 approved groundwater reserves in the Umnugovi Aimag. Fourteen of these reserves have approved groundwater availability20 above 50 l/s and are within 200 km of the Tavan Tolgoi mine and therefore could be potentially suitable sources of supply to the region. The Tsagaan Tsav deposit, which is situated in the Dornogobi aimag, has also been selected, as have five additional groundwater reserves that were included in the 2030 WRG hydro-economic assessment undertaken in 2016. None of the individual
20 The government categories groundwater reserves into А (reliable), В (realistic), C (potential/probable) and Р (predictable, perspective). For the purposes of this study, groundwater availability estimates are based on the total of A, B and C
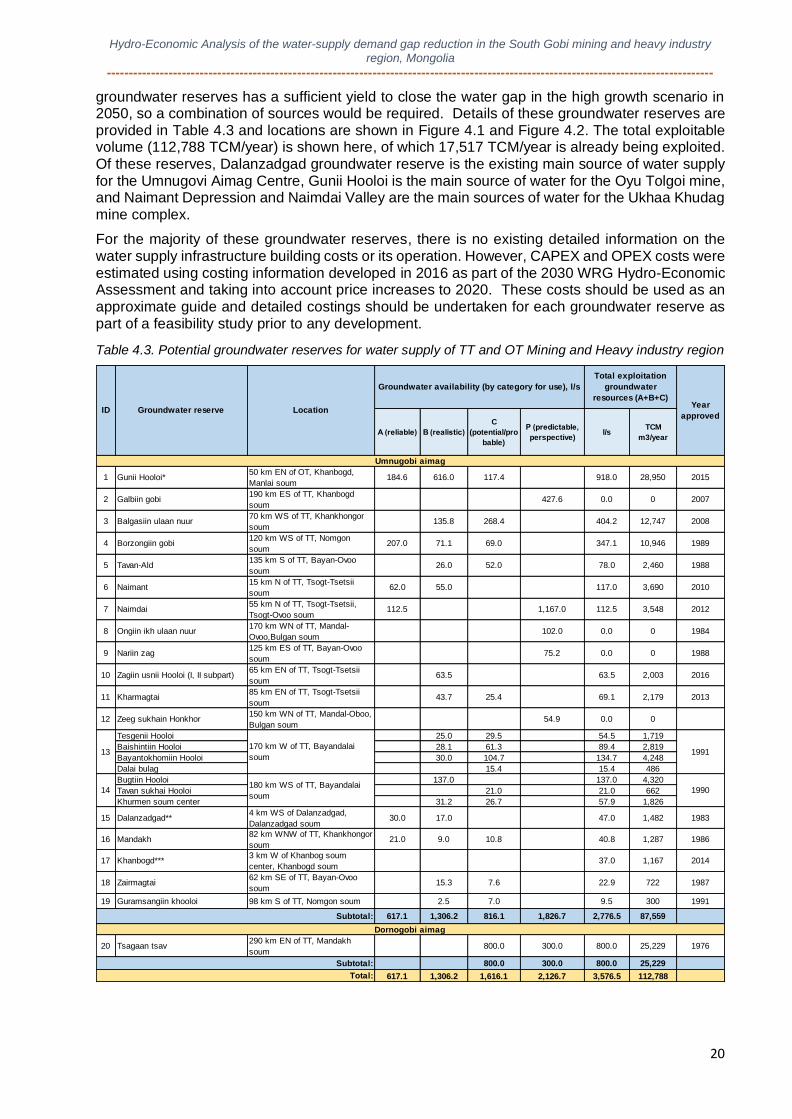
Hydro-Economic Analysis of the water-supply demand gap reduction in the South Gobi mining and heavy industry
region, Mongolia
-----------------------------------------------------------------------------------------------------------------------------------------
20
groundwater reserves has a sufficient yield to close the water gap in the high growth scenario in 2050, so a combination of sources would be required. Details of these groundwater reserves are provided in Table 4.3 and locations are shown in Figure 4.1 and Figure 4.2. The total exploitable volume (112,788 TCM/year) is shown here, of which 17,517 TCM/year is already being exploited. Of these reserves, Dalanzadgad groundwater reserve is the existing main source of water supply for the Umnugovi Aimag Centre, Gunii Hooloi is the main source of water for the Oyu Tolgoi mine, and Naimant Depression and Naimdai Valley are the main sources of water for the Ukhaa Khudag mine complex.
For the majority of these groundwater reserves, there is no existing detailed information on the water supply infrastructure building costs or its operation. However, CAPEX and OPEX costs were estimated using costing information developed in 2016 as part of the 2030 WRG Hydro-Economic Assessment and taking into account price increases to 2020. These costs should be used as an approximate guide and detailed costings should be undertaken for each groundwater reserve as part of a feasibility study prior to any development.
Table 4.3. Potential groundwater reserves for water supply of TT and OT Mining and Heavy industry region
А (reliable) В (realistic)
C
(potential/pro
bable)
Р (predictable,
perspective)l/s
TCM
m3/year
1 Gunii Hooloi*50 km EN of OT, Khanbogd,
Manlai soum 184.6 616.0 117.4 918.0 28,950 2015
2 Galbiin gobi190 km ES of TT, Khanbogd
soum427.6 0.0 0 2007
3 Balgasiin ulaan nuur 70 km WS of TT, Khankhongor
soum135.8 268.4 404.2 12,747 2008
4 Borzongiin gobi 120 km WS of TT, Nomgon
soum 207.0 71.1 69.0 347.1 10,946 1989
5 Tavan-Ald135 km S of TT, Bayan-Ovoo
soum 26.0 52.0 78.0 2,460 1988
6 Naimant 15 km N of TT, Tsogt-Tsetsii
soum 62.0 55.0 117.0 3,690 2010
7 Naimdai 55 km N of TT, Tsogt-Tsetsii,
Tsogt-Ovoo soum 112.5 1,167.0 112.5 3,548 2012
8 Ongiin ikh ulaan nuur 170 km WN of TT, Mandal-
Ovoo,Bulgan soum 102.0 0.0 0 1984
9 Nariin zag 125 km ES of TT, Bayan-Ovoo
soum 75.2 0.0 0 1988
10 Zagiin usnii Hooloi (I, II subpart)65 km EN of TT, Tsogt-Tsetsii
soum 63.5 63.5 2,003 2016
11 Kharmagtai85 km EN of TT, Tsogt-Tsetsii
soum43.7 25.4 69.1 2,179 2013
12 Zeeg sukhain Honkhor150 km WN of TT, Mandal-Oboo,
Bulgan soum54.9 0.0 0
Tesgenii Hooloi 25.0 29.5 54.5 1,719
Baishintiin Hooloi 28.1 61.3 89.4 2,819
Bayantokhomiin Hooloi 30.0 104.7 134.7 4,248
Dalai bulag 15.4 15.4 486
Bugtiin Hooloi 137.0 137.0 4,320
Tavan sukhai Hooloi 21.0 21.0 662
Khurmen soum center 31.2 26.7 57.9 1,826
15 Dalanzadgad**4 km WS of Dalanzadgad,
Dalanzadgad soum30.0 17.0 47.0 1,482 1983
16 Mandakh82 km WNW of TT, Khankhongor
soum 21.0 9.0 10.8 40.8 1,287 1986
17 Khanbogd***3 km W of Khanbog soum
center, Khanbogd soum37.0 1,167 2014
18 Zairmagtai62 km SE of TT, Bayan-Ovoo
soum15.3 7.6 22.9 722 1987
19 Guramsangiin khooloi 98 km S of TT, Nomgon soum 2.5 7.0 9.5 300 1991
617.1 1,306.2 816.1 1,826.7 2,776.5 87,559
20 Tsagaan tsav290 km EN of TT, Mandakh
soum800.0 300.0 800.0 25,229 1976
800.0 300.0 800.0 25,229
617.1 1,306.2 1,616.1 2,126.7 3,576.5 112,788
Groundwater availability (by category for use), l/s
Total exploitation
groundwater
resources (A+B+C)
Total:
Dornogobi aimag
Umnugobi aimag
Groundwater reserve ID Location Year
approved
13170 km W of TT, Bayandalai
soum1991
Subtotal:
Subtotal:
14180 km WS of TT, Bayandalai
soum 1990
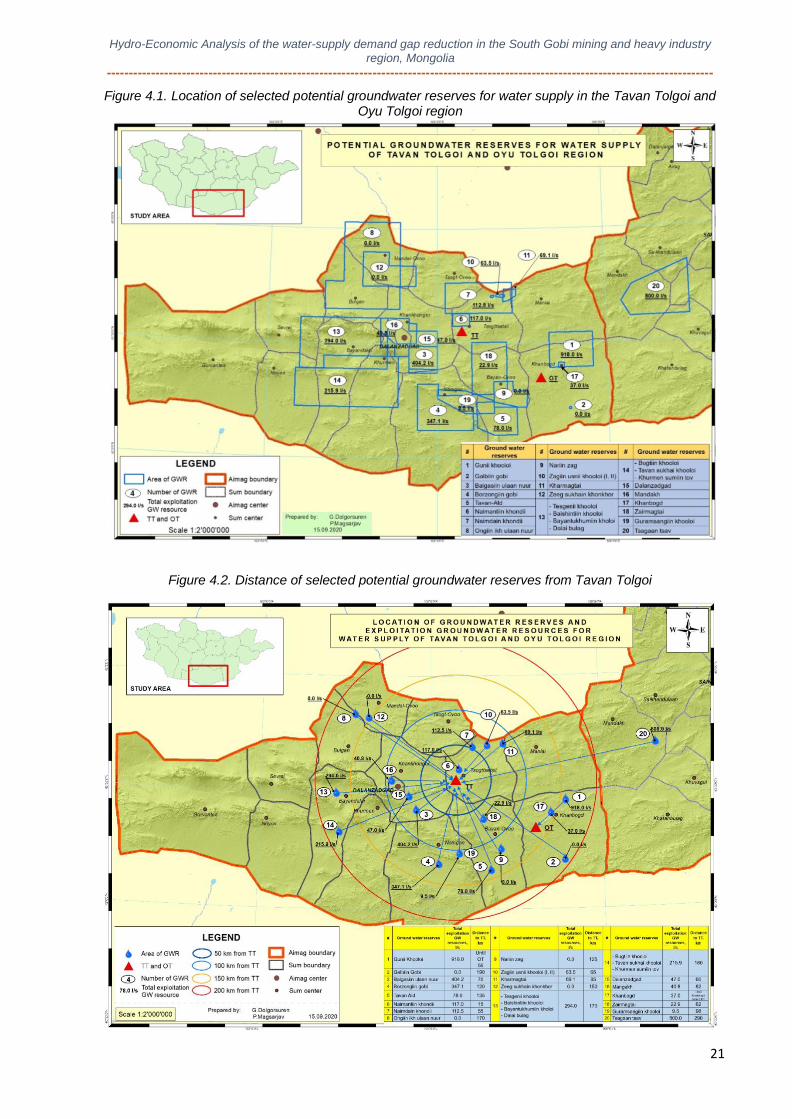
Hydro-Economic Analysis of the water-supply demand gap reduction in the South Gobi mining and heavy industry
region, Mongolia
-----------------------------------------------------------------------------------------------------------------------------------------
21
Figure 4.1. Location of selected potential groundwater reserves for water supply in the Tavan Tolgoi and Oyu Tolgoi region
Figure 4.2. Distance of selected potential groundwater reserves from Tavan Tolgoi
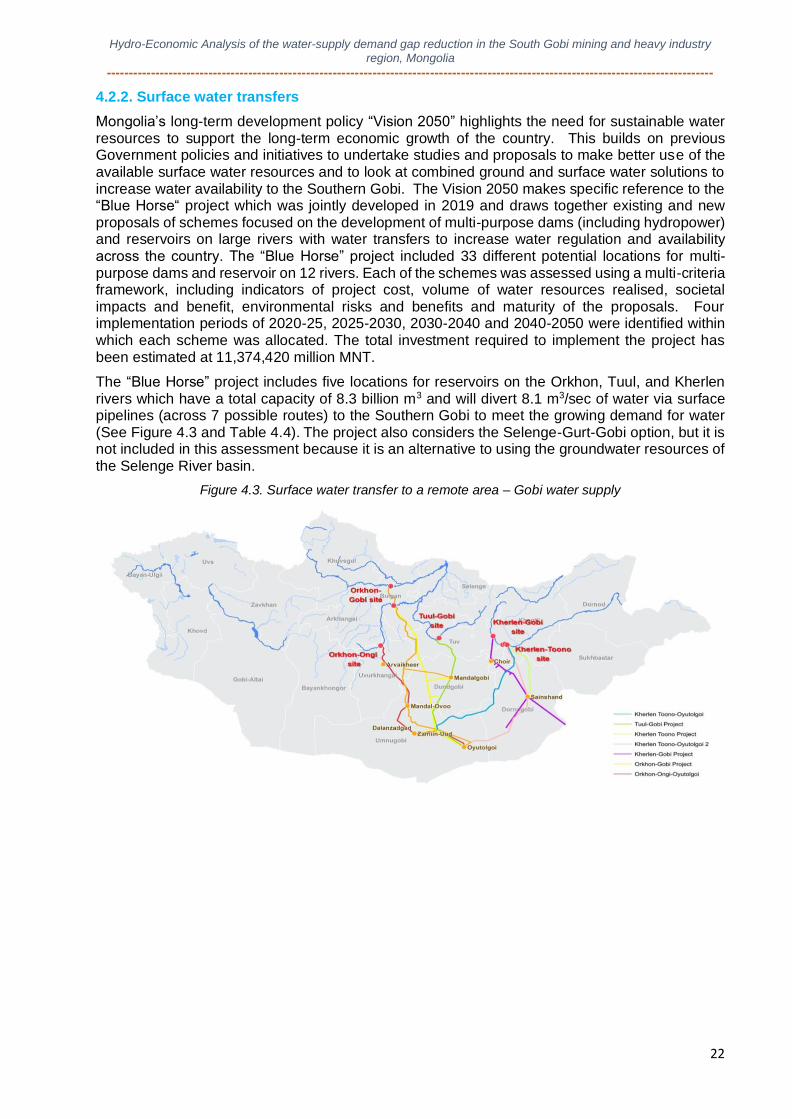
Hydro-Economic Analysis of the water-supply demand gap reduction in the South Gobi mining and heavy industry
region, Mongolia
-----------------------------------------------------------------------------------------------------------------------------------------
22
4.2.2. Surface water transfers
Mongolia’s long-term development policy “Vision 2050” highlights the need for sustainable water resources to support the long-term economic growth of the country. This builds on previous Government policies and initiatives to undertake studies and proposals to make better use of the available surface water resources and to look at combined ground and surface water solutions to increase water availability to the Southern Gobi. The Vision 2050 makes specific reference to the “Blue Horse“ project which was jointly developed in 2019 and draws together existing and new proposals of schemes focused on the development of multi-purpose dams (including hydropower) and reservoirs on large rivers with water transfers to increase water regulation and availability across the country. The “Blue Horse” project included 33 different potential locations for multi-purpose dams and reservoir on 12 rivers. Each of the schemes was assessed using a multi-criteria framework, including indicators of project cost, volume of water resources realised, societal impacts and benefit, environmental risks and benefits and maturity of the proposals. Four implementation periods of 2020-25, 2025-2030, 2030-2040 and 2040-2050 were identified within which each scheme was allocated. The total investment required to implement the project has been estimated at 11,374,420 million MNT.
The “Blue Horse” project includes five locations for reservoirs on the Orkhon, Tuul, and Kherlen rivers which have a total capacity of 8.3 billion m3 and will divert 8.1 m3/sec of water via surface pipelines (across 7 possible routes) to the Southern Gobi to meet the growing demand for water (See Figure 4.3 and Table 4.4). The project also considers the Selenge-Gurt-Gobi option, but it is not included in this assessment because it is an alternative to using the groundwater resources of the Selenge River basin.
Figure 4.3. Surface water transfer to a remote area – Gobi water supply
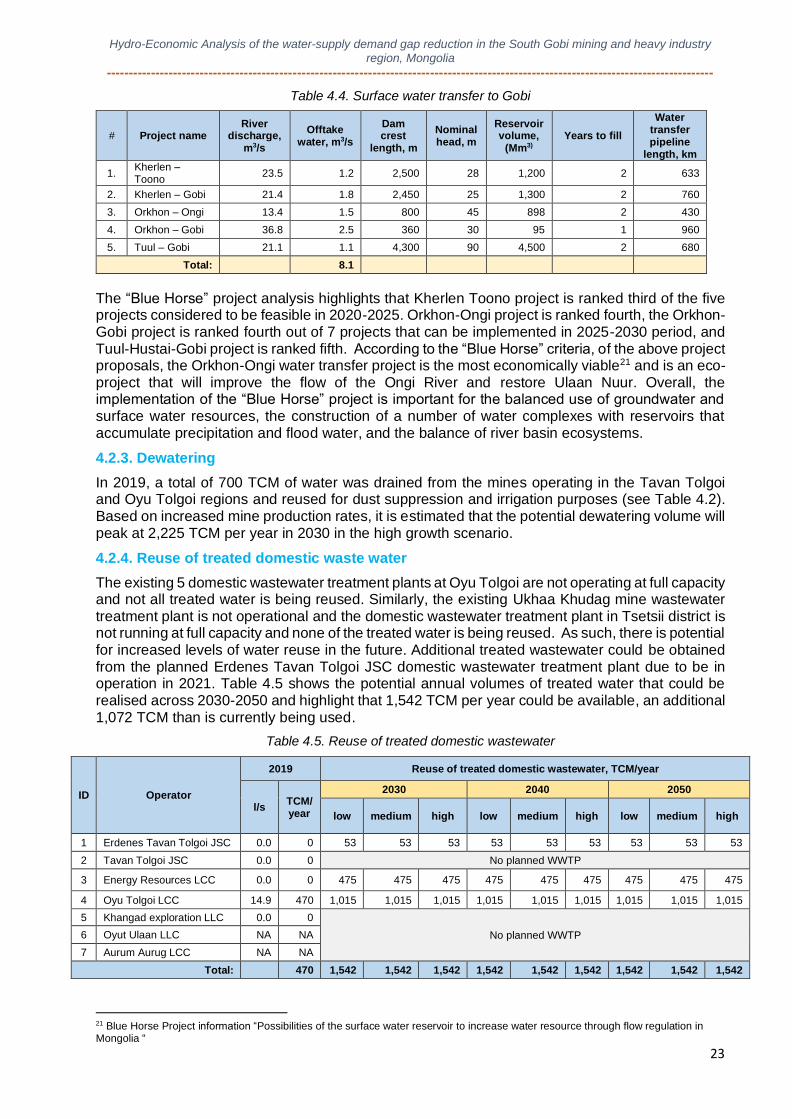
Hydro-Economic Analysis of the water-supply demand gap reduction in the South Gobi mining and heavy industry
region, Mongolia
-----------------------------------------------------------------------------------------------------------------------------------------
23
Table 4.4. Surface water transfer to Gobi
The “Blue Horse” project analysis highlights that Kherlen Toono project is ranked third of the five projects considered to be feasible in 2020-2025. Orkhon-Ongi project is ranked fourth, the Orkhon-Gobi project is ranked fourth out of 7 projects that can be implemented in 2025-2030 period, and Tuul-Hustai-Gobi project is ranked fifth. According to the “Blue Horse” criteria, of the above project proposals, the Orkhon-Ongi water transfer project is the most economically viable21 and is an eco-project that will improve the flow of the Ongi River and restore Ulaan Nuur. Overall, the implementation of the “Blue Horse” project is important for the balanced use of groundwater and surface water resources, the construction of a number of water complexes with reservoirs that accumulate precipitation and flood water, and the balance of river basin ecosystems.
4.2.3. Dewatering
In 2019, a total of 700 TCM of water was drained from the mines operating in the Tavan Tolgoi and Oyu Tolgoi regions and reused for dust suppression and irrigation purposes (see Table 4.2). Based on increased mine production rates, it is estimated that the potential dewatering volume will peak at 2,225 TCM per year in 2030 in the high growth scenario.
4.2.4. Reuse of treated domestic waste water
The existing 5 domestic wastewater treatment plants at Oyu Tolgoi are not operating at full capacity and not all treated water is being reused. Similarly, the existing Ukhaa Khudag mine wastewater treatment plant is not operational and the domestic wastewater treatment plant in Tsetsii district is not running at full capacity and none of the treated water is being reused. As such, there is potential for increased levels of water reuse in the future. Additional treated wastewater could be obtained from the planned Erdenes Tavan Tolgoi JSC domestic wastewater treatment plant due to be in operation in 2021. Table 4.5 shows the potential annual volumes of treated water that could be realised across 2030-2050 and highlight that 1,542 TCM per year could be available, an additional 1,072 TCM than is currently being used.
Table 4.5. Reuse of treated domestic wastewater
ID Operator
2019 Reuse of treated domestic wastewater, TCM/year
l/s TCM/year
2030 2040 2050
low medium high low medium high low medium high
1 Erdenes Tavan Tolgoi JSC 0.0 0 53 53 53 53 53 53 53 53 53
2 Tavan Tolgoi JSC 0.0 0 No planned WWTP
3 Energy Resources LCC 0.0 0 475 475 475 475 475 475 475 475 475
4 Oyu Tolgoi LCC 14.9 470 1,015 1,015 1,015 1,015 1,015 1,015 1,015 1,015 1,015
5 Khangad exploration LLC 0.0 0
No planned WWTP 6 Oyut Ulaan LLC NA NA
7 Aurum Aurug LCC NA NA
Total: 470 1,542 1,542 1,542 1,542 1,542 1,542 1,542 1,542 1,542
21 Blue Horse Project information “Possibilities of the surface water reservoir to increase water resource through flow regulation in Mongolia “
# Project name River
discharge, m3/s
Offtake water, m3/s
Dam crest
length, m
Nominal head, m
Reservoir volume,
(Mm3) Years to fill
Water transfer pipeline
length, km
1. Kherlen – Toono
23.5 1.2 2,500 28 1,200 2 633
2. Kherlen – Gobi 21.4 1.8 2,450 25 1,300 2 760
3. Orkhon – Ongi 13.4 1.5 800 45 898 2 430
4. Orkhon – Gobi 36.8 2.5 360 30 95 1 960
5. Tuul – Gobi 21.1 1.1 4,300 90 4,500 2 680
Total: 8.1
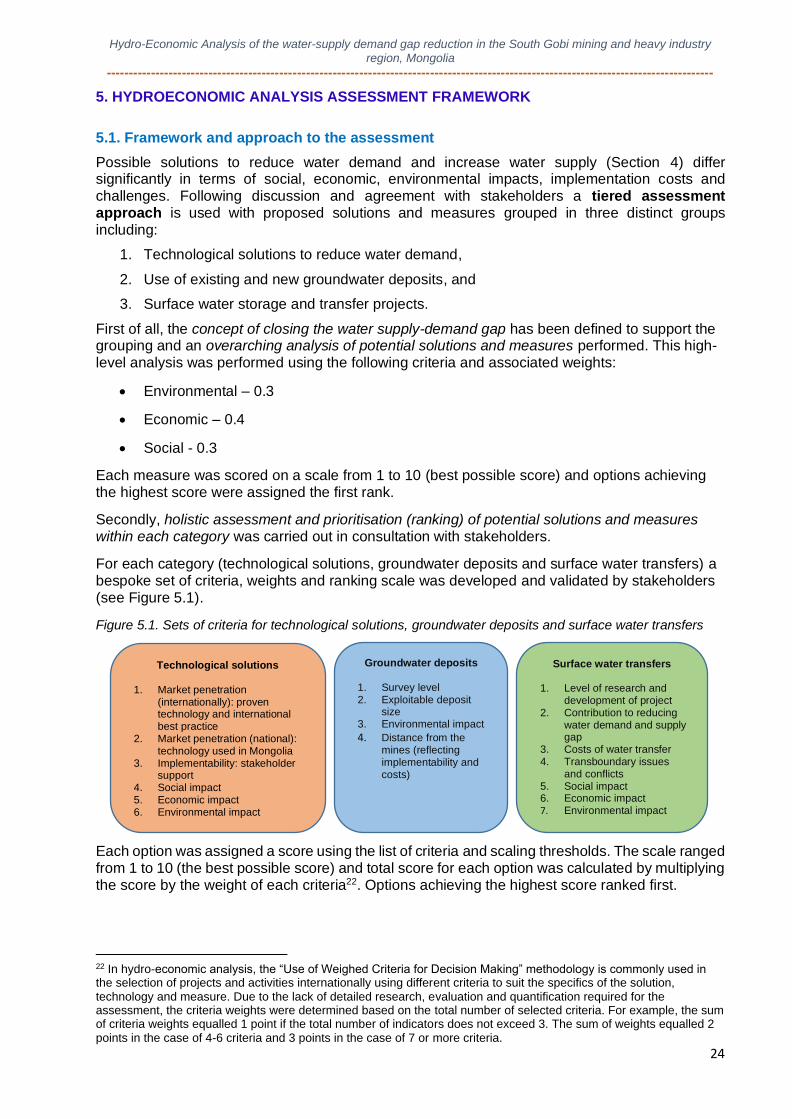
Hydro-Economic Analysis of the water-supply demand gap reduction in the South Gobi mining and heavy industry
region, Mongolia
-----------------------------------------------------------------------------------------------------------------------------------------
24
5. HYDROECONOMIC ANALYSIS ASSESSMENT FRAMEWORK
5.1. Framework and approach to the assessment
Possible solutions to reduce water demand and increase water supply (Section 4) differ significantly in terms of social, economic, environmental impacts, implementation costs and challenges. Following discussion and agreement with stakeholders a tiered assessment approach is used with proposed solutions and measures grouped in three distinct groups including:
1. Technological solutions to reduce water demand,
2. Use of existing and new groundwater deposits, and
3. Surface water storage and transfer projects.
First of all, the concept of closing the water supply-demand gap has been defined to support the grouping and an overarching analysis of potential solutions and measures performed. This high-level analysis was performed using the following criteria and associated weights:
• Environmental – 0.3
• Economic – 0.4
• Social - 0.3
Each measure was scored on a scale from 1 to 10 (best possible score) and options achieving the highest score were assigned the first rank.
Secondly, holistic assessment and prioritisation (ranking) of potential solutions and measures within each category was carried out in consultation with stakeholders.
For each category (technological solutions, groundwater deposits and surface water transfers) a bespoke set of criteria, weights and ranking scale was developed and validated by stakeholders (see Figure 5.1).
Figure 5.1. Sets of criteria for technological solutions, groundwater deposits and surface water transfers
Each option was assigned a score using the list of criteria and scaling thresholds. The scale ranged from 1 to 10 (the best possible score) and total score for each option was calculated by multiplying the score by the weight of each criteria22. Options achieving the highest score ranked first.
22 In hydro-economic analysis, the “Use of Weighed Criteria for Decision Making” methodology is commonly used in the selection of projects and activities internationally using different criteria to suit the specifics of the solution, technology and measure. Due to the lack of detailed research, evaluation and quantification required for the assessment, the criteria weights were determined based on the total number of selected criteria. For example, the sum of criteria weights equalled 1 point if the total number of indicators does not exceed 3. The sum of weights equalled 2 points in the case of 4-6 criteria and 3 points in the case of 7 or more criteria.
Technological solutions
1. Market penetration (internationally): proven technology and international best practice
2. Market penetration (national): technology used in Mongolia
3. Implementability: stakeholder support
4. Social impact 5. Economic impact 6. Environmental impact
Groundwater deposits
1. Survey level 2. Exploitable deposit
size 3. Environmental impact
4. Distance from the mines (reflecting implementability and costs)
Surface water transfers
1. Level of research and development of project
2. Contribution to reducing water demand and supply gap
3. Costs of water transfer 4. Transboundary issues
and conflicts 5. Social impact 6. Economic impact 7. Environmental impact
Hydro-Economic Analysis of the water-supply demand gap reduction in the South Gobi mining and heavy industry
region, Mongolia
-----------------------------------------------------------------------------------------------------------------------------------------
25
5.2. Concept of Closing the water supply demand gap and high-level analysis of potential solutions and measures
Research and evaluation work to increase water supply for mining and heavy industry in the Southern Gobi region has been carried out at various levels and across numerous projects and programs over the course of more than 20 years. However, no consensus has been reached with regard to the measures required.
In recent years, there have been growing information discrepancies and misunderstandings surrounding the “mining-water nexus” between local authorities, citizens, miners, governmental and non-governmental organizations and water scientists. As a result, the implementation of major mining and heavy industry projects in the Southern Gobi region may slow down, affecting the country's economy.
One step to address this issue is to develop a “Concept for Closing the Difference between Mining and Heavy Water Demand and Water Supply in the South Gobi Region”, discuss it with stakeholders, make decisions at the relevant level, and implement further projects and activities in accordance with this concept. It is important that all parties involved agree on planning and implementation.
Detailed assessment of technological solutions to reduce water demand (dry-wet technology, complete dewatering technology, use of calcium chloride for dust suppression, etc.) and possible options to increase water supply (use of existing and new (proven) groundwater deposits, construction of water complexes on major rivers, storage and transfer of surface water, etc.) is performed within the framework of hydro-economic analysis. Based on this, the “Concept for the long-term sustainable reduction of the demand supply gap for mining and heavy industry in the South Gobi region” is recommended.
This means that large-scale production, service and heavy industry projects in the Southern Gobi region, which are severely affected by water scarcity, drought and desertification, will first require the use of water efficient and dry technologies, followed by water treatment and reuse. Following that, it is recommended to use the groundwater deposit that is closest to meet the water demand that has the least environmental and social impact. Options to meet our growing needs in the future will be determined by considering surface water transfers.
In this context, options for reducing water demand and increasing supply in the Tavan Tolgoi and Oyu Tolgoi are discussed in detail.
For demand reduction:
1. Use of water-saving technologies including use of combined dry-wet technology in coal washing plants, installation of high efficiency belt presses for dewatering, installation of zero liquid discharge technology in mineral processing plant etc.
2. Water efficiency measures at the planned copper smelter (switching to dry cooling technologies and removing unforeseen water losses);
3. Use of calcium chloride for dust suppression in mine sites; 4. Reuse of treated domestic wastewater - technological upgrades to domestic wastewater
treatment plants to increase the level of treatment and increase the amount of water reuse.
For supply augmentation:
1. Continued use of existing groundwater deposits (based on the results of ongoing monitoring of groundwater level decline);
2. Exploitation on new, potential groundwater deposits (starting from the first ranked groundwater deposit in terms of social, economic and environmental criteria) to close the water demand gap until the implementation of the surface water storage and transfer project;
3. Storage and transfer of surface water resources (starting from the project ranked first in accordance with the set criteria).
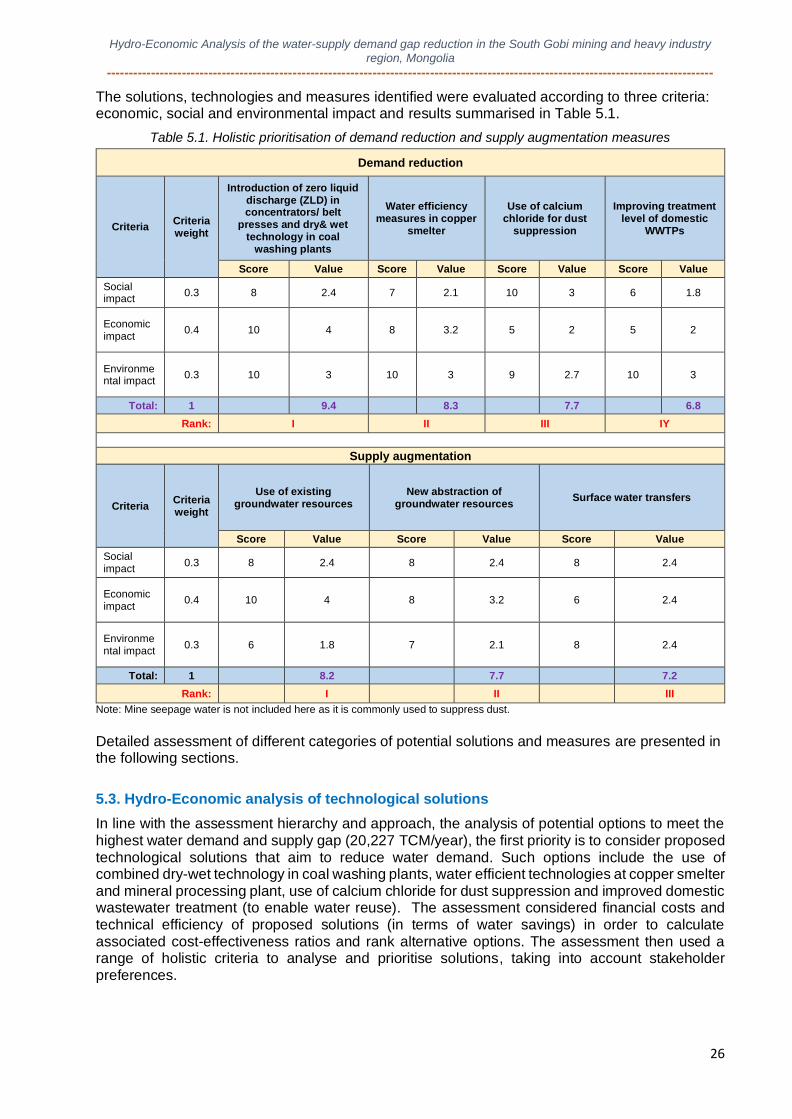
Hydro-Economic Analysis of the water-supply demand gap reduction in the South Gobi mining and heavy industry
region, Mongolia
-----------------------------------------------------------------------------------------------------------------------------------------
26
The solutions, technologies and measures identified were evaluated according to three criteria: economic, social and environmental impact and results summarised in Table 5.1.
Table 5.1. Holistic prioritisation of demand reduction and supply augmentation measures
Demand reduction
Criteria Criteria weight
Introduction of zero liquid discharge (ZLD) in concentrators/ belt
presses and dry& wet technology in coal
washing plants
Water efficiency measures in copper
smelter
Use of calcium chloride for dust
suppression
Improving treatment level of domestic
WWTPs
Score Value Score Value Score Value Score Value
Social impact
0.3 8 2.4 7 2.1 10 3 6 1.8
Economic impact
0.4 10 4 8 3.2 5 2 5 2
Environmental impact
0.3 10 3 10 3 9 2.7 10 3
Total: 1 9.4 8.3 7.7 6.8
Rank: I II III IY
Supply augmentation
Criteria Criteria weight
Use of existing groundwater resources
New abstraction of groundwater resources
Surface water transfers
Score Value Score Value Score Value
Social impact
0.3 8 2.4 8 2.4 8 2.4
Economic impact
0.4 10 4 8 3.2 6 2.4
Environmental impact
0.3 6 1.8 7 2.1 8 2.4
Total: 1 8.2 7.7 7.2
Rank: I II III
Note: Mine seepage water is not included here as it is commonly used to suppress dust.
Detailed assessment of different categories of potential solutions and measures are presented in the following sections.
5.3. Hydro-Economic analysis of technological solutions
In line with the assessment hierarchy and approach, the analysis of potential options to meet the highest water demand and supply gap (20,227 TCM/year), the first priority is to consider proposed technological solutions that aim to reduce water demand. Such options include the use of combined dry-wet technology in coal washing plants, water efficient technologies at copper smelter and mineral processing plant, use of calcium chloride for dust suppression and improved domestic wastewater treatment (to enable water reuse). The assessment considered financial costs and technical efficiency of proposed solutions (in terms of water savings) in order to calculate associated cost-effectiveness ratios and rank alternative options. The assessment then used a range of holistic criteria to analyse and prioritise solutions, taking into account stakeholder preferences.
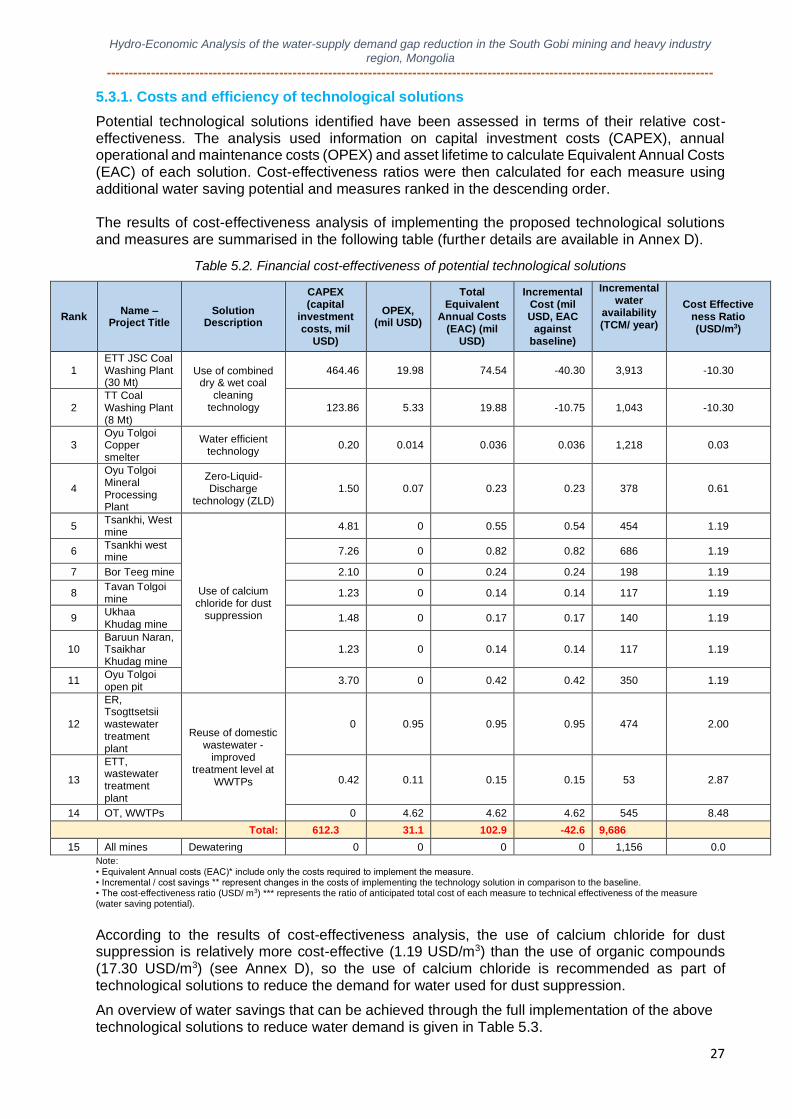
Hydro-Economic Analysis of the water-supply demand gap reduction in the South Gobi mining and heavy industry
region, Mongolia
-----------------------------------------------------------------------------------------------------------------------------------------
27
5.3.1. Costs and efficiency of technological solutions
Potential technological solutions identified have been assessed in terms of their relative cost-effectiveness. The analysis used information on capital investment costs (CAPEX), annual operational and maintenance costs (OPEX) and asset lifetime to calculate Equivalent Annual Costs (EAC) of each solution. Cost-effectiveness ratios were then calculated for each measure using additional water saving potential and measures ranked in the descending order. The results of cost-effectiveness analysis of implementing the proposed technological solutions and measures are summarised in the following table (further details are available in Annex D).
Table 5.2. Financial cost-effectiveness of potential technological solutions
Rank Name –
Project Title Solution
Description
CAPEX (capital
investment costs, mil
USD)
OPEX, (mil USD)
Total Equivalent
Annual Costs (EAC) (mil
USD)
Incremental Cost (mil USD, EAC
against baseline)
Incremental water
availability (TCM/ year)
Cost Effective ness Ratio (USD/m3)
1 ETT JSC Coal Washing Plant (30 Mt)
Use of combined dry & wet coal
cleaning technology
464.46 19.98 74.54 -40.30 3,913 -10.30
2 TT Coal Washing Plant (8 Mt)
123.86 5.33 19.88 -10.75 1,043 -10.30
3 Oyu Tolgoi Copper smelter
Water efficient technology
0.20 0.014 0.036 0.036 1,218 0.03
4
Oyu Tolgoi Mineral Processing Plant
Zero-Liquid-Discharge
technology (ZLD) 1.50 0.07 0.23 0.23 378 0.61
5 Tsankhi, West mine
Use of calcium chloride for dust
suppression
4.81 0 0.55 0.54 454 1.19
6 Tsankhi west mine
7.26 0 0.82 0.82 686 1.19
7 Bor Teeg mine 2.10 0 0.24 0.24 198 1.19
8 Tavan Tolgoi mine
1.23 0 0.14 0.14 117 1.19
9 Ukhaa Khudag mine
1.48 0 0.17 0.17 140 1.19
10 Baruun Naran, Tsaikhar Khudag mine
1.23 0 0.14 0.14 117 1.19
11 Oyu Tolgoi open pit
3.70 0 0.42 0.42 350 1.19
12
ER, Tsogttsetsii wastewater treatment plant
Reuse of domestic wastewater -
improved treatment level at
WWTPs
0 0.95 0.95 0.95 474 2.00
13
ETT, wastewater treatment plant
0.42 0.11 0.15 0.15 53 2.87
14 OT, WWTPs 0 4.62 4.62 4.62 545 8.48
Total: 612.3 31.1 102.9 -42.6 9,686
15 All mines Dewatering 0 0 0 0 1,156 0.0
Note:
• Equivalent Annual costs (EAC)* include only the costs required to implement the measure. • Incremental / cost savings ** represent changes in the costs of implementing the technology solution in comparison to the baseline. • The cost-effectiveness ratio (USD/ m3) *** represents the ratio of anticipated total cost of each measure to technical effectiveness of the measure (water saving potential).
According to the results of cost-effectiveness analysis, the use of calcium chloride for dust suppression is relatively more cost-effective (1.19 USD/m3) than the use of organic compounds (17.30 USD/m3) (see Annex D), so the use of calcium chloride is recommended as part of technological solutions to reduce the demand for water used for dust suppression.
An overview of water savings that can be achieved through the full implementation of the above technological solutions to reduce water demand is given in Table 5.3.
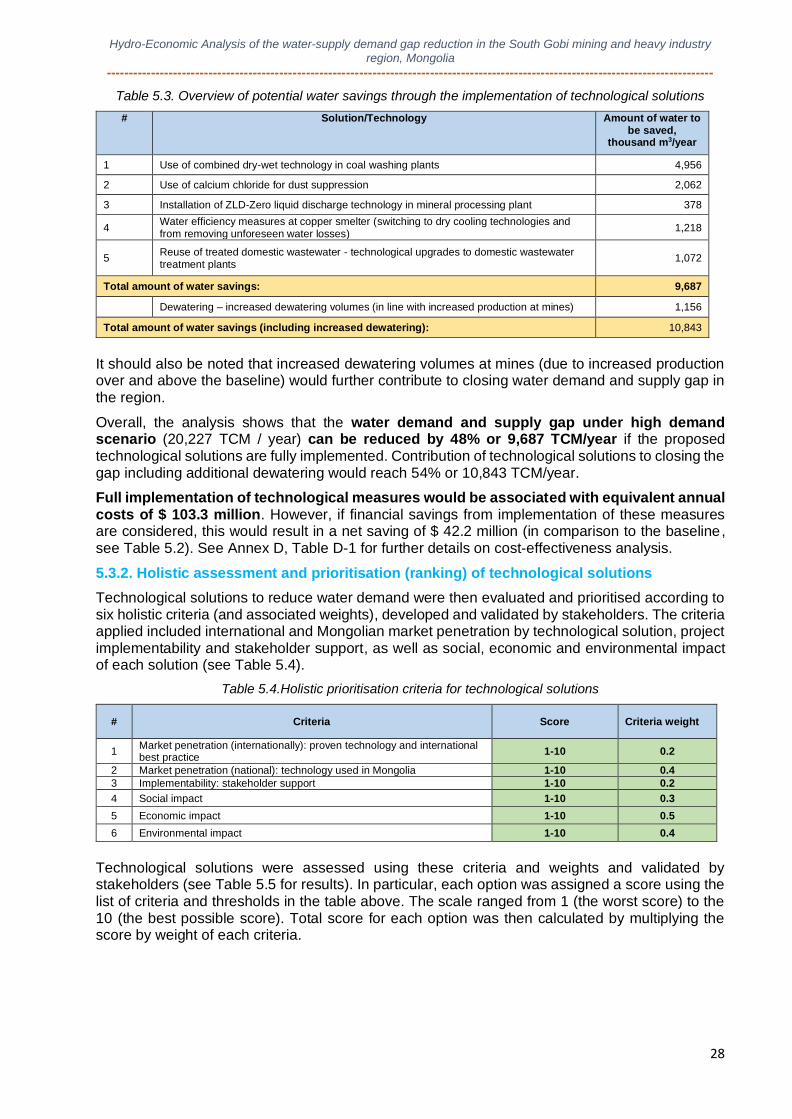
Hydro-Economic Analysis of the water-supply demand gap reduction in the South Gobi mining and heavy industry
region, Mongolia
-----------------------------------------------------------------------------------------------------------------------------------------
28
Table 5.3. Overview of potential water savings through the implementation of technological solutions
#
Solution/Technology Amount of water to be saved,
thousand m3/year
1 Use of combined dry-wet technology in coal washing plants 4,956
2 Use of calcium chloride for dust suppression 2,062
3 Installation of ZLD-Zero liquid discharge technology in mineral processing plant 378
4 Water efficiency measures at copper smelter (switching to dry cooling technologies and from removing unforeseen water losses)
1,218
5 Reuse of treated domestic wastewater - technological upgrades to domestic wastewater treatment plants
1,072
Total amount of water savings: 9,687
Dewatering – increased dewatering volumes (in line with increased production at mines) 1,156
Total amount of water savings (including increased dewatering): 10,843
It should also be noted that increased dewatering volumes at mines (due to increased production over and above the baseline) would further contribute to closing water demand and supply gap in the region.
Overall, the analysis shows that the water demand and supply gap under high demand scenario (20,227 TCM / year) can be reduced by 48% or 9,687 TCM/year if the proposed technological solutions are fully implemented. Contribution of technological solutions to closing the gap including additional dewatering would reach 54% or 10,843 TCM/year.
Full implementation of technological measures would be associated with equivalent annual costs of $ 103.3 million. However, if financial savings from implementation of these measures are considered, this would result in a net saving of $ 42.2 million (in comparison to the baseline, see Table 5.2). See Annex D, Table D-1 for further details on cost-effectiveness analysis.
5.3.2. Holistic assessment and prioritisation (ranking) of technological solutions
Technological solutions to reduce water demand were then evaluated and prioritised according to six holistic criteria (and associated weights), developed and validated by stakeholders. The criteria applied included international and Mongolian market penetration by technological solution, project implementability and stakeholder support, as well as social, economic and environmental impact of each solution (see Table 5.4).
Table 5.4.Holistic prioritisation criteria for technological solutions
# Criteria Score Criteria weight
1 Market penetration (internationally): proven technology and international best practice
1-10 0.2
2 Market penetration (national): technology used in Mongolia 1-10 0.4
3 Implementability: stakeholder support 1-10 0.2
4 Social impact 1-10 0.3
5 Economic impact 1-10 0.5
6 Environmental impact 1-10 0.4
Technological solutions were assessed using these criteria and weights and validated by stakeholders (see Table 5.5 for results). In particular, each option was assigned a score using the list of criteria and thresholds in the table above. The scale ranged from 1 (the worst score) to the 10 (the best possible score). Total score for each option was then calculated by multiplying the score by weight of each criteria.
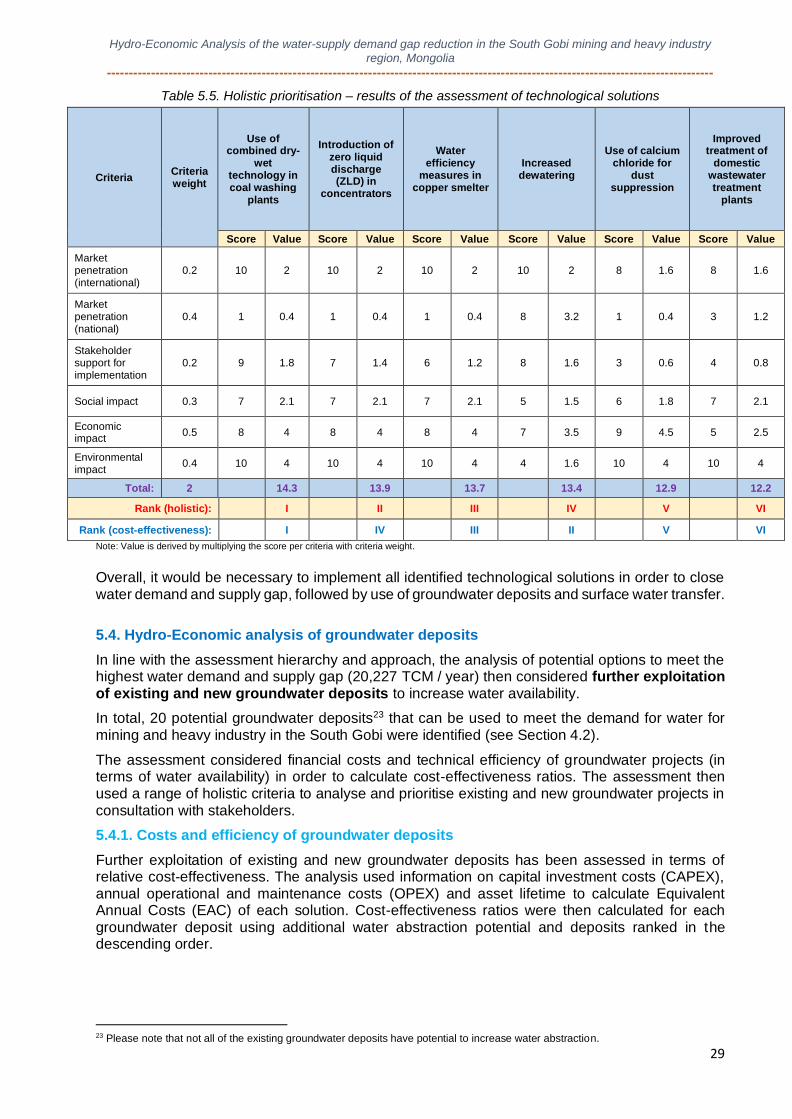
Hydro-Economic Analysis of the water-supply demand gap reduction in the South Gobi mining and heavy industry
region, Mongolia
-----------------------------------------------------------------------------------------------------------------------------------------
29
Table 5.5. Holistic prioritisation – results of the assessment of technological solutions
Criteria Criteria weight
Use of combined dry-
wet technology in coal washing
plants
Introduction of zero liquid discharge (ZLD) in
concentrators
Water efficiency
measures in copper smelter
Increased dewatering
Use of calcium chloride for
dust suppression
Improved treatment of
domestic wastewater treatment
plants
Score Value Score Value Score Value Score Value Score Value Score Value
Market penetration (international)
0.2 10 2 10 2 10 2 10 2 8 1.6 8 1.6
Market penetration (national)
0.4 1 0.4 1 0.4 1 0.4 8 3.2 1 0.4 3 1.2
Stakeholder support for implementation
0.2 9 1.8 7 1.4 6 1.2 8 1.6 3 0.6 4 0.8
Social impact 0.3 7 2.1 7 2.1 7 2.1 5 1.5 6 1.8 7 2.1
Economic impact
0.5 8 4 8 4 8 4 7 3.5 9 4.5 5 2.5
Environmental impact
0.4 10 4 10 4 10 4 4 1.6 10 4 10 4
Total: 2 14.3 13.9 13.7 13.4 12.9 12.2
Rank (holistic): I II III IV V VI
Rank (cost-effectiveness): I IV III II V VI
Note: Value is derived by multiplying the score per criteria with criteria weight.
Overall, it would be necessary to implement all identified technological solutions in order to close water demand and supply gap, followed by use of groundwater deposits and surface water transfer.
5.4. Hydro-Economic analysis of groundwater deposits
In line with the assessment hierarchy and approach, the analysis of potential options to meet the highest water demand and supply gap (20,227 TCM / year) then considered further exploitation of existing and new groundwater deposits to increase water availability.
In total, 20 potential groundwater deposits23 that can be used to meet the demand for water for mining and heavy industry in the South Gobi were identified (see Section 4.2).
The assessment considered financial costs and technical efficiency of groundwater projects (in terms of water availability) in order to calculate cost-effectiveness ratios. The assessment then used a range of holistic criteria to analyse and prioritise existing and new groundwater projects in consultation with stakeholders.
5.4.1. Costs and efficiency of groundwater deposits
Further exploitation of existing and new groundwater deposits has been assessed in terms of relative cost-effectiveness. The analysis used information on capital investment costs (CAPEX), annual operational and maintenance costs (OPEX) and asset lifetime to calculate Equivalent Annual Costs (EAC) of each solution. Cost-effectiveness ratios were then calculated for each groundwater deposit using additional water abstraction potential and deposits ranked in the descending order.
23 Please note that not all of the existing groundwater deposits have potential to increase water abstraction.
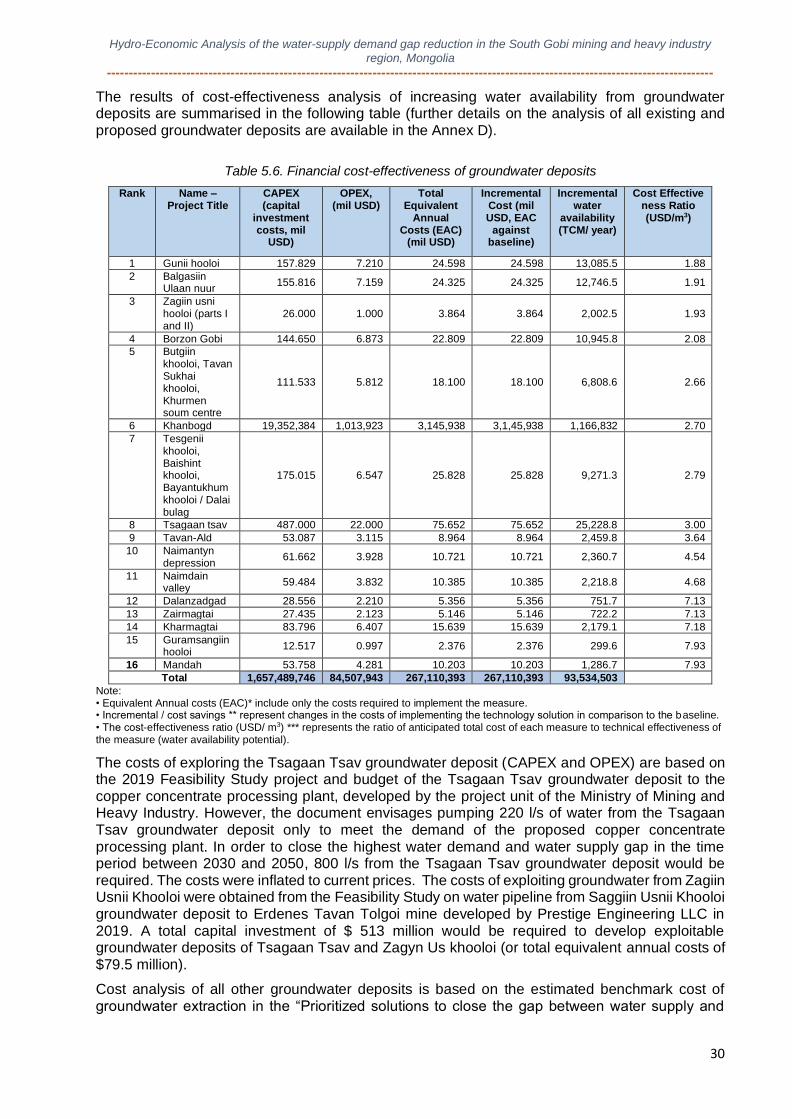
Hydro-Economic Analysis of the water-supply demand gap reduction in the South Gobi mining and heavy industry
region, Mongolia
-----------------------------------------------------------------------------------------------------------------------------------------
30
The results of cost-effectiveness analysis of increasing water availability from groundwater deposits are summarised in the following table (further details on the analysis of all existing and proposed groundwater deposits are available in the Annex D).
Table 5.6. Financial cost-effectiveness of groundwater deposits
Rank Name – Project Title
CAPEX (capital
investment costs, mil
USD)
OPEX, (mil USD)
Total Equivalent
Annual Costs (EAC)
(mil USD)
Incremental Cost (mil USD, EAC
against baseline)
Incremental water
availability (TCM/ year)
Cost Effective ness Ratio (USD/m3)
1 Gunii hooloi 157.829 7.210 24.598 24.598 13,085.5 1.88
2 Balgasiin Ulaan nuur
155.816 7.159 24.325 24.325 12,746.5 1.91
3 Zagiin usni hooloi (parts I and II)
26.000 1.000 3.864 3.864 2,002.5 1.93
4 Borzon Gobi 144.650 6.873 22.809 22.809 10,945.8 2.08
5 Butgiin khooloi, Tavan Sukhai khooloi, Khurmen soum centre
111.533 5.812 18.100 18.100 6,808.6 2.66
6 Khanbogd 19,352,384 1,013,923 3,145,938 3,1,45,938 1,166,832 2.70
7 Tesgenii khooloi, Baishint khooloi, Bayantukhum khooloi / Dalai bulag
175.015 6.547 25.828 25.828 9,271.3 2.79
8 Tsagaan tsav 487.000 22.000 75.652 75.652 25,228.8 3.00
9 Tavan-Ald 53.087 3.115 8.964 8.964 2,459.8 3.64
10 Naimantyn depression
61.662 3.928 10.721 10.721 2,360.7 4.54
11 Naimdain valley
59.484 3.832 10.385 10.385 2,218.8 4.68
12 Dalanzadgad 28.556 2.210 5.356 5.356 751.7 7.13
13 Zairmagtai 27.435 2.123 5.146 5.146 722.2 7.13
14 Kharmagtai 83.796 6.407 15.639 15.639 2,179.1 7.18
15 Guramsangiin hooloi
12.517 0.997 2.376 2.376 299.6 7.93
16 Mandah 53.758 4.281 10.203 10.203 1,286.7 7.93
Total 1,657,489,746 84,507,943 267,110,393 267,110,393 93,534,503
Note: • Equivalent Annual costs (EAC)* include only the costs required to implement the measure. • Incremental / cost savings ** represent changes in the costs of implementing the technology solution in comparison to the baseline. • The cost-effectiveness ratio (USD/ m3) *** represents the ratio of anticipated total cost of each measure to technical effectiveness of the measure (water availability potential).
The costs of exploring the Tsagaan Tsav groundwater deposit (CAPEX and OPEX) are based on the 2019 Feasibility Study project and budget of the Tsagaan Tsav groundwater deposit to the copper concentrate processing plant, developed by the project unit of the Ministry of Mining and Heavy Industry. However, the document envisages pumping 220 l/s of water from the Tsagaan Tsav groundwater deposit only to meet the demand of the proposed copper concentrate processing plant. In order to close the highest water demand and water supply gap in the time period between 2030 and 2050, 800 l/s from the Tsagaan Tsav groundwater deposit would be required. The costs were inflated to current prices. The costs of exploiting groundwater from Zagiin Usnii Khooloi were obtained from the Feasibility Study on water pipeline from Saggiin Usnii Khooloi groundwater deposit to Erdenes Tavan Tolgoi mine developed by Prestige Engineering LLC in 2019. A total capital investment of $ 513 million would be required to develop exploitable groundwater deposits of Tsagaan Tsav and Zagyn Us khooloi (or total equivalent annual costs of $79.5 million).
Cost analysis of all other groundwater deposits is based on the estimated benchmark cost of groundwater extraction in the “Prioritized solutions to close the gap between water supply and
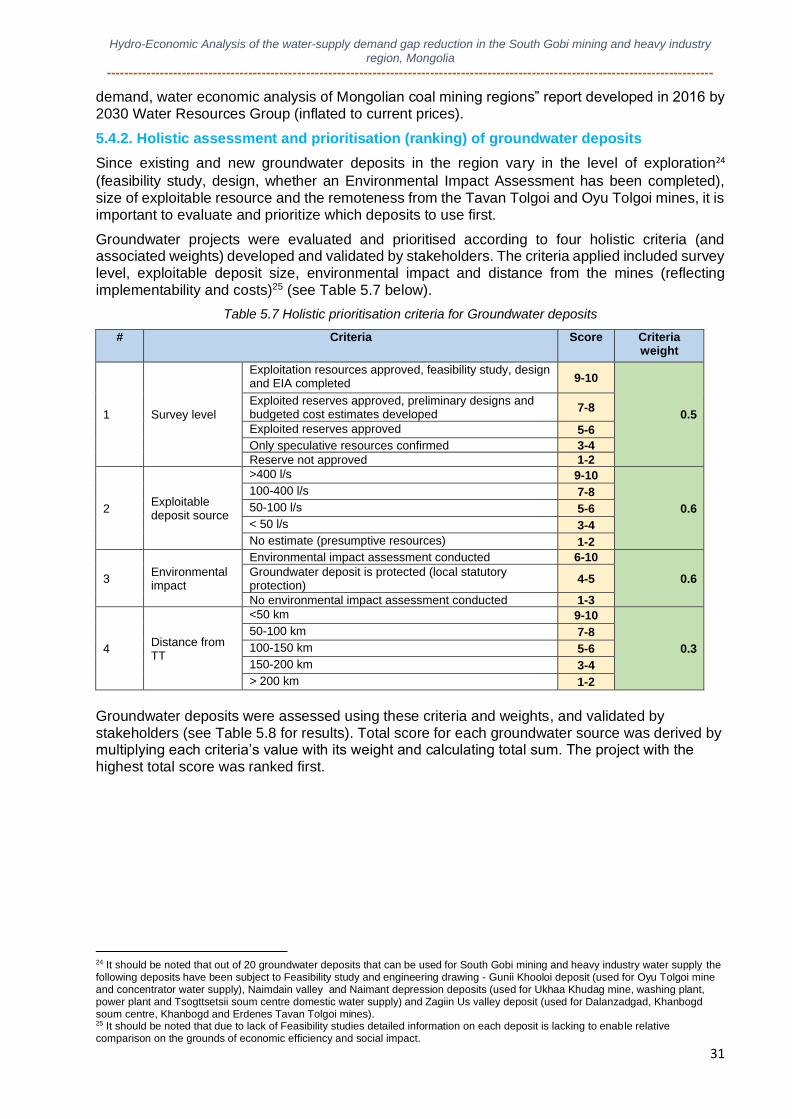
Hydro-Economic Analysis of the water-supply demand gap reduction in the South Gobi mining and heavy industry
region, Mongolia
-----------------------------------------------------------------------------------------------------------------------------------------
31
demand, water economic analysis of Mongolian coal mining regions” report developed in 2016 by 2030 Water Resources Group (inflated to current prices).
5.4.2. Holistic assessment and prioritisation (ranking) of groundwater deposits
Since existing and new groundwater deposits in the region vary in the level of exploration24
(feasibility study, design, whether an Environmental Impact Assessment has been completed), size of exploitable resource and the remoteness from the Tavan Tolgoi and Oyu Tolgoi mines, it is important to evaluate and prioritize which deposits to use first.
Groundwater projects were evaluated and prioritised according to four holistic criteria (and associated weights) developed and validated by stakeholders. The criteria applied included survey level, exploitable deposit size, environmental impact and distance from the mines (reflecting implementability and costs)25 (see Table 5.7 below).
Table 5.7 Holistic prioritisation criteria for Groundwater deposits
# Criteria Score Criteria weight
1 Survey level
Exploitation resources approved, feasibility study, design and EIA completed 9-10
0.5 Exploited reserves approved, preliminary designs and budgeted cost estimates developed
7-8
Exploited reserves approved 5-6
Only speculative resources confirmed 3-4
Reserve not approved 1-2
2 Exploitable deposit source
>400 l/s 9-10
0.6
100-400 l/s 7-8
50-100 l/s 5-6
< 50 l/s 3-4
No estimate (presumptive resources) 1-2
3 Environmental impact
Environmental impact assessment conducted 6-10
0.6 Groundwater deposit is protected (local statutory protection)
4-5
No environmental impact assessment conducted 1-3
4 Distance from TT
<50 km 9-10
0.3
50-100 km 7-8
100-150 km 5-6
150-200 km 3-4
> 200 km 1-2
Groundwater deposits were assessed using these criteria and weights, and validated by stakeholders (see Table 5.8 for results). Total score for each groundwater source was derived by multiplying each criteria’s value with its weight and calculating total sum. The project with the highest total score was ranked first.
24 It should be noted that out of 20 groundwater deposits that can be used for South Gobi mining and heavy industry water supply the following deposits have been subject to Feasibility study and engineering drawing - Gunii Khooloi deposit (used for Oyu Tolgoi mine and concentrator water supply), Naimdain valley and Naimant depression deposits (used for Ukhaa Khudag mine, washing plant, power plant and Tsogttsetsii soum centre domestic water supply) and Zagiin Us valley deposit (used for Dalanzadgad, Khanbogd soum centre, Khanbogd and Erdenes Tavan Tolgoi mines). 25 It should be noted that due to lack of Feasibility studies detailed information on each deposit is lacking to enable relative comparison on the grounds of economic efficiency and social impact.
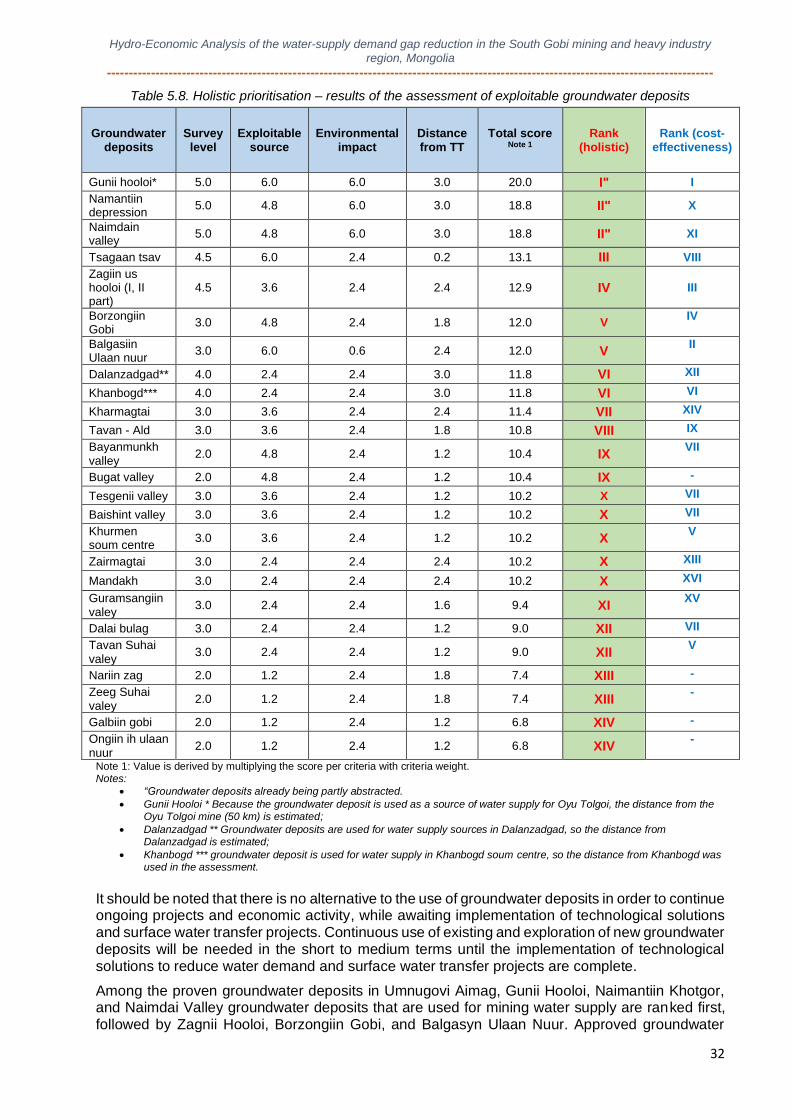
Hydro-Economic Analysis of the water-supply demand gap reduction in the South Gobi mining and heavy industry
region, Mongolia
-----------------------------------------------------------------------------------------------------------------------------------------
32
Table 5.8. Holistic prioritisation – results of the assessment of exploitable groundwater deposits
Groundwater deposits
Survey level
Exploitable source
Environmental impact
Distance from TT
Total score Note 1
Rank (holistic)
Rank (cost-effectiveness)
Gunii hooloi* 5.0 6.0 6.0 3.0 20.0 I" I
Namantiin depression
5.0 4.8 6.0 3.0 18.8 II" X
Naimdain valley
5.0 4.8 6.0 3.0 18.8 II" XI
Tsagaan tsav 4.5 6.0 2.4 0.2 13.1 III VIII
Zagiin us hooloi (I, II part)
4.5 3.6 2.4 2.4 12.9 IV III
Borzongiin Gobi
3.0 4.8 2.4 1.8 12.0 V IV
Balgasiin Ulaan nuur
3.0 6.0 0.6 2.4 12.0 V II
Dalanzadgad** 4.0 2.4 2.4 3.0 11.8 VI XII
Khanbogd*** 4.0 2.4 2.4 3.0 11.8 VI VI
Kharmagtai 3.0 3.6 2.4 2.4 11.4 VII XIV
Tavan - Ald 3.0 3.6 2.4 1.8 10.8 VIII IX
Bayanmunkh valley
2.0 4.8 2.4 1.2 10.4 IX VII
Bugat valley 2.0 4.8 2.4 1.2 10.4 IX -
Tesgenii valley 3.0 3.6 2.4 1.2 10.2 X VII
Baishint valley 3.0 3.6 2.4 1.2 10.2 X VII
Khurmen soum centre
3.0 3.6 2.4 1.2 10.2 X V
Zairmagtai 3.0 2.4 2.4 2.4 10.2 X XIII
Mandakh 3.0 2.4 2.4 2.4 10.2 X XVI
Guramsangiin valey
3.0 2.4 2.4 1.6 9.4 XI XV
Dalai bulag 3.0 2.4 2.4 1.2 9.0 XII VII
Tavan Suhai valey
3.0 2.4 2.4 1.2 9.0 XII V
Nariin zag 2.0 1.2 2.4 1.8 7.4 XIII -
Zeeg Suhai valey
2.0 1.2 2.4 1.8 7.4 XIII -
Galbiin gobi 2.0 1.2 2.4 1.2 6.8 XIV -
Ongiin ih ulaan nuur
2.0 1.2 2.4 1.2 6.8 XIV -
Note 1: Value is derived by multiplying the score per criteria with criteria weight. Notes:
• “Groundwater deposits already being partly abstracted.
• Gunii Hooloi * Because the groundwater deposit is used as a source of water supply for Oyu Tolgoi, the distance from the Oyu Tolgoi mine (50 km) is estimated;
• Dalanzadgad ** Groundwater deposits are used for water supply sources in Dalanzadgad, so the distance from Dalanzadgad is estimated;
• Khanbogd *** groundwater deposit is used for water supply in Khanbogd soum centre, so the distance from Khanbogd was used in the assessment.
It should be noted that there is no alternative to the use of groundwater deposits in order to continue ongoing projects and economic activity, while awaiting implementation of technological solutions and surface water transfer projects. Continuous use of existing and exploration of new groundwater deposits will be needed in the short to medium terms until the implementation of technological solutions to reduce water demand and surface water transfer projects are complete.
Among the proven groundwater deposits in Umnugovi Aimag, Gunii Hooloi, Naimantiin Khotgor, and Naimdai Valley groundwater deposits that are used for mining water supply are ranked first, followed by Zagnii Hooloi, Borzongiin Gobi, and Balgasyn Ulaan Nuur. Approved groundwater
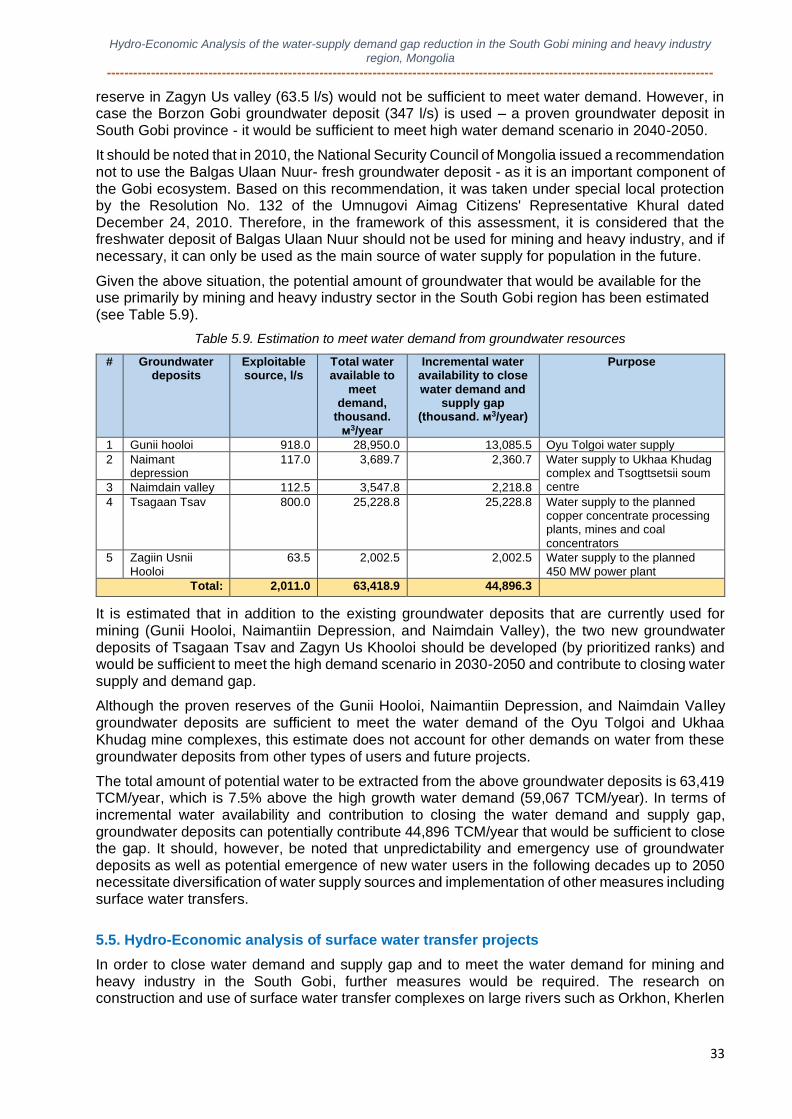
Hydro-Economic Analysis of the water-supply demand gap reduction in the South Gobi mining and heavy industry
region, Mongolia
-----------------------------------------------------------------------------------------------------------------------------------------
33
reserve in Zagyn Us valley (63.5 l/s) would not be sufficient to meet water demand. However, in case the Borzon Gobi groundwater deposit (347 l/s) is used – a proven groundwater deposit in South Gobi province - it would be sufficient to meet high water demand scenario in 2040-2050.
It should be noted that in 2010, the National Security Council of Mongolia issued a recommendation not to use the Balgas Ulaan Nuur- fresh groundwater deposit - as it is an important component of the Gobi ecosystem. Based on this recommendation, it was taken under special local protection by the Resolution No. 132 of the Umnugovi Aimag Citizens' Representative Khural dated December 24, 2010. Therefore, in the framework of this assessment, it is considered that the freshwater deposit of Balgas Ulaan Nuur should not be used for mining and heavy industry, and if necessary, it can only be used as the main source of water supply for population in the future.
Given the above situation, the potential amount of groundwater that would be available for the use primarily by mining and heavy industry sector in the South Gobi region has been estimated (see Table 5.9).
Table 5.9. Estimation to meet water demand from groundwater resources
# Groundwater deposits
Exploitable source, l/s
Total water available to
meet demand,
thousand. м3/year
Incremental water availability to close water demand and
supply gap (thousand. м3/year)
Purpose
1 Gunii hooloi 918.0 28,950.0 13,085.5 Oyu Tolgoi water supply
2 Naimant depression
117.0 3,689.7 2,360.7 Water supply to Ukhaa Khudag complex and Tsogttsetsii soum centre 3 Naimdain valley 112.5 3,547.8 2,218.8
4 Tsagaan Tsav 800.0 25,228.8 25,228.8 Water supply to the planned copper concentrate processing plants, mines and coal concentrators
5 Zagiin Usnii Hooloi
63.5 2,002.5 2,002.5 Water supply to the planned 450 MW power plant
Total: 2,011.0 63,418.9 44,896.3
It is estimated that in addition to the existing groundwater deposits that are currently used for mining (Gunii Hooloi, Naimantiin Depression, and Naimdain Valley), the two new groundwater deposits of Tsagaan Tsav and Zagyn Us Khooloi should be developed (by prioritized ranks) and would be sufficient to meet the high demand scenario in 2030-2050 and contribute to closing water supply and demand gap.
Although the proven reserves of the Gunii Hooloi, Naimantiin Depression, and Naimdain Valley groundwater deposits are sufficient to meet the water demand of the Oyu Tolgoi and Ukhaa Khudag mine complexes, this estimate does not account for other demands on water from these groundwater deposits from other types of users and future projects.
The total amount of potential water to be extracted from the above groundwater deposits is 63,419 TCM/year, which is 7.5% above the high growth water demand (59,067 TCM/year). In terms of incremental water availability and contribution to closing the water demand and supply gap, groundwater deposits can potentially contribute 44,896 TCM/year that would be sufficient to close the gap. It should, however, be noted that unpredictability and emergency use of groundwater deposits as well as potential emergence of new water users in the following decades up to 2050 necessitate diversification of water supply sources and implementation of other measures including surface water transfers.
5.5. Hydro-Economic analysis of surface water transfer projects
In order to close water demand and supply gap and to meet the water demand for mining and heavy industry in the South Gobi, further measures would be required. The research on construction and use of surface water transfer complexes on large rivers such as Orkhon, Kherlen
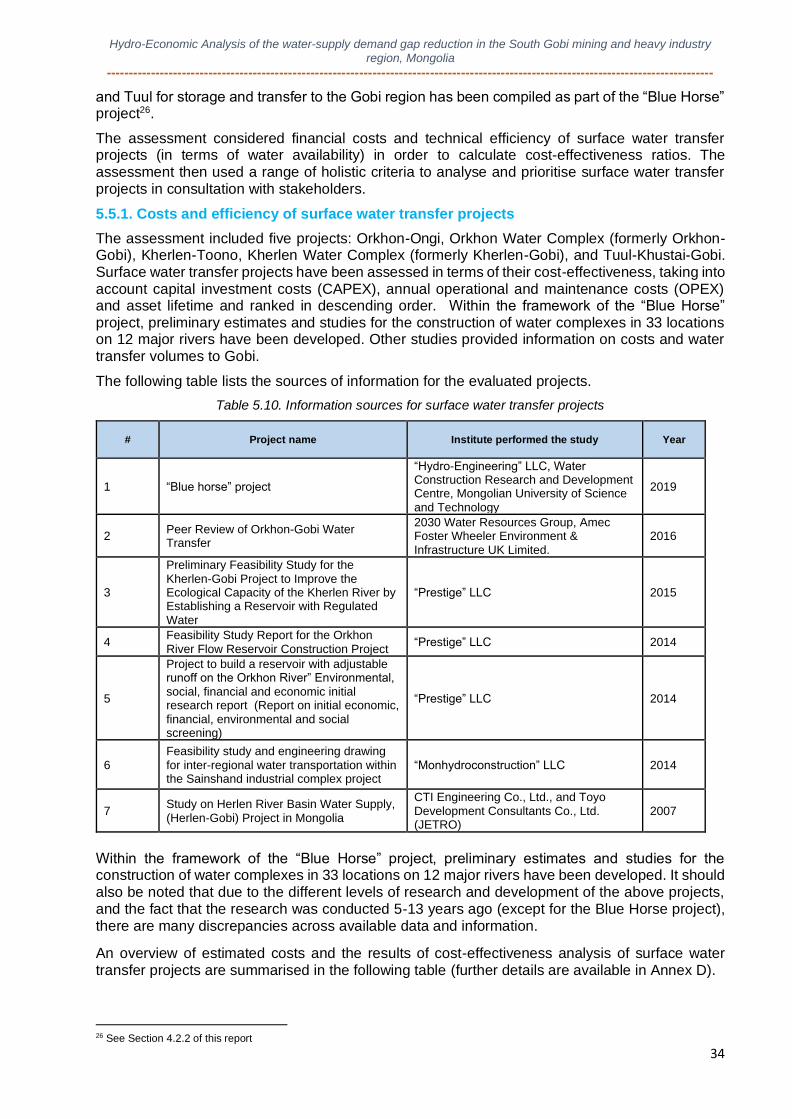
Hydro-Economic Analysis of the water-supply demand gap reduction in the South Gobi mining and heavy industry
region, Mongolia
-----------------------------------------------------------------------------------------------------------------------------------------
34
and Tuul for storage and transfer to the Gobi region has been compiled as part of the “Blue Horse” project26.
The assessment considered financial costs and technical efficiency of surface water transfer projects (in terms of water availability) in order to calculate cost-effectiveness ratios. The assessment then used a range of holistic criteria to analyse and prioritise surface water transfer projects in consultation with stakeholders.
5.5.1. Costs and efficiency of surface water transfer projects
The assessment included five projects: Orkhon-Ongi, Orkhon Water Complex (formerly Orkhon-Gobi), Kherlen-Toono, Kherlen Water Complex (formerly Kherlen-Gobi), and Tuul-Khustai-Gobi. Surface water transfer projects have been assessed in terms of their cost-effectiveness, taking into account capital investment costs (CAPEX), annual operational and maintenance costs (OPEX) and asset lifetime and ranked in descending order. Within the framework of the “Blue Horse” project, preliminary estimates and studies for the construction of water complexes in 33 locations on 12 major rivers have been developed. Other studies provided information on costs and water transfer volumes to Gobi.
The following table lists the sources of information for the evaluated projects.
Table 5.10. Information sources for surface water transfer projects
# Project name Institute performed the study Year
1 “Blue horse” project
“Hydro-Engineering” LLC, Water Construction Research and Development Centre, Mongolian University of Science and Technology
2019
2 Peer Review of Orkhon-Gobi Water Transfer
2030 Water Resources Group, Amec Foster Wheeler Environment & Infrastructure UK Limited.
2016
3
Preliminary Feasibility Study for the Kherlen-Gobi Project to Improve the Ecological Capacity of the Kherlen River by Establishing a Reservoir with Regulated Water
“Prestige” LLC 2015
4 Feasibility Study Report for the Orkhon River Flow Reservoir Construction Project
“Prestige” LLC 2014
5
Project to build a reservoir with adjustable runoff on the Orkhon River” Environmental, social, financial and economic initial research report (Report on initial economic, financial, environmental and social screening)
“Prestige” LLC 2014
6 Feasibility study and engineering drawing for inter-regional water transportation within the Sainshand industrial complex project
“Monhydroconstruction” LLC 2014
7 Study on Herlen River Basin Water Supply, (Herlen-Gobi) Project in Mongolia
CTI Engineering Co., Ltd., and Toyo Development Consultants Co., Ltd. (JETRO)
2007
Within the framework of the “Blue Horse” project, preliminary estimates and studies for the construction of water complexes in 33 locations on 12 major rivers have been developed. It should also be noted that due to the different levels of research and development of the above projects, and the fact that the research was conducted 5-13 years ago (except for the Blue Horse project), there are many discrepancies across available data and information.
An overview of estimated costs and the results of cost-effectiveness analysis of surface water transfer projects are summarised in the following table (further details are available in Annex D).
26 See Section 4.2.2 of this report
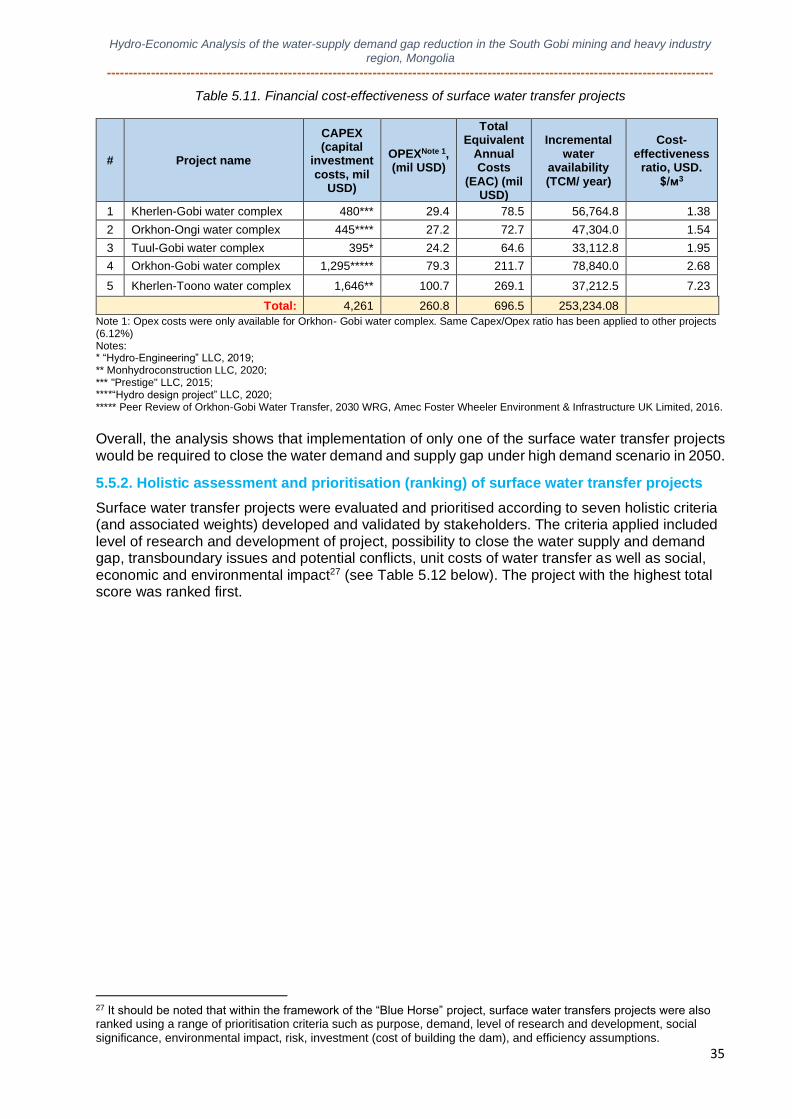
Hydro-Economic Analysis of the water-supply demand gap reduction in the South Gobi mining and heavy industry
region, Mongolia
-----------------------------------------------------------------------------------------------------------------------------------------
35
Table 5.11. Financial cost-effectiveness of surface water transfer projects
# Project name
CAPEX (capital
investment costs, mil
USD)
OPEXNote 1, (mil USD)
Total Equivalent
Annual Costs
(EAC) (mil USD)
Incremental water
availability (TCM/ year)
Cost-effectiveness
ratio, USD. $/м3
1 Kherlen-Gobi water complex 480*** 29.4 78.5 56,764.8 1.38
2 Orkhon-Ongi water complex 445**** 27.2 72.7 47,304.0 1.54
3 Tuul-Gobi water complex 395* 24.2 64.6 33,112.8 1.95
4 Orkhon-Gobi water complex 1,295***** 79.3 211.7 78,840.0 2.68
5 Kherlen-Toono water complex 1,646** 100.7 269.1 37,212.5 7.23
Total: 4,261 260.8 696.5 253,234.08
Note 1: Opex costs were only available for Orkhon- Gobi water complex. Same Capex/Opex ratio has been applied to other projects (6.12%) Notes: * “Hydro-Engineering” LLC, 2019; ** Monhydroconstruction LLC, 2020; *** "Prestige" LLC, 2015; ****“Hydro design project” LLC, 2020; ***** Peer Review of Orkhon-Gobi Water Transfer, 2030 WRG, Amec Foster Wheeler Environment & Infrastructure UK Limited, 2016.
Overall, the analysis shows that implementation of only one of the surface water transfer projects would be required to close the water demand and supply gap under high demand scenario in 2050.
5.5.2. Holistic assessment and prioritisation (ranking) of surface water transfer projects
Surface water transfer projects were evaluated and prioritised according to seven holistic criteria (and associated weights) developed and validated by stakeholders. The criteria applied included level of research and development of project, possibility to close the water supply and demand gap, transboundary issues and potential conflicts, unit costs of water transfer as well as social, economic and environmental impact27 (see Table 5.12 below). The project with the highest total score was ranked first.
27 It should be noted that within the framework of the “Blue Horse” project, surface water transfers projects were also ranked using a range of prioritisation criteria such as purpose, demand, level of research and development, social significance, environmental impact, risk, investment (cost of building the dam), and efficiency assumptions.
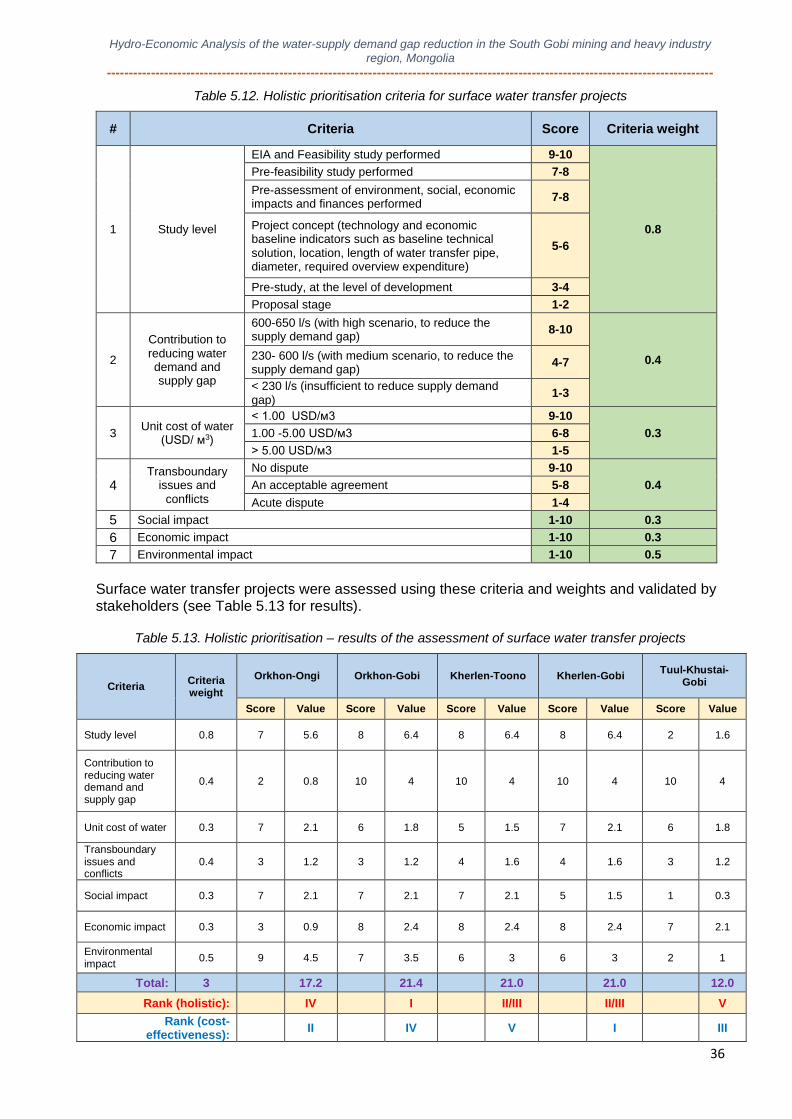
Hydro-Economic Analysis of the water-supply demand gap reduction in the South Gobi mining and heavy industry
region, Mongolia
-----------------------------------------------------------------------------------------------------------------------------------------
36
Table 5.12. Holistic prioritisation criteria for surface water transfer projects
# Criteria Score Criteria weight
1 Study level
EIA and Feasibility study performed 9-10
0.8
Pre-feasibility study performed 7-8
Pre-assessment of environment, social, economic impacts and finances performed
7-8
Project concept (technology and economic baseline indicators such as baseline technical solution, location, length of water transfer pipe, diameter, required overview expenditure)
5-6
Pre-study, at the level of development 3-4
Proposal stage 1-2
2
Contribution to reducing water demand and supply gap
600-650 l/s (with high scenario, to reduce the supply demand gap)
8-10
0.4 230- 600 l/s (with medium scenario, to reduce the supply demand gap)
4-7
< 230 l/s (insufficient to reduce supply demand gap)
1-3
3 Unit cost of water
(USD/ м3)
< 1.00 USD/м3 9-10
0.3 1.00 -5.00 USD/м3 6-8
> 5.00 USD/м3 1-5
4 Transboundary
issues and conflicts
No dispute 9-10
0.4 An acceptable agreement 5-8
Acute dispute 1-4
5 Social impact 1-10 0.3
6 Economic impact 1-10 0.3
7 Environmental impact 1-10 0.5
Surface water transfer projects were assessed using these criteria and weights and validated by stakeholders (see Table 5.13 for results).
Table 5.13. Holistic prioritisation – results of the assessment of surface water transfer projects
Criteria Criteria weight
Orkhon-Ongi Orkhon-Gobi Kherlen-Toono Kherlen-Gobi Tuul-Khustai-
Gobi
Score Value Score Value Score Value Score Value Score Value
Study level 0.8 7 5.6 8 6.4 8 6.4 8 6.4 2 1.6
Contribution to reducing water demand and supply gap
0.4 2 0.8 10 4 10 4 10 4 10 4
Unit cost of water 0.3 7 2.1 6 1.8 5 1.5 7 2.1 6 1.8
Transboundary issues and conflicts
0.4 3 1.2 3 1.2 4 1.6 4 1.6 3 1.2
Social impact 0.3 7 2.1 7 2.1 7 2.1 5 1.5 1 0.3
Economic impact 0.3 3 0.9 8 2.4 8 2.4 8 2.4 7 2.1
Environmental impact
0.5 9 4.5 7 3.5 6 3 6 3 2 1
Total: 3 17.2 21.4 21.0 21.0 12.0
Rank (holistic): IV I II/III II/III V
Rank (cost-effectiveness):
II IV V I III
Hydro-Economic Analysis of the water-supply demand gap reduction in the South Gobi mining and heavy industry
region, Mongolia
-----------------------------------------------------------------------------------------------------------------------------------------
37
Based on the information provided in the Blue Horse project, it is possible to eliminate the high water demand gap (20,227 TCM/year) by implementing only one of these 5 projects.
Implementation of Orkhon-Gobi surface water transfer project (rank #1) would be associated with equivalent annual costs of $ 211.7 million. See Annex D, Table D-1 for further details on cost-effectiveness analysis.
Hydro-Economic Analysis of the water-supply demand gap reduction in the South Gobi mining and heavy industry
region, Mongolia
-----------------------------------------------------------------------------------------------------------------------------------------
38
6. HYDROECONOMIC ANALYSIS RESULTS AND RECOMMENDED ACTIONS
6.1. The main results of the water demand-water supply assessment
6.1.1 Scope of assessment
• As of 2019, a total of 13 mining licenses have been issued in the Tavan Tolgoi and Oyu Tolgoi regions and its 8 licenses are operationalized by companies including “Oyu Tolgoi” LLC, “Erdenes Tavan Tolgoi” JSC, “Tavan Tolgoi” JSC, “Energy Resource” LLC, “Khangad Exploration” LLC. The remaining 5 license areas are planned to be exploited;
• A total of 19 major projects were identified and include:
o Eight coal mines: five are in operation (Tsankhiin Baruun, Tsankhiin Zuun, Ukhaa Khudag, Baruun Naran, Tavan Tolgoi); and three are planned (Bor Teeg, Tsaikhar Khudag, Gashuun-Ovoo);
o Four coal washing plants: of which one is in use (Ukhaa Khudag) and three are planned (Erdenes Tavan Tolgoi x 2, Tavan Tolgoi x1);
o Three gold-copper mines: one is in operation (Oyu Tolgoi open pit mine) and two are planned (Oyu Tolgoi underground mine, Kharmagtai);
o Existing copper concentrator: (Oyu Tolgoi concentrator);
o Planned copper smelter: planned in Oyu Tolgoi;
o Two power plants: of which one is in operation (Ukhaa Khudag) and one is planned (Tavan Tolgoi).
6.1.2 Water demand assessment:
• Total water use in the study area in 2019 was 24,524 TCM (778 l/s), of which: 78.3% was used for mining, 14.7% for livestock, 3.6% for irrigated agriculture, 2.1% for drinking water supply and the remaining 1.3 % for social services, food production, and power plant water use.
• The high demand scenario will reach 59,067 TCM in 2040, which is 2.4 times higher than in 2019. It is estimated that the highest gap between water demand and water supply will reach 20,227 TCM.
6.1.3 Concepts to reduce water demand and increase water supply in the mining and heavy industry areas of the South Gobi:
• Research and evaluation work to increase water supply in the South Gobi region has been carried out at various levels and across numerous projects and programs over the course of more than 20 years. However, no consensus has yet been reached with regard to what options should be implemented.
• As result, information discrepancies and misunderstandings surrounding “mining-water”, issue between local authorities, citizens, miners, governmental and non-governmental organizations and water scientists have been increasing over time.
• In order to resolve this issue in a timely manner, it is important to implement projects and solutions set out in the Section 5.2 in discussion and cooperation with the relevant parties.
6.1.4 Technological solutions to reduce water demand:
• Potential technological solutions to reduce water demand have been evaluated and prioritised according to six holistic criteria developed and validated by stakeholders. The criteria applied included international and Mongolian market penetration by technological solution, project implementability and stakeholder support as well as social, economic and environmental impact of each solution. Technological solutions assessed included:
o Use of dry-wet combined technology in coal washing plants;
Hydro-Economic Analysis of the water-supply demand gap reduction in the South Gobi mining and heavy industry
region, Mongolia
-----------------------------------------------------------------------------------------------------------------------------------------
39
o Use of dewatering (ZLD) technology at the Oyu Tolgoi concentrator and belt presses at planned coal washing plants;
o Introduction of water-saving technologies at the copper smelter;
o Use of calcium chloride for dust suppression;
o Measures to improve treatment levels at domestic wastewater treatment plants to enable increased reuse of treated wastewater.
• The analysis concluded that by fully implementing the above solutions to reduce water demand, it would be possible to save an average of 9,687 TCM per year and to reduce the water demand and supply gap (20,227 TCM per year) by 48%. Full implementation of technological measures would entail equivalent annual costs of $103 million.
• Furthermore, dewatering associated with increased production at the mines has a capacity to provide additional 1,156 TCM per year at zero costs.
6.1.5 Use of existing and new groundwater deposits to meet water demand:
• The analysis considered 20 potential groundwater deposits that can be used to meet the demand for water for mining and heavy industry in the South Gobi and contribute to closing water demand and supply gap. More specifically:
Meeting water demand for Oyu Tolgoi mine complex:
o According to the 2019 Water Use Report, Oyu Tolgoi LLC used an average of 454 l/s (excluding seepage and treated wastewater) from the Gunii Khooloi groundwater deposit, which is 49.5% of the approved groundwater resource. It is estimated that under the high growth scenario, demand will increase to an average of 684 l/s in 2040 with the commissioning of the underground mine. In March 2019, it increased to 655 l/s. Therefore, it should be carefully ensured that the maximum allowable water demand during the peak months of the year does not exceed the maximum abstraction level of 918 l/s;
Meeting water demand for Ukhaa Khudag mine complex:
o Energy Resource LLC used an average of 78 l/s of groundwater from the Naimantiin Depression and Naimdai Valley, which is 34% of the approved groundwater resources. In the future, depending on the capacity of the coal washing plant, under the high growth scenario water demand is expected to increase to an average of 123 l/s in 2040. Water demand at the Ukhaa Khudag mine complex and the Tsogttsetsii soum centre fluctuates significantly throughout the year, but overall, Ukhaa Khudag complex has sufficient water resources for the high growth scenario until 2050.
o Although the proven reserves of the Gunii Hooloi, Naimantiin Depression, and Naimdain Valley groundwater deposits are sufficient to meet the water demand of the Oyu Tolgoi and Ukhaa Khudag mine complexes, this estimate does not account for other demands on water from these groundwater deposits from other types of users and future projects.
Meeting water demand at Erdenes Tavan Tolgoi mine complex:
o According to the 2019 Water Use Report, Erdenes Tavan Tolgoi LLC used an average of 11.58 l/s (excluding mine effluent and precipitation water) from 15 deep wells for water supply. With further expansion and commissioning of the coal washing plant, under the high growth scenario, demand is projected to increase sharply to an average of 443 l/s (including a 450 MW power plant) in 2040. As of September 2020, the source of water supply for the Erdenes Tavan Tolgoi mine complex has not been finalized. As a result of this assessment, it is estimated that two groundwater deposits, Tsagaan Tsav and Zagyn Usni Khooloi, could be exploited until the surface water transfer project is implemented. The exploration of
Hydro-Economic Analysis of the water-supply demand gap reduction in the South Gobi mining and heavy industry
region, Mongolia
-----------------------------------------------------------------------------------------------------------------------------------------
40
these two new sources would provide sufficient supply to meet the demand from Tavan Tolgoi mine.
o Prior to the implementation of the surface water transfer project, the proposed groundwater deposits (Tsagaan Tsav, Zagyn Usni Khooloi) can be exploited in order of priority, with a total estimated equivalent annual cost of $ 80 million.
o One of the important factors is maintaining the balance of the Gobi region's ecosystems. The region is under special local statutory protection as a source of water supply for the growing population due to the ongoing development, urbanization and settlement in the region. Therefore, the Balgas Ulaan Nuur fresh groundwater deposit is no longer suitable for mining and heavy industry water supply.
• Exploitation of existing and new groundwater deposits has been evaluated and prioritised according to four holistic criteria developed and validated by stakeholders. The criteria applied included survey level, exploitable deposit size, environmental impact and distance from the mines (reflecting implementability and costs).
• Use of top five ranking groundwater deposits (in accordance with holistic assessment) would contribute 63,419 TCM/year to meeting total water demand and 44,896 TCM/year to closing the water supply-demand gap. In particular, it is estimated that in addition to the existing groundwater deposits that are currently used for mining (Gunii Hooloi, Naimantiin Depression, and Naimdain Valley), the two new groundwater deposits of Tsagaan Tsav and Zagyn Us Khooloi should be developed (by prioritized ranks) and would be sufficient to meet the high demand scenario in 2030-2050 and contribute to closing water supply and demand gap.
• Use and further exploitation of these groundwater deposits (Gunii Hooloi, Naimantiin Depression, and Naimdain Valley Tsagaan Tsav and Zagyn Usni Khooloi) would be associated with an equivalent annual costs of $125 million.
• It should, however, be noted that unpredictability and emergency use of groundwater deposits as well as potential emergence of new water users in the following decades up to 2050 necessitate diversification of water supply sources and implementation of other measures including surface water transfers. In the short-term there is no alternative to the use of groundwater deposits in order to continue ongoing projects and economic activity while awaiting implementation of technological solutions and surface water transfer projects. Continuous use of existing and exploration of new groundwater deposits will be needed in the short to medium terms, until the implementation of technological solutions to reduce water demand and surface water transfer projects are completed.
6.1.6 Surface water transfer:
• Surface water transfer projects were evaluated and prioritised according to seven holistic criteria (and associated weights) developed and validated by stakeholders. The criteria applied included level of research and development of project, possibility to close the water supply and demand gap, transboundary issues and potential conflicts, unit costs of water transfer as well as social, economic and environmental impacts.
• The results of holistic prioritisation based on technical, economic, environmental and social criteria suggest that the “Orkhon Water Complex” (formerly known as Orkhon-Gobi) surface water transfer project represents the most viable option to meet the demand for water for mining and heavy industry in the South Gobi and contribute to closing water demand and supply gap. In particular, at an equivalent annual cost of $212 million, the project would
Hydro-Economic Analysis of the water-supply demand gap reduction in the South Gobi mining and heavy industry
region, Mongolia
-----------------------------------------------------------------------------------------------------------------------------------------
41
provide 78,840 TCM per year – over and above the highest water demand and supply gap of 20,227 TCM per year28.
• The results of holistic prioritisation show that Kherlen-Toono and Kherlen Water Complex (formerly Kherlen-Gobi) projects represent the second-best alternatives to the Orkhon Water Complex. These surface water transfer projects would provide 93,977 TCM per year at equivalent annual costs of $ 348 million. Within the framework of these projects, it is recommended to consolidate the previous research, design and evaluation works under the joint “Kherlen water complex” project and revise the integrated feasibility study building on cooperation of the initiators of these projects.
6.2. Factors for consideration
6.2.1 Decision-Makers
• The most important action for parties is to develop responsible mining as reflected in Mongolia's long-term development policy, “Sustainable Development Concept-2030” and “National Program for Heavy Industry Development”. The policies aim to inject large mining deposits into economic circulation, increase the level of mining of raw materials and generate value added in order to achieve the objectives of supporting economic development through mineral exploitation while ensuring sustainability of production and water supply sources.
• The Government is recommended to employ a diverse range of policy measures for promoting rational water use, reducing water demand and increasing water supply for mining and heavy industry in the South Gobi region in order to close the water supply and demand gap. These include the promotion of Best Available Technologies (BAT) including through water use permits mandating water-saving, water reuse technologies and economic instruments, such as incentive water pricing and tariffs for water use, preferential loans, tax incentives for water-efficient technologies etc.
• Based on 2019 performance, the companies operating in the Tavan Tolgoi and Oyu Tolgoi regions collected MNT 17.6 billion of revenue from water use fees. Under the Law on Natural Resource Use Fees, at least 35% of this revenue should be spent on implementing solutions to reduce water demand or increase water supply. It is important that this action is carried through and it is recommended that this is increased to 55%.
6.2.2 Project implementers and investors:
• The key action for companies and investors in the mining and heavy industry sector is to provide the funding to implement the proposed measures to reduce water demand and that this happens in a timely manner.
• It is important to increase the awareness of water saving technologies that are considered as best practice and that these are adopted by the mining and heavy industry sector. Improved capacity building, and regular discussions between relevant stakeholders to exchange views and information and collectively find solutions to problems will be important. This will be a key step in reducing the risk of economic, legal and force majeure issues.
6.2.3 Multi-Stakeholders:
• It is important that multi-stakeholder groups (including the general public) actively participate in the process, decision making and implementation of measures that will reduce water demand, increase water supply. The River Basin Multi-Stakeholder Platform
28 It should, however, be noted, that during the development of the feasibility study for this project, it was required to hold a discussion among citizens and organizations in the border areas of neighboring Russia, and to conduct a regional assessment, including on the impact on Lake Baikal. There is, therefore, a risk that transboundary water issues could arise during the implementation of this project.
Hydro-Economic Analysis of the water-supply demand gap reduction in the South Gobi mining and heavy industry
region, Mongolia
-----------------------------------------------------------------------------------------------------------------------------------------
42
Council (MSP), with support from the River Basin Authority should be responsible for ensuring multi-stakeholder participation.
6.3. Recommendations
The following five key activities have been identified to support the outcomes of this assessment:
Activity 1: Finalise detailed feasibility studies for the major projects identified in the assessment (Tavan Tolgoi power plant, copper concentrate processing plant, coal washing plants, surface water transfer projects, new groundwater development projects, etc.) to include:
- Detailed description of planned technical solutions and investigations of all suggested demand side reduction options that have been proposed to ensure compatibility;
- Detailed estimates of the investment required;
- Identification of potential sources of funding.
Activity 2: Increase stakeholder participation in the decision on which suggested solutions are most fitting for the context:
- Achieve consensus among stakeholders on the concept of reducing water demand and increasing water supply in the South Gobi mining and heavy industry areas (described in Section 5.2 of the Report);
- Increase stakeholder consultation related to government decisions on mining and heavy industry; intensify the activities of River Basin Multi Stakeholder Platform Councils established at the basin level in connection with the implementation of major projects and activities, and use them as a mechanism to agree on the solutions to be implemented;
- Coordinate the Government's policies and decisions on the use of surface and groundwater resources with the state budget, the private sector and investors;
- Regularly provide stakeholders and the public with scientifically sound and objective information on the social and economic development of the project area and its impact on the environment, especially water resources;
Activity 3: Facilitate the implementation of solutions and measures:
- Planned technological solutions to reduce water demand and detailed cost estimates should be included in the project feasibility study and annual action plan by companies implementing the project;
- Economic benefits of long-distance surface water transfer projects and of the use of new groundwater sources for water supply of the South Gobi mining and heavy industry zone should be transparently and robustly compared to the social, economic and environmental impacts on the region and appropriate mitigation measures identified;
- Non-renewable groundwater resources should not be used for water supply, and if necessary, should only be used within the limits and considerations of exploitable resources approved by the government;
- Regular monitoring of water resource yield and quality should be undertaken to prevent groundwater shortages and pollution.
Activity 4: Identify financing of options:
- Connect with private sector companies and key national and international financial institutions to create financing solutions including joint investments for projects that are implementing these best practices solutions, e.g. specially designed bank loans for companies using best available technology for water efficiency
Hydro-Economic Analysis of the water-supply demand gap reduction in the South Gobi mining and heavy industry
region, Mongolia
-----------------------------------------------------------------------------------------------------------------------------------------
43
- Provide government support for companies that introduce best practices and advanced technologies in the mining and heavy industry sectors e.g. by soft loans
Activity 5: Improving the legal environment:
- Create a legal environment for issuing water use permits to companies that have introduced advanced water-saving and water reuse technologies;
- Provide economic incentives for companies introducing new water management, good practices and advanced technologies in the mining and heavy industry sectors, and the establishment of a comprehensive system of financial and non-financial incentives.
6.4. Overall conclusions
The main conclusions and recommendations from this study are summarised as follows:
• Current mining and heavy industry projects in the region rely solely on groundwater resources to provide their water supply. Oyu Tolgoi LLC and Energy Resources LLC are examples of large companies that are paying close attention to the scarcity of water supplies in the region and are engaging in best practices to use water efficiently.
• In the high growth scenario, the water demand from the existing and planned projects will exceed the available groundwater resources by 20,227 TCM/year (34%) in 2040 and without interventions being made, will prevent economic growth.
• The Government, investors, private sector companies and stakeholders should prioritise the implementation of options in the following order to close the water gap: firstly focus on implementing technologies that will reduce water demand and reuse of water at each project, particularly the use of dry-wet technologies at planned coal washing plants; secondly utilise additional groundwater resources as a source of supply; and consider the use of surface water transfer projects to meet the growing demand for water.
• Initiate a detailed feasibility study for the Orkhon Water Complex surface water project as the first priority, followed by Kherlen Water Complex and Kherlen-Toono. This should include obtaining a detailed understanding of economic, social and environmental impacts and benefits of the projects. It is important to explore in detail and discuss the impacts of these projects on a regular basis with the River Basin MSP Councils aiming to reach a consensus and generate support from all the parties to enable fruitful cooperation and joint effort.
• Ensuring open, fair, objective and accessible information on projects and activities that will bring economic growth is an essential condition for their successful implementation and stakeholder support.
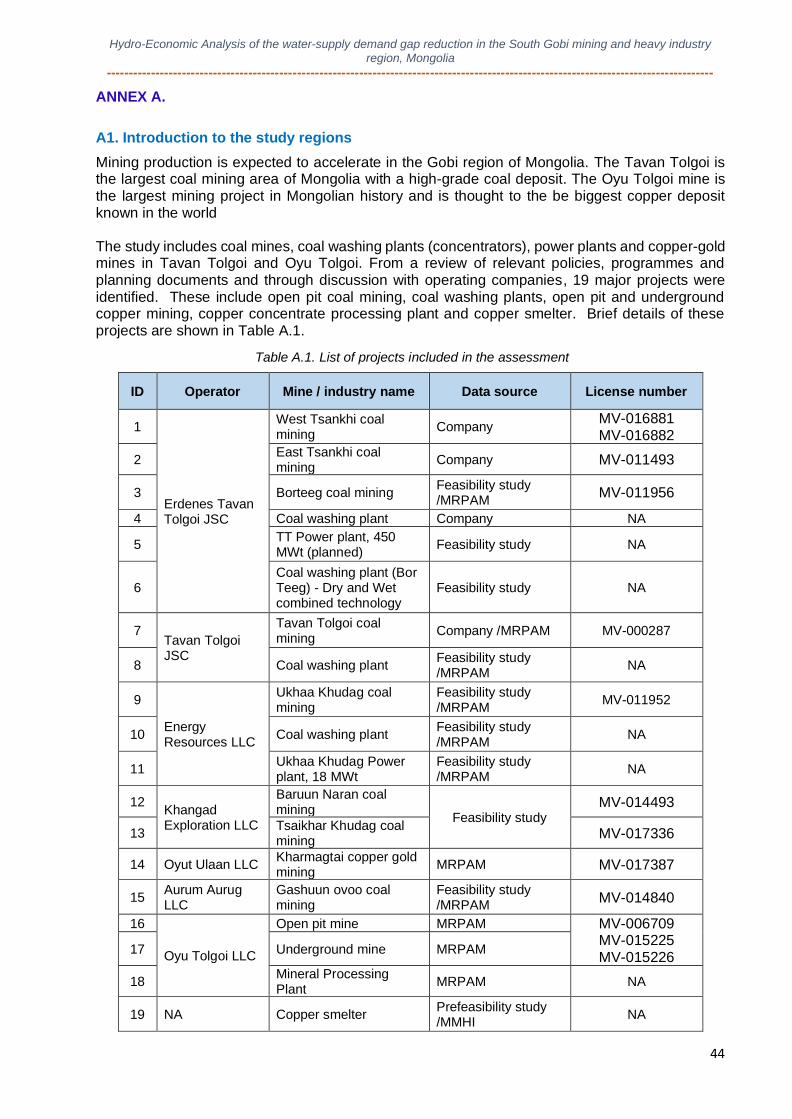
Hydro-Economic Analysis of the water-supply demand gap reduction in the South Gobi mining and heavy industry
region, Mongolia
-----------------------------------------------------------------------------------------------------------------------------------------
44
ANNEX A.
A1. Introduction to the study regions
Mining production is expected to accelerate in the Gobi region of Mongolia. The Tavan Tolgoi is the largest coal mining area of Mongolia with a high-grade coal deposit. The Oyu Tolgoi mine is the largest mining project in Mongolian history and is thought to the be biggest copper deposit known in the world The study includes coal mines, coal washing plants (concentrators), power plants and copper-gold mines in Tavan Tolgoi and Oyu Tolgoi. From a review of relevant policies, programmes and planning documents and through discussion with operating companies, 19 major projects were identified. These include open pit coal mining, coal washing plants, open pit and underground copper mining, copper concentrate processing plant and copper smelter. Brief details of these projects are shown in Table A.1.
Table A.1. List of projects included in the assessment
ID Operator Mine / industry name Data source License number
1
Erdenes Tavan Tolgoi JSC
West Tsankhi coal mining
Company MV-016881 MV-016882
2 East Tsankhi coal mining
Company MV-011493
3 Borteeg coal mining Feasibility study /MRPAM
MV-011956
4 Coal washing plant Company NA
5 TT Power plant, 450 MWt (planned)
Feasibility study NA
6 Coal washing plant (Bor Teeg) - Dry and Wet combined technology
Feasibility study NA
7 Tavan Tolgoi JSC
Tavan Tolgoi coal mining
Company /MRPAM MV-000287
8 Coal washing plant Feasibility study /MRPAM
NA
9
Energy Resources LLC
Ukhaa Khudag coal mining
Feasibility study /MRPAM
MV-011952
10 Coal washing plant Feasibility study /MRPAM
NA
11 Ukhaa Khudag Power plant, 18 MWt
Feasibility study /MRPAM
NA
12 Khangad Exploration LLC
Baruun Naran coal mining
Feasibility study MV-014493
13 Tsaikhar Khudag coal mining
MV-017336
14 Oyut Ulaan LLC Kharmagtai copper gold mining
MRPAM MV-017387
15 Aurum Aurug LLC
Gashuun ovoo coal mining
Feasibility study /MRPAM
MV-014840
16
Oyu Tolgoi LLC
Open pit mine MRPAM MV-006709 MV-015225 MV-015226
17 Underground mine MRPAM
18 Mineral Processing Plant
MRPAM NA
19 NA Copper smelter Prefeasibility study /MMHI
NA
Hydro-Economic Analysis of the water-supply demand gap reduction in the South Gobi mining and heavy industry
region, Mongolia
-----------------------------------------------------------------------------------------------------------------------------------------
45
A2. Mining in the study regions
A2.1. “Erdenes Tavan Tolgoi” JSC coal mining
The Tavan Tolgoi deposit consists of the six main areas of Tsankhi, Bortolgoi, Borteeg, Oortsog, Onch Kharaat, and Ukhaa Khudag. To date the following works have been carried out:
• Detailed exploration in Tsankhi and Ukhaa Khudag areas;
• Preliminary exploration in Borteeg and Oortsog areas; and
• Exploration and evaluation work in Onch Kharaat and Bortolgoi areas.
The mining licenses owned by “Erdenes Tavan Tolgoi” JSC are located in Tsogttsetsii soum, Umnugobi aimag, 90 km east of Dalanzadgad, 540 km south of Ulaanbaatar, 16 km west of Tsogttsetsii, 440 km from the Sainshand railway station, and over 200 km from Mongolian-Chinese border.
“Erdenes Tavan Tolgoi” JSC was established in 2010 to begin exploration in Tavan Tolgoi deposit from the resolution of the Parliament and the Government of Mongolia. The company has eight mining licenses numbered МV-011943, MV-011953, MV-011954, MV-11955, MV-011956, MV-016881, MV-016882. The mining licenses contain around 7.4 billion tonnes of coal, of which 5.1 billion tonnes are coking coal.
East Tsankhi coal mining
The feasibility study for open pit mining of East Tsankhi deposit was developed by “Absolute Mining” LLC in 2011 and approved by the Minerals Professional Council. The feasibility study covers the MV-011493 licensed area and plans for production of 15 million tonnes of coal per year for 30 years.29
West Tsankhi coal mining
The feasibility study for the open pit mine of the West Tsankhi deposit was developed by the Mining Institute in 2011. The feasibility study covers the MV-016881 and MV-016882 license areas and plans to produce 20 million tons of coal per year for 30 years: 10 million tonnes of coking coal, 6.6 tonnes of thermal coal and 1.2 million tonnes of middling.30
Borteeg coal mining
The feasibility study for the open pit mine in the western part of Borteeg deposit was developed by “Mining and Mineral Market” LLC in 2019. The feasibility study covers the MV-011956 license area, with and plans for 15 million tonnes of coal production per year for 30 years.31
A2.2. “Tavan Tolgoi” JSC coal mining
The license areas owned by “Tavan Tolgoi” JSC are located in Tsogttsetsii soum, Umnugobi aimag, 18 km west of Tsogttsetsii, 560 km south of Ulaanbaatar. The Cadastre Department of the Mineral Resources and Petroleum Authority’s merged the 3 license areas numbered 11945A, 287A and MV-11977 on April 21, 2014, that were previously operating in “Tavan Tolgoi” JSC and issued a new license, numbered MV-000287.32
A2.3. “Energy Resources” LLC Coal mining
Ukhaa Khudag coal mining
The Ukhaa Khudag coal deposit is located in Tsogttsetsii soum, Umnugobi aimag, 95 km east of Dalanzadgad, 550 km south of Ulaanbaatar, and 254 km from the Gashuun Sukhait border crossing. It has an area of 2,960 hectares with and license MV-011952. The Ukhaa Khudag deposit
29 Mining Action Plan 2020 of East Tsanhi, 2020 30 The Feasibility Study for West Tsankhi, 2012 31 The Feasibility Study for open pit mining of Borteeg part of Tavan Tolgoi coal deposit (first version), 2019 32 The Feasibility Study for open pit mining of Tavan Tolgoi coal resources, 2011
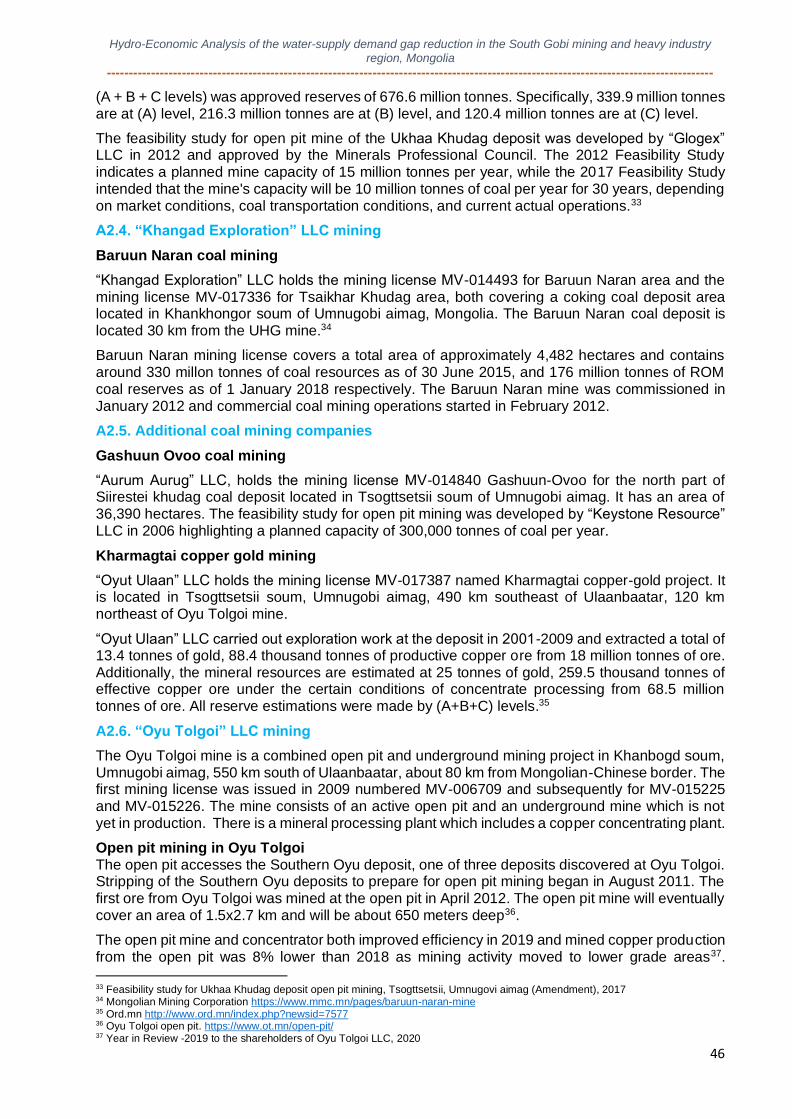
Hydro-Economic Analysis of the water-supply demand gap reduction in the South Gobi mining and heavy industry
region, Mongolia
-----------------------------------------------------------------------------------------------------------------------------------------
46
(A + B + C levels) was approved reserves of 676.6 million tonnes. Specifically, 339.9 million tonnes are at (A) level, 216.3 million tonnes are at (B) level, and 120.4 million tonnes are at (C) level.
The feasibility study for open pit mine of the Ukhaa Khudag deposit was developed by “Glogex” LLC in 2012 and approved by the Minerals Professional Council. The 2012 Feasibility Study indicates a planned mine capacity of 15 million tonnes per year, while the 2017 Feasibility Study intended that the mine's capacity will be 10 million tonnes of coal per year for 30 years, depending on market conditions, coal transportation conditions, and current actual operations.33
A2.4. “Khangad Exploration” LLC mining
Baruun Naran coal mining
“Khangad Exploration” LLC holds the mining license MV-014493 for Baruun Naran area and the mining license MV-017336 for Tsaikhar Khudag area, both covering a coking coal deposit area located in Khankhongor soum of Umnugobi aimag, Mongolia. The Baruun Naran coal deposit is located 30 km from the UHG mine.34
Baruun Naran mining license covers a total area of approximately 4,482 hectares and contains around 330 millon tonnes of coal resources as of 30 June 2015, and 176 million tonnes of ROM coal reserves as of 1 January 2018 respectively. The Baruun Naran mine was commissioned in January 2012 and commercial coal mining operations started in February 2012.
A2.5. Additional coal mining companies
Gashuun Ovoo coal mining
“Aurum Aurug” LLC, holds the mining license MV-014840 Gashuun-Ovoo for the north part of Siirestei khudag coal deposit located in Tsogttsetsii soum of Umnugobi aimag. It has an area of 36,390 hectares. The feasibility study for open pit mining was developed by “Keystone Resource” LLC in 2006 highlighting a planned capacity of 300,000 tonnes of coal per year.
Kharmagtai copper gold mining
“Oyut Ulaan” LLC holds the mining license MV-017387 named Kharmagtai copper-gold project. It is located in Tsogttsetsii soum, Umnugobi aimag, 490 km southeast of Ulaanbaatar, 120 km northeast of Oyu Tolgoi mine.
“Oyut Ulaan” LLC carried out exploration work at the deposit in 2001-2009 and extracted a total of 13.4 tonnes of gold, 88.4 thousand tonnes of productive copper ore from 18 million tonnes of ore. Additionally, the mineral resources are estimated at 25 tonnes of gold, 259.5 thousand tonnes of effective copper ore under the certain conditions of concentrate processing from 68.5 million tonnes of ore. All reserve estimations were made by (A+B+C) levels.35
A2.6. “Oyu Tolgoi” LLC mining
The Oyu Tolgoi mine is a combined open pit and underground mining project in Khanbogd soum, Umnugobi aimag, 550 km south of Ulaanbaatar, about 80 km from Mongolian-Chinese border. The first mining license was issued in 2009 numbered MV-006709 and subsequently for MV-015225 and MV-015226. The mine consists of an active open pit and an underground mine which is not yet in production. There is a mineral processing plant which includes a copper concentrating plant.
Open pit mining in Oyu Tolgoi The open pit accesses the Southern Oyu deposit, one of three deposits discovered at Oyu Tolgoi. Stripping of the Southern Oyu deposits to prepare for open pit mining began in August 2011. The first ore from Oyu Tolgoi was mined at the open pit in April 2012. The open pit mine will eventually cover an area of 1.5x2.7 km and will be about 650 meters deep36.
The open pit mine and concentrator both improved efficiency in 2019 and mined copper production from the open pit was 8% lower than 2018 as mining activity moved to lower grade areas37.
33 Feasibility study for Ukhaa Khudag deposit open pit mining, Tsogttsetsii, Umnugovi aimag (Amendment), 2017 34 Mongolian Mining Corporation https://www.mmc.mn/pages/baruun-naran-mine 35 Ord.mn http://www.ord.mn/index.php?newsid=7577 36 Oyu Tolgoi open pit. https://www.ot.mn/open-pit/ 37 Year in Review -2019 to the shareholders of Oyu Tolgoi LLC, 2020
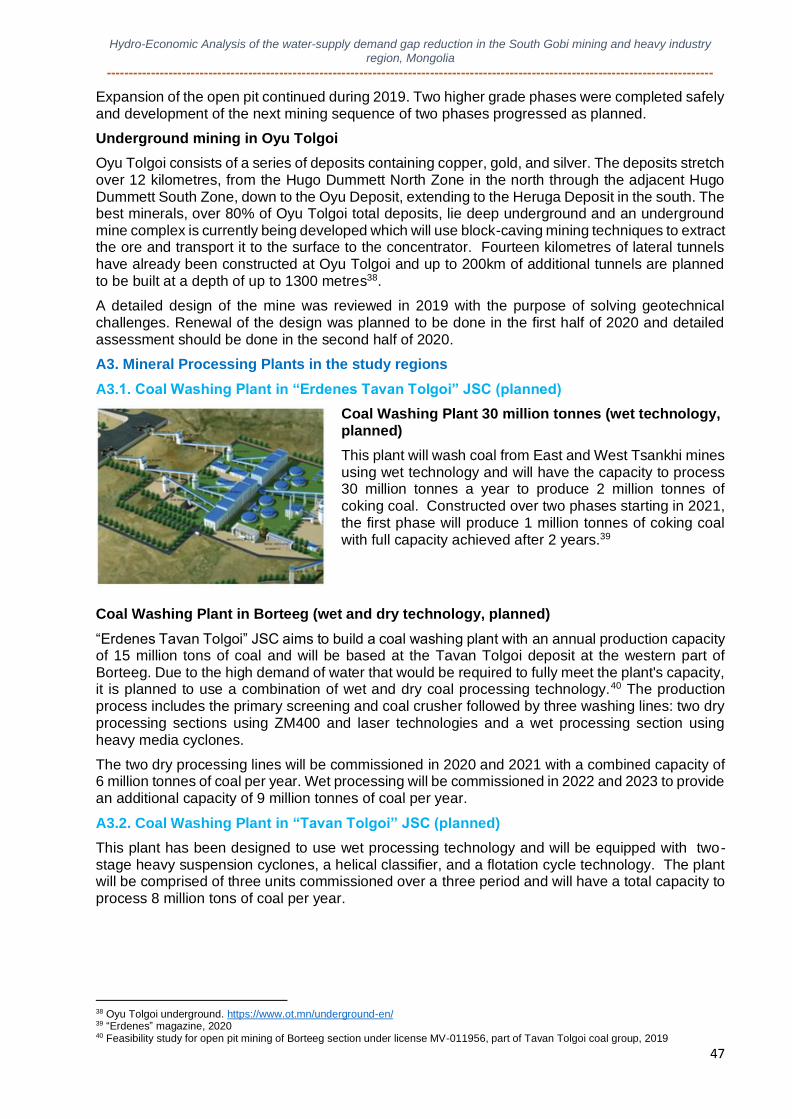
Hydro-Economic Analysis of the water-supply demand gap reduction in the South Gobi mining and heavy industry
region, Mongolia
-----------------------------------------------------------------------------------------------------------------------------------------
47
Expansion of the open pit continued during 2019. Two higher grade phases were completed safely and development of the next mining sequence of two phases progressed as planned.
Underground mining in Oyu Tolgoi
Oyu Tolgoi consists of a series of deposits containing copper, gold, and silver. The deposits stretch over 12 kilometres, from the Hugo Dummett North Zone in the north through the adjacent Hugo Dummett South Zone, down to the Oyu Deposit, extending to the Heruga Deposit in the south. The best minerals, over 80% of Oyu Tolgoi total deposits, lie deep underground and an underground mine complex is currently being developed which will use block-caving mining techniques to extract the ore and transport it to the surface to the concentrator. Fourteen kilometres of lateral tunnels have already been constructed at Oyu Tolgoi and up to 200km of additional tunnels are planned to be built at a depth of up to 1300 metres38.
A detailed design of the mine was reviewed in 2019 with the purpose of solving geotechnical challenges. Renewal of the design was planned to be done in the first half of 2020 and detailed assessment should be done in the second half of 2020.
A3. Mineral Processing Plants in the study regions
A3.1. Coal Washing Plant in “Erdenes Tavan Tolgoi” JSC (planned)
Coal Washing Plant 30 million tonnes (wet technology, planned)
This plant will wash coal from East and West Tsankhi mines using wet technology and will have the capacity to process 30 million tonnes a year to produce 2 million tonnes of coking coal. Constructed over two phases starting in 2021, the first phase will produce 1 million tonnes of coking coal with full capacity achieved after 2 years.39
Coal Washing Plant in Borteeg (wet and dry technology, planned)
“Erdenes Tavan Tolgoi” JSC aims to build a coal washing plant with an annual production capacity of 15 million tons of coal and will be based at the Tavan Tolgoi deposit at the western part of Borteeg. Due to the high demand of water that would be required to fully meet the plant's capacity, it is planned to use a combination of wet and dry coal processing technology.40 The production process includes the primary screening and coal crusher followed by three washing lines: two dry processing sections using ZM400 and laser technologies and a wet processing section using heavy media cyclones.
The two dry processing lines will be commissioned in 2020 and 2021 with a combined capacity of 6 million tonnes of coal per year. Wet processing will be commissioned in 2022 and 2023 to provide an additional capacity of 9 million tonnes of coal per year.
A3.2. Coal Washing Plant in “Tavan Tolgoi” JSC (planned)
This plant has been designed to use wet processing technology and will be equipped with two-stage heavy suspension cyclones, a helical classifier, and a flotation cycle technology. The plant will be comprised of three units commissioned over a three period and will have a total capacity to process 8 million tons of coal per year.
38 Oyu Tolgoi underground. https://www.ot.mn/underground-en/ 39 “Erdenes” magazine, 2020 40 Feasibility study for open pit mining of Borteeg section under license MV-011956, part of Tavan Tolgoi coal group, 2019
Hydro-Economic Analysis of the water-supply demand gap reduction in the South Gobi mining and heavy industry
region, Mongolia
-----------------------------------------------------------------------------------------------------------------------------------------
48
A3.3. Coal Handling and Preparation Plant in “Energy Resource” LLC
This coal handling and preparation plant (“CHPP”) has been in operation at UHG since 2011 and run by the Mongolian Mining Corporation (MMC) and was the first of its kind in Mongolia.41
The first and second 5 million tonnes per year modules of the CHPP commenced commercial operations in 2011 and 2012, respectively and the final unit was successfully commission in 2013, providing a total coal processing capacity of 15 million tons per year. The plant is highly automated, and uses belt and filter presses to allows substantial water-recycling estimated to be 95% efficient.
A3.4. Copper Concentrator in “Oyu Tolgoi” LLC
The concentrator will have the capacity to process up to 100,000 tons of ore each day and uses a series of complex mechanical and chemical processes to turn it into the final product. The concentrator was commissioned in December 2012, produced its first copper concentrate. The concentrator processed 40.8 million tons of ore in 2019 producing 724.7 thousand tons of bagged copper concentrate.42
A3.5. Copper smelter
In support of the Mongolian Government's policy to increase value-added production and exports through the development of the mining processing industry, in 2017 the government directed that a copper smelter should be built in the Khanbogd soum, Umnugovi aimag in order to process copper and gold concentrate at the Oyu Tolgoi mine. It will be built through a public-private partnership as well as foreign and domestic investment. A brief introduction of the copper smelter project is shown below.
Figure A.2. Brief introduction of the copper smelter project
Ministry of Mining and Heavy
Industry
A BRIEF INTRODUCTION OF THE COPPER SMELTER PROJECT
CAPACITY: 1 mln ton copper
concentrate per year
FEASIBILITY
STUDY:Preliminary
feasibility study was
developed and
approved by the
Minerals Professional
Council of the Ministry
of Mining and Heavy
Industry on August 14,
2018
WORK IN PROGRESS:
- A Memorandum of Understanding was
signed with “Erdenes-Mongol” LLC to
supply copper concentrate.
- A tender work is being organized to
select a contractor to develop a detailed
feasibility study.
- As part of the investor selection
process, selecting of foreign and
domestic consulting companies will be
done.
PRODUCTION:
- Cathode copper 257
thousand t/y
- Gold 6 t/y
- Silver 60 t/y
- Others
OUTCOME:
- More than 1,000 new
jobs and 20% of human
resources will be
provided locally.
- Value-added products
will be produced.
LOCATION:
- Khanbogd soum,
Umnugobi aimag
INVESTMENT:
- $2.1 billion
TAX:
- $46.39 per year
NET INCOME:
- $139.18 million per year
Source: http://www.mmhi.gov.mn/
The copper smelter plant will have the capacity to process 1 million tons of concentrate per year and copper ore extracted from the Oyu Tolgoi underground mine. With the commissioning of the Oyu Tolgoi underground mine in 2029, it will be possible to produce 2 million tons of copper
41 MMC, Coal Handling and Preparation Plant https://www.mmc.mn/pages/coal-handling 42 Year in Review -2019 to the shareholders of Oyu Tolgoi LLC, 2020
Hydro-Economic Analysis of the water-supply demand gap reduction in the South Gobi mining and heavy industry
region, Mongolia
-----------------------------------------------------------------------------------------------------------------------------------------
49
concentrate per year, but only 50% of this is planned to be smelted in this plant. According to preliminary estimates, the investment in the copper smelter plant will be $ 2.1 billion.43
With the purpose of determining the investment required for the construction of the planned copper smelter plant and the main technical parameters and economic efficiency, a pre-feasibility study was documented for a copper smelter plant with the capacity of 0.5 or 1.0 million tons per year.
The Pre-Feasibility Study was approved by the Minerals Professional Council of the Ministry of Mining and Heavy Industry in 2018, as well as the project's General Environmental Impact Assessment. In the future, a detailed feasibility study and Environmental Impact Assessment will need to be developed for the copper smelter plant, which will require at least $ 1.5-2.0 million.
A4. Power Plants in the study regions
A4.1. Erdenes Tavan Tolgoi Power Plant
The Mongolian government has confirmed the construction of a 450 MW power plant based at the Tavan Tolgoi coal deposit, planned in 2024. It will provide reliable power to the large mining and heavy industry complexes in the Oyu Tolgoi and Tavan Tolgoi regions, stabilizing the region's energy system, and ensuring reliable operation. Furthermore, it should save on coal transportation costs, which are the main operating costs of the power plant, and energy costs (160-200 billion MNT per year) imported from China for the Oyu Tolgoi mine. It will be located in Tsogttsetsii soum, Umnugobi aimag, 95 km east of Dalanzadgad, 550 km south of Ulaanbaatar, and 254 km from the Gashuun Sukhait border crossing. The power plant will include an air-cooled condenser, circulating fluidized bed furnace, steam turbine, toxic gas and waste reduction and water treatment technology.44
Although the agreement with “Oyu Tolgoi” LLC to build Tavan Tolgoi power plant was made in 2018, the project was unable to be implemented due to its high cost. Therefore, the Government of Mongolia decided to build this power plant with state funds. This investment will be 30 percent lower than the proposed project of “Oyu Tolgoi” LLC, and the cost of electricity will be more than 50 percent lower.
A4.2. Ukhaa Khudag Power plant
“Energy Resources” LLC built an 18 MW power plant in 2011-2013 to provide energy supply to Ukhaa Khudag mine and Tsogttsetsii soum. Due to the limited water resources at the project site, the power plant is air cooled, adapted to the climatic conditions of the Gobi region and technologies adapted have been approved by the World Bank.45
43 Ministry of Mining and Heavy Industry, brief introduction of the project http://www.mmhi.gov.mn/uploads/files/ХАВСРАЛТ-Монгол.pdf 44 Ministry of Energy. Tavan tolgoi power plant project unit. http://ttpp.mn/ 45 Feasibility study for Ukhaa Khudag deposit open pit mining, Tsogttsetsii, Umnugovi aimag (Amendment), 2017
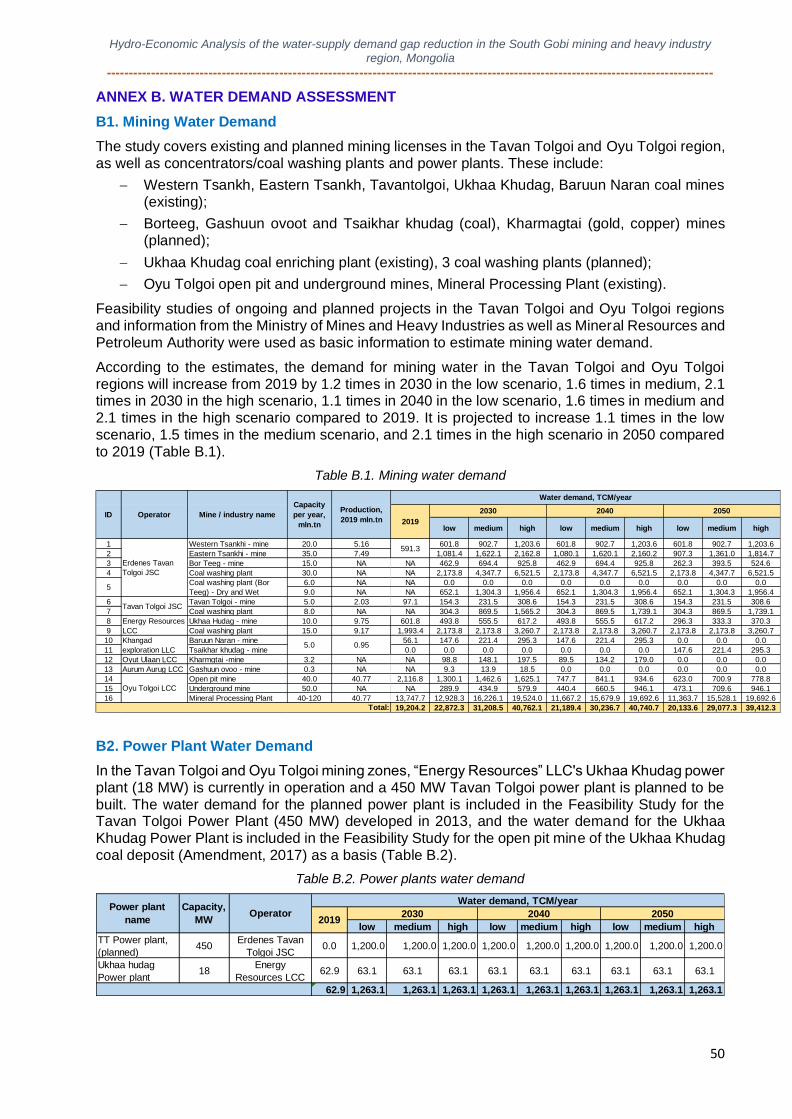
Hydro-Economic Analysis of the water-supply demand gap reduction in the South Gobi mining and heavy industry
region, Mongolia
-----------------------------------------------------------------------------------------------------------------------------------------
50
ANNEX B. WATER DEMAND ASSESSMENT
B1. Mining Water Demand
The study covers existing and planned mining licenses in the Tavan Tolgoi and Oyu Tolgoi region, as well as concentrators/coal washing plants and power plants. These include:
− Western Tsankh, Eastern Tsankh, Tavantolgoi, Ukhaa Khudag, Baruun Naran coal mines (existing);
− Borteeg, Gashuun ovoot and Tsaikhar khudag (coal), Kharmagtai (gold, copper) mines (planned);
− Ukhaa Khudag coal enriching plant (existing), 3 coal washing plants (planned);
− Oyu Tolgoi open pit and underground mines, Mineral Processing Plant (existing).
Feasibility studies of ongoing and planned projects in the Tavan Tolgoi and Oyu Tolgoi regions and information from the Ministry of Mines and Heavy Industries as well as Mineral Resources and Petroleum Authority were used as basic information to estimate mining water demand.
According to the estimates, the demand for mining water in the Tavan Tolgoi and Oyu Tolgoi regions will increase from 2019 by 1.2 times in 2030 in the low scenario, 1.6 times in medium, 2.1 times in 2030 in the high scenario, 1.1 times in 2040 in the low scenario, 1.6 times in medium and 2.1 times in the high scenario compared to 2019. It is projected to increase 1.1 times in the low scenario, 1.5 times in the medium scenario, and 2.1 times in the high scenario in 2050 compared to 2019 (Table B.1).
Table B.1. Mining water demand
B2. Power Plant Water Demand
In the Tavan Tolgoi and Oyu Tolgoi mining zones, “Energy Resources” LLC's Ukhaa Khudag power plant (18 MW) is currently in operation and a 450 MW Tavan Tolgoi power plant is planned to be built. The water demand for the planned power plant is included in the Feasibility Study for the Tavan Tolgoi Power Plant (450 MW) developed in 2013, and the water demand for the Ukhaa Khudag Power Plant is included in the Feasibility Study for the open pit mine of the Ukhaa Khudag coal deposit (Amendment, 2017) as a basis (Table B.2).
Table B.2. Power plants water demand
low medium high low medium high low medium high
1 Western Tsankhi - mine 20.0 5.16 601.8 902.7 1,203.6 601.8 902.7 1,203.6 601.8 902.7 1,203.6
2 Eastern Tsankhi - mine 35.0 7.49 1,081.4 1,622.1 2,162.8 1,080.1 1,620.1 2,160.2 907.3 1,361.0 1,814.7
3 Bor Teeg - mine 15.0 NA NA 462.9 694.4 925.8 462.9 694.4 925.8 262.3 393.5 524.6
4 Coal washing plant 30.0 NA NA 2,173.8 4,347.7 6,521.5 2,173.8 4,347.7 6,521.5 2,173.8 4,347.7 6,521.5
6.0 NA NA 0.0 0.0 0.0 0.0 0.0 0.0 0.0 0.0 0.0
9.0 NA NA 652.1 1,304.3 1,956.4 652.1 1,304.3 1,956.4 652.1 1,304.3 1,956.4
6 Tavan Tolgoi - mine 5.0 2.03 97.1 154.3 231.5 308.6 154.3 231.5 308.6 154.3 231.5 308.6
7 Coal washing plant 8.0 NA NA 304.3 869.5 1,565.2 304.3 869.5 1,739.1 304.3 869.5 1,739.1
8 Ukhaa Hudag - mine 10.0 9.75 601.8 493.8 555.5 617.2 493.8 555.5 617.2 296.3 333.3 370.3
9 Coal washing plant 15.0 9.17 1,993.4 2,173.8 2,173.8 3,260.7 2,173.8 2,173.8 3,260.7 2,173.8 2,173.8 3,260.7
10 Baruun Naran - mine 56.1 147.6 221.4 295.3 147.6 221.4 295.3 0.0 0.0 0.0
11 Tsaikhar khudag - mine 0.0 0.0 0.0 0.0 0.0 0.0 0.0 147.6 221.4 295.3
12 Oyut Ulaan LCC Kharmgtai -mine 3.2 NA NA 98.8 148.1 197.5 89.5 134.2 179.0 0.0 0.0 0.0
13 Aurum Aurug LCC Gashuun ovoo - mine 0.3 NA NA 9.3 13.9 18.5 0.0 0.0 0.0 0.0 0.0 0.0
14 Open pit mine 40.0 40.77 2,116.8 1,300.1 1,462.6 1,625.1 747.7 841.1 934.6 623.0 700.9 778.8
15 Underground mine 50.0 NA NA 289.9 434.9 579.9 440.4 660.5 946.1 473.1 709.6 946.1
16 Mineral Processing Plant 40-120 40.77 13,747.7 12,928.3 16,226.1 19,524.0 11,667.2 15,679.9 19,692.6 11,363.7 15,528.1 19,692.6
19,204.2 22,872.3 31,208.5 40,762.1 21,189.4 30,236.7 40,740.7 20,133.6 29,077.3 39,412.3
Erdenes Tavan
Tolgoi JSC
5Coal washing plant (Bor
Teeg) - Dry and Wet
Tavan Tolgoi JSC
ID Operator Mine / industry name
Capacity
per year,
mln.tn
Production,
2019 mln.tn
Water demand, TCM/year
2019
2030 2040 2050
Energy Resources
LCC
Khangad
exploration LLC
Oyu Tolgoi LCC
Total:
5.0 0.95
591.3
low medium high low medium high low medium high
TT Power plant,
(planned)450
Erdenes Tavan
Tolgoi JSC0.0 1,200.0 1,200.0 1,200.0 1,200.0 1,200.0 1,200.0 1,200.0 1,200.0 1,200.0
Ukhaa hudag
Power plant18
Energy
Resources LCC62.9 63.1 63.1 63.1 63.1 63.1 63.1 63.1 63.1 63.1
62.9 1,263.1 1,263.1 1,263.1 1,263.1 1,263.1 1,263.1 1,263.1 1,263.1 1,263.1
Power plant
name
Capacity,
MWOperator
Water demand, TCM/year
20192030 2040 2050
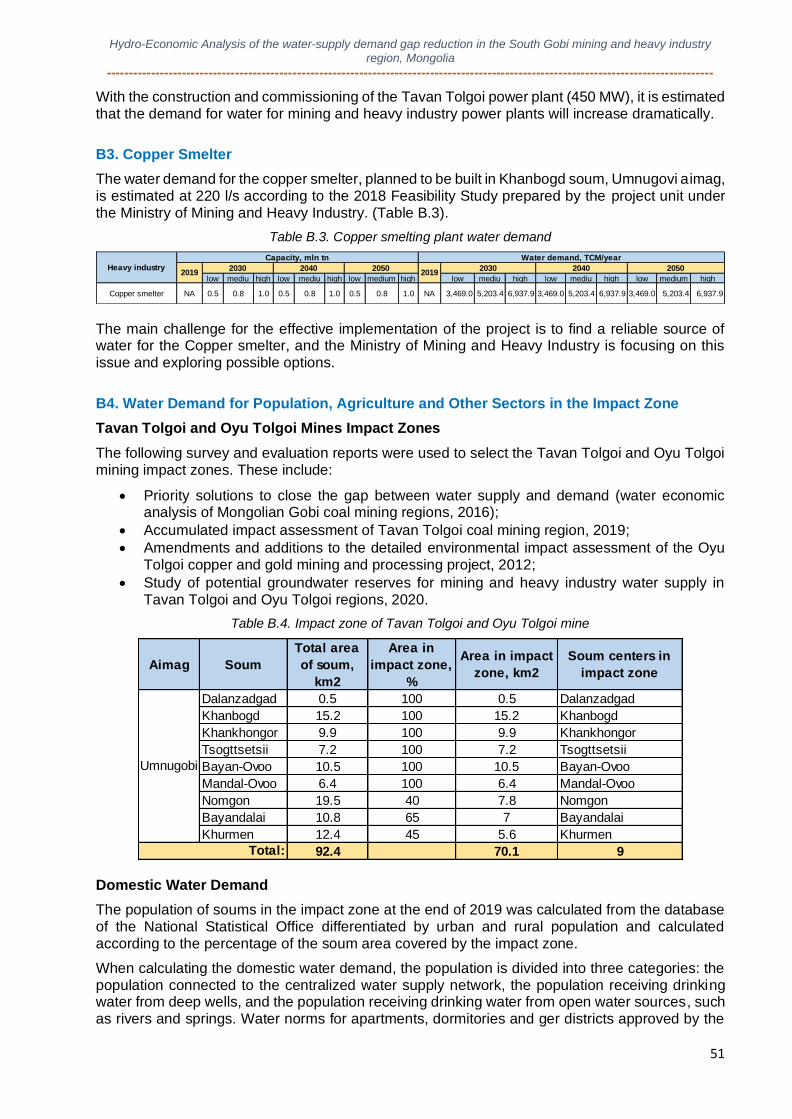
Hydro-Economic Analysis of the water-supply demand gap reduction in the South Gobi mining and heavy industry
region, Mongolia
-----------------------------------------------------------------------------------------------------------------------------------------
51
With the construction and commissioning of the Tavan Tolgoi power plant (450 MW), it is estimated that the demand for water for mining and heavy industry power plants will increase dramatically.
B3. Copper Smelter
The water demand for the copper smelter, planned to be built in Khanbogd soum, Umnugovi aimag, is estimated at 220 l/s according to the 2018 Feasibility Study prepared by the project unit under the Ministry of Mining and Heavy Industry. (Table B.3).
Table B.3. Copper smelting plant water demand
The main challenge for the effective implementation of the project is to find a reliable source of water for the Copper smelter, and the Ministry of Mining and Heavy Industry is focusing on this issue and exploring possible options.
B4. Water Demand for Population, Agriculture and Other Sectors in the Impact Zone
Tavan Tolgoi and Oyu Tolgoi Mines Impact Zones
The following survey and evaluation reports were used to select the Tavan Tolgoi and Oyu Tolgoi mining impact zones. These include:
• Priority solutions to close the gap between water supply and demand (water economic analysis of Mongolian Gobi coal mining regions, 2016);
• Accumulated impact assessment of Tavan Tolgoi coal mining region, 2019;
• Amendments and additions to the detailed environmental impact assessment of the Oyu Tolgoi copper and gold mining and processing project, 2012;
• Study of potential groundwater reserves for mining and heavy industry water supply in Tavan Tolgoi and Oyu Tolgoi regions, 2020.
Table B.4. Impact zone of Tavan Tolgoi and Oyu Tolgoi mine
Domestic Water Demand
The population of soums in the impact zone at the end of 2019 was calculated from the database of the National Statistical Office differentiated by urban and rural population and calculated according to the percentage of the soum area covered by the impact zone.
When calculating the domestic water demand, the population is divided into three categories: the population connected to the centralized water supply network, the population receiving drinking water from deep wells, and the population receiving drinking water from open water sources, such as rivers and springs. Water norms for apartments, dormitories and ger districts approved by the
low mediu high low mediu high low medium high low mediu high low mediu high low medium high
Copper smelter NA 0.5 0.8 1.0 0.5 0.8 1.0 0.5 0.8 1.0 NA 3,469.0 5,203.4 6,937.9 3,469.0 5,203.4 6,937.9 3,469.0 5,203.4 6,937.9
Heavy industry
Capacity, mln tn Water demand, TCM/year
20192030 2040 2050
20192030 2040 2050
Aimag Soum
Total area
of soum,
km2
Area in
impact zone,
%
Area in impact
zone, km2
Soum centers in
impact zone
Dalanzadgad 0.5 100 0.5 Dalanzadgad
Khanbogd 15.2 100 15.2 Khanbogd
Khankhongor 9.9 100 9.9 Khankhongor
Tsogttsetsii 7.2 100 7.2 Tsogttsetsii
Bayan-Ovoo 10.5 100 10.5 Bayan-Ovoo
Mandal-Ovoo 6.4 100 6.4 Mandal-Ovoo
Nomgon 19.5 40 7.8 Nomgon
Bayandalai 10.8 65 7 Bayandalai
Khurmen 12.4 45 5.6 Khurmen
92.4 70.1 9
Umnugobi
Total:
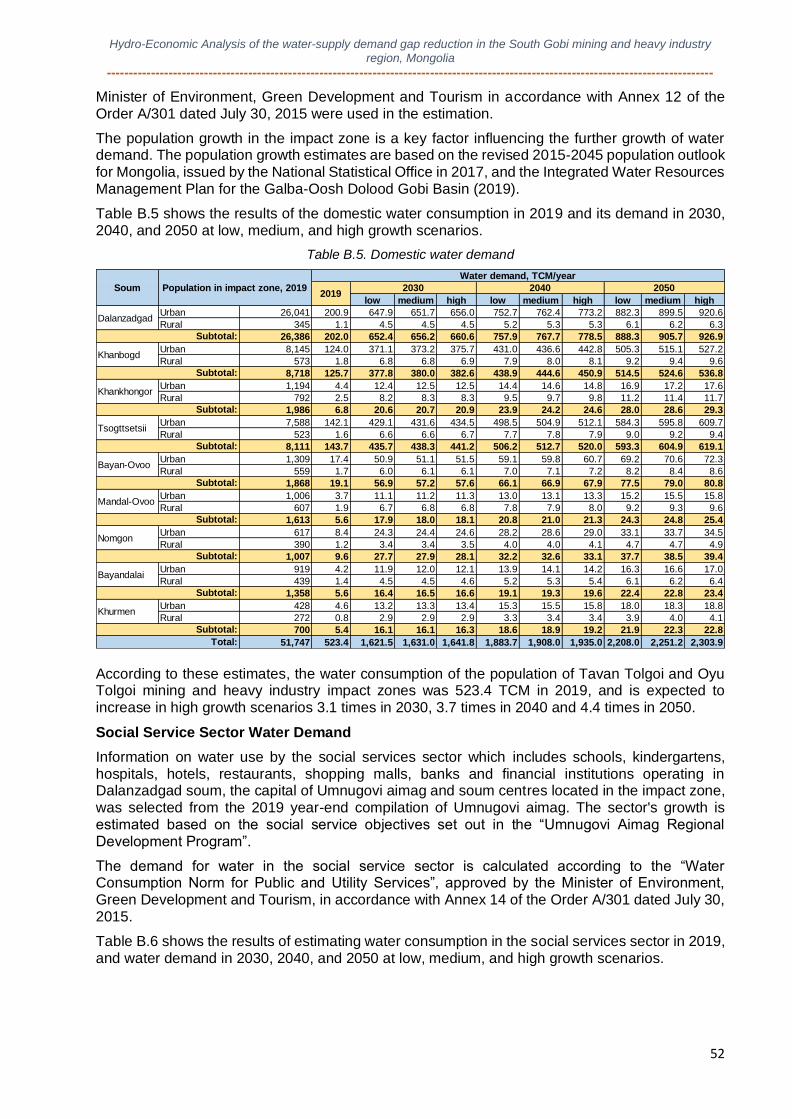
Hydro-Economic Analysis of the water-supply demand gap reduction in the South Gobi mining and heavy industry
region, Mongolia
-----------------------------------------------------------------------------------------------------------------------------------------
52
Minister of Environment, Green Development and Tourism in accordance with Annex 12 of the Order A/301 dated July 30, 2015 were used in the estimation.
The population growth in the impact zone is a key factor influencing the further growth of water demand. The population growth estimates are based on the revised 2015-2045 population outlook for Mongolia, issued by the National Statistical Office in 2017, and the Integrated Water Resources Management Plan for the Galba-Oosh Dolood Gobi Basin (2019).
Table B.5 shows the results of the domestic water consumption in 2019 and its demand in 2030, 2040, and 2050 at low, medium, and high growth scenarios.
Table B.5. Domestic water demand
According to these estimates, the water consumption of the population of Tavan Tolgoi and Oyu Tolgoi mining and heavy industry impact zones was 523.4 TCM in 2019, and is expected to increase in high growth scenarios 3.1 times in 2030, 3.7 times in 2040 and 4.4 times in 2050.
Social Service Sector Water Demand
Information on water use by the social services sector which includes schools, kindergartens, hospitals, hotels, restaurants, shopping malls, banks and financial institutions operating in Dalanzadgad soum, the capital of Umnugovi aimag and soum centres located in the impact zone, was selected from the 2019 year-end compilation of Umnugovi aimag. The sector's growth is estimated based on the social service objectives set out in the “Umnugovi Aimag Regional Development Program”.
The demand for water in the social service sector is calculated according to the “Water Consumption Norm for Public and Utility Services”, approved by the Minister of Environment, Green Development and Tourism, in accordance with Annex 14 of the Order A/301 dated July 30, 2015.
Table B.6 shows the results of estimating water consumption in the social services sector in 2019, and water demand in 2030, 2040, and 2050 at low, medium, and high growth scenarios.
low medium high low medium high low medium high
Urban 26,041 200.9 647.9 651.7 656.0 752.7 762.4 773.2 882.3 899.5 920.6
Rural 345 1.1 4.5 4.5 4.5 5.2 5.3 5.3 6.1 6.2 6.3
26,386 202.0 652.4 656.2 660.6 757.9 767.7 778.5 888.3 905.7 926.9
Urban 8,145 124.0 371.1 373.2 375.7 431.0 436.6 442.8 505.3 515.1 527.2
Rural 573 1.8 6.8 6.8 6.9 7.9 8.0 8.1 9.2 9.4 9.6
8,718 125.7 377.8 380.0 382.6 438.9 444.6 450.9 514.5 524.6 536.8
Urban 1,194 4.4 12.4 12.5 12.5 14.4 14.6 14.8 16.9 17.2 17.6
Rural 792 2.5 8.2 8.3 8.3 9.5 9.7 9.8 11.2 11.4 11.7
1,986 6.8 20.6 20.7 20.9 23.9 24.2 24.6 28.0 28.6 29.3
Urban 7,588 142.1 429.1 431.6 434.5 498.5 504.9 512.1 584.3 595.8 609.7
Rural 523 1.6 6.6 6.6 6.7 7.7 7.8 7.9 9.0 9.2 9.4
8,111 143.7 435.7 438.3 441.2 506.2 512.7 520.0 593.3 604.9 619.1
Urban 1,309 17.4 50.9 51.1 51.5 59.1 59.8 60.7 69.2 70.6 72.3
Rural 559 1.7 6.0 6.1 6.1 7.0 7.1 7.2 8.2 8.4 8.6
1,868 19.1 56.9 57.2 57.6 66.1 66.9 67.9 77.5 79.0 80.8
Urban 1,006 3.7 11.1 11.2 11.3 13.0 13.1 13.3 15.2 15.5 15.8
Rural 607 1.9 6.7 6.8 6.8 7.8 7.9 8.0 9.2 9.3 9.6
1,613 5.6 17.9 18.0 18.1 20.8 21.0 21.3 24.3 24.8 25.4
Urban 617 8.4 24.3 24.4 24.6 28.2 28.6 29.0 33.1 33.7 34.5
Rural 390 1.2 3.4 3.4 3.5 4.0 4.0 4.1 4.7 4.7 4.9
1,007 9.6 27.7 27.9 28.1 32.2 32.6 33.1 37.7 38.5 39.4
Urban 919 4.2 11.9 12.0 12.1 13.9 14.1 14.2 16.3 16.6 17.0
Rural 439 1.4 4.5 4.5 4.6 5.2 5.3 5.4 6.1 6.2 6.4
1,358 5.6 16.4 16.5 16.6 19.1 19.3 19.6 22.4 22.8 23.4
Urban 428 4.6 13.2 13.3 13.4 15.3 15.5 15.8 18.0 18.3 18.8
Rural 272 0.8 2.9 2.9 2.9 3.3 3.4 3.4 3.9 4.0 4.1
700 5.4 16.1 16.1 16.3 18.6 18.9 19.2 21.9 22.3 22.8
51,747 523.4 1,621.5 1,631.0 1,641.8 1,883.7 1,908.0 1,935.0 2,208.0 2,251.2 2,303.9
Dalanzadgad
Subtotal:
Khanbogd
Subtotal:
Khankhongor
Subtotal:
Soum Population in impact zone, 2019
Water demand, TCM/year
20192030 2040 2050
Nomgon
Subtotal:
Bayandalai
Subtotal:
Khurmen
Subtotal:
Tsogttsetsii
Subtotal:
Bayan-Ovoo
Subtotal:
Mandal-Ovoo
Subtotal:
Total:
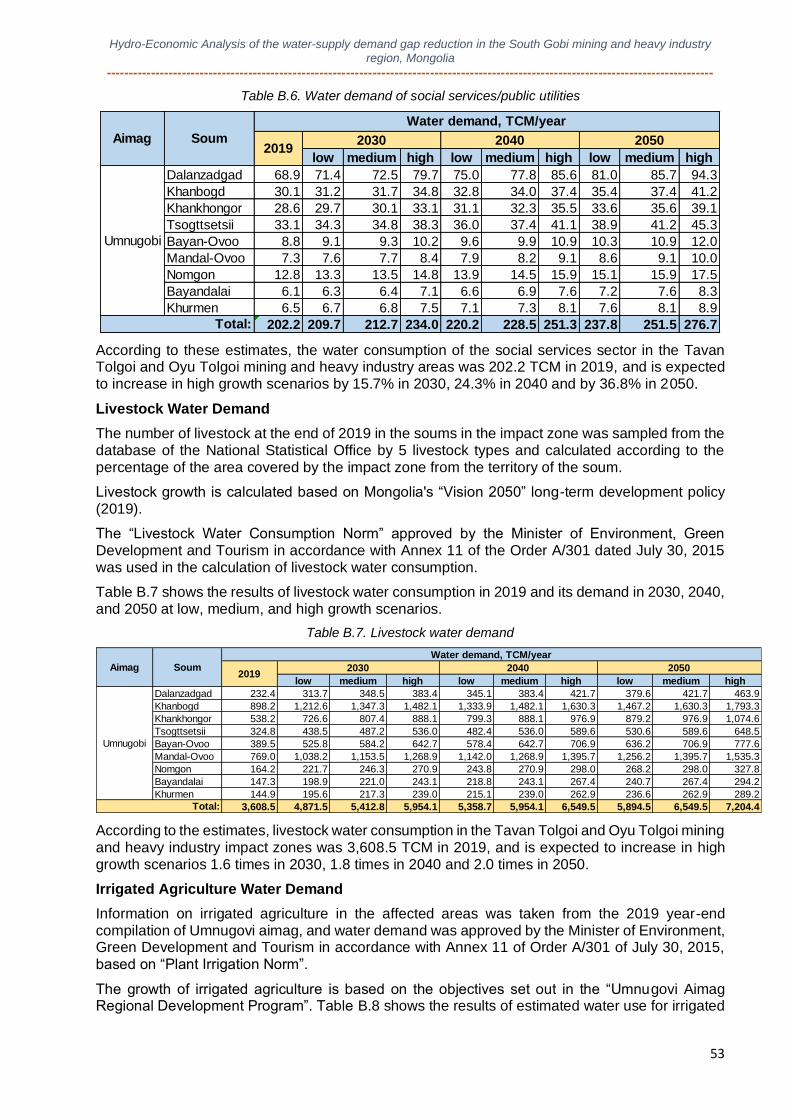
Hydro-Economic Analysis of the water-supply demand gap reduction in the South Gobi mining and heavy industry
region, Mongolia
-----------------------------------------------------------------------------------------------------------------------------------------
53
Table B.6. Water demand of social services/public utilities
According to these estimates, the water consumption of the social services sector in the Tavan Tolgoi and Oyu Tolgoi mining and heavy industry areas was 202.2 TCM in 2019, and is expected to increase in high growth scenarios by 15.7% in 2030, 24.3% in 2040 and by 36.8% in 2050.
Livestock Water Demand
The number of livestock at the end of 2019 in the soums in the impact zone was sampled from the database of the National Statistical Office by 5 livestock types and calculated according to the percentage of the area covered by the impact zone from the territory of the soum.
Livestock growth is calculated based on Mongolia's “Vision 2050” long-term development policy (2019).
The “Livestock Water Consumption Norm” approved by the Minister of Environment, Green Development and Tourism in accordance with Annex 11 of the Order A/301 dated July 30, 2015 was used in the calculation of livestock water consumption.
Table B.7 shows the results of livestock water consumption in 2019 and its demand in 2030, 2040, and 2050 at low, medium, and high growth scenarios.
Table B.7. Livestock water demand
According to the estimates, livestock water consumption in the Tavan Tolgoi and Oyu Tolgoi mining and heavy industry impact zones was 3,608.5 TCM in 2019, and is expected to increase in high growth scenarios 1.6 times in 2030, 1.8 times in 2040 and 2.0 times in 2050.
Irrigated Agriculture Water Demand
Information on irrigated agriculture in the affected areas was taken from the 2019 year-end compilation of Umnugovi aimag, and water demand was approved by the Minister of Environment, Green Development and Tourism in accordance with Annex 11 of Order A/301 of July 30, 2015, based on “Plant Irrigation Norm”.
The growth of irrigated agriculture is based on the objectives set out in the “Umnugovi Aimag Regional Development Program”. Table B.8 shows the results of estimated water use for irrigated
low medium high low medium high low medium high
Dalanzadgad 68.9 71.4 72.5 79.7 75.0 77.8 85.6 81.0 85.7 94.3
Khanbogd 30.1 31.2 31.7 34.8 32.8 34.0 37.4 35.4 37.4 41.2
Khankhongor 28.6 29.7 30.1 33.1 31.1 32.3 35.5 33.6 35.6 39.1
Tsogttsetsii 33.1 34.3 34.8 38.3 36.0 37.4 41.1 38.9 41.2 45.3
Bayan-Ovoo 8.8 9.1 9.3 10.2 9.6 9.9 10.9 10.3 10.9 12.0
Mandal-Ovoo 7.3 7.6 7.7 8.4 7.9 8.2 9.1 8.6 9.1 10.0
Nomgon 12.8 13.3 13.5 14.8 13.9 14.5 15.9 15.1 15.9 17.5
Bayandalai 6.1 6.3 6.4 7.1 6.6 6.9 7.6 7.2 7.6 8.3
Khurmen 6.5 6.7 6.8 7.5 7.1 7.3 8.1 7.6 8.1 8.9
202.2 209.7 212.7 234.0 220.2 228.5 251.3 237.8 251.5 276.7
Umnugobi
Total:
Aimag Soum
Water demand, TCM/year
20192030 2040 2050
low medium high low medium high low medium high
Dalanzadgad 232.4 313.7 348.5 383.4 345.1 383.4 421.7 379.6 421.7 463.9
Khanbogd 898.2 1,212.6 1,347.3 1,482.1 1,333.9 1,482.1 1,630.3 1,467.2 1,630.3 1,793.3
Khankhongor 538.2 726.6 807.4 888.1 799.3 888.1 976.9 879.2 976.9 1,074.6
Tsogttsetsii 324.8 438.5 487.2 536.0 482.4 536.0 589.6 530.6 589.6 648.5
Bayan-Ovoo 389.5 525.8 584.2 642.7 578.4 642.7 706.9 636.2 706.9 777.6
Mandal-Ovoo 769.0 1,038.2 1,153.5 1,268.9 1,142.0 1,268.9 1,395.7 1,256.2 1,395.7 1,535.3
Nomgon 164.2 221.7 246.3 270.9 243.8 270.9 298.0 268.2 298.0 327.8
Bayandalai 147.3 198.9 221.0 243.1 218.8 243.1 267.4 240.7 267.4 294.2
Khurmen 144.9 195.6 217.3 239.0 215.1 239.0 262.9 236.6 262.9 289.2
3,608.5 4,871.5 5,412.8 5,954.1 5,358.7 5,954.1 6,549.5 5,894.5 6,549.5 7,204.4
Umnugobi
Total:
Aimag Soum
Water demand, TCM/year
20192030 2040 2050
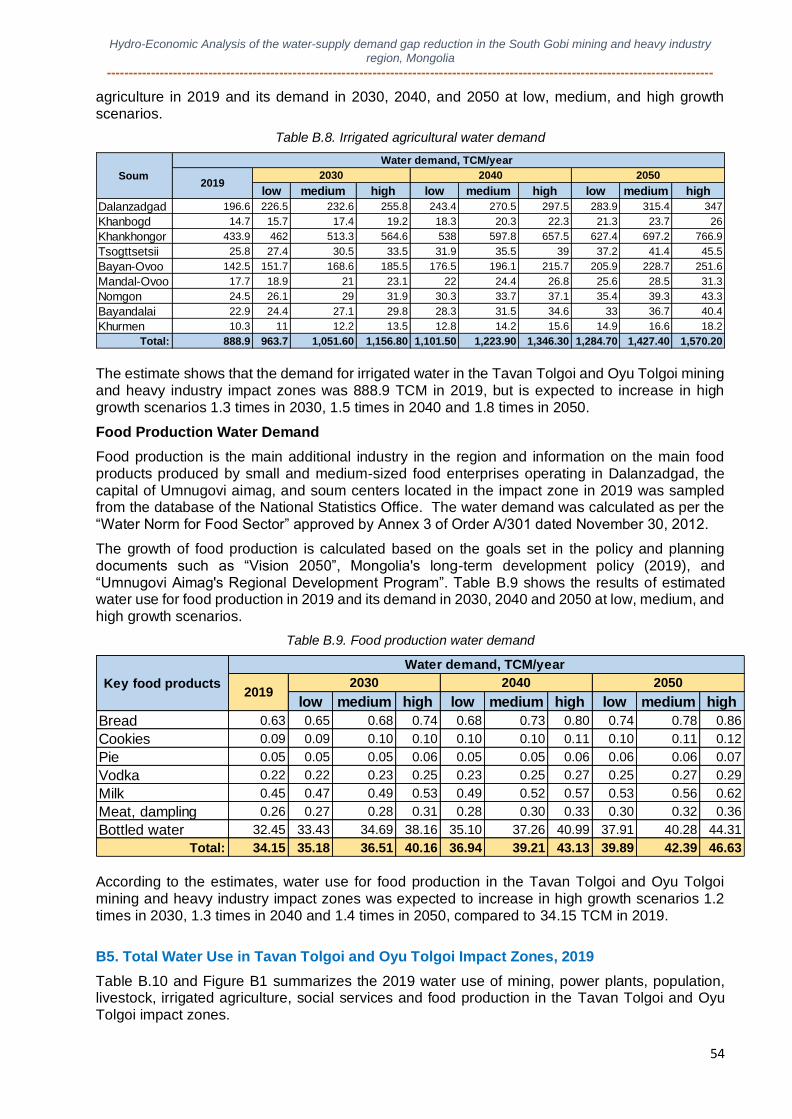
Hydro-Economic Analysis of the water-supply demand gap reduction in the South Gobi mining and heavy industry
region, Mongolia
-----------------------------------------------------------------------------------------------------------------------------------------
54
agriculture in 2019 and its demand in 2030, 2040, and 2050 at low, medium, and high growth scenarios.
Table B.8. Irrigated agricultural water demand
The estimate shows that the demand for irrigated water in the Tavan Tolgoi and Oyu Tolgoi mining and heavy industry impact zones was 888.9 TCM in 2019, but is expected to increase in high growth scenarios 1.3 times in 2030, 1.5 times in 2040 and 1.8 times in 2050.
Food Production Water Demand
Food production is the main additional industry in the region and information on the main food products produced by small and medium-sized food enterprises operating in Dalanzadgad, the capital of Umnugovi aimag, and soum centers located in the impact zone in 2019 was sampled from the database of the National Statistics Office. The water demand was calculated as per the “Water Norm for Food Sector” approved by Annex 3 of Order A/301 dated November 30, 2012.
The growth of food production is calculated based on the goals set in the policy and planning documents such as “Vision 2050”, Mongolia's long-term development policy (2019), and “Umnugovi Aimag's Regional Development Program”. Table B.9 shows the results of estimated water use for food production in 2019 and its demand in 2030, 2040 and 2050 at low, medium, and high growth scenarios.
Table B.9. Food production water demand
According to the estimates, water use for food production in the Tavan Tolgoi and Oyu Tolgoi mining and heavy industry impact zones was expected to increase in high growth scenarios 1.2 times in 2030, 1.3 times in 2040 and 1.4 times in 2050, compared to 34.15 TCM in 2019.
B5. Total Water Use in Tavan Tolgoi and Oyu Tolgoi Impact Zones, 2019
Table B.10 and Figure B1 summarizes the 2019 water use of mining, power plants, population, livestock, irrigated agriculture, social services and food production in the Tavan Tolgoi and Oyu Tolgoi impact zones.
low medium high low medium high low medium high
Dalanzadgad 196.6 226.5 232.6 255.8 243.4 270.5 297.5 283.9 315.4 347
Khanbogd 14.7 15.7 17.4 19.2 18.3 20.3 22.3 21.3 23.7 26
Khankhongor 433.9 462 513.3 564.6 538 597.8 657.5 627.4 697.2 766.9
Tsogttsetsii 25.8 27.4 30.5 33.5 31.9 35.5 39 37.2 41.4 45.5
Bayan-Ovoo 142.5 151.7 168.6 185.5 176.5 196.1 215.7 205.9 228.7 251.6
Mandal-Ovoo 17.7 18.9 21 23.1 22 24.4 26.8 25.6 28.5 31.3
Nomgon 24.5 26.1 29 31.9 30.3 33.7 37.1 35.4 39.3 43.3
Bayandalai 22.9 24.4 27.1 29.8 28.3 31.5 34.6 33 36.7 40.4
Khurmen 10.3 11 12.2 13.5 12.8 14.2 15.6 14.9 16.6 18.2
Total: 888.9 963.7 1,051.60 1,156.80 1,101.50 1,223.90 1,346.30 1,284.70 1,427.40 1,570.20
Soum
Water demand, TCM/year
20192030 2040 2050
low medium high low medium high low medium high
Bread 0.63 0.65 0.68 0.74 0.68 0.73 0.80 0.74 0.78 0.86
Cookies 0.09 0.09 0.10 0.10 0.10 0.10 0.11 0.10 0.11 0.12
Pie 0.05 0.05 0.05 0.06 0.05 0.05 0.06 0.06 0.06 0.07
Vodka 0.22 0.22 0.23 0.25 0.23 0.25 0.27 0.25 0.27 0.29
Milk 0.45 0.47 0.49 0.53 0.49 0.52 0.57 0.53 0.56 0.62
Meat, dampling 0.26 0.27 0.28 0.31 0.28 0.30 0.33 0.30 0.32 0.36
Bottled water 32.45 33.43 34.69 38.16 35.10 37.26 40.99 37.91 40.28 44.31
Total: 34.15 35.18 36.51 40.16 36.94 39.21 43.13 39.89 42.39 46.63
Key food products
Water demand, TCM/year
20192030 2040 2050
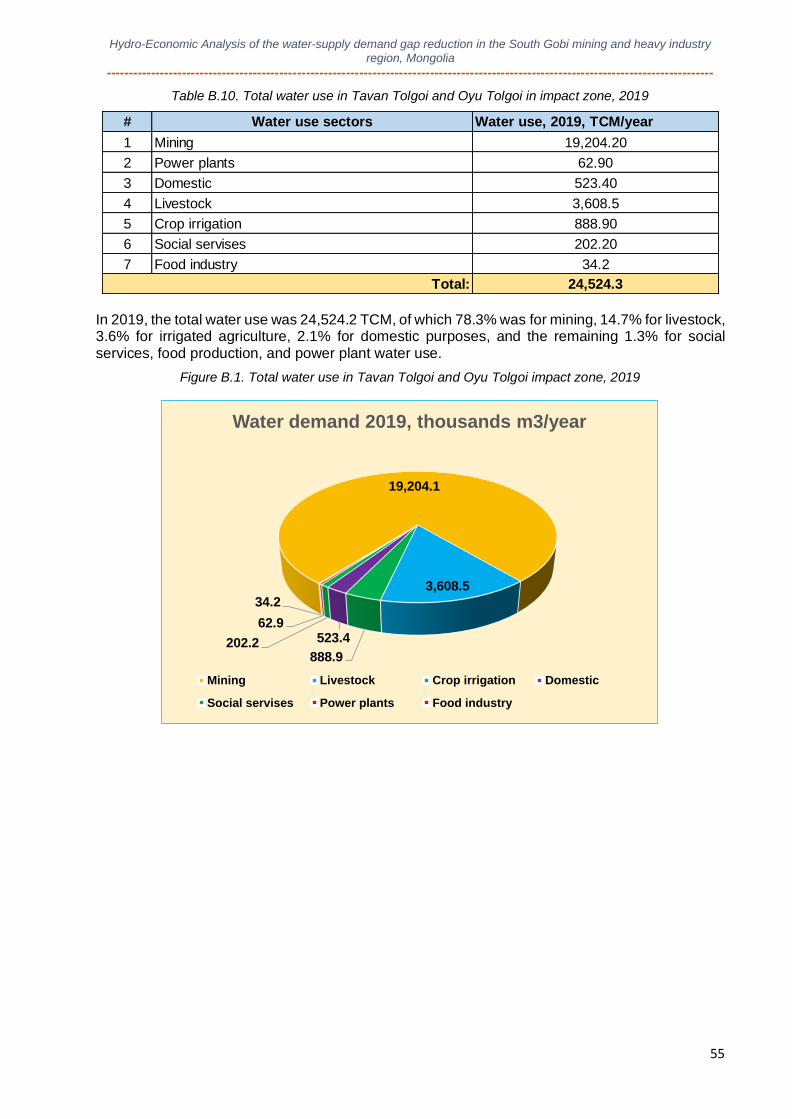
Hydro-Economic Analysis of the water-supply demand gap reduction in the South Gobi mining and heavy industry
region, Mongolia
-----------------------------------------------------------------------------------------------------------------------------------------
55
Table B.10. Total water use in Tavan Tolgoi and Oyu Tolgoi in impact zone, 2019
In 2019, the total water use was 24,524.2 TCM, of which 78.3% was for mining, 14.7% for livestock, 3.6% for irrigated agriculture, 2.1% for domestic purposes, and the remaining 1.3% for social services, food production, and power plant water use.
Figure B.1. Total water use in Tavan Tolgoi and Oyu Tolgoi impact zone, 2019
# Water use sectors Water use, 2019, TCM/year
1 Mining 19,204.20
2 Power plants 62.90
3 Domestic 523.40
4 Livestock 3,608.5
5 Crop irrigation 888.90
6 Social servises 202.20
7 Food industry 34.2
24,524.3Total:
19,204.1
3,608.5
888.9
523.4202.2
62.9
34.2
Water demand 2019, thousands m3/year
Mining Livestock Crop irrigation Domestic
Social servises Power plants Food industry
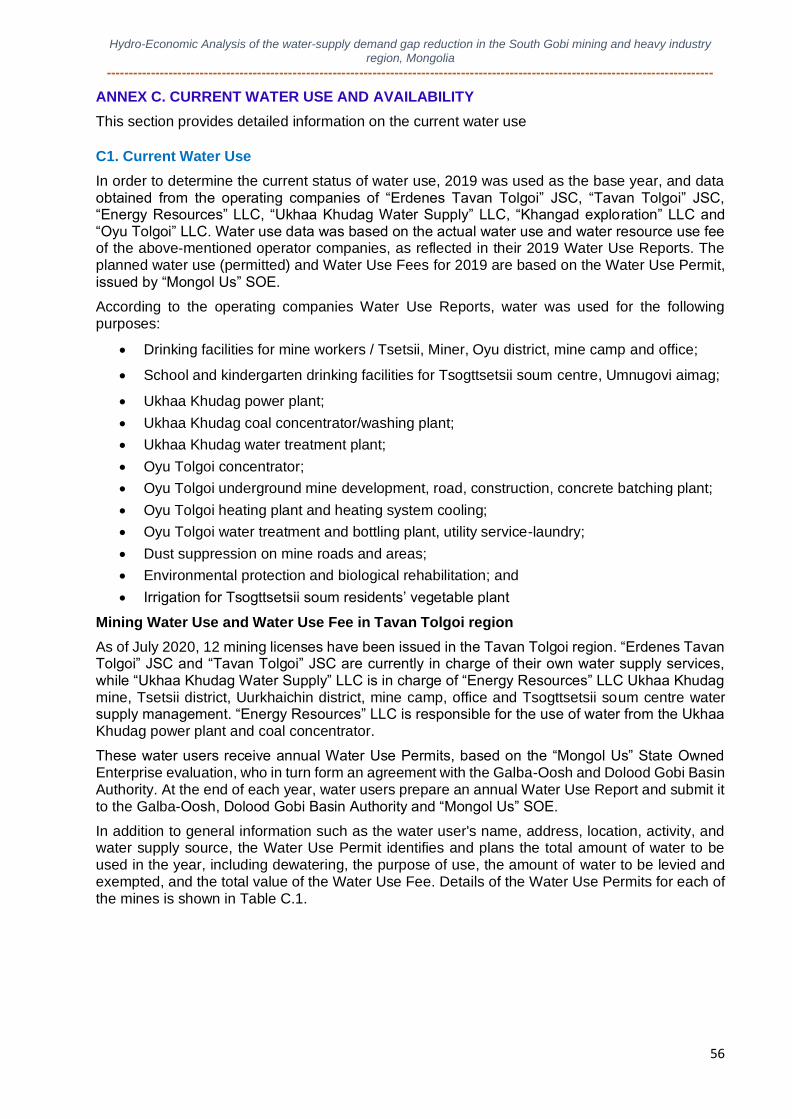
Hydro-Economic Analysis of the water-supply demand gap reduction in the South Gobi mining and heavy industry
region, Mongolia
-----------------------------------------------------------------------------------------------------------------------------------------
56
ANNEX C. CURRENT WATER USE AND AVAILABILITY
This section provides detailed information on the current water use C1. Current Water Use
In order to determine the current status of water use, 2019 was used as the base year, and data obtained from the operating companies of “Erdenes Tavan Tolgoi” JSC, “Tavan Tolgoi” JSC, “Energy Resources” LLC, “Ukhaa Khudag Water Supply” LLC, “Khangad exploration” LLC and “Oyu Tolgoi” LLC. Water use data was based on the actual water use and water resource use fee of the above-mentioned operator companies, as reflected in their 2019 Water Use Reports. The planned water use (permitted) and Water Use Fees for 2019 are based on the Water Use Permit, issued by “Mongol Us” SOE.
According to the operating companies Water Use Reports, water was used for the following purposes:
• Drinking facilities for mine workers / Tsetsii, Miner, Oyu district, mine camp and office;
• School and kindergarten drinking facilities for Tsogttsetsii soum centre, Umnugovi aimag;
• Ukhaa Khudag power plant;
• Ukhaa Khudag coal concentrator/washing plant;
• Ukhaa Khudag water treatment plant;
• Oyu Tolgoi concentrator;
• Oyu Tolgoi underground mine development, road, construction, concrete batching plant;
• Oyu Tolgoi heating plant and heating system cooling;
• Oyu Tolgoi water treatment and bottling plant, utility service-laundry;
• Dust suppression on mine roads and areas;
• Environmental protection and biological rehabilitation; and
• Irrigation for Tsogttsetsii soum residents’ vegetable plant
Mining Water Use and Water Use Fee in Tavan Tolgoi region
As of July 2020, 12 mining licenses have been issued in the Tavan Tolgoi region. “Erdenes Tavan Tolgoi” JSC and “Tavan Tolgoi” JSC are currently in charge of their own water supply services, while “Ukhaa Khudag Water Supply” LLC is in charge of “Energy Resources” LLC Ukhaa Khudag mine, Tsetsii district, Uurkhaichin district, mine camp, office and Tsogttsetsii soum centre water supply management. “Energy Resources” LLC is responsible for the use of water from the Ukhaa Khudag power plant and coal concentrator.
These water users receive annual Water Use Permits, based on the “Mongol Us” State Owned Enterprise evaluation, who in turn form an agreement with the Galba-Oosh and Dolood Gobi Basin Authority. At the end of each year, water users prepare an annual Water Use Report and submit it to the Galba-Oosh, Dolood Gobi Basin Authority and “Mongol Us” SOE.
In addition to general information such as the water user's name, address, location, activity, and water supply source, the Water Use Permit identifies and plans the total amount of water to be used in the year, including dewatering, the purpose of use, the amount of water to be levied and exempted, and the total value of the Water Use Fee. Details of the Water Use Permits for each of the mines is shown in Table C.1.
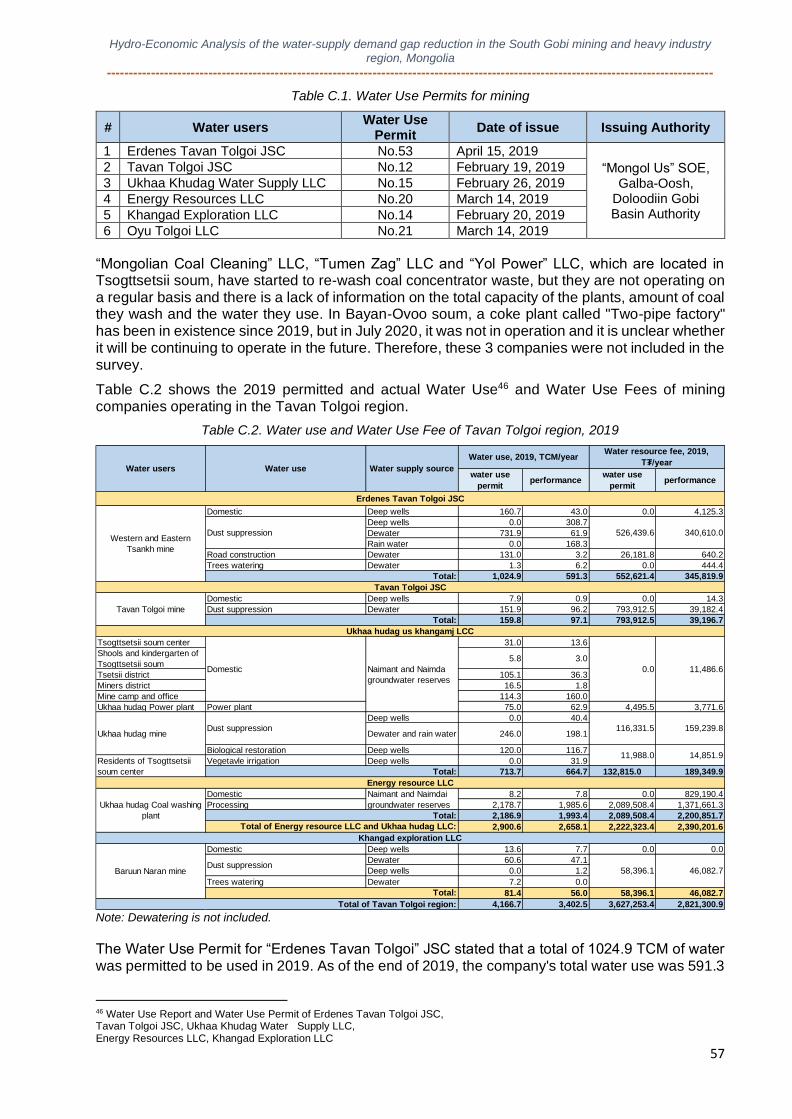
Hydro-Economic Analysis of the water-supply demand gap reduction in the South Gobi mining and heavy industry
region, Mongolia
-----------------------------------------------------------------------------------------------------------------------------------------
57
Table C.1. Water Use Permits for mining
# Water users Water Use
Permit Date of issue Issuing Authority
1 Erdenes Tavan Tolgoi JSC No.53 April 15, 2019
“Mongol Us” SOE, Galba-Oosh,
Doloodiin Gobi Basin Authority
2 Tavan Tolgoi JSC No.12 February 19, 2019
3 Ukhaa Khudag Water Supply LLC No.15 February 26, 2019
4 Energy Resources LLC No.20 March 14, 2019
5 Khangad Exploration LLC No.14 February 20, 2019
6 Oyu Tolgoi LLC No.21 March 14, 2019
“Mongolian Coal Cleaning” LLC, “Tumen Zag” LLC and “Yol Power” LLC, which are located in Tsogttsetsii soum, have started to re-wash coal concentrator waste, but they are not operating on a regular basis and there is a lack of information on the total capacity of the plants, amount of coal they wash and the water they use. In Bayan-Ovoo soum, a coke plant called "Two-pipe factory" has been in existence since 2019, but in July 2020, it was not in operation and it is unclear whether it will be continuing to operate in the future. Therefore, these 3 companies were not included in the survey.
Table C.2 shows the 2019 permitted and actual Water Use46 and Water Use Fees of mining companies operating in the Tavan Tolgoi region.
Table C.2. Water use and Water Use Fee of Tavan Tolgoi region, 2019
Note: Dewatering is not included.
The Water Use Permit for “Erdenes Tavan Tolgoi” JSC stated that a total of 1024.9 TCM of water was permitted to be used in 2019. As of the end of 2019, the company's total water use was 591.3
46 Water Use Report and Water Use Permit of Erdenes Tavan Tolgoi JSC, Tavan Tolgoi JSC, Ukhaa Khudag Water Supply LLC, Energy Resources LLC, Khangad Exploration LLC
water use
permitperformance
water use
permitperformance
Domestic Deep wells 160.7 43.0 0.0 4,125.3
Deep wells 0.0 308.7
Dewater 731.9 61.9
Rain water 0.0 168.3
Road construction Dewater 131.0 3.2 26,181.8 640.2
Trees watering Dewater 1.3 6.2 0.0 444.4
1,024.9 591.3 552,621.4 345,819.9
Domestic Deep wells 7.9 0.9 0.0 14.3
Dust suppression Dewater 151.9 96.2 793,912.5 39,182.4
159.8 97.1 793,912.5 39,196.7
Tsogttsetsii soum center 31.0 13.6
Shools and kindergarten of
Tsogttsetsii soum5.8 3.0
Tsetsii district 105.1 36.3
Miners district 16.5 1.8
Mine camp and office 114.3 160.0
Ukhaa hudag Power plant Power plant 75.0 62.9 4,495.5 3,771.6
Deep wells 0.0 40.4
Dewater and rain water 246.0 198.1
Biological restoration Deep wells 120.0 116.7
Vegetavle irrigation Deep wells 0.0 31.9
713.7 664.7 132,815.0 189,349.9
Domestic 8.2 7.8 0.0 829,190.4
Processing 2,178.7 1,985.6 2,089,508.4 1,371,661.3
2,186.9 1,993.4 2,089,508.4 2,200,851.7
2,900.6 2,658.1 2,222,323.4 2,390,201.6
Domestic Deep wells 13.6 7.7 0.0 0.0
Dewater 60.6 47.1
Deep wells 0.0 1.2
Trees watering Dewater 7.2 0.0
81.4 56.0 58,396.1 46,082.7
4,166.7 3,402.5 3,627,253.4 2,821,300.9
Water users Water use Water supply source
Water use, 2019, TCM/yearWater resource fee, 2019,
T₮/year
Erdenes Tavan Tolgoi JSC
Western and Eastern
Tsankh mine
Dust suppression 526,439.6 340,610.0
Total:
Tavan Tolgoi JSC
Tavan Tolgoi mine
Total:
Ukhaa hudag us khangamj LCC
Domestic Naimant and Naimda
groundwater reserves
0.0 11,486.6
Ukhaa hudag mineDust suppression 116,331.5 159,239.8
11,988.0 14,851.9Residents of Tsogttsetsii
soum center Total:
Total of Tavan Tolgoi region:
Energy resource LLC
Ukhaa hudag Coal washing
plant
Naimant and Naimdai
groundwater reserves
Total:
Total of Energy resource LLC and Ukhaa hudag LLC:
Khangad exploration LLC
Baruun Naran mineDust suppression
58,396.1 46,082.7
Total:
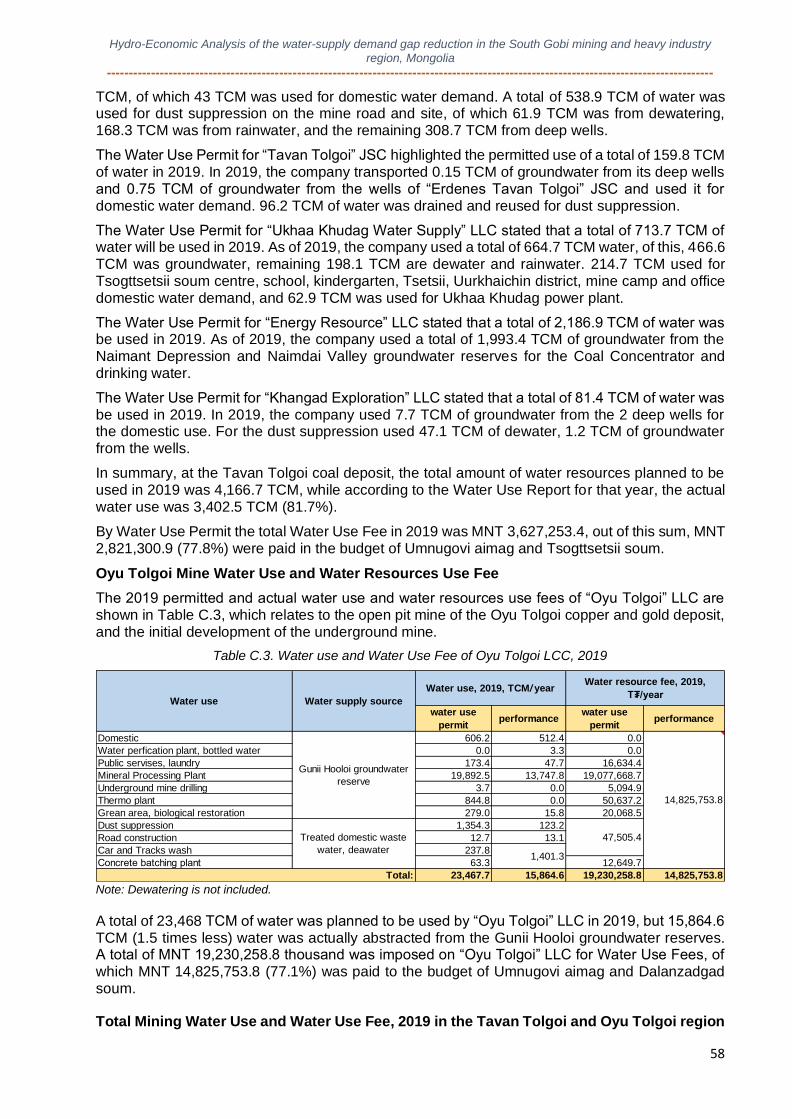
Hydro-Economic Analysis of the water-supply demand gap reduction in the South Gobi mining and heavy industry
region, Mongolia
-----------------------------------------------------------------------------------------------------------------------------------------
58
TCM, of which 43 TCM was used for domestic water demand. A total of 538.9 TCM of water was used for dust suppression on the mine road and site, of which 61.9 TCM was from dewatering, 168.3 TCM was from rainwater, and the remaining 308.7 TCM from deep wells.
The Water Use Permit for “Tavan Tolgoi” JSC highlighted the permitted use of a total of 159.8 TCM of water in 2019. In 2019, the company transported 0.15 TCM of groundwater from its deep wells and 0.75 TCM of groundwater from the wells of “Erdenes Tavan Tolgoi” JSC and used it for domestic water demand. 96.2 TCM of water was drained and reused for dust suppression.
The Water Use Permit for “Ukhaa Khudag Water Supply” LLC stated that a total of 713.7 TCM of water will be used in 2019. As of 2019, the company used a total of 664.7 TCM water, of this, 466.6 TCM was groundwater, remaining 198.1 TCM are dewater and rainwater. 214.7 TCM used for Tsogttsetsii soum centre, school, kindergarten, Tsetsii, Uurkhaichin district, mine camp and office domestic water demand, and 62.9 TCM was used for Ukhaa Khudag power plant.
The Water Use Permit for “Energy Resource” LLC stated that a total of 2,186.9 TCM of water was be used in 2019. As of 2019, the company used a total of 1,993.4 TCM of groundwater from the Naimant Depression and Naimdai Valley groundwater reserves for the Coal Concentrator and drinking water.
The Water Use Permit for “Khangad Exploration” LLC stated that a total of 81.4 TCM of water was be used in 2019. In 2019, the company used 7.7 TCM of groundwater from the 2 deep wells for the domestic use. For the dust suppression used 47.1 TCM of dewater, 1.2 TCM of groundwater from the wells.
In summary, at the Tavan Tolgoi coal deposit, the total amount of water resources planned to be used in 2019 was 4,166.7 TCM, while according to the Water Use Report for that year, the actual water use was 3,402.5 TCM (81.7%).
By Water Use Permit the total Water Use Fee in 2019 was MNT 3,627,253.4, out of this sum, MNT 2,821,300.9 (77.8%) were paid in the budget of Umnugovi aimag and Tsogttsetsii soum.
Oyu Tolgoi Mine Water Use and Water Resources Use Fee
The 2019 permitted and actual water use and water resources use fees of “Oyu Tolgoi” LLC are shown in Table C.3, which relates to the open pit mine of the Oyu Tolgoi copper and gold deposit, and the initial development of the underground mine.
Table C.3. Water use and Water Use Fee of Oyu Tolgoi LCC, 2019
Note: Dewatering is not included.
A total of 23,468 TCM of water was planned to be used by “Oyu Tolgoi” LLC in 2019, but 15,864.6 TCM (1.5 times less) water was actually abstracted from the Gunii Hooloi groundwater reserves. A total of MNT 19,230,258.8 thousand was imposed on “Oyu Tolgoi” LLC for Water Use Fees, of which MNT 14,825,753.8 (77.1%) was paid to the budget of Umnugovi aimag and Dalanzadgad soum.
Total Mining Water Use and Water Use Fee, 2019 in the Tavan Tolgoi and Oyu Tolgoi region
water use
permitperformance
water use
permitperformance
Domestic 606.2 512.4 0.0
Water perfication plant, bottled water 0.0 3.3 0.0
Public servises, laundry 173.4 47.7 16,634.4
Mineral Processing Plant 19,892.5 13,747.8 19,077,668.7
Underground mine drilling 3.7 0.0 5,094.9
Thermo plant 844.8 0.0 50,637.2
Grean area, biological restoration 279.0 15.8 20,068.5
Dust suppression 1,354.3 123.2
Road construction 12.7 13.1
Car and Tracks wash 237.8
Сoncrete batching plant 63.3 12,649.7
23,467.7 15,864.6 19,230,258.8 14,825,753.8Total:
Water use Water supply source
Water use, 2019, TCM/ yearWater resource fee, 2019,
T₮/year
Gunii Hooloi groundwater
reserve
14,825,753.8
Treated domestic waste
water, deawater
47,505.4
1,401.3
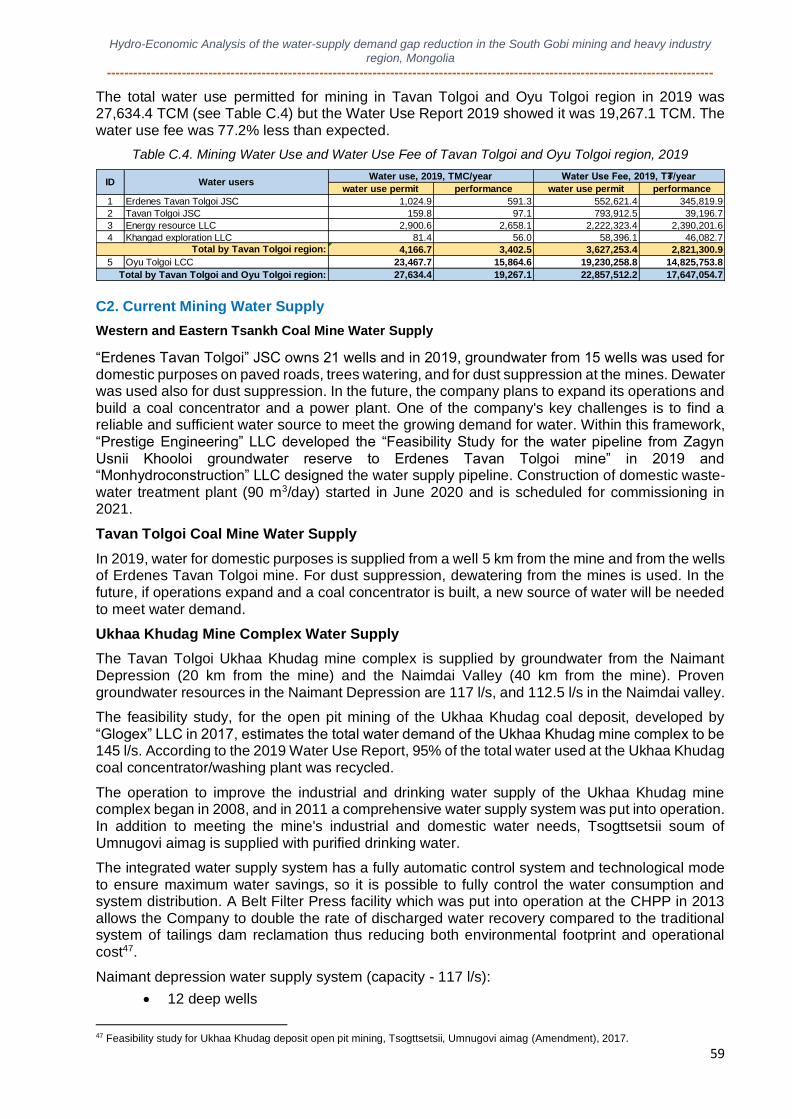
Hydro-Economic Analysis of the water-supply demand gap reduction in the South Gobi mining and heavy industry
region, Mongolia
-----------------------------------------------------------------------------------------------------------------------------------------
59
The total water use permitted for mining in Tavan Tolgoi and Oyu Tolgoi region in 2019 was 27,634.4 TCM (see Table C.4) but the Water Use Report 2019 showed it was 19,267.1 TCM. The water use fee was 77.2% less than expected.
Table C.4. Mining Water Use and Water Use Fee of Tavan Tolgoi and Oyu Tolgoi region, 2019
C2. Current Mining Water Supply
Western and Eastern Tsankh Coal Mine Water Supply
“Erdenes Tavan Tolgoi” JSC owns 21 wells and in 2019, groundwater from 15 wells was used for domestic purposes on paved roads, trees watering, and for dust suppression at the mines. Dewater was used also for dust suppression. In the future, the company plans to expand its operations and build a coal concentrator and a power plant. One of the company's key challenges is to find a reliable and sufficient water source to meet the growing demand for water. Within this framework, “Prestige Engineering” LLC developed the “Feasibility Study for the water pipeline from Zagyn Usnii Khooloi groundwater reserve to Erdenes Tavan Tolgoi mine” in 2019 and “Monhydroconstruction” LLC designed the water supply pipeline. Construction of domestic waste- water treatment plant (90 m3/day) started in June 2020 and is scheduled for commissioning in 2021. Tavan Tolgoi Coal Mine Water Supply
In 2019, water for domestic purposes is supplied from a well 5 km from the mine and from the wells of Erdenes Tavan Tolgoi mine. For dust suppression, dewatering from the mines is used. In the future, if operations expand and a coal concentrator is built, a new source of water will be needed to meet water demand.
Ukhaa Khudag Mine Complex Water Supply
The Tavan Tolgoi Ukhaa Khudag mine complex is supplied by groundwater from the Naimant Depression (20 km from the mine) and the Naimdai Valley (40 km from the mine). Proven groundwater resources in the Naimant Depression are 117 l/s, and 112.5 l/s in the Naimdai valley.
The feasibility study, for the open pit mining of the Ukhaa Khudag coal deposit, developed by “Glogex” LLC in 2017, estimates the total water demand of the Ukhaa Khudag mine complex to be 145 l/s. According to the 2019 Water Use Report, 95% of the total water used at the Ukhaa Khudag coal concentrator/washing plant was recycled.
The operation to improve the industrial and drinking water supply of the Ukhaa Khudag mine complex began in 2008, and in 2011 a comprehensive water supply system was put into operation. In addition to meeting the mine's industrial and domestic water needs, Tsogttsetsii soum of Umnugovi aimag is supplied with purified drinking water.
The integrated water supply system has a fully automatic control system and technological mode to ensure maximum water savings, so it is possible to fully control the water consumption and system distribution. A Belt Filter Press facility which was put into operation at the CHPP in 2013 allows the Company to double the rate of discharged water recovery compared to the traditional system of tailings dam reclamation thus reducing both environmental footprint and operational cost47.
Naimant depression water supply system (capacity - 117 l/s):
• 12 deep wells
47 Feasibility study for Ukhaa Khudag deposit open pit mining, Tsogttsetsii, Umnugovi aimag (Amendment), 2017.
water use permit performance water use permit performance
1 Erdenes Tavan Tolgoi JSC 1,024.9 591.3 552,621.4 345,819.9
2 Tavan Tolgoi JSC 159.8 97.1 793,912.5 39,196.7
3 Energy resource LLC 2,900.6 2,658.1 2,222,323.4 2,390,201.6
4 Khangad exploration LLC 81.4 56.0 58,396.1 46,082.7
4,166.7 3,402.5 3,627,253.4 2,821,300.9
5 Oyu Tolgoi LCC 23,467.7 15,864.6 19,230,258.8 14,825,753.8
27,634.4 19,267.1 22,857,512.2 17,647,054.7
Total by Tavan Tolgoi region:
Total by Tavan Tolgoi and Oyu Tolgoi region:
ID Water usersWater use, 2019, TMC/year Water Use Fee, 2019, T₮/year
Hydro-Economic Analysis of the water-supply demand gap reduction in the South Gobi mining and heavy industry
region, Mongolia
-----------------------------------------------------------------------------------------------------------------------------------------
60
• 43.5 km collection pipeline to draw water from deep well
• 2nd booster pump station
• 12 km water distribution dual main line
• Reinforced concrete reservoir with a volume of 500m3
• Reservoir with a capacity of 2х28000 m3
• 4.5 km branch line to supply water to soum centre and mining village
• 4.1 km distribution line in the production line
• Water treatment facilities to supply drinking water to Tsogttsetsii soum and mining village.
Naimdai valley supply system (capacity – 72.5 l/s):
• 10 deep wells
• 27.5 km collection pipeline to draw water from deep well
• 2nd, 3rd and 4th booster pump stations
• 50 km water distribution dual main line
• 3 reinforced concrete reservoir with a volume of 1000 m3.
The Tsogttsetsii soum sewage treatment plant, which is designed to treat wastewater from the population of Tsogttsetsii soum and the mine workers' town, has Czech SPR technology and a fully automatic system. Up to 96% of 1,200 m3 of domestic wastewater can be treated per day.
The mine wastewater treatment plant has a capacity of 100 m3/day and treats 96-99% of the domestic wastewater from the mine site facilities by membrane bioreactor.
The feasibility study for open pit mining of the Ukhaa Khudag coal deposit (Amendment-2017) includes the Naiman Depression and Naimdai Valley groundwater reserves, which will be operated for a period of 28 years or until 2047 with a capacity of 10 million tons/year. The resources are considered sufficient. It can be seen that the Ukhaa Khudag mine complex of “Energy Resources” LLC has completely solved its water supply problem.
Baruun Naran mine Water Supply
In 2019, water for domestic purposes is supplied from 2 wells. Domestic wastewater is collected in two septic tanks, biologically treated and absorbed into the soil. Dewater and rainwater are used for the dust suppression.
Oyu Tolgoi Mining Water Supply
The Oyu Tolgoi mine draws its water from the Gunii Hooloi groundwater reserves. The approved potential volume of water to be extracted from the Gunii Hooloi groundwater reserves is 918 l/s. In 2019, total of 14,327.0 TCM (454.3 l/s) of water was extracted from the Gunii Hooloi groundwater reserves and 87.1% of the total water used was recycled.
The Gunii Hooloi groundwater abstraction facility has a capacity of 77.6 TCM per day, 28 deep wells, 5 water collection and pumping stations, 1 intermittent lifting station, 2 reservoirs with a capacity of 200.0 TCM each, and 153 km of water transmission pipes. There are 4 domestic wastewater treatment plants at the mine site and 1 at Khanbumbat airport, with a capacity of 2,780 m3/day (22,240 people/day). In 2019, 772.9 TCM of domestic wastewater was received and treated48.
48 Water Use report of Oyu Tolgoi LLC,2019
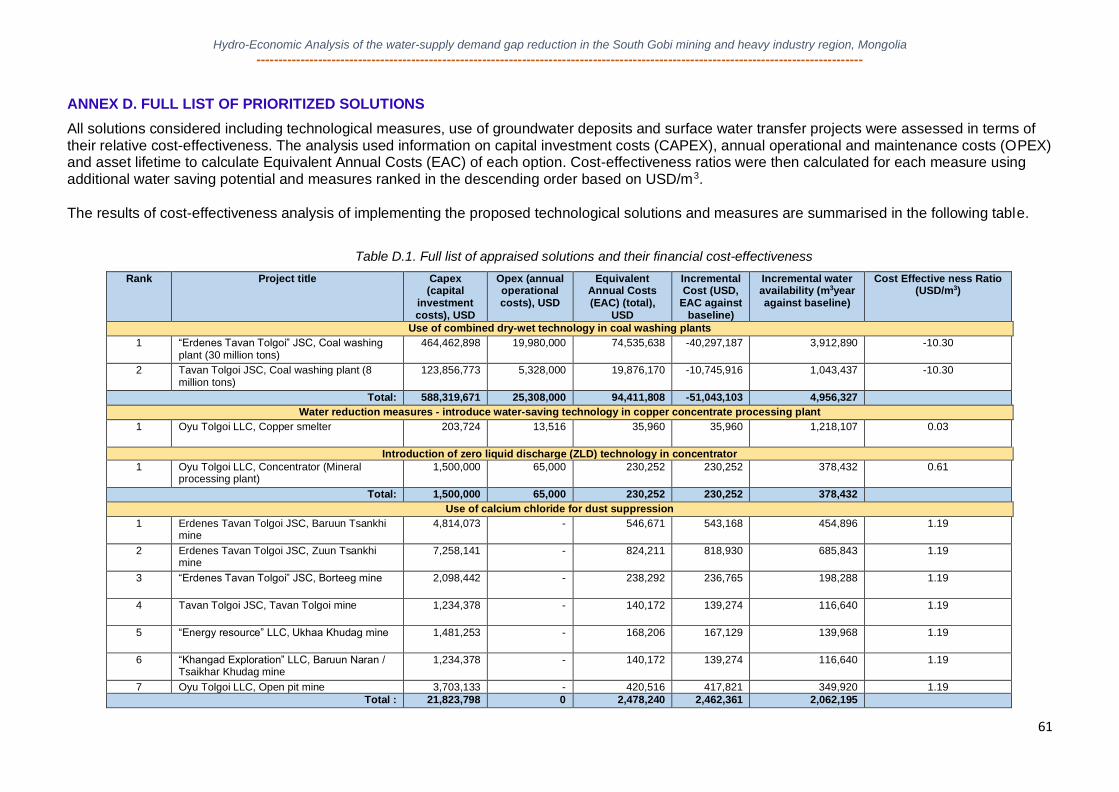
Hydro-Economic Analysis of the water-supply demand gap reduction in the South Gobi mining and heavy industry region, Mongolia
-----------------------------------------------------------------------------------------------------------------------------------------
61
ANNEX D. FULL LIST OF PRIORITIZED SOLUTIONS
All solutions considered including technological measures, use of groundwater deposits and surface water transfer projects were assessed in terms of their relative cost-effectiveness. The analysis used information on capital investment costs (CAPEX), annual operational and maintenance costs (OPEX) and asset lifetime to calculate Equivalent Annual Costs (EAC) of each option. Cost-effectiveness ratios were then calculated for each measure using additional water saving potential and measures ranked in the descending order based on USD/m3. The results of cost-effectiveness analysis of implementing the proposed technological solutions and measures are summarised in the following table.
Table D.1. Full list of appraised solutions and their financial cost-effectiveness
Rank Project title Capex (capital
investment costs), USD
Opex (annual operational costs), USD
Equivalent Annual Costs (EAC) (total),
USD
Incremental Cost (USD,
EAC against baseline)
Incremental water availability (m3year against baseline)
Cost Effective ness Ratio (USD/m3)
Use of combined dry-wet technology in coal washing plants
1 “Erdenes Tavan Tolgoi” JSC, Coal washing plant (30 million tons)
464,462,898 19,980,000 74,535,638 -40,297,187 3,912,890 -10.30
2 Tavan Tolgoi JSC, Coal washing plant (8 million tons)
123,856,773 5,328,000 19,876,170 -10,745,916 1,043,437 -10.30
Total: 588,319,671 25,308,000 94,411,808 -51,043,103 4,956,327
Water reduction measures - introduce water-saving technology in copper concentrate processing plant
1 Oyu Tolgoi LLC, Copper smelter 203,724 13,516 35,960 35,960 1,218,107 0.03
Introduction of zero liquid discharge (ZLD) technology in concentrator
1 Oyu Tolgoi LLC, Concentrator (Mineral processing plant)
1,500,000 65,000 230,252 230,252 378,432 0.61
Total: 1,500,000 65,000 230,252 230,252 378,432
Use of calcium chloride for dust suppression
1 Erdenes Tavan Tolgoi JSC, Baruun Tsankhi mine
4,814,073 - 546,671 543,168 454,896 1.19
2 Erdenes Tavan Tolgoi JSC, Zuun Tsankhi mine
7,258,141 - 824,211 818,930 685,843 1.19
3 “Erdenes Tavan Tolgoi” JSC, Borteeg mine 2,098,442 - 238,292 236,765 198,288 1.19
4 Tavan Tolgoi JSC, Tavan Tolgoi mine 1,234,378 - 140,172 139,274 116,640 1.19
5 “Energy resource” LLC, Ukhaa Khudag mine 1,481,253 - 168,206 167,129 139,968 1.19
6 “Khangad Exploration” LLC, Baruun Naran / Tsaikhar Khudag mine
1,234,378 - 140,172 139,274 116,640 1.19
7 Oyu Tolgoi LLC, Open pit mine 3,703,133 - 420,516 417,821 349,920 1.19
Total : 21,823,798 0 2,478,240 2,462,361 2,062,195
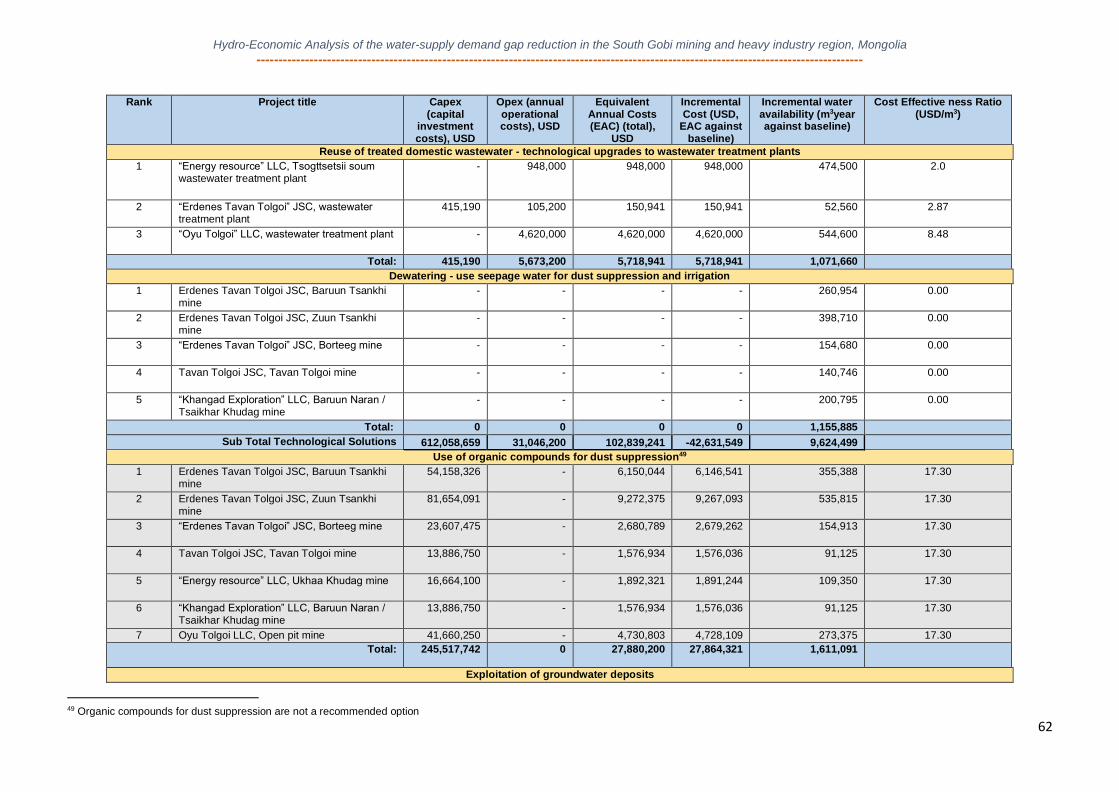
Hydro-Economic Analysis of the water-supply demand gap reduction in the South Gobi mining and heavy industry region, Mongolia
-----------------------------------------------------------------------------------------------------------------------------------------
62
Rank Project title Capex (capital
investment costs), USD
Opex (annual operational costs), USD
Equivalent Annual Costs (EAC) (total),
USD
Incremental Cost (USD,
EAC against baseline)
Incremental water availability (m3year against baseline)
Cost Effective ness Ratio (USD/m3)
Reuse of treated domestic wastewater - technological upgrades to wastewater treatment plants
1 “Energy resource” LLC, Tsogttsetsii soum wastewater treatment plant
- 948,000 948,000 948,000 474,500 2.0
2 “Erdenes Tavan Tolgoi” JSC, wastewater treatment plant
415,190 105,200 150,941 150,941 52,560 2.87
3 “Oyu Tolgoi” LLC, wastewater treatment plant - 4,620,000 4,620,000 4,620,000 544,600 8.48
Total: 415,190 5,673,200 5,718,941 5,718,941 1,071,660
Dewatering - use seepage water for dust suppression and irrigation
1 Erdenes Tavan Tolgoi JSC, Baruun Tsankhi mine
- - - - 260,954 0.00
2 Erdenes Tavan Tolgoi JSC, Zuun Tsankhi mine
- - - - 398,710 0.00
3 “Erdenes Tavan Tolgoi” JSC, Borteeg mine - - - - 154,680 0.00
4 Tavan Tolgoi JSC, Tavan Tolgoi mine - - - - 140,746 0.00
5 “Khangad Exploration” LLC, Baruun Naran / Tsaikhar Khudag mine
- - - - 200,795 0.00
Total: 0 0 0 0 1,155,885
Sub Total Technological Solutions 612,058,659 31,046,200 102,839,241 -42,631,549 9,624,499
Use of organic compounds for dust suppression49
1 Erdenes Tavan Tolgoi JSC, Baruun Tsankhi mine
54,158,326 - 6,150,044 6,146,541 355,388 17.30
2 Erdenes Tavan Tolgoi JSC, Zuun Tsankhi mine
81,654,091 - 9,272,375 9,267,093 535,815 17.30
3 “Erdenes Tavan Tolgoi” JSC, Borteeg mine 23,607,475 - 2,680,789 2,679,262 154,913 17.30
4 Tavan Tolgoi JSC, Tavan Tolgoi mine 13,886,750 - 1,576,934 1,576,036 91,125 17.30
5 “Energy resource” LLC, Ukhaa Khudag mine 16,664,100 - 1,892,321 1,891,244 109,350 17.30
6 “Khangad Exploration” LLC, Baruun Naran / Tsaikhar Khudag mine
13,886,750 - 1,576,934 1,576,036 91,125 17.30
7 Oyu Tolgoi LLC, Open pit mine 41,660,250 - 4,730,803 4,728,109 273,375 17.30
Total: 245,517,742
0 27,880,200 27,864,321 1,611,091
Exploitation of groundwater deposits
49 Organic compounds for dust suppression are not a recommended option
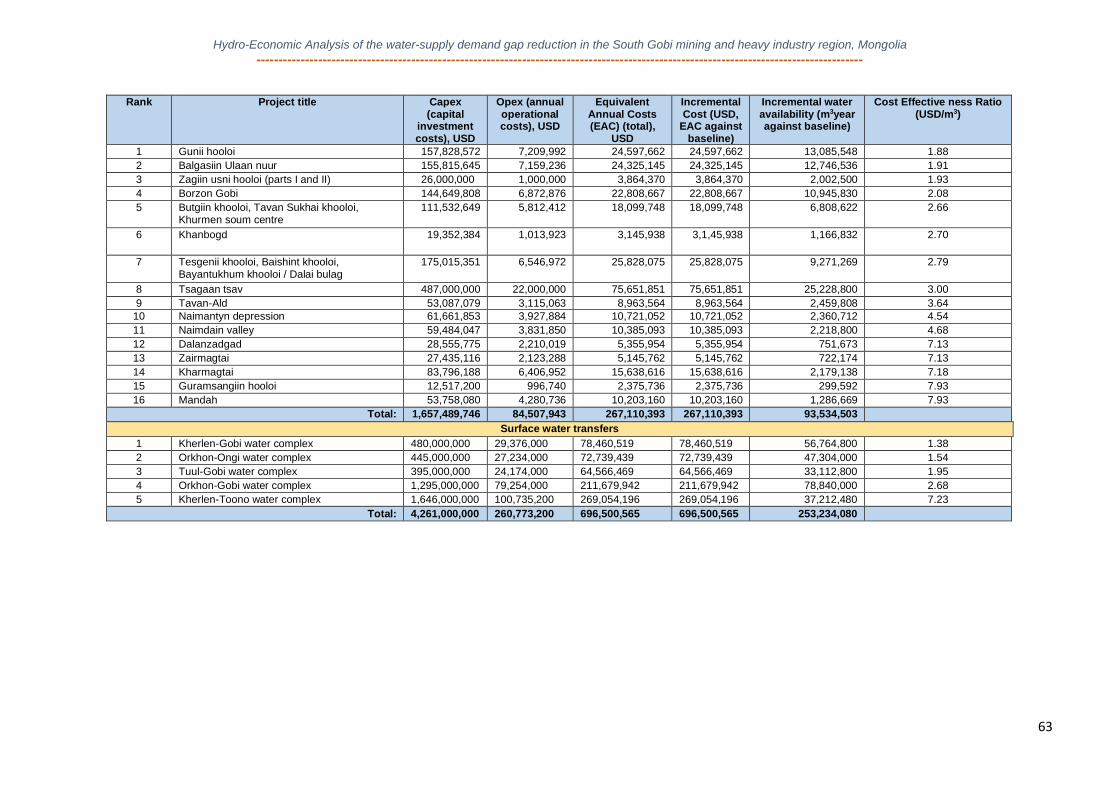
Hydro-Economic Analysis of the water-supply demand gap reduction in the South Gobi mining and heavy industry region, Mongolia
-----------------------------------------------------------------------------------------------------------------------------------------
63
Rank Project title Capex (capital
investment costs), USD
Opex (annual operational costs), USD
Equivalent Annual Costs (EAC) (total),
USD
Incremental Cost (USD,
EAC against baseline)
Incremental water availability (m3year against baseline)
Cost Effective ness Ratio (USD/m3)
1 Gunii hooloi 157,828,572 7,209,992 24,597,662 24,597,662 13,085,548 1.88
2 Balgasiin Ulaan nuur 155,815,645 7,159,236 24,325,145 24,325,145 12,746,536 1.91
3 Zagiin usni hooloi (parts I and II) 26,000,000 1,000,000 3,864,370 3,864,370 2,002,500 1.93
4 Borzon Gobi 144,649,808 6,872,876 22,808,667 22,808,667 10,945,830 2.08
5 Butgiin khooloi, Tavan Sukhai khooloi, Khurmen soum centre
111,532,649 5,812,412 18,099,748 18,099,748 6,808,622 2.66
6 Khanbogd 19,352,384 1,013,923 3,145,938 3,1,45,938 1,166,832 2.70
7 Tesgenii khooloi, Baishint khooloi, Bayantukhum khooloi / Dalai bulag
175,015,351 6,546,972 25,828,075 25,828,075 9,271,269 2.79
8 Tsagaan tsav 487,000,000 22,000,000 75,651,851 75,651,851 25,228,800 3.00
9 Tavan-Ald 53,087,079 3,115,063 8,963,564 8,963,564 2,459,808 3.64
10 Naimantyn depression 61,661,853 3,927,884 10,721,052 10,721,052 2,360,712 4.54
11 Naimdain valley 59,484,047 3,831,850 10,385,093 10,385,093 2,218,800 4.68
12 Dalanzadgad 28,555,775 2,210,019 5,355,954 5,355,954 751,673 7.13
13 Zairmagtai 27,435,116 2,123,288 5,145,762 5,145,762 722,174 7.13
14 Kharmagtai 83,796,188 6,406,952 15,638,616 15,638,616 2,179,138 7.18
15 Guramsangiin hooloi 12,517,200 996,740 2,375,736 2,375,736 299,592 7.93
16 Mandah 53,758,080 4,280,736 10,203,160 10,203,160 1,286,669 7.93
Total: 1,657,489,746 84,507,943 267,110,393 267,110,393 93,534,503
Surface water transfers
1 Kherlen-Gobi water complex 480,000,000 29,376,000 78,460,519 78,460,519 56,764,800 1.38
2 Orkhon-Ongi water complex 445,000,000 27,234,000 72,739,439 72,739,439 47,304,000 1.54
3 Tuul-Gobi water complex 395,000,000 24,174,000 64,566,469 64,566,469 33,112,800 1.95
4 Orkhon-Gobi water complex 1,295,000,000 79,254,000 211,679,942 211,679,942 78,840,000 2.68
5 Kherlen-Toono water complex 1,646,000,000 100,735,200 269,054,196 269,054,196 37,212,480 7.23
Total: 4,261,000,000 260,773,200 696,500,565 696,500,565 253,234,080

Hydro-Economic Analysis of the water-supply demand gap reduction in the South Gobi mining and heavy industry
region, Mongolia
-----------------------------------------------------------------------------------------------------------------------------------------
64