Embed Size (px)
Citation preview

www.aidsdatahub.org
HIV and AIDSData Hub for Asia-PacificReview in slides
Mongolia
HIV and AIDS Data Hub for Asia-Pacific
2
Basic socio-demographic indicators
HIV prevalence and epidemiological status
Risk behaviors
Vulnerability and HIV knowledge
HIV Expenditure
National Response
CONTENT

HIV and AIDS Data Hub for Asia-Pacific
3
BASIC SOCIO-DEMOGRAPHIC INDICATORS Total population (in thousands) 2,888 (2013) 4
Annual population growth rate 1.4 (2015-2020) 4
Population aged 15-49 (thousands) 1,640 (2010) 4
Percentage of population in urban areas 68.5 (2011) 3
Crude birth rate (births per 1,000 population) 23.3 (2011) 3
Under-5 mortality rate (per 1,000 live births) 32 (2010) 2
Human development index (HDI) - Rank/Value 110/0.653 (2011) 1
Life expectancy at birth (years) 68.5 (2011) 1
Adult literacy rate 97.5 (2005-2010) 1
Ratio of girls to boys in primary and secondary education (%) 101.71 (2011) 3
GDP per capita (PPP, $US) 3,129 (2011) 3
Per capita total health expenditure (Int.$) 217 (2009) 2
Sources: Prepared by www.aidsdatahub.org based on 1. UNDP. (2011). Human Development Report 2011 - Sustainability and Equity: A Better Future for All; 2. WHO. (2012). World Health Statistics 2012; 3. World Bank. World Data Bank: World Development Indicators & Global Development Finance. Retrieved March, 2013, from h t t p : / / d a t a b a n k . w o r l d b a n k . o r g ; and 4. UN Population Division. (2011). World Population Prospects The 2010 Revision.

www.aidsdatahub.org
HIV prevalence and epidemiology

HIV and AIDS Data Hub for Asia-Pacific
Latest!
Estimated number of people living with HIV, women living with HIV, new HIV infections, adult HIV prevalence and AIDS-related deaths, 2005 and 2013
5
2013 2005
Estimate [Low – High Estimate] Estimate [Low – High Estimate]
Adults and children living with HIV
<1,000 [<500 – <1,000] <100 [<100 - <200]
Women (15+) living with HIV <100 [<100 - <100] <100 [<100 - <100]
New HIV infections <200 [<100 - <200] - -
Adult (15-49) HIV prevalence <0.1 [<0.1 – <0.1] <0.1 [<0.1 – <0.1]
AIDS-related deaths <100 [<100 - <100] <100 [<100 - <100]
Source: Prepared by www.aidsdatahub.org based on UNAIDS. (2014). The Gap Report; and www.aidsinfoonline.org

HIV and AIDS Data Hub for Asia-Pacific
Latest!
6
Key population size estimates, 2006
Source: Prepared by www.aidsdatahub.org based on 1. National Committee on HIV/AIDS, UN, & gtz. (2008). Comprehensive Review of the National Response to HIV and STIs in Mongolia; and 2. National Committee on HIV/AIDS. (2010). National Strategic Plan on HIV, AIDS and STIs: 2010-2015. Ulaanbaatar.
Population size estimates
Populations Low estimate High estimate Year of estimate
Female sex workers 1 1,500 19,000 2006
Men who have sex with men (homo and bisexual) 2 11,500 15,000 2006

HIV and AIDS Data Hub for Asia-Pacific
Latest!
7
HIV prevalence among key populations, 2009 and 2012
Men who have sex with men*
Female sex workers
People who inject drugs
0
2
4
6
8
10
12
1.8
0 NA
10.72009 2012
%
Source: Prepared by www.aidsdatahub.org based on 1. National Committee on HIV/AIDS. (2010). UNGASS Country Progress Report: Mongolia; and 2. Global Fund Supported Project on AIDS and TB, Ministry of Health. (2012). Second Generation HIV and STI Surveillance Report 2012.
2012 survey used a different methodology and data should be interpreted with caution when the results are compared with earlier rounds
* Weighted HIV prevalence in 2012 is 7.5%

HIV and AIDS Data Hub for Asia-Pacific
Latest!
Syphilis prevalence among MSM, 2007-2011
8
2007 2009 20110
5
10
15
20
25
30
35
3026.4
9.7
%
Source: Prepared by www.aidsdatahub.org based on National Committee on HIV and AIDS. (2012). Mongolia Global AIDS Response Progress Report, 2012.

HIV and AIDS Data Hub for Asia-Pacific
Latest!
Weighted syphilis prevalence among female sex workers, 2012
9Source: Prepared by www.aidsdatahub.org based on Global Fund Supported Project on AIDS and TB, Ministry of Health. (2012). Second Generation HIV and STI Surveillance Report 2012.
Khuvsgul province
Orkhon province
Dornod province
Ulaanbaatar city
Darkhan city Total 0
10
20
30
40
50
18.321.9
29.531.3
41.3
27.8
%
HIV and AIDS Data Hub for Asia-Pacific
Latest!
10
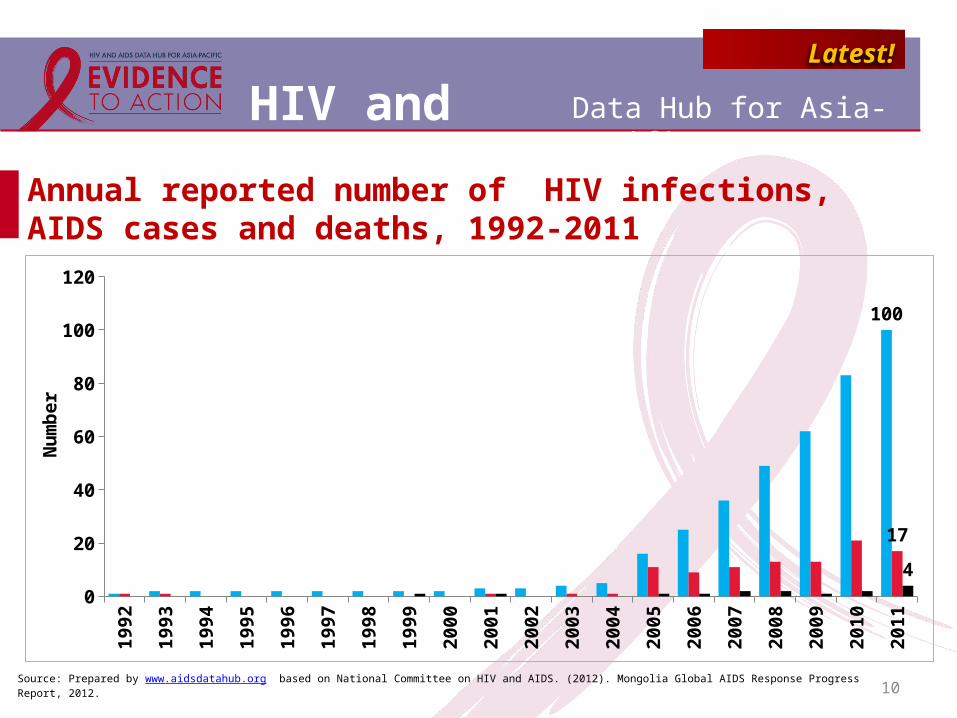
Annual reported number of HIV infections, AIDS cases and deaths, 1992-2011
19
92
19
93
19
94
19
95
19
96
19
97
19
98
19
99
20
00
20
01
20
02
20
03
20
04
20
05
20
06
20
07
20
08
20
09
20
10
20
11
0
20
40
60
80
100
120
100
17
4
Nu
mb
er
Source: Prepared by www.aidsdatahub.org based on National Committee on HIV and AIDS. (2012). Mongolia Global AIDS Response Progress Report, 2012.

HIV and AIDS Data Hub for Asia-Pacific
Latest!
11
68
10
21
1
MSM FSW Hetrosexual Unknown
Cumulative HIV cases by mode of transmission, 2009
Source: Prepared by www.aidsdatahub.org based on National Committee on HIV/AIDS. (2010). UNGASS Country Progress Report: Mongolia

www.aidsdatahub.org
Risk behaviours

HIV and AIDS Data Hub for Asia-Pacific
Latest!
Trends in condom use at last sex among key populations, 2005-2012
13Source: Prepared by www.aidsdatahub.org based on 1. UNAIDS. (2008). 2008 Report on the Global AIDS Epidemic; 2. Preliminary Data from Second Generation Sentinel Surveillance 2009 cited in National Committee on HIV/AIDS. (2010). UNGASS Country Progress Report: Mongolia; 3. National Committee on HIV and AIDS. (2012). Mongolia Global AIDS Response Progress Report, 2012; and 4. Ministry of Health and NCCD. (2012). Second Generation HIV and STI surveillance Report, 2012. Mongolia.
2005 2007 2009 20120
20
40
60
80
100 96 92 9081
67
87 85
70
FSW MSM
%

HIV and AIDS Data Hub for Asia-Pacific
Latest!
Sexual behaviours among MSM, Ulaanbaatar, 2012
14Source: Prepared by www.aidsdatahub.org based on Global Fund Supported Project on AIDS and TB, Ministry of Health. (2012). Second Generation HIV and STI Surveillance Report 2012.
Co
nd
om
us
e a
t la
st
se
x
Co
ns
iste
nt
co
nd
om
us
e (
las
t 1
2 m
on
ths
)
Re
ce
ive
d p
ay
me
nt
for
se
x
wit
h m
ale
pa
rtn
er
Ha
d s
ex
wit
h f
em
ale
(l
as
t 1
2 m
on
ths
)
Ha
d s
ex
wit
h c
om
me
rcia
l fe
ma
le p
art
ne
r
Sexual behaviour with male partners Sexual behaviour with female partners
0
20
40
60
80
100
70
48
4
36
2.9
%

HIV and AIDS Data Hub for Asia-Pacific
Latest!
Proportion of female sex workers reported condom use at last sex and consistent condom use by partner type, 2012
15
Condom use at last sex Consistent condom use in the last 12 months
0
20
40
60
80
100
814948
2519 7
with client
with non-permanent non-paying partner
with permanent partner
%
Source: Prepared by www.aidsdatahub.org based on Global Fund Supported Project on AIDS and TB, Ministry of Health. (2012). Second Generation HIV and STI Surveillance Report 2012.

www.aidsdatahub.org
Vulnerability and HIV knowledge
HIV and AIDS Data Hub for Asia-Pacific
Latest!
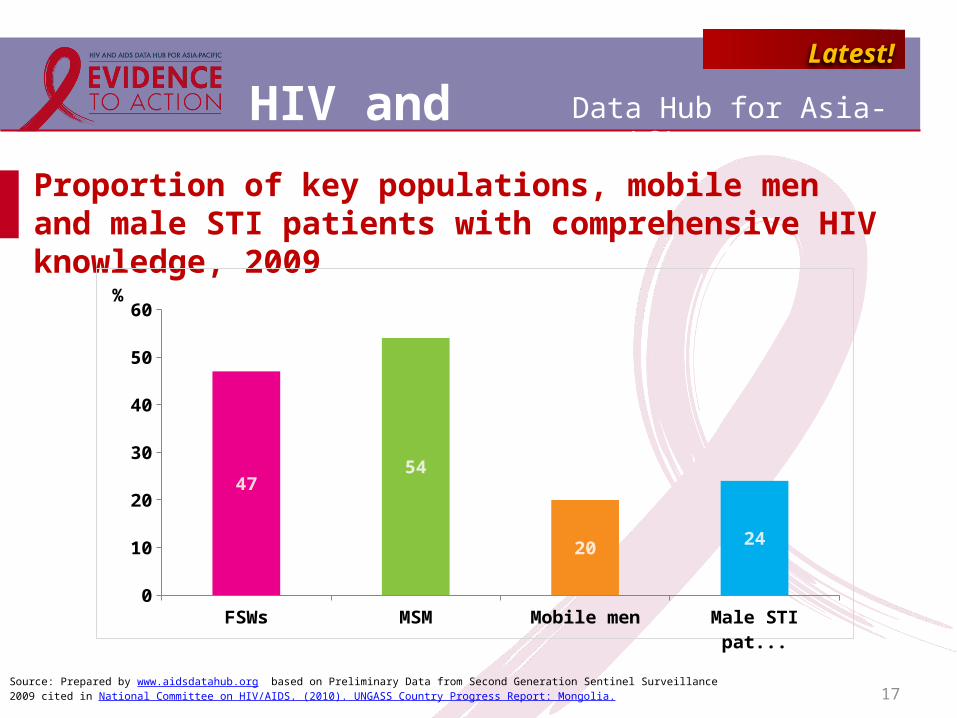
Proportion of key populations, mobile men and male STI patients with comprehensive HIV knowledge, 2009
17
FSWs MSM Mobile men Male STI patients0
10
20
30
40
50
60
4754
20 24
%
Source: Prepared by www.aidsdatahub.org based on Preliminary Data from Second Generation Sentinel Surveillance 2009 cited in National Committee on HIV/AIDS. (2010). UNGASS Country Progress Report: Mongolia.

HIV and AIDS Data Hub for Asia-Pacific
Latest!
Proportion of key populations, mobile men and male STI patients with comprehensive HIV knowledge, 2005 - 2009
18
2005
2007
2009
2005
2007
2009
2005
2007
2009
2005
2007
2009
MS
MM
ale
ST
I p
ati
en
ts
0 10 20 30 40 50 60
30
33
47
23
26
54
17
21
20
20
18
24
%
Source: Prepared by www.aidsdatahub.org based on 1. Ministry of Health Mongolia, WHO, et al. (2008). Second Generation HIV/STI Surveillance Report, 2007 Mongolia. and 2. Preliminary Data from Second Generation Sentinel Surveillance 2009 cited in National Committee on HIV/AIDS. (2010). UNGASS Country Progress Report: Mongolia.

HIV and AIDS Data Hub for Asia-Pacific
Latest!
Proportion of young men and women (15-24) with comprehensive HIV knowledge, 2005 - 2009
19
2005 2007 2009 2005 2007 2009Female Male
0
5
10
15
20
25
30
15
26
16 17
23
19
%
Source: Prepared by www.aidsdatahub.org based on 1. Ministry of Health Mongolia, WHO, et al. (2008). Second Generation HIV/STI Surveillance Report, 2007 Mongolia. and 2. Preliminary Data from Second Generation Sentinel Surveillance 2009 cited in National Committee on HIV/AIDS. (2010). UNGASS Country Progress Report: Mongolia.

www.aidsdatahub.org
HIV Expenditure

HIV and AIDS Data Hub for Asia-Pacific
Latest!
AIDS spending by financing source, 2007-2011
21Source: Prepared by www.aidsdatahub.org based on www.aidsinfoonline.org
2007 2008 2009 2010 20110
1,000,000
2,000,000
3,000,000
4,000,000
5,000,000
6,000,000
$3,731,466
$224,151
$2,680,359
$1,169,128
Total AIDS spending BilateralGlobal Funding Domestic Funding
US
D
HIV and AIDS Data Hub for Asia-Pacific
Latest!
22
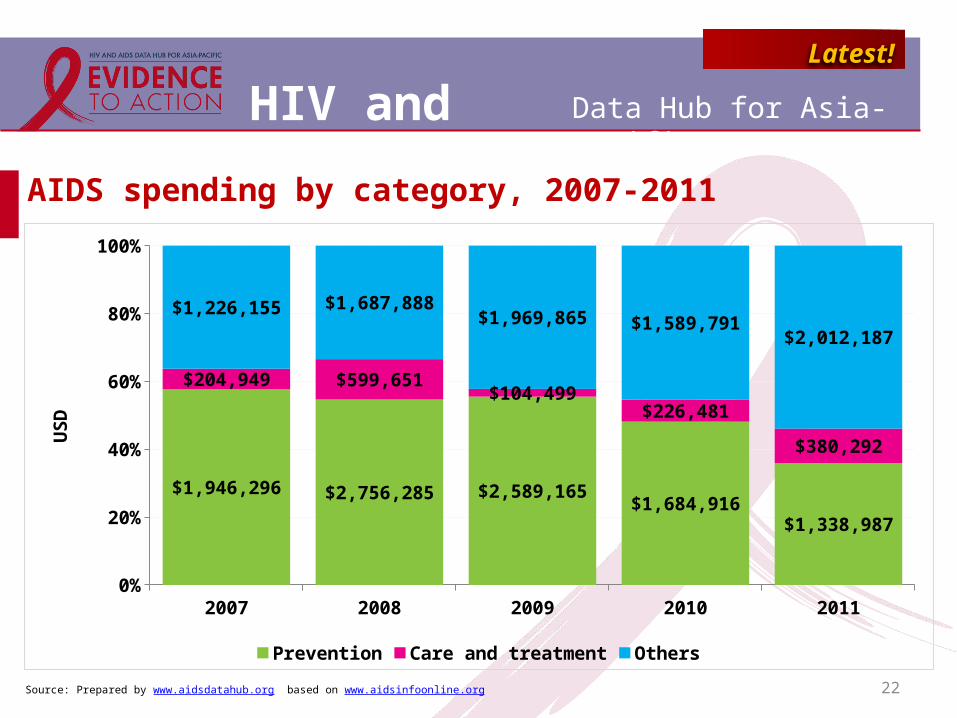
AIDS spending by category, 2007-2011
Source: Prepared by www.aidsdatahub.org based on www.aidsinfoonline.org
2007 2008 2009 2010 20110%
20%
40%
60%
80%
100%
$1,946,296 $2,756,285 $2,589,165$1,684,916
$1,338,987
$204,949 $599,651$104,499
$226,481
$380,292
$1,226,155 $1,687,888$1,969,865 $1,589,791
$2,012,187
Prevention Care and treatment Others
US
D

HIV and AIDS Data Hub for Asia-Pacific
Latest!
23
Proportion of total prevention programme spending on key populations at higher risk, 2007-2011
Source: Prepared by www.aidsdatahub.org based on www.aidsinfoonline.org
2007 2008 2009 2010 20110%
10%
20%
30%
40%
50%
60%
70%
80%
90%
100%
13
2
1
0
84
99 100 100 100
% Others% on people who inject drugs% on men who have sex with men% on sex workers and their clients

www.aidsdatahub.org
National response

HIV and AIDS Data Hub for Asia-Pacific
Latest!
Proportion of FSW and MSM reached with HIV prevention programmes, 2009 and 2012
25Source: Prepared by www.aidsdatahub.org based on 1. National Committee on HIV/AIDS. (2010). UNGASS Country Progress Report: Mongolia; 2. National Committee on HIV and AIDS. (2012). Mongolia Global AIDS Response Progress Report, 2012; and 3. Ministry of Health and NCCD. (2012). Second Generation HIV and STI surveillance Report, 2012. Mongolia.
2009 20120
20
40
60
80
100
74
64
77
64 FSW
MSM
%

HIV and AIDS Data Hub for Asia-Pacific
Latest!
Proportion of key populations who received an HIV test in the last 12 months and know their results, 2005-2012
26Source: Prepared by www.aidsdatahub.org based on 1. National Committee on HIV/AIDS. (2010). UNGASS Country Progress Report: Mongolia; 2. National Committee on HIV and AIDS. (2012). Mongolia Global AIDS Response Progress Report, 2012; 3. Ministry of Health and NCCD. (2012). Second Generation HIV and STI surveillance Report, 2012. Mongolia;. and 4. www.aidsinfoonline.org
2005 2007 2009 20120
20
40
60
80
100
60
8177
65
5255 MSM
FSW
%

HIV and AIDS Data Hub for Asia-Pacific
Latest!
Number of ART sites and number of people on ART, 2005-2012
27
Source: Prepared by www.aidsdatahub.org based on 1. WHO, UNAIDS, & UNICEF. (2010). Towards Universal Access: Scaling up Priority HIV/AIDS Interventions in the Health Sector - Progress Report 2006-2010; 2. UNAIDS. (2010). Global Report: UNAIDS Report on the Global AIDS Epidemic; 3. UNAIDS. (2012). Global Report: UNAIDS Report on the Global AIDS Epidemic; 4. UNAIDS. (2013). Global Report: UNAIDS Report on the Global AIDS Epidemic 2013; and 5. www.aidsinfoonline.org
2005 2006 2007 2008 2009 2010 2011 20120
10
20
30
40
50
60
0
2
4
6
8
10
2NA NA
5
53
Number of health facilities that offer ART Number of people on ART
Nu
mb
er
of
pe
op
le o
n A
RT
Nu
mb
er
of
AR
T S
ite
s

HIV and AIDS Data Hub for Asia-Pacific
Latest!
ART scale up, 2005-2012
28Source: Prepared by www.aidsdatahub.org based on 1. UNAIDS. (2013). Global Report: UNAIDS Report on the Global AIDS Epidemic 2013; and 2. www.aidsinfoonline.org
2005 2006 2007 2008 2009 2010 2011 20120
10
20
30
40
50
60
0
20
40
60
80
100
513 15
5
53
Estimated ART coverage Number of people on ART
Nu
mb
er
of
pe
op
le o
n A
RT
% A
RT
co
ve
rag
e

HIV and AIDS Data Hub for Asia-Pacific
Latest!
29
Estimated number of adults receiving and needing ART, and coverage, 2012
Source: Prepared by www.aidsdatahub.org based on UNAIDS. (2013). Global Report: UNAIDS Report on the Global AIDS Epidemic 2013.
In need of ART Receiving ART ART coverage0
100
200
300
400
500
600
0
2
4
6
8
10
12
<500
53
6
Nu
mb
er
% A
RT
co
ve
rag
e

HIV and AIDS Data Hub for Asia-Pacific
Latest!
Spectrum of engagement in prevention of mother-to-child transmission (PMTCT), 2011
30
• 72,619 pregnant women tested for HIV (including previously known positive)• 3 pregnant women tested positive for HIV (including previously known positive)
• 3 HIV-positive pregnant women received ARV for PMTCT
• 2 infants born to HIV-infected women received ARV prophylaxis to reduce early mother-to-child transmission
• 1 infant received an HIV test within 2 months of birth
Source: Prepared by www.aidsdatahub.org based on National Committee on HIV and AIDS. (2012). Mongolia Global AIDS Response Progress Report, 2012.
HIV and AIDS Data Hub for Asia-Pacific
Latest!
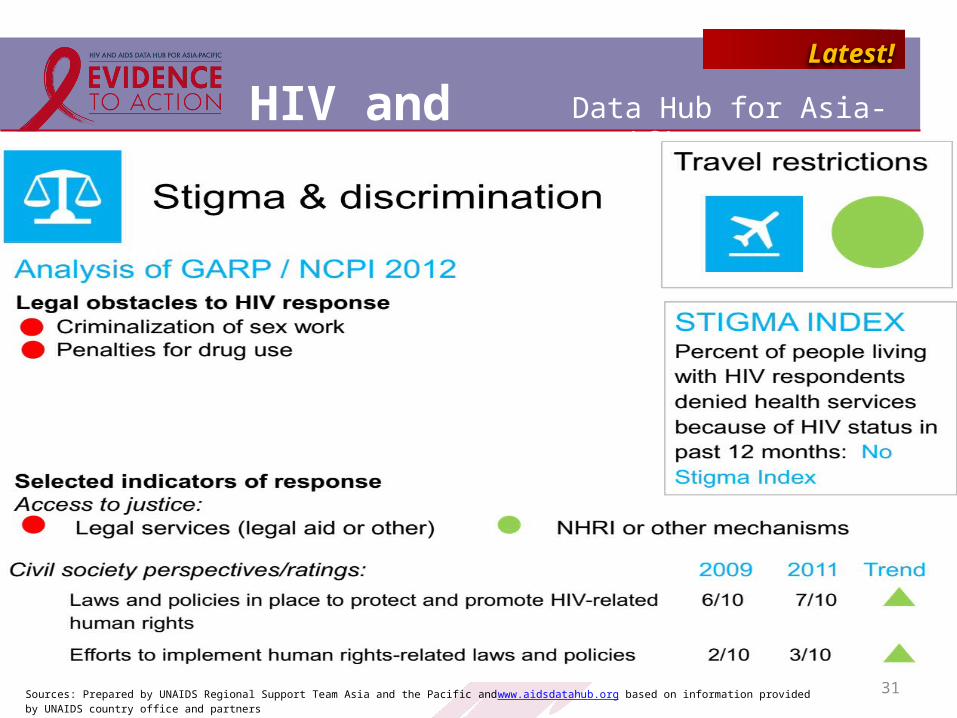
31Sources: Prepared by UNAIDS Regional Support Team Asia and the Pacific andwww.aidsdatahub.org based on information provided by UNAIDS country office and partners

HIV and AIDS Data Hub for Asia-Pacific
32
THANK YOU
slides compiled by www.aidsdatahub.org
Data shown in this slide set are comprehensive to the extent they are available from country reports. Please inform us if you know of sources where more recent data can be used.
Please acknowledge www.aidsdatahub.org if slides are lifted directly from this site