Embed Size (px)
Citation preview

Money Walks: A Human-Centric Study on theEconomics of Personal Mobile Data
Jacopo Staiano†, Nuria Oliver‡, Bruno Lepri§,Rodrigo de Oliveira‡, Michele Caraviello¬, Nicu Sebe†
†DISI, University of Trento (Italy)‡Telefonica Research, Barcellona (Spain)§Fondazione Bruno Kessler, Trento (Italy)
¬Telecom Italia, Trento (Italy)
The work of Jacopo Staiano has been supported by and performed at Telefonica Research.
Rodrigo de Oliveira is currently afliated with Google Inc., USA. All research conducted while he was at Telefonica Research, Barcelona.
Abstract
In the context of a myriad of mobile apps which collect personally identifiable information (PII) and a prospective marketplace of personal data, we investigate a user-centric monetary valuation of mobile PII. During a 6-week long user study in aliving lab deployment with 60 participants, we collected their daily valuations of 4 categories of mobile PII (communication,e.g. phonecalls made/received, applications, e.g. time spent on different apps, location and media, e.g. photos taken) at threelevels of complexity (individual data points, aggregated statistics and processed, i.e. meaningful interpretations of the data).In order to obtain honest valuations, we employ a reverse second price auction mechanism. Our findings show that the mostsensitive and valued category of personal information is location. We report statistically significant associations betweenactual mobile usage, personal dispositions, and bidding behavior. Finally, we outline key implications for the design of mobileservices and future markets of personal data.
I. INTRODUCTION
The number of mobile phones actively in use worldwide to-day is about 5 billion, with millions of new subscribers ev-ery day1. Mobile phones allow for unobtrusive and cost-effective access to previously inaccessible sources of behav-ioral data such as location, communications (calls and textmessages), photos, videos, apps and Internet access [30].Hence, a result of the ever-increasing adoption of these de-vices is the availability of large amounts of personal datarelated to habits, routines, social interactions and interests[30, 34].
However, the ubiquitous collection of personal dataraises unprecedented privacy challenges. Users typicallyhave to make decisions concerning the disclosure of theirpersonal information on the basis of a difficult tradeoff be-tween data protection and the advantages stemming fromdata sharing. Perhaps more importantly, people are typicallynot involved in the life-cycle of their own personal data –as it is collected by websites and mobile phone apps, whichresults in a lack of understanding of who uses their data andfor what.
Several researchers have proposed and investigated newuser-centric models for personal data management, whichenable individuals to have more control of their own data’s
life-cycle [39]. To this end, researchers and companies aredeveloping repositories which implement medium-grainedaccess control to different kinds of personally identifiableinformation (PII), such as e.g. passwords, social securitynumbers and health info [52], and more recently location[16, 21, 38] and personal data collected online by means ofsmartphones or wearable devices [16, 50].
Previous work has introduced the concept of personaldata markets in which individuals sell their own personaldata to entities interested in buying it [3]. Buyers are likelyto be companies and researchers, while sellers are individ-uals who receive compensation for sharing their own data.Riederer et al. [42] have recently proposed a mechanismcalled transactional privacy, devised to maximize both theuser’s control of their own PII and the utility of a data-drivenmarket.
In the context of prospective personal data markets thatoffer increased transparency and control, it is of great impor-tance to understand the value that users put to their own PII.Recently, Carrascal et al. [8] used a refined Experience Sam-pling Method (rESM) [9] and a reverse second price auctionto assess the monetary value that people assign to their PIIshared online via websites – e.g. keywords used in a searchengine, photos shared in a social network, etc. However, theauthors focus only on web-browsing behaviors without tak-
1http://www.ericsson.com/ericsson-mobility-report
1
arX
iv:1
407.
0566
v2 [
cs.H
C]
10
Jul 2
014

ing into account behaviors and personal information that canbe captured by mobile phones.
Taking Carrascal et al. [8] as an inspiration, in this pa-per we investigate the monetary value that people assign todifferent kinds of PII as collected by their mobile phone, in-cluding location and communication information. We car-ried out a comprehensive 6-week long study in a living labenvironment with 60 participants and adopted a Day Recon-struction Method [27] along with a reverse second price auc-tion mechanism in order to poll and collect honest monetaryvaluations.
The main contributions of this paper are:
1. Quantitative valuations of mobile PII as collected by a6-week long study conducted in the wild;
2. Qualitative feedback on the valuations provided byeach participant as gathered by an End of Study (EoS)survey;
3. A segmentation of PII valuations and findings basedon 4 categories of mobile PII (communications, loca-tion, media and apps), 3 levels of complexity (individ-ual, processed, aggregated), and one level of temporalgranularity (daily);
4. A set of key insights about people’s sensitivities andvaluations of mobile PII and implications for the de-sign of mobile services that leverage mobile PII.
II. RELATED WORK
In recent years, researchers have analyzed the factors thatcan influence a person’s disclosure behavior and economicvaluation of personal information. Demographic character-istics, such as gender and age, have been found to affect dis-closure attitudes and behavior. Several studies have iden-tified gender differences concerning privacy concerns andconsequent information disclosure behaviors: for example,women are generally more protective of their online privacy[18, 22]. Age also plays a role in information disclosure be-haviors: in a study on Facebook usage, Christofides et al.[10] found that adolescents disclose more information.
Prior work has also emphasized the role of an individ-ual’s stable psychological attributes - e.g. personality traits- to explain information disclosure behavior. Korzaan et al.[29] explored the role of the Big5 personality traits [12] andfound that Agreeableness – defined as being sympathetic,straightforward and selfless, has a significant influence onindividual concerns for information privacy. Junglas et al.[26] and Amichai-Hamburger and Vinitzky [5] also used theBig5 personality traits and found that Agreeableness, Con-scientiousness, and Openness affect a person’s concerns forprivacy. However, other studies targeting the influence ofpersonality traits did not find significant correlations [45].
More recently, Quercia et al. [41] found weak correlationsamong Openness to Experience and, to a lesser extent, Ex-traversion and the disclosure attitudes on Facebook. In 2010,Lo [33] suggested that Locus of Control [44] could affect anindividual’s perception of risk when disclosing personal in-formation: internals are more likely than externals to feelthat they can control the risk of becoming privacy victims,hence they are more willing to disclose their personal infor-mation [55].
Individual differences are also found when providingeconomic valuations of personal data [2, 8]. For instance,some individuals may not be concerned about privacy andwould allow access to their data in exchange for a few cents,whereas others may only consent if well paid. Recently,Aperjis and Huberman [6] proposed to introduce a realis-tic market for personal data that pays individuals for theirdata while taking into account their own privacy and risk at-titudes.
Previous research has shown that disclosure [28] and val-uation [15, 23] depend on the kind of information to be re-leased. Huberman et al. [23] reported that the valuationof some types of personal information, such as the subject’sweight and the subject’s age depends on the desirability ofthese types of information in a social context. Some empiri-cal studies have attempted to quantify subjective privacy val-uations of personal information in different contexts, such aspersonal information revealed online [20], access to locationdata [14], or removal from marketers’ call lists [51]. Thesestudies can be classified into two groups. The first and largergroup includes studies that explicitly or implicitly measurethe amount of money or benefit that a person considers to beenough to share her/his personal data, namely their willing-ness to accept (WTA) giving away his/her own data (see forexample [14, 24]). The second and smaller group includesstudies about tangible prices or intangible costs consumersare willing to pay (WTP) to protect their privacy (see forexample, [1, 49]). In our paper, we do not deal with WTAvs WTP, but we focus on WTA for PII captured by mobilephones (communications, apps and media usage, locations).
A growing body of studies in the fields of ubiquitousand pervasive computing and human-computer interactionfocuses on location sharing behavior and has highlighted therole played by the recipient of sharing (who can access theinformation), the purpose, the context, how the informationis going to be used [7, 11, 32, 47, 54] and the level of gran-ularity of the information shared [31]. Finally, studies havesuggested the importance of analyzing people’s actual be-havior rather than attitudes expressed through questionnairesbecause often the actual behavior of people deviates fromwhat they state [25].
Building upon previous work, in this paper we investi-gate the monetary value that people assign to different kindsof PII as collected by their mobile phone, including location
2

and communication patterns. In particular, we carry out acomprehensive 6-week long study in a living lab environ-ment with 60 participants and adopt a Day ReconstructionMethod [27] and a reverse second price auction mechanismin order to poll and collect honest monetary valuations fromour sample.
III. METHODOLOGY
Next, we describe the methodology followed during our 6-week study.
A. The Living Laboratory
The Living Laboratory where we carried out our study waslaunched in November of 2012 and it is a joint effort betweenindustrial and academic research institutions. It consists ofa group of more than 100 volunteers who carry an instru-mented smartphone in exchange for a monthly credit bonusof voice, SMS and data access. The sensing system installedon the smartphones is based on the FunF2 framework [4] andlogs communication events, location, apps usage and photosshot. In addition, the members of the living lab participatein user-studies carried out by researchers. The goals of thisliving lab are to foster research on real-life behavioral analy-sis obtained by means of mobile devices, and to deploy andtest prototype applications in a real-life scenario. One of themost important features of such a lab is its ecological valid-ity, given that the participants’ behaviors and attitudes aresensed in the real world, as people live their everyday life,and not under artificial laboratory conditions.
All volunteers were recruited within the target group ofyoung families with children, using a snowball sampling ap-proach where existing study subjects recruit future subjectsfrom among their acquaintances [19]. Upon agreeing to theterms of participation, the volunteers granted researchers le-gal access to their behavioral data as it is collected by theirsmartphones. Volunteers retain full rights over their personaldata such that they can order deletion of personal informa-tion from the secure storage servers. Moreover, participantshave the choice to participate or not in a given study. Uponjoining the living lab, each participant fills out an initialquestionnaire which collects their demographics, individualtraits and dispositions (e.g. Big Five personality traits, trustdisposition, Locus of Control, etc.) information.
B. Participants
A total of 60 volunteers from the living lab chose to partic-ipate in our mobile personal data monetization study. Par-ticipants’ age ranged from 28 to 44 years old (µ = 38,σ = 3.4). They held a variety of occupations and educationlevels, ranging from high school diplomas to PhD degrees.
All were savvy Android users who had used the smartphonesprovided by the living lab since November 2012. Regard-ing their socio-economic status, the average personal net in-come amounted to e21169 per year (σ = 5955); while theaverage family net income amounted to e 36915 per year(σ = 10961). All participants lived in Italy and the vastmajority were of Italian nationality.
C. Procedure
Our study ran for six weeks from October 28th, 2013 to De-cember 11th, 2013. At the beginning of the study, partici-pants were explained that the study consisted of three phases:
1. An initial questionnaire, which focused on their gen-eral perception of privacy and personal data;
2. A daily data collection phase that lasted 6 weekswhere participants answered daily surveys to valuatetheir mobile personal data;
3. A final survey that aimed to clarify the results obtainedand to collect qualitative feedback from participants.
Daily Surveys Ad-hoc java code was developed andscheduled to run on a secure server each night in order toautomatically generate personalized daily surveys for eachparticipant. The survey questions were generated based onthe mobile data collected during the previous day. Every-day, at 12PM, participants received an SMS reminding themto fill out their survey via a personalized URL (through aunique hash).
In order to test the live system and identify bugs, we ran apilot for 10 days with a small set of volunteers who were notparticipants in the study. In addition, we allocated a trainingweek prior to starting the actual study so participants wouldget accustomed to the survey/auction scheme.
IV. COLLECTED DATA
Next we describe the data that we collected during the study.
A. Mobile Personal Data
We collected 4 categories of mobile personal data: (1) com-munications, in the form of calls made/received; (2) loca-tions, collected by the device GPS sensor every ∼ 5 min-utes; (3) running applications, sampled every 25 minutes;and (4) media, i.e. number and timestamp of pictures takenand obtained by monitoring the device file system. The sam-pling rates for the different categories of data were empir-ically determined in order to have good resolution withoutsignificantly impacting the device’s battery life.
2http://funf.org
3

Moving from finer to coarser granularity, we probed par-ticipants about the following three levels of complexity foreach category of data: (1) individual, encompassing individ-ual data points (e.g. a call made/received, a picture taken, aspecific GPS location); (2) processed, depicting higher levelinformation derived from the sensed events (e.g. a givenapplication has been running for N minutes, total distancetraveled); and (3) aggregated, portraying cumulative eventinformation (e.g. number of places visited, number of callsmade/received).
For each data category and level of complexity, partic-ipants were asked to fill out daily surveys that asked themabout data from the previous day for each category and fora specific level of complexity (up to 4 questions per day).For each question in the surveys, participants always had theoption to opt-out and not sell that particular piece of infor-mation.
Next, we describe in detail the 4 categories and the 3 lev-els of complexity of mobile personal data that we collectedin this study, which are summarized in Table 1.
A.1. Communications
Individual communication data was restricted to voice callsmade/received; missed calls were discarded. The pro-cessed communication variable referred to the total dura-tion of calls in the previous day, resulting in questions suchas "Yesterday, you spoke on the phone fora total of 52 minutes".
With respect to aggregated communications data, wealternated between two different aggregated variables ona weekly basis: on even weeks subjects were askedto monetize information about the total number of callsmade/received during the previous day, while on odd weeksthey were asked about call diversity, i.e. the number of dif-ferent people that they talked to on the phone during the pre-vious day. Examples of questions related to aggregate com-munications are "Yesterday, you made/received8 phone calls", or "Yesterday, you spokeon the phone with 3 different persons".
A.2. Location
Individual location referred to a specific place vis-ited by the participant in the previous day. Seman-tic information associated to GPS locations was derivedvia reverse geo-coding using Yahoo Query Language.For individual locations, details on street, neighborhoodand town were included in the question. For exam-ple, "Yesterday, at 23:56 you were in ViaDegli Orbi 4, Trento". The processed locationvariable referred to the total distance traveled in the previ-ous day, resulting in questions such as "Yesterday youcovered a total distance of 13km".
Finally, location data was spatially clustered over the ref-erence time-range using a threshold of 100 meters to gen-erate the aggregated location question (e.g. "Yesterdayyou have been in 23 different places").
A.3. Running Applications
With respect to running apps, the individual variable in-cluded the timestamp and the name of the app running inthe foreground. Processed app information referred to thetotal number of minutes that a particular app was runningover a specific time in the previous day, whereas aggregatedapp variables referred to the total number of different appsthat the participant ran the previous day.
Examples of questions on app-related information foreach level of complexity are "Yesterday, at 10:23you were using the Firefox Browser appli-cation", "Yesterday night, the Google Talkapplication run on your device for 82 min-utes", and "Yesterday 9 applications wererunning on your device", respectively.
A.4. Media
Individual media asked participants about the fact thatthey shot a photo at a specific time ("Yesterday, at14:23, you shot one picture"). For legal privacyreasons, the questions referring to individual media datacould not include the actual picture they referred to. Pro-cessed media probed participants about their photo-takingactivity during specific times of the day (e.g. "Yester-day morning you took 4 pictures"). Finally, theaggregated media variable referred the total number of pic-tures shot the previous day (e.g. "Yesterday you took9 pictures").
B. Individual Traits Data
As previously mentioned, upon joining the lab each partici-pant filled out 4 questionnaires to collect information abouttheir personality, locus of control, dispositional trust andself-disclosure behaviors.
The Big Five personality traits were measured by meansof the BFMS [40] questionnaire, which is validated for theItalian language and covers the traditional dimensions of Ex-traversion, Neuroticism, Agreeableness, Conscientiousness,and Openness [12]. Participants also provided informationabout their Locus of Control (LoC) [43], a psychologicalconstruct measuring whether causal attribution for subjectbehavior or beliefs is made to oneself or to external eventsand circumstances. The LoC measures whether the out-comes of a set of beliefs are dependent upon what the subjectdoes (internal orientation) or upon events outside of her/his
4
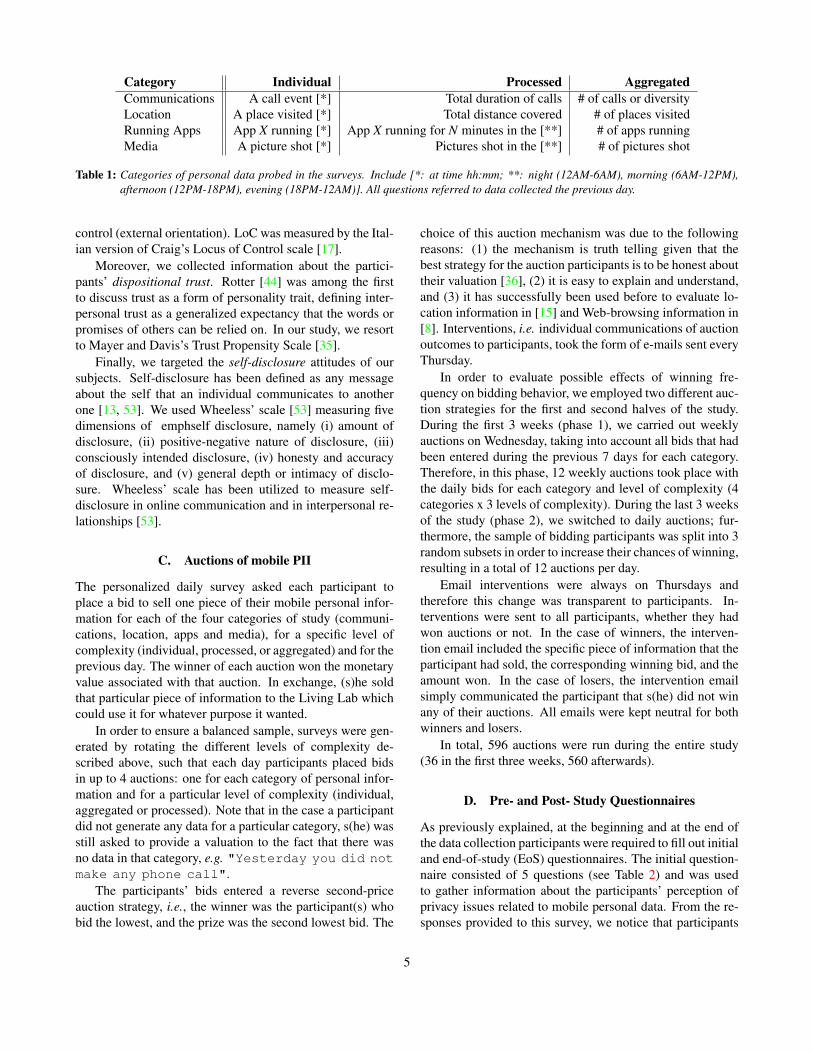
Category Individual Processed AggregatedCommunications A call event [*] Total duration of calls # of calls or diversityLocation A place visited [*] Total distance covered # of places visitedRunning Apps App X running [*] App X running for N minutes in the [**] # of apps runningMedia A picture shot [*] Pictures shot in the [**] # of pictures shot
Table 1: Categories of personal data probed in the surveys. Include [*: at time hh:mm; **: night (12AM-6AM), morning (6AM-12PM),afternoon (12PM-18PM), evening (18PM-12AM)]. All questions referred to data collected the previous day.
control (external orientation). LoC was measured by the Ital-ian version of Craig’s Locus of Control scale [17].
Moreover, we collected information about the partici-pants’ dispositional trust. Rotter [44] was among the firstto discuss trust as a form of personality trait, defining inter-personal trust as a generalized expectancy that the words orpromises of others can be relied on. In our study, we resortto Mayer and Davis’s Trust Propensity Scale [35].
Finally, we targeted the self-disclosure attitudes of oursubjects. Self-disclosure has been defined as any messageabout the self that an individual communicates to anotherone [13, 53]. We used Wheeless’ scale [53] measuring fivedimensions of emphself disclosure, namely (i) amount ofdisclosure, (ii) positive-negative nature of disclosure, (iii)consciously intended disclosure, (iv) honesty and accuracyof disclosure, and (v) general depth or intimacy of disclo-sure. Wheeless’ scale has been utilized to measure self-disclosure in online communication and in interpersonal re-lationships [53].
C. Auctions of mobile PII
The personalized daily survey asked each participant toplace a bid to sell one piece of their mobile personal infor-mation for each of the four categories of study (communi-cations, location, apps and media), for a specific level ofcomplexity (individual, processed, or aggregated) and for theprevious day. The winner of each auction won the monetaryvalue associated with that auction. In exchange, (s)he soldthat particular piece of information to the Living Lab whichcould use it for whatever purpose it wanted.
In order to ensure a balanced sample, surveys were gen-erated by rotating the different levels of complexity de-scribed above, such that each day participants placed bidsin up to 4 auctions: one for each category of personal infor-mation and for a particular level of complexity (individual,aggregated or processed). Note that in the case a participantdid not generate any data for a particular category, s(he) wasstill asked to provide a valuation to the fact that there wasno data in that category, e.g. "Yesterday you did notmake any phone call".
The participants’ bids entered a reverse second-priceauction strategy, i.e., the winner was the participant(s) whobid the lowest, and the prize was the second lowest bid. The
choice of this auction mechanism was due to the followingreasons: (1) the mechanism is truth telling given that thebest strategy for the auction participants is to be honest abouttheir valuation [36], (2) it is easy to explain and understand,and (3) it has successfully been used before to evaluate lo-cation information in [15] and Web-browsing information in[8]. Interventions, i.e. individual communications of auctionoutcomes to participants, took the form of e-mails sent everyThursday.
In order to evaluate possible effects of winning fre-quency on bidding behavior, we employed two different auc-tion strategies for the first and second halves of the study.During the first 3 weeks (phase 1), we carried out weeklyauctions on Wednesday, taking into account all bids that hadbeen entered during the previous 7 days for each category.Therefore, in this phase, 12 weekly auctions took place withthe daily bids for each category and level of complexity (4categories x 3 levels of complexity). During the last 3 weeksof the study (phase 2), we switched to daily auctions; fur-thermore, the sample of bidding participants was split into 3random subsets in order to increase their chances of winning,resulting in a total of 12 auctions per day.
Email interventions were always on Thursdays andtherefore this change was transparent to participants. In-terventions were sent to all participants, whether they hadwon auctions or not. In the case of winners, the interven-tion email included the specific piece of information that theparticipant had sold, the corresponding winning bid, and theamount won. In the case of losers, the intervention emailsimply communicated the participant that s(he) did not winany of their auctions. All emails were kept neutral for bothwinners and losers.
In total, 596 auctions were run during the entire study(36 in the first three weeks, 560 afterwards).
D. Pre- and Post- Study Questionnaires
As previously explained, at the beginning and at the end ofthe data collection participants were required to fill out initialand end-of-study (EoS) questionnaires. The initial question-naire consisted of 5 questions (see Table 2) and was usedto gather information about the participants’ perception ofprivacy issues related to mobile personal data. From the re-sponses provided to this survey, we notice that participants
5

Question mean st devQ1. I am concerned about the protection of the data collected by my smartphone 4.7 1.6Q2. I trust the applications I install and run on my smartphone wrt how they use my data 3.7 1.5Q3. I trust telco providers with respect to how they use my data 3.4 1.4Q4. I always read the privacy terms and conditions for the applications I use 2.7 1.6Q5. I know the legislation on mobile communication data protection 2.5 1.5
Table 2: Questions asked in the Initial questionnaire, and responses statistics. The 7-point likert scale used goes from 1-Totally Disagree to7-Totally Agree.
Question TypeQ1. This {map‖chart} shows the information about {locations‖communications‖apps‖media} we col-lected during this study. What is the minimum amount of money you would accept to sell it inanonymized/aggregated form?
numeric
Q2. On day {dd/MM} you assigned a value of {min-bid per category} to the information [{least valuedinfo per category}]. This was your minimum bid. Why?
multi-choice*
Q3. On day {dd/MM} you assigned a value of {max-bid per category} to the information [{most valuedinfo per category}]. This was your maximum bid. Why?
multi-choice*
Q4. Imagine there was a market in which you could sell your personal information (e.g. information aboutpeople you called, places you’ve been, applications you’ve used, songs you’ve listened to, etc.). Who wouldyou trust to handle your information? Please, order the following entities from most to least trusted.
rank**
Q5. The category {locations‖communications‖apps‖media} is the one that you refused to sell the most({percentage of opt-outs}). Why?
free-text
Table 3: Questions asked in the EoS questionnaire. *included: Fair value, Test/Mistake, Other (free text). For minimum-bid related ques-tions additional options were To win the auction, Info not important; conversely, for maximum-bid related questions, the additionaloption was To prevent selling. **entities to be ranked included: banks, government, insurance companies, telcos, yourself.
are concerned about mobile PII protection (Q1) but do nottend to read the Terms of Service (Q4) nor are aware of cur-rent legislation on data protection (Q5). Moreover, they donot seem to trust how neither application providers (Q2) nortelecom operators (Q3) use their data.
The EoS survey was designed to gather additional quan-titative and qualitative information from our participants af-ter the data collection was complete. In particular, we askedparticipants to put a value (under the same auction game con-straints) on category-specific bulk information – i.e. all thedata gathered in the study for each category. For instance, inthe case of location information, a visualization of a partic-ipant’s mobility data collected over the 6-weeks period wasshown in the Web questionnaire (as depicted in Figure 1)and the participant was asked to assign it a monetary value.Furthermore, for each category, we asked participants aboutthe minimum/maximum valuations given during the study,in order to understand the reasons why they gave these valu-ations. Table 3 contains all the questions of the EoS survey.
The EoS questionnaire was administered through aslightly modified version of the same Web application usedfor the daily surveys. The main difference are the visualiza-tions of the collected data.
Figure 1: Location-specific bulk information question in the EoSsurvey.
6

Figure 2: Daily median bid values (e) per category. Vertical lines indicate interventions. Shaded area indicates phase 1.
V. DATA STATISTICS
The data used throughout this paper was collected from Oc-tober 28th and December 11th 2013, inclusive. Data wasnot collected for the first 3 days of November, due to the AllSaints festivities in Italy; hence, our data-set encompasses43 days.
A total of 2838 daily surveys were administered duringthis period. Statistics on bidding data and participation fol-low.
A. Bids
Table 4 summarizes the bidding values for each personaldata category and level of complexity. Figure 2 depicts me-dian bid values each day for each category and level of com-plexity3.
Individual Processed Aggregated GlobalLocation [1, 3, 9] [1, 2, 7] [1, 3, 10] [1, 3, 8]Communications [.95, 2, 5.96] [.9, 2, 8] [1, 2, 8] [1, 2, 7]Apps [1, 2, 6] [1, 2, 5] [1, 1, 5] [1, 2, 5]Media [.5, 1, 5] [.5, 1, 3] [.5, 1, 5] [.5, 1, 4]
Table 4: [Q1,median,Q3] triplets for bid values (e) per categoryand level of complexity.
B. Awards
The total amount won by participants in the form of auctionawards was e262 which was paid in Amazon vouchers.
Additionally, we selected the ten subjects with the high-est response rate and ran a raffle to select the winner of a
final prize of e100.A total of 29 subjects won at least one auction during the
study; the cardinality of the winning set ramped from 5 to29 as an effect of the increased number of auctions run inthe second phase of the study.
C. Participation
The participation rates for daily surveys is 79%.As mentioned earlier, users were granted opt-out options
for each survey question by ticking a check-box which por-trayed "I do not want to sell this informa-tion".
Table 5 reports statistics of opt-out and distributions ofvalid responses (i.e. survey items for which participants didnot opt-out and entered their bid) for each category.
VI. DATA ANALYSIS
The bidding data that was collected in the study is not nor-mally distributed. Hence, we applied non-parametric anal-ysis to test whether significant differences exist in the valuedistributions of different types of personal data. Thus, wereport results using the Kruskal-Wallis test with a level ofsignificance of p < .05.
Furthermore, we carried out correlation analyses to in-vestigate whether associations between mobile phone usagepatterns, demographics, subjects’ predispositions, traits andauction behavior exist. For these analyses we employed thenon-parametric Spearman’s Rho method with a level of sig-nificance of p < .05.
3Note how the spatial gap between the first two interventions is smaller than between the rest of interventions because of the lack of data during 3 days inNovember.
7
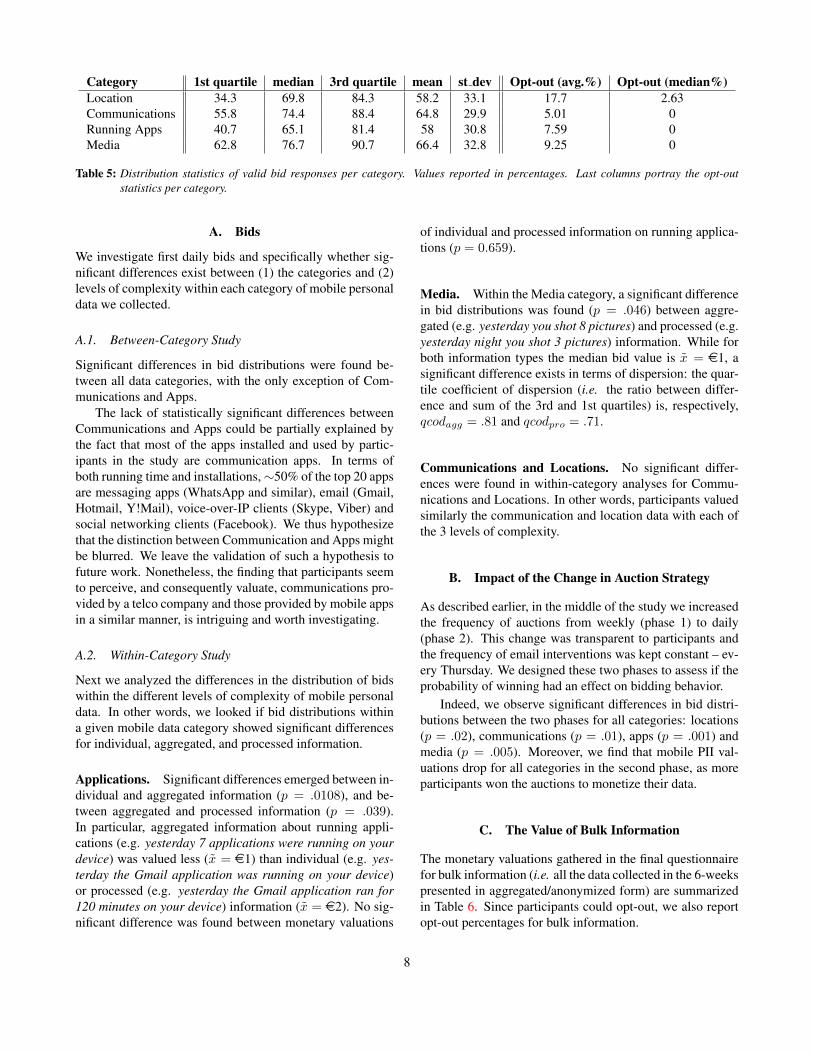
Category 1st quartile median 3rd quartile mean st dev Opt-out (avg.%) Opt-out (median%)Location 34.3 69.8 84.3 58.2 33.1 17.7 2.63Communications 55.8 74.4 88.4 64.8 29.9 5.01 0Running Apps 40.7 65.1 81.4 58 30.8 7.59 0Media 62.8 76.7 90.7 66.4 32.8 9.25 0
Table 5: Distribution statistics of valid bid responses per category. Values reported in percentages. Last columns portray the opt-outstatistics per category.
A. Bids
We investigate first daily bids and specifically whether sig-nificant differences exist between (1) the categories and (2)levels of complexity within each category of mobile personaldata we collected.
A.1. Between-Category Study
Significant differences in bid distributions were found be-tween all data categories, with the only exception of Com-munications and Apps.
The lack of statistically significant differences betweenCommunications and Apps could be partially explained bythe fact that most of the apps installed and used by partic-ipants in the study are communication apps. In terms ofboth running time and installations,∼50% of the top 20 appsare messaging apps (WhatsApp and similar), email (Gmail,Hotmail, Y!Mail), voice-over-IP clients (Skype, Viber) andsocial networking clients (Facebook). We thus hypothesizethat the distinction between Communication and Apps mightbe blurred. We leave the validation of such a hypothesis tofuture work. Nonetheless, the finding that participants seemto perceive, and consequently valuate, communications pro-vided by a telco company and those provided by mobile appsin a similar manner, is intriguing and worth investigating.
A.2. Within-Category Study
Next we analyzed the differences in the distribution of bidswithin the different levels of complexity of mobile personaldata. In other words, we looked if bid distributions withina given mobile data category showed significant differencesfor individual, aggregated, and processed information.
Applications. Significant differences emerged between in-dividual and aggregated information (p = .0108), and be-tween aggregated and processed information (p = .039).In particular, aggregated information about running appli-cations (e.g. yesterday 7 applications were running on yourdevice) was valued less (x = e1) than individual (e.g. yes-terday the Gmail application was running on your device)or processed (e.g. yesterday the Gmail application ran for120 minutes on your device) information (x = e2). No sig-nificant difference was found between monetary valuations
of individual and processed information on running applica-tions (p = 0.659).
Media. Within the Media category, a significant differencein bid distributions was found (p = .046) between aggre-gated (e.g. yesterday you shot 8 pictures) and processed (e.g.yesterday night you shot 3 pictures) information. While forboth information types the median bid value is x = e1, asignificant difference exists in terms of dispersion: the quar-tile coefficient of dispersion (i.e. the ratio between differ-ence and sum of the 3rd and 1st quartiles) is, respectively,qcodagg = .81 and qcodpro = .71.
Communications and Locations. No significant differ-ences were found in within-category analyses for Commu-nications and Locations. In other words, participants valuedsimilarly the communication and location data with each ofthe 3 levels of complexity.
B. Impact of the Change in Auction Strategy
As described earlier, in the middle of the study we increasedthe frequency of auctions from weekly (phase 1) to daily(phase 2). This change was transparent to participants andthe frequency of email interventions was kept constant – ev-ery Thursday. We designed these two phases to assess if theprobability of winning had an effect on bidding behavior.
Indeed, we observe significant differences in bid distri-butions between the two phases for all categories: locations(p = .02), communications (p = .01), apps (p = .001) andmedia (p = .005). Moreover, we find that mobile PII val-uations drop for all categories in the second phase, as moreparticipants won the auctions to monetize their data.
C. The Value of Bulk Information
The monetary valuations gathered in the final questionnairefor bulk information (i.e. all the data collected in the 6-weekspresented in aggregated/anonymized form) are summarizedin Table 6. Since participants could opt-out, we also reportopt-out percentages for bulk information.
8

Location Communications Apps Mediamean 588.1 51.1 170.4 25.1
median 22.5 15 20 5opt-out (%) 16.67 3.34 0 8.34
Table 6: Median/mean values (e) for bulk bids, and correspondingopt-out percentages.
Comparing with daily bids (see Table 4), the median bidsfor bulk information are one order of magnitude larger thanthe median individual bids, except for the media category.Mean opt-out percentages are similar except for the apps cat-egory. The value ranking obtained from daily bids (Location> Communications > Apps > Media) is different from thatobtained in bulk bids (Location > Apps > Communications> Media). In particular, application-related bulk data is val-ued significantly higher than communications-related bulkinformation.
D. Relationship between Bids and Daily Behaviors
In order to assess whether significant effects exist betweenmobile phone usage patterns and bidding behavior, we firstcomputed daily behavioral variables from the sensed data.Table 7 depicts the variables that we extracted with a dailygranularity and for each participant.
Category Daily Behavioral Variables
Location
Distance total/mean/median/stdSpeed mean/median/std
Radius of GyrationNumber of Places Visited
CommunicationsCalls Duration total/mean/median/std
Calls DiversityCalls Total
Applications Total Apps RunningTotal Apps Running Time
Media Total Pics shot
Table 7: Daily behavioral variables computed from mobile phoneusage data.
With respect to location data, information about thenumber of places visited was derived under the assumptionthat two locations would correspond to different places if thedistance between them was larger than a threshold set to 100meters. The radius of gyration corresponds to the radius ofthe smallest circle encompassing all location points regis-tered each day.
For all these behavioral variables, we computed higher-order features corresponding to their statistical behavior overthe 6-weeks period: mean, median, standard deviation, co-efficient of variation (ratio of the standard deviation to themean) and the quartile coefficient of dispersion. The lasttwo features capture dispersion effects.
Furthermore, for each participant and data category, wecomputed mean, median, and standard deviation of theirbids.
D.1. Daily Bids
We studied all correlations found between daily behavioralvariables and bids in each category.
We found a positive correlation between the mean lo-cation bid value and the median of daily distance traveled(R = .294, p = .024). That is, the larger the daily distancetraveled, the higher the valuations of location information.With respect to applications, there are several statisticallysignificant correlations. In particular, the total app runningtime is negatively correlated with the median app bid value(R = −.26, p = .048), meaning that the more time a par-ticipant spent using mobile apps, the lower the median val-uations of app information. No significant correlation wasfound between communication and photo-taking behavioralfeatures and bids on the communications and media cate-gories.
D.2. Bulk Bids
There were a number of significant correlations between bidson bulk information and daily behaviors. Below we summa-rize the most notable correlations that we found.
Mobility information was positively correlated with bidson bulk location, communication and application informa-tion. In particular, with the median of the i) radius of gyra-tion (R = .46, p = .0008 for loc.; R = .37, p = .005 forcomm.; R = .34, p = .009 for apps); and ii) daily meanspeed (R = .29, p = .04 for loc.; R = .39, p = .002 forcomm.; R = .29, p = .029 for apps). Location and appli-cation data was also positively correlated with the medianof the daily mean distance traveled (R = .39, p = .005 forloc.; R = .28, p = .031 for apps) whereas communicationbids were also positively correlated with the median of the i)total distance traveled (R = .314, p = .018) and ii) numberof places visited (R = .336, p = .011).
We also found statistically significant negative correla-tions of bulk location, communication and application bidswith the coefficients of variation of mobility variables.
These correlations imply that the larger the daily distancetraveled, the higher the valuation of location, communicationand application bulk bids. Conversely, the higher the varia-tion in the patterns of mobility of a person, the lower his/hervaluation of location, communication and app bulk informa-tion. Note that bulk communication bids were not correlatedwith communication variables.
In addition, bulk application bids are negatively corre-lated with the cumulative sum of daily unique total apps(R = −.37, p = .003) and with the median (R = −.28, p =
9
.029) and mean (R = −.26, p = .04) of total apps runningdaily.
Finally, bulk media bids are correlated with the cumula-tive sum of daily unique total apps (R = −.29, p = .03).
E. Relationship between Bids, Demographics, Traitsand Dispositions
E.1. Daily Bids
In the case of daily bids, we did not find any meaningfulstatistically significant correlation between bids and our par-ticipants’ demographics or personality.
There were statistically significant correlations with self-disclosure variables that could be explained by the relevanceof privacy aspects for all types of self-disclosure [37]. In par-ticular, the Intentional/Unintentional factor in self-disclosureis positively correlated with bids in three categories (commu-nication, applications and media): (1) mean (R = .258, p =.048), median (R = .291, p = .02) and standard deviation(R = .323, p = .012) in communication bids, (2) medianapplication bid value (R = .26, p = .04), and (3) median(R = .30, p = .02), mean (R = .27, p = .041), and stan-dard deviation (R = .305, p = .019) of media bids.
E.2. Bulk Bids
Bulk location bids are found to be negatively correlatedwith Creativity (R = −.375, p = .007), while having pos-itive correlations with the Intentional/Unintentional factorin self-disclosure (R = .295, p = .039) and Agreeable-ness (R = .31, p = .027). Interestingly, a positive cor-relation exists between bulk location bids and personal in-come (R = .32, p = .02). Furthermore, bulk communi-cation information positively correlates with Agreeableness(R = .31, p = .018), and with the Intentional/Unintentionalfactor in self-disclosure (R = .34, p = .009).
VII. INSIGHTS FROM THE EOS SURVEY
In the final survey, we asked our participants about particu-lar bids they made during the 6-week data collection phase,and gave them the opportunity to express their views andconcerns in free-form text (see Table 3 for details).
A. Trust
As seen in Table 3, Q4 asked our participants about theirtrust preferences with respect to 5 different entities whocould be the safekeepers of their personal data: themselves,banks, telcos, governments and insurance companies. Fromthe trust rankings provided by our participants, we computeda trust score for each entity by assigning a 1 to 5 valueaccording to its rank and subsequently normalizing by thenumber of respondents. The final ranking that we obtained
was: yourself (.997), banks (.537), telcos (.513), government(.49), and insurance companies (.46).
This result is aligned with the initial survey answers (Q2and Q3 in Table 2) where participants conveyed that they donot trust telco operators or app providers with how they usetheir data.
In sum, overwhelmingly our participants trust them-selves with their personal data more than any other entity,followed by banks and telcos. Insurance companies werethe least trusted party. A similar question was also askedby Carrascal et al. [8] obtaining similar results: the mosttrusted entity for a subject was the subject himself and theleast trusted entities were the insurance companies. Interest-ingly, in our study, conducted in Italy, government was thesecond least trusted entity while in Carrascal et al. [8], con-ducted in Spain, the government was the second most trustedentity.
B. Lowest/Highest Bids per Category
When analyzing the lowest/highest bids per category, wefound that 70% of the highest bids for all categories tookplace in the first phase of the study (during the first threeweeks). Adding more auctions (as it happened in the secondphase of the study) led to lower bids.
In the communications category, 61% of the time partic-ipants entered a low bid to win and sell the associated com-munications information. This was significantly higher thanfor any other category. For all other categories, the mostcommon reason reported for entering the low bid was thatthe information was not important. This finding suggeststhat participants found communication data to be the mostdesirable to sell.
Conversely, location was the most sensitive category ofinformation as 25% of the time participants entered a highlocation bid in order to avoid selling the information. Thiswas significantly higher than for the other categories (5% forcommunications, 3% for apps and 6% for media).
C. Insights about Opt-out Choices
Location was the category of data for which subjects opted-out the most (56%), followed by media (24%), apps (18%)and communications (2%). In the free-text explanations pro-vided by our subjects it is clear that location is deemed to bethe most sensitive category of information, e.g.:
“I don’t like the idea of being geo-localized.”“This kind of information is too detailed and toopersonal.”
Interesting explanations were also provided to justify thechoice of not selling apps information, including that fromapps usage is possible to infer information related to inter-ests, opinions (expecially political opinions), and tastes:
10

“From the usage of some applications it is pos-sible infer information such as political orien-tation and other opinions and interests.”
VIII. DISCUSSION AND IMPLICATIONS
From the previously described analyses we can draw six in-sights related to mobile personal data:
A. The Value of Bulk Mobile PII
Carrascal et al. [8] have reported higher values in their studyon valuation of personal Web-browsing information than theones we obtained in our study. The overall median bid valuein our study was x = e2 while Carrascal et al. reported anoverall median bid value equal to x = e7 when they tookin account context-dependent personal information. Thereare a few methodological differences between both studieswhich might explain the differences in bid values. In partic-ular, [8] asked participants to provide a valuation of personalinformation captured while browsing the Web in-situ using arSEM methodology. Instead, we employed a DRM method-ology querying participants about ther mobile PII from theprevious day. From the valuations obtained in [8] and ourstudy, it seems that individual pieces of PII are not as valu-able when queried out-of-context –such as in our study– thanin context –such as in [8].
Conversely, bulk mobile PII was valued higher in ourstudy than in [8] and significantly higher than individual PII.As shown in Tables 4 and 6, bulk information was valuedan order of magnitude higher than individual data except forinformation in the media category. This finding is probablydue to the power of the visualizations in the EoS survey, par-ticularly for location and apps data.
One hypothesis for this higher valuation is that partic-ipants realized how bulk data conveyed information abouttheir life-style and habits and therefore considered it to bemore valuable than daily items. Recently, Tang et al. haveshown the impact of different visualization types (text-, map-, and time-based) on social sharing of location data [46].
This result has a direct consequence for the design oftrading mobile PII and highlights an asymmetry betweenbuyers and sellers: for buyers, it would be more profitableto implement mechanisms to trade single pieces of informa-tion –that they could later aggregate. For sellers, however, itwould be more advantageous to sell bulks of information.
B. Location, location, location
As shown in Tables 4 and 6, location information receivedthe highest valuation for all levels of complexity and was themost opted-out category of mobile PII. Bulk location infor-mation was very highly valued, probably due to the power-ful effect of the map visualization in the EoS survey. Several
participants also expressed that they did not want to be ge-olocalized and considered location information to be highlysensitive and personal.
Moreover, we found statistically significant correlationsbetween mobility behaviors (e.g. mean daily distance trav-eled, daily radius of gyration, etc.) and valuations of per-sonal data. Not all users value their personal data equally:the more someone travels on a daily basis, the more s/hevalues not only her/his location information but also her/hiscommunication and application information.
Regarding this relation, previous works who focusedon location information have presented contrasting results[14, 15]; as we probe participants daily about fine-grainedpersonal data they have just produced, our approach substan-tially differs from these survey-based studies, and it is thusdifficult to directly compare with these works. Generally,our results seem to support the findings presented in [15].
These insights may have an impact on the design of com-mercial location-sharing applications. While users of suchapplications might consent at install time to share their lo-cation with the app, our work suggests that when explicitlyasked about either individual or bulk location data, ∼ 17%of users decide not to share their location information. Inaddition, mobility behaviors will influence the valuations ofPII.
Tsai et al. [48] conducted an online survey with morethan 500 American subjects to evaluate their own percep-tions of the likelihood of several location-sharing scenariosalong with the magnitude of the benefit or harm of each sce-nario (e.g. being stalked or finding people in an emergency).The majority of the participants found the risks of usinglocation-sharing technologies to be higher than the benefits.However, today a significant number of very popular mobileapps such as Foursquare and Facebook Places make use oflocation data. These popular commercial location sharingapps seem to mitigate users’ privacy concerns by allowingthem to selectively report their location using check-in fun-tionalities instead of tracking them automatically.
Based on our findings and given our participants con-cerns and high valuations of bulk location information, webelieve that further user-centric studies on sharing and mon-etary valuation of location data are needed.
C. Socio-demographic characteristics do not matter,behavior does
When we correlated bid values against socio-demographiccharacteristics, we did not find significant correlations. Thisresult is in contrast to previous work that found socio-demographic (mainly sex and age) differences in privacyconcerns and consequent information disclosure behaviors[10, 18]. However, these previous studies were focusedmainly on online information and on disclosure attitudesand privacy concerns than on monetary valuation of personal
11

data. Carrascal et al. [8], instead, found results in line withours (no significant correlations) except for a surprising lowvaluation of online information from older users.
On the other hand, we found statistically significant cor-relations between behavior (particularly mobility and appusage) and valuations of bids. From our findings it seemsthat personal differences in valuations of mobile PII are asso-ciated with behavioral differences rather than demographicdifferences. In particular, the larger the daily distance trav-eled and radius of gyration, the higher the valuation of PII.Conversely, the more apps a person used, the lower the valu-ation of PII. A potential reason for this correlation is due tothe fact that savvy app users have accepted that mobile appscollect their mobile PII in order to provide their service andhence value their mobile PII less.
D. Intentional self-disclosure leads to higher bids
We found a positive correlation between the Inten-tional/Unintentional dimension of self-disclosure and themedian values of the bids. This result could be explained bythe fact that people with more intentional control about dis-closing their own personal information, may be more awareof their personal data and hence also value it more from amonetary point of view.
Interestingly, we did not find significant correlationsbetween bid values and other traits with the exceptionof Agreeablenness (with bulk location and communicationbids). Previous studies on the influence played by individ-ual traits (usually personality traits and LoC) on privacy dis-positions and privacy-related behaviors have provided con-trasting evidence: some of them found small correlations[33, 41], while Schrammel et al. found no correlations [45].Hence, our results require additional investigations in orderto clarify which are, if any, the dispositions and individualcharacteristics to take in account when a buyer makes a mon-etary offer for personal data.
E. Trust
From our study and from Carrascal et al. [8], it clearlyemerges that individuals mainly trust themselves to handletheir own personal data. This result suggests the adoptionof a decentralized and user-centric architecture for personaldata management.
Recently, several research groups have started to designand build personal data repositories which enable people tocontrol, collect, delete, share, and sell personal data [16, 38],and whose value to users is supported by our findings.
F. Unusual days lead to higher bids
During our study there were two unusual days: December8th (Immaculate Conception Holiday) and November 11th
(a day with extremely strong winds which caused multipleroad blocks and accidents). As can be seen in Figure 2, themedian bids for all categories in these two days were sig-nificantly higher than for the rest of the days in the study.Perhaps not surprisingly, participants in our study value theirPII higher in days that are unusual when compared to typicaldays.
This result suggests that not all PII even within the samecategory and level of complexity is valued equally by ourparticipants, which has a direct implication for personal datamarkets and for services that monetize mobile personal data.
IX. CONCLUSION
We have investigated the monetary value that people assignto their PII as it is collected by their mobile phone. In par-ticular, we have taken into account four categories of PII (lo-cation, communication, apps and media) with three levels ofcomplexity (individual, aggregated and processed). We havecarried out a comprehensive 6-week long study in a livinglab environment with 60 participants adopting a Day Recon-struction Method along with a reverse second price auctionmechanism to collect honest monetary valuations.
We have found that location is the most valued categoryof PII and that bulk information is valued much higher thanindividual information (except for the media category). Wehave identified individual differences in bidding behaviorswhich are not correlated with socio-demographic traits, butare correlated with behavior (mobility and app usage) andintentional self-disclosure.
Finally, we have found that participants trust themselveswith their PII above banks, telcos and insurance companiesand that unusual days are perceived as more valuable thantypical days.
REFERENCES
[1] A. Acquisti and J. Grossklags. Privacy and rationalityin individual decision making. IEEE Security & Pri-vacy, 2:24–30, 2005.
[2] A. Acquisti, L. John, and G. Loewenstein. What is pri-vacy worth. In Twenty first workshop on informationsystems and economics (WISE), pages 14–15, 2009.
[3] E. Adar and B. Huberman. A market for secrets. FirstMonday, 6(8), 2001.
[4] N. Aharony, W. Pan, C. Ip, I. Khayal, and A. Pentland.Social fmri: Investigating and shaping social mecha-nisms in the real world. Pervasive and Mobile Com-puting, 7(6):643–659, 2011.
12

[5] Y. Amichai-Hamburger and G. Vinitzky. Social net-work use and personality. Computers in Human Be-havior, 26(6):1289–1295, 2010.
[6] C. Aperjis and B. A. Huberman. A market for unbiasedprivate data: Paying individuals according to their pri-vacy attitudes. arXiv preprint arXiv:1205.0030, 2012.
[7] L. Barkhuus, B. Brown, M. Bell, S. Sherwood, M. Hall,and M. Chalmers. From awareness to repartee: sharinglocation within social groups. In Proceedings of theSIGCHI Conference on Human Factors in ComputingSystems, pages 497–506. ACM, 2008.
[8] J. P. Carrascal, C. Riederer, V. Erramilli, M. Cherubini,and R. de Oliveira. Your browsing behavior for a bigmac: Economics of personal information online. InProceedings of the 22nd international conference onWorld Wide Web, pages 189–200, 2013.
[9] M. Cherubini and N. Oliver. A refined experience sam-pling method to capture mobile user experience. CoRR,abs/0906.4125, 2009.
[10] E. Christofides, A. Muise, and S. Desmarais. Heymom, whats on your facebook? comparing facebookdisclosure and privacy in adolescents and adults. So-cial Psychological and Personality Science, 3(1):48–54, 2012.
[11] S. Consolvo, I. E. Smith, T. Matthews, A. LaMarca,J. Tabert, and P. Powledge. Location disclosure to so-cial relations: why, when, & what people want to share.In Proceedings of the SIGCHI Conference on HumanFactors in Computing Systems, pages 81–90. ACM,2005.
[12] P. T. Costa and R. R. McCrae. The revised neo per-sonality inventory (neo-pi-r). The SAGE handbook ofpersonality theory and assessment, 2:179–198, 2008.
[13] P. Cozby. Self-disclosure: A literature review. Psycho-logical Bulletin, 79(2):73–91, 1973.
[14] D. Cvrcek, M. Kumpost, V. Matyas, and G. Danezis.A study on the value of location privacy. In Proceed-ings of the 5th ACM workshop on Privacy in electronicsociety, pages 109–118. ACM, 2006.
[15] G. Danezis, S. Lewis, and R. J. Anderson. How muchis location privacy worth? In WEIS, volume 5. Cite-seer, 2005.
[16] Y.-A. de Montjoye, S. S. Wang, A. Pentland, D. T. T.Anh, A. Datta, et al. On the trusted use of large-scalepersonal data. IEEE Data Eng. Bull., 35(4):5–8, 2012.
[17] T. Farma and I. Cortivonis. Un questionario sul ”locusof control”: suo utilizzo nel contesto italiano (a ques-tionnaire on the locus of control: its use in the italiancontext. Ricerca in Psicoterapia, 2, 2000.
[18] J. Fogel and E. Nehmad. Internet social network com-munities: Risk taking, trust, and privacy concerns.Computers in Human Behavior, 25(1):153–160, 2009.
[19] L. Goodman. Snowball sampling. Annals of Mathe-matical Statistics, 32:148–170, 1961.
[20] I.-H. Hann, K.-L. Hui, S.-Y. T. Lee, and I. P. Png.Overcoming online information privacy concerns: Aninformation-processing theory approach. Journal ofManagement Information Systems, 24(2):13–42, 2007.
[21] J. I. Hong and J. A. Landay. An architecture forprivacy-sensitive ubiquitous computing. In Proceed-ings of the 2nd International Conference on MobileSystems, Applications, and Services, MobiSys ’04,pages 177–189. ACM, 2004.
[22] M. G. Hoy and G. Milne. Gender differences inprivacy-related measures for young adult facebookusers. Journal of Interactive Advertising, 10(2):28–45,2010.
[23] B. A. Huberman, E. Adar, and L. R. Fine. Valuatingprivacy. Security & Privacy, IEEE, 3(5):22–25, 2005.
[24] K.-L. Hui, H. H. Teo, and S.-Y. T. Lee. The valueof privacy assurance: An exploratory field experiment.MIS Quarterly, 31(1):19–33, 2007.
[25] C. Jensen, C. Potts, and C. Jensen. Privacy practicesof internet users: Self-reports versus observed behav-ior. International Journal of Human-Computer Studies,63(1-2):203–227, 2005.
[26] I. A. Junglas, N. A. Johnson, and C. Spitzmuller. Per-sonality traits and concern for privacy: an empiricalstudy in the context of location-based services. Euro-pean Journal of Information Systems, 17(4):387–402,2008.
[27] D. Kahneman, A. Krueger, D. Schkade, N. Schwarz,and A. Stone. A survey method for characterizing dailylife experience: The day reconstruction method. Sci-ence, 306:1776–1780, 2004.
[28] B. P. Knijnenburg, A. Kobsa, and H. Jin. Dimensional-ity of information disclosure behavior. InternationalJournal of Human-Computer Studies, 71(12):1144–1162, 2013.
13

[29] M. Korzaan, N. Brooks, and T. Greer. Demystify-ing personality and privacy: An empirical investigationinto antecedents of concerns for information privacy.Journal of Behavioral Studies in Business, 1, 2009.
[30] N. D. Lane, E. Miluzzo, H. Lu, D. Peebles, T. Choud-hury, and A. T. Campbell. A survey of mobile phonesensing. IEEE Communications Magazine, 48(9):140–150, 2010.
[31] J. Lin, G. Xiang, J. I. Hong, and N. Sadeh. Modelingpeople’s place naming preferences in location sharing.In Proceedings of the 12th ACM International Confer-ence on Ubiquitous Computing, pages 75–84. ACM,2010.
[32] J. Lindqvist, J. Cranshaw, J. Wiese, J. Hong, andJ. Zimmerman. I’m the mayor of my house: exam-ining why people use foursquare-a social-driven loca-tion sharing application. In Proceedings of the SIGCHIConference on Human Factors in Computing Systems,pages 2409–2418. ACM, 2011.
[33] J. Lo. Privacy concern, locus of control, and saliencein a trust-risk model of information disclosure on socialnetworking sites. In AMCIS, page 110, 2010.
[34] A. Madan, M. Cebrian, S. T. Moturu, K. Farrahi, andA. Pentland. Sensing the ”health state” of a commu-nity. IEEE Pervasive Computing, 11(4):36–45, 2012.
[35] R. Mayer and J. Davis. The effect of the perfor-mance appraisal system on trust for management: afield quasi-experiment. Journal of Applied Psychology,84:123–136, 1999.
[36] R. Mc Afee and J. Mc Millan. Auctions and bidding.Journal of Economic Literature, 25:699–738, 1987.
[37] G. Mesch and G. Beker. Are norms of disclosure ofonline and offline personal information associated withthe disclosure of personal information online? HumanCommunication Research, 36:570–592, 2010.
[38] M. Mun, S. Hao, N. Mishra, K. Shilton, J. Burke,D. Estrin, M. Hansen, and R. Govindan. Personal datavaults: A locus of control for personal data streams. InProceedings of the 6th International Conference, Co-NEXT ’10, pages 1–12, 2010.
[39] A. Pentland. Society’s nervous system: Building ef-fective government, energy, and public health systems.IEEE Computer, 45(1):31–38, 2012.
[40] M. Perugini and L. Di Blas. The big five markerscales (bfms) and the italina ab5c taxonomy: Analysesfrom an emic-etic perspective. In B. de Raad B. and
M. Perugini, editors, Big Five Assessment. Gottingen:Hogrefe and Huber Publishers, 2002.
[41] D. Quercia, R. Lambiotte, D. Stillwell, M. Kosinski,and J. Crowcroft. The personality of popular facebookusers. In Proceedings of the ACM 2012 conference oncomputer supported cooperative work, pages 955–964.ACM, 2012.
[42] C. Riederer, V. Erramilli, A. Chaintreau, B. Krishna-murthy, and P. Rodriguez. For sale : Your data: By: You. In Proceedings of the 10th ACM Workshop onHot Topics in Networks, HotNets-X, pages 13:1–13:6,New York, NY, USA, 2011. ACM.
[43] J. Rotter. Generalized expectancies for internal ver-sus external control of reinforcement. PsychologicalMonographs, 1965.
[44] J. B. Rotter. A new scale for the measurement of inter-personal trust. Journal of personality, 35(4):651–665,1967.
[45] J. Schrammel, C. Koffel, and M. Tscheligi. Personal-ity traits, usage patterns and information disclosure inonline communities. In Proceedings of the 23rd BritishHCI Group Annual Conference on People and Comput-ers: Celebrating People and Technology, pages 169–174. British Computer Society, 2009.
[46] K. P. Tang, J. I. Hong, and D. P. Siewiorek. Under-standing how visual representations of location feedsaffect end-user privacy concerns. In Proceedings of the13th international conference on Ubiquitous comput-ing, pages 207–216. ACM, 2011.
[47] E. Toch and I. Levi. Locality and privacy in people-nearby applications. In Proceedings of the 2013 ACMinternational joint conference on Pervasive and ubiq-uitous computing, pages 539–548. ACM, 2013.
[48] J. Tsai, P. Kelley, L. Cranor, and N. Sadeh. Locationsharing technologies: Privacy risks and controls. I/S: AJournal of Law and Policy for the Information Society,6(2):119–151, 2010.
[49] J. Y. Tsai, S. Egelman, L. Cranor, and A. Acquisti. Theeffect of online privacy information on purchasing be-havior: An experimental study. Information SystemsResearch, 22(2):254–268, 2011.
[50] M. Van Kleek, D. A. Smith, N. Shadbolt, andm. schraefel. A decentralized architecture for consoli-dating personal information ecosystems: The webbox.In PIM, pages 177–189, 2012.
[51] H. Varian, F. Wallenberg, and G. Woroch. The demo-graphics of the do-not-call list. IEEE Security & Pri-vacy, 3:34–39, 2005.
14

[52] R. Want, T. Pering, G. Danneels, M. Kumar, M. Sun-dar, and J. Light. The personal server: Changing theway we think about ubiquitous computing. In In Pro-ceedings of 4th International Conference on Ubiqui-tous Computing, pages 194–209, 2002.
[53] L. Wheeless and J. Grotz. Conceptualization and mea-surement of reported self-disclosure. Human Commu-nication Research, 2:338–346, 1976.
[54] J. Wiese, P. G. Kelley, L. F. Cranor, L. Dabbish, J. I.
Hong, and J. Zimmerman. Are you close with me?are you nearby?: investigating social groups, close-ness, and willingness to share. In Proceedings of the13th international conference on Ubiquitous comput-ing, pages 197–206. ACM, 2011.
[55] A. L. Young and A. Quan-Haase. Information reve-lation and internet privacy concerns on social networksites: a case study of facebook. In Proceedings of thefourth international conference on Communities andtechnologies, pages 265–274. ACM, 2009.
15