Embed Size (px)
Citation preview
Participate during the seminar:
microlinks.kdid.org/afterhours
After Hours Seminar
Like us on Facebook facebook.com/microlinks
#MLevents
Follow us on Twitter twitter.com/microlinks
Money on the Move: Payments and Money Transfer Behavior of African
Households
Jake Kendall Bill & Melinda Gates Foundation
April 23, 2012
Nandini Harihareswara USAID
Welcome
Jake Kendall Bill & Melinda Gates Foundation
Jake Kendall is a Program Officer in the Financial Services for the Poor (FSP) initiative at the Bill & Melinda Gates Foundation. Kendall manages the research strategy of FSP including managing FSP’s major research grants and engaging with the academic community. Prior to joining the Foundation, he was an Economist with the Consultative Group to Assist the Poor (CGAP). Kendall holds a PhD in Economics from UC Santa Cruz and a BS in Physics from MIT. After graduating from MIT, he volunteered for 2 years in Zambia as a fisheries extension agent with the US Peace Corps.
Bio: Jake Kendall
Nandini Harihareswara USAID
Nandini Harihareswara is the Director of Operations and Senior Partnerships Officer in USAID’s Mobile Solutions Division. In this position, she encourages USAID partners, donors, businesses and host governments to use electronic payments as appropriate. Previously, Harihareswara worked as an Investment Officer for the USAID Development Credit Authority Office. Harihareswara has worked extensively in the public, private and non-profit sectors and enjoys bringing people together to craft innovative solutions for development challenges. She holds a MBA and Masters in International Trade and Investment Policy from GWU.
Bio: Nandini Harihareswara
Domestic Payments – Gateway to Financial Inclusion?
Survey Data from 11 African Countries
Jake Kendall
Working D
raft - Last Modified 7/17/2011 10:00:05 PM
Printed 7/17/2011 5:59:20 PM
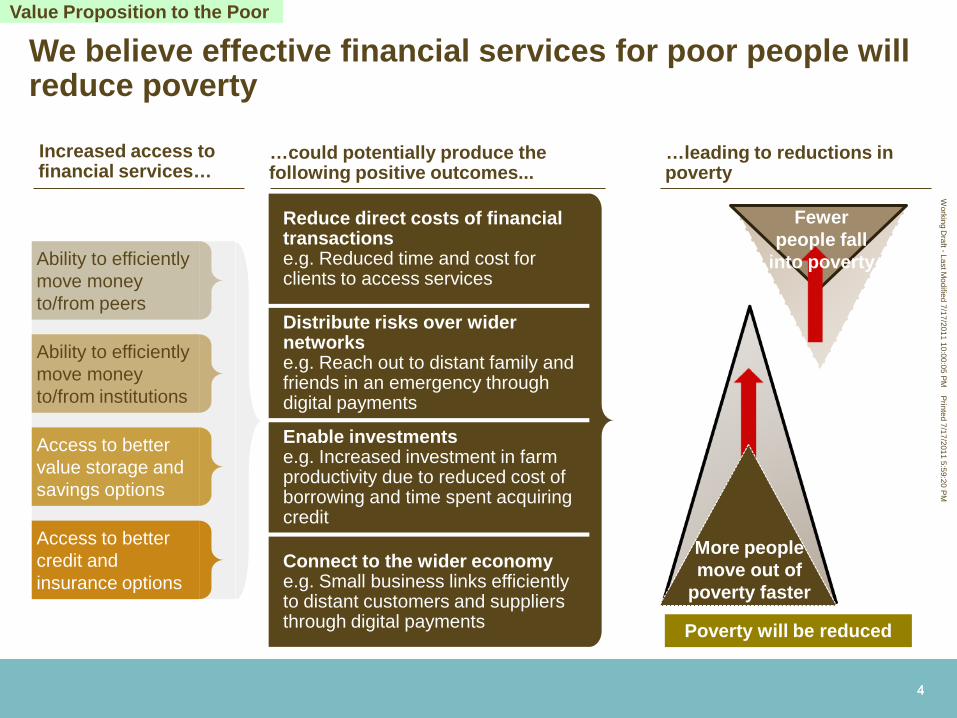
Value Proposition to the Poor
Poverty will be reduced
More people move out of
poverty faster
Fewer people fall
into poverty
…leading to reductions in poverty
Increased access to financial services…
4 4
…could potentially produce the following positive outcomes...
Distribute risks over wider networks e.g. Reach out to distant family and friends in an emergency through digital payments
Enable investments e.g. Increased investment in farm productivity due to reduced cost of borrowing and time spent acquiring credit
Reduce direct costs of financial transactions e.g. Reduced time and cost for clients to access services
Connect to the wider economy e.g. Small business links efficiently to distant customers and suppliers through digital payments
Ability to efficiently move money to/from peers
Ability to efficiently move money to/from institutions
Access to better value storage and savings options
Access to better credit and insurance options
We believe effective financial services for poor people will reduce poverty
Value Proposition to the Poor
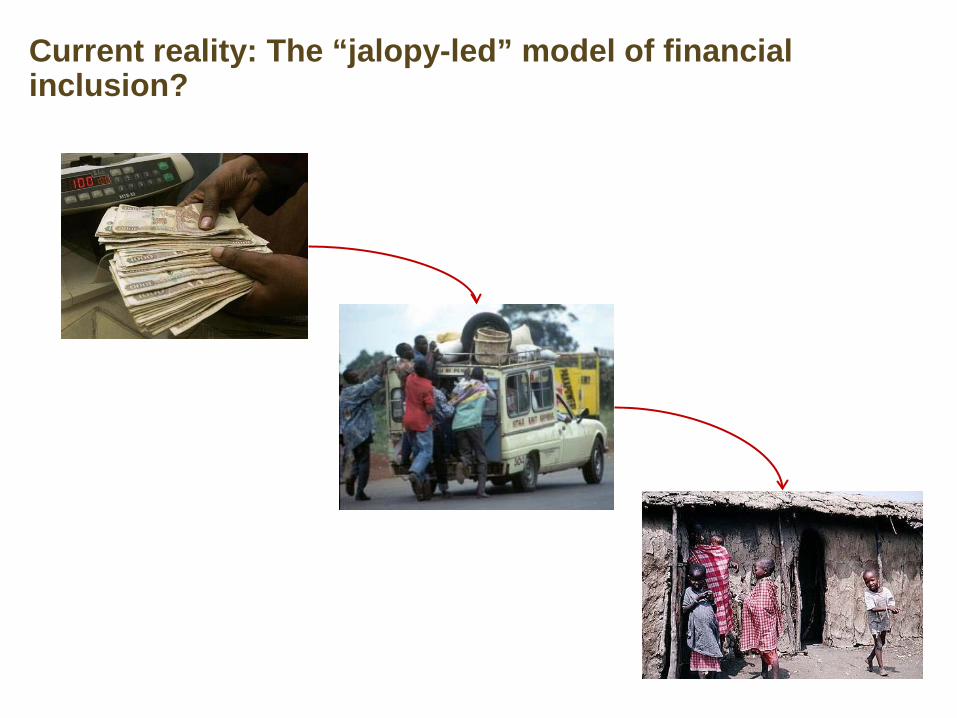
Current reality: The “jalopy-led” model of financial inclusion?
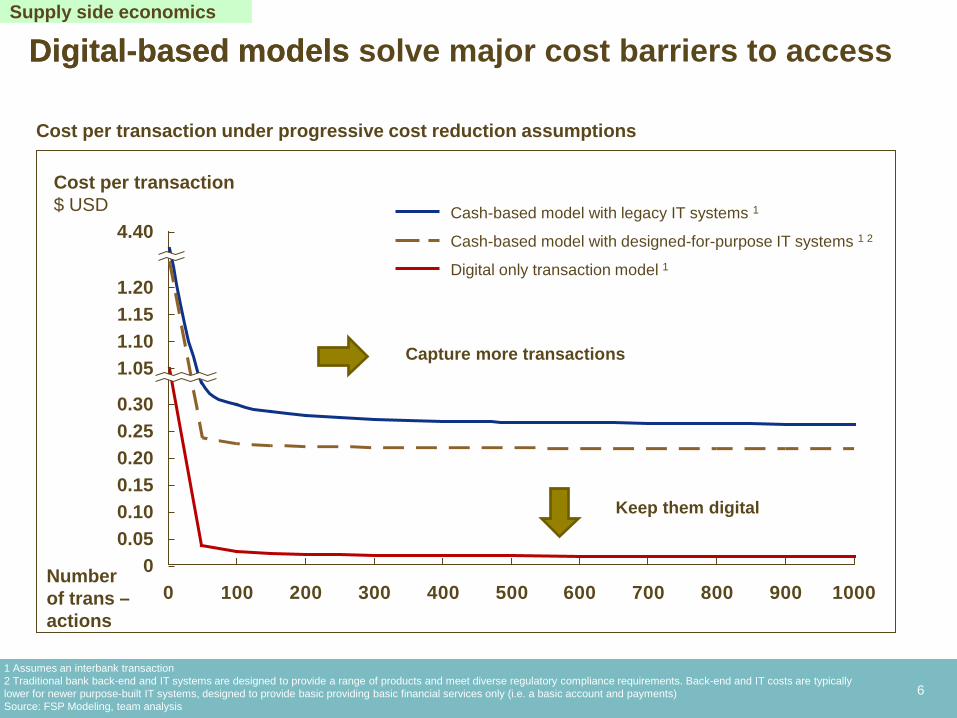
Digital-based models solve major cost barriers to access
0 100 200 300 400 500 600 700 800 900 1000
1.15 1.10 1.05
0.30 0.25 0.20 0.15 0.10 0.05
0
4.40
1.20 Digital only transaction model 1
Cash-based model with designed-for-purpose IT systems 1 2
Cash-based model with legacy IT systems 1
Cost per transaction under progressive cost reduction assumptions
1 Assumes an interbank transaction 2 Traditional bank back-end and IT systems are designed to provide a range of products and meet diverse regulatory compliance requirements. Back-end and IT costs are typically lower for newer purpose-built IT systems, designed to provide basic providing basic financial services only (i.e. a basic account and payments) Source: FSP Modeling, team analysis
Number of trans – actions
Supply side economics
Cost per transaction $ USD
6
Keep them digital
Capture more transactions
Digital-based models
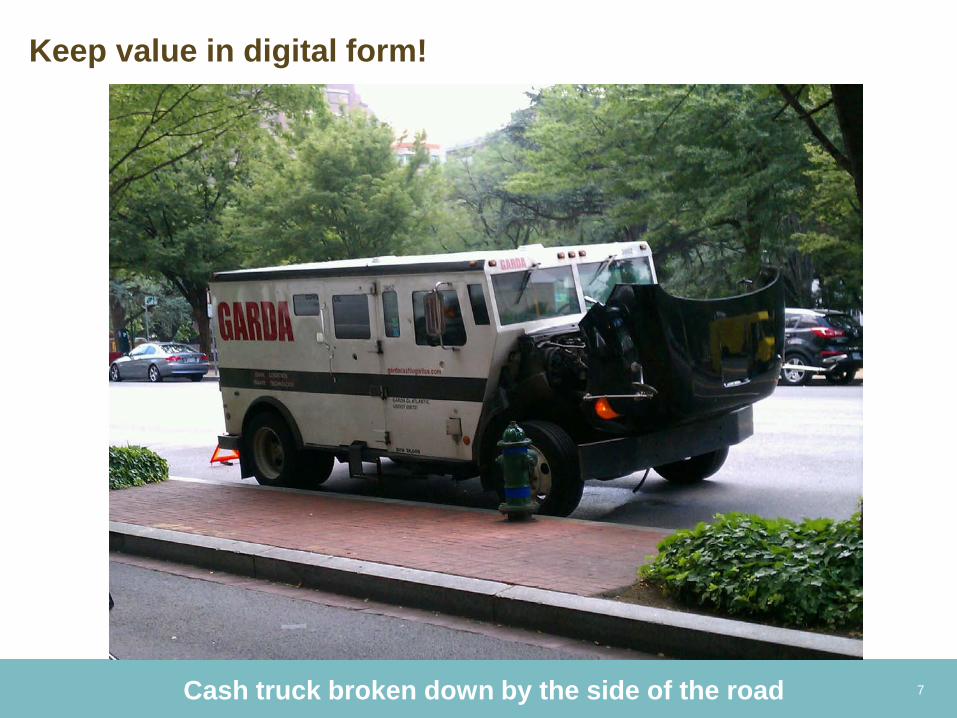
Keep value in digital form!
7 Cash truck broken down by the side of the road
© 2009 Bill & Melinda Gates Foundation | 8
The Payments Connection is critical
Public / donor institutions
Employers
Load agents Mobile network operators
Hospitals / schools
Weddings
Agro dealers
Merchants
Banks / MFIs
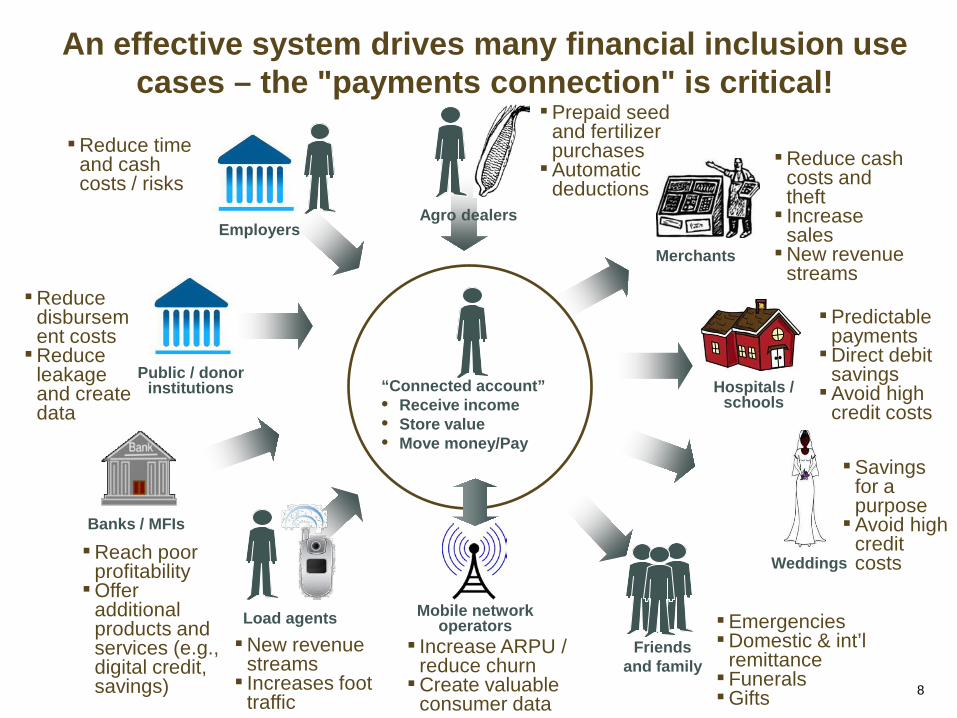
“Connected account” • Receive income • Store value • Move money/Pay
▪Emergencies ▪Domestic & int’l
remittance ▪Funerals ▪Gifts
▪Savings for a purpose ▪Avoid high
credit costs
▪Predictable payments ▪Direct debit
savings ▪Avoid high
credit costs
▪Reduce cash costs and theft ▪ Increase
sales ▪New revenue
streams
▪Prepaid seed and fertilizer purchases ▪Automatic
deductions
▪Reduce time and cash costs / risks
▪Reduce disbursement costs ▪Reduce
leakage and create data
▪ Increase ARPU / reduce churn ▪Create valuable
consumer data
▪New revenue streams ▪ Increases foot
traffic
▪Reach poor profitability ▪Offer
additional products and services (e.g., digital credit, savings)
Friends and family
An effective system drives many financial inclusion use cases – the "payments connection" is critical!
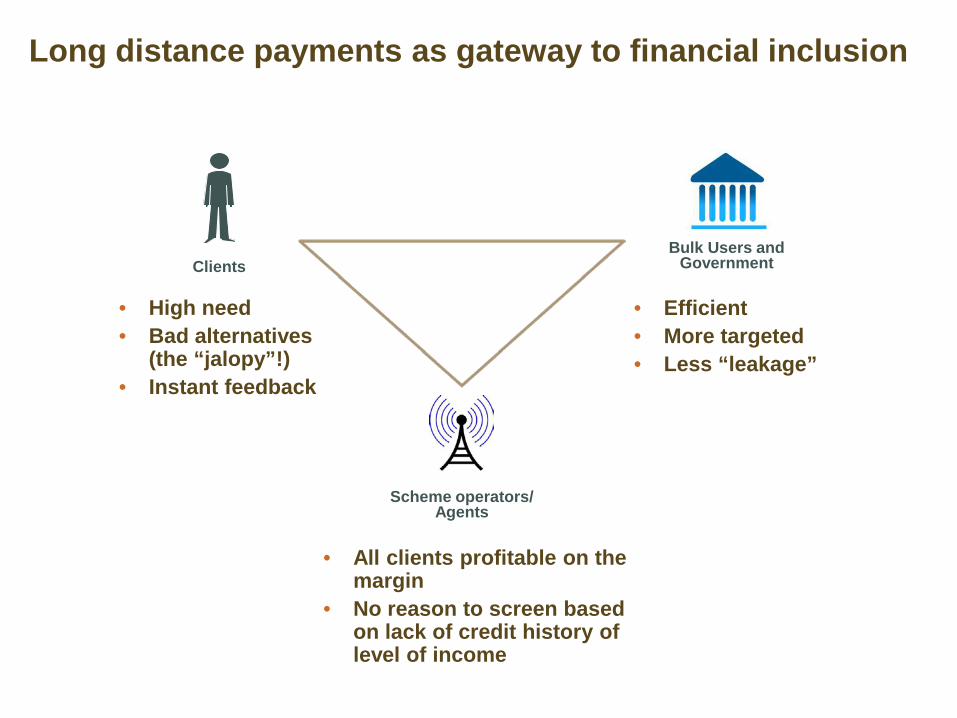
Long distance payments as gateway to financial inclusion
9
Bulk Users and Government Clients
Scheme operators/ Agents
• High need • Bad alternatives
(the “jalopy”!) • Instant feedback
• All clients profitable on the margin
• No reason to screen based on lack of credit history of level of income
• Efficient • More targeted • Less “leakage”
10
Payment behavior survey methodology
Gallup World Poll of 1000 adults in each of 11 African countries (nationally representative, random walk) South Africa, Zambia, Nigeria, Kenya, Tanzania, Uganda,
the Democratic Republic of the Congo (DRC), Sierra Leone, Botswana, Mali and Rwanda Transactions occurring in the last 30 days; payments
to/from distant counter parties (i.e. in “different areas or cities” in the same country) Domestic money transfers, payments for goods,
international remittances, government and wage payments, and utilities and other bills.
11
Market for better electronic payments
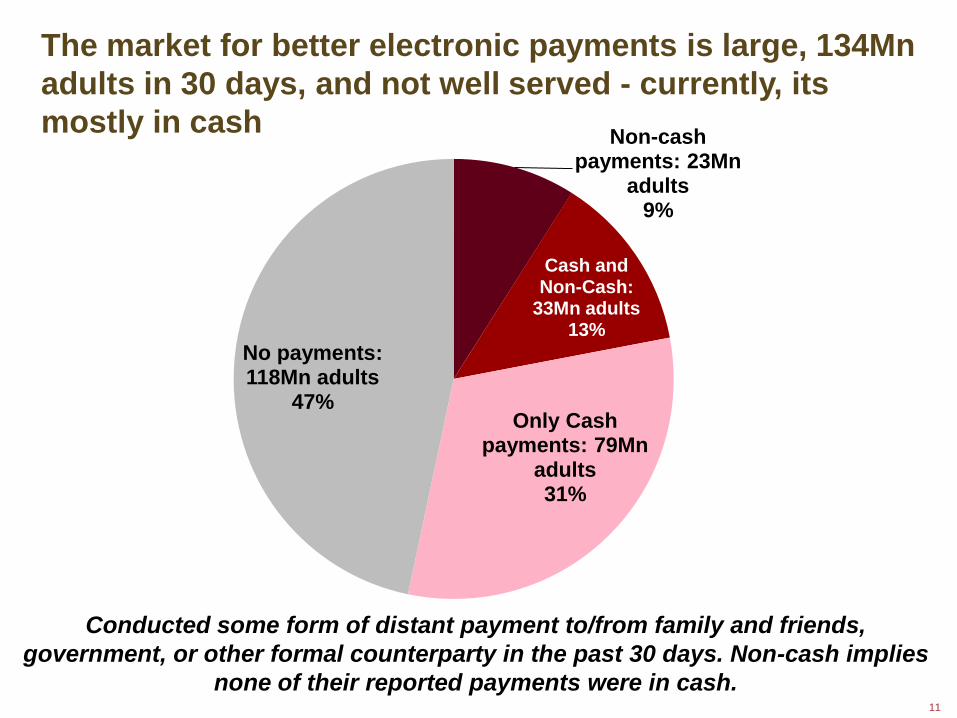
Conducted some form of distant payment to/from family and friends, government, or other formal counterparty in the past 30 days. Non-cash implies
none of their reported payments were in cash.
Non-cash payments: 23Mn
adults 9%
Cash and Non-Cash:
33Mn adults 13%
Only Cash payments: 79Mn
adults 31%
No payments: 118Mn adults
47%
The market for better electronic payments is large, 134Mn adults in 30 days, and not well served - currently, its mostly in cash
12
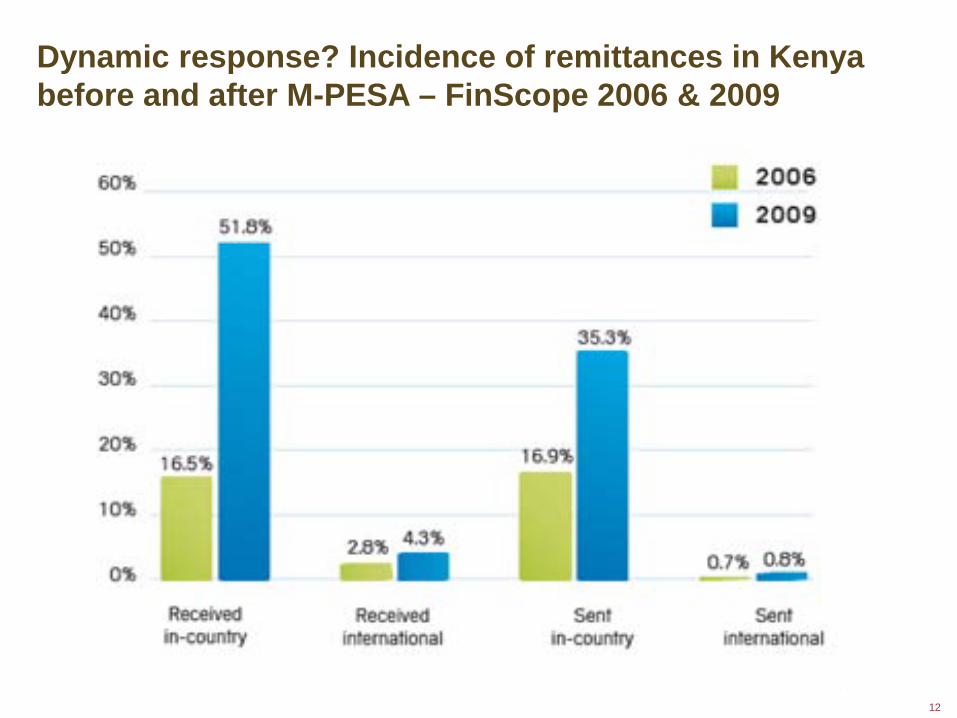
Incidence of remittances in Kenya before and after M-PESA Dynamic response? Incidence of remittances in Kenya before and after M-PESA – FinScope 2006 & 2009
13
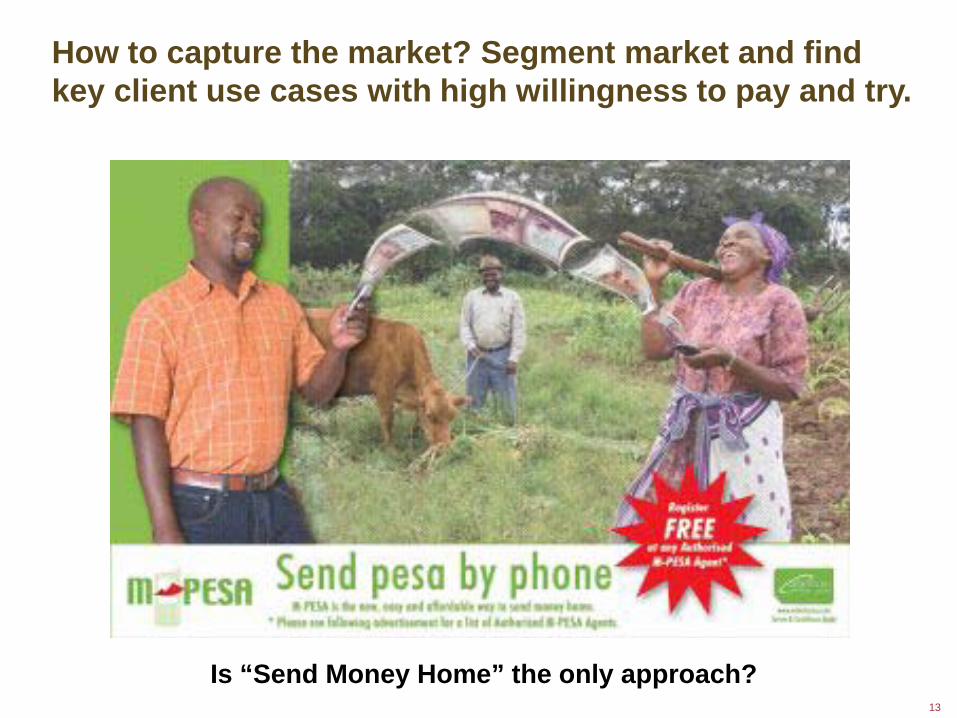
How to capture the market
Is “Send Money Home” the only approach?
How to capture the market? Segment market and find key client use cases with high willingness to pay and try.
14
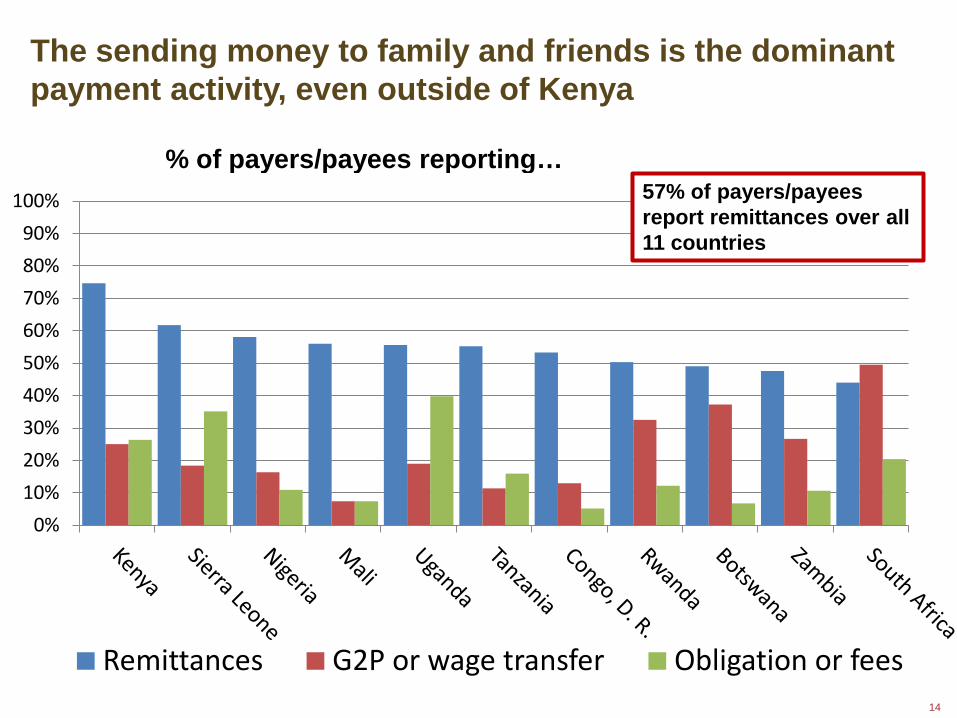
Dominant payment method
% of payers/payees reporting…
0% 10% 20% 30% 40% 50% 60% 70% 80% 90%
100%
Remittances G2P or wage transfer Obligation or fees
57% of payers/payees report remittances over all 11 countries
The sending money to family and friends is the dominant payment activity, even outside of Kenya
15
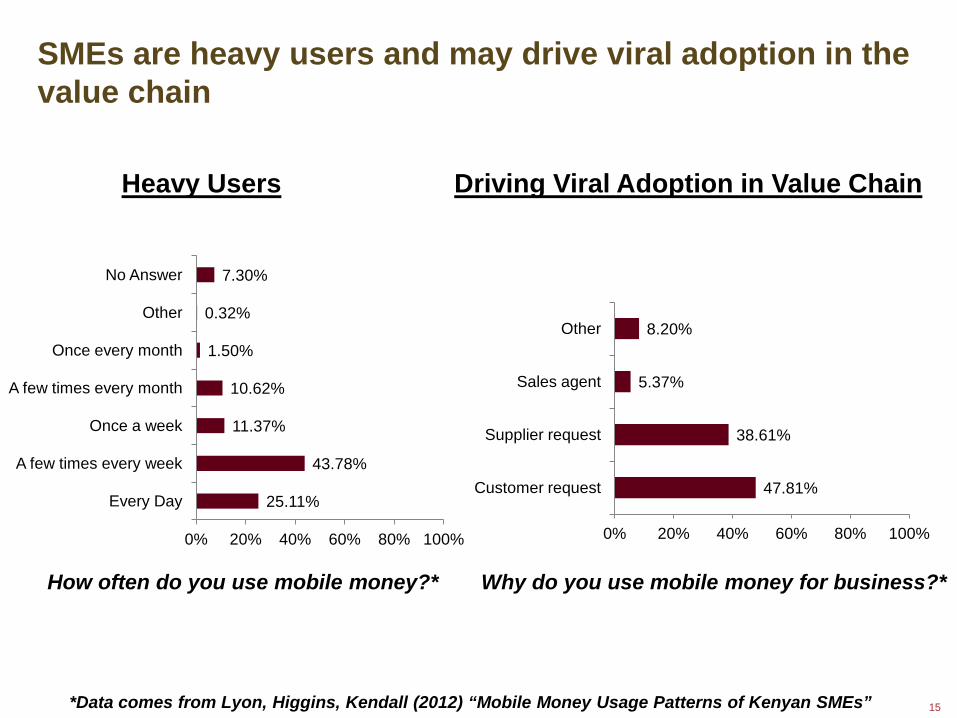
Importance of SMEs
25.11%
43.78%
11.37%
10.62%
1.50%
0.32%
7.30%
0% 20% 40% 60% 80% 100%
Every Day
A few times every week
Once a week
A few times every month
Once every month
Other
No Answer
47.81%
38.61%
5.37%
8.20%
0% 20% 40% 60% 80% 100%
Customer request
Supplier request
Sales agent
Other
Why do you use mobile money for business?* How often do you use mobile money?*
*Data comes from Lyon, Higgins, Kendall (2012) “Mobile Money Usage Patterns of Kenyan SMEs”
Heavy Users Driving Viral Adoption in Value Chain
SMEs are heavy users and may drive viral adoption in the value chain
16
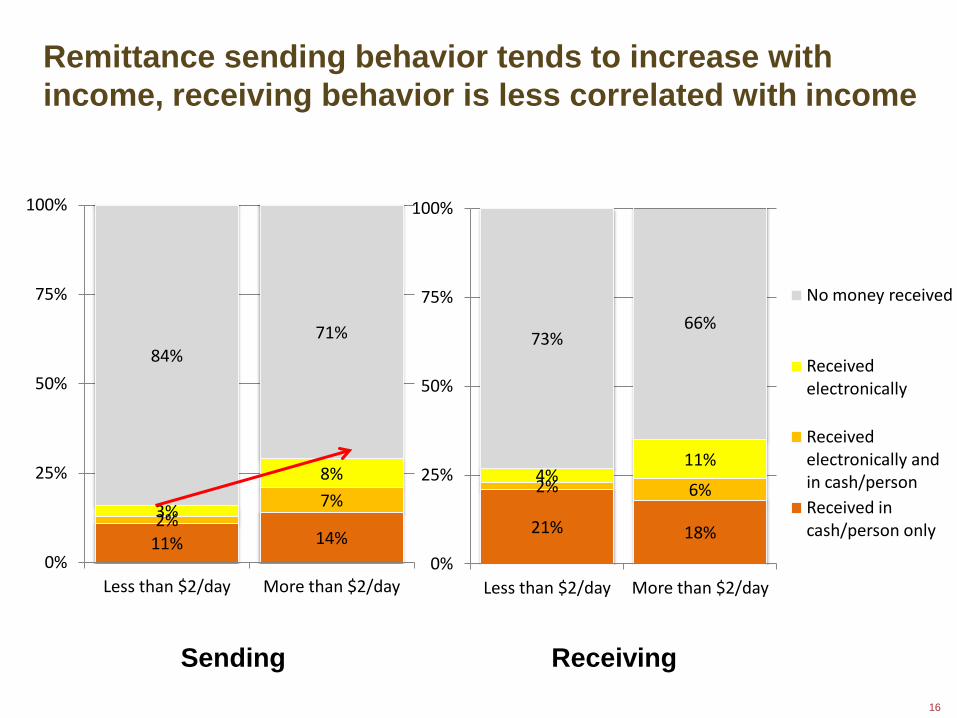
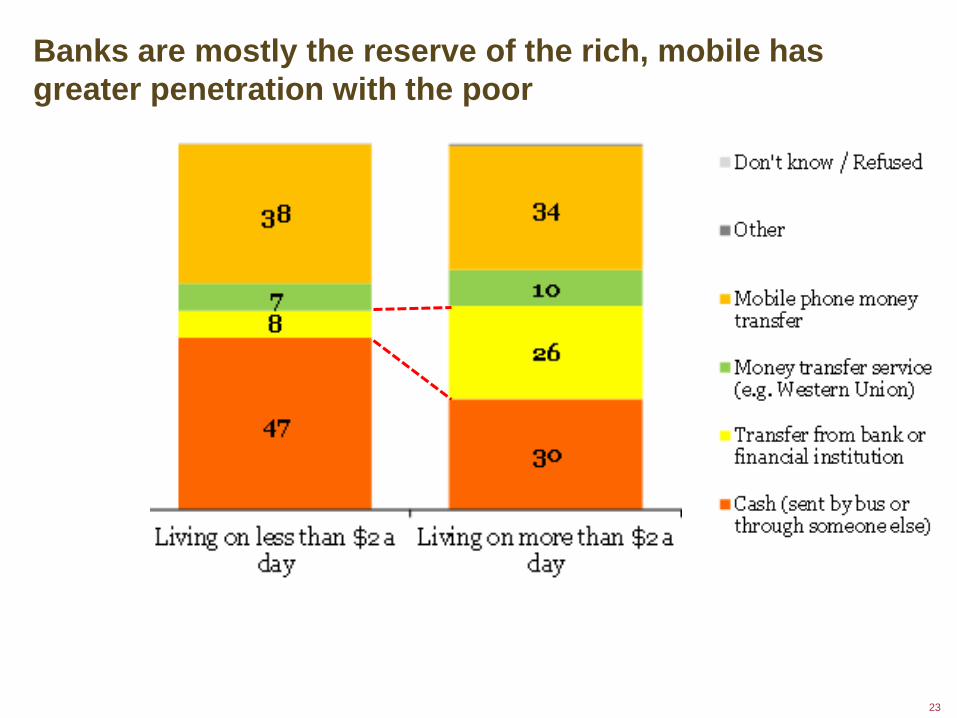
11% 14% 2%
7% 3%
8%
84% 71%
0%
25%
50%
75%
100%
Less than $2/day More than $2/day
21% 18%
2% 6% 4%
11%
73% 66%
0%
25%
50%
75%
100%
Less than $2/day More than $2/day
No money received
Received electronically
Received electronically and in cash/person Received in cash/person only
Remittance sending behavior
Receiving Sending
Remittance sending behavior tends to increase with income, receiving behavior is less correlated with income
17
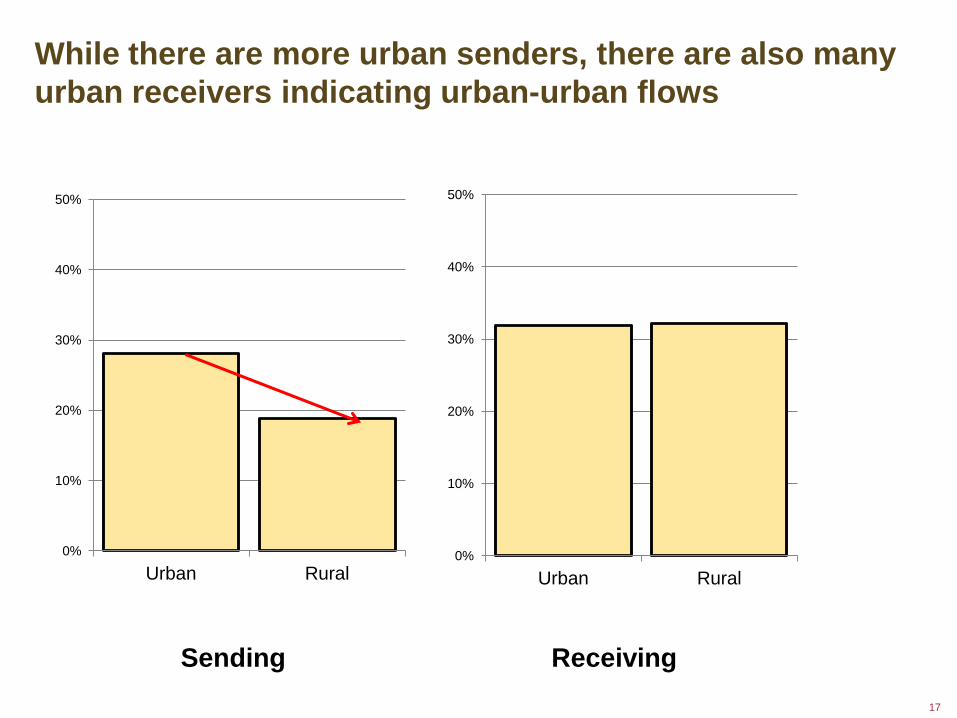
Urban-urban flows
Receiving Sending
0%
10%
20%
30%
40%
50%
Urban Rural 0%
10%
20%
30%
40%
50%
Urban Rural
While there are more urban senders, there are also many urban receivers indicating urban-urban flows
18
Data on sending and receiving
0%
10%
20%
30%
40%
50%
Employed full time
Self employed, part time,
unemployed
0%
10%
20%
30%
40%
50%
Employed full time Self employed, part time,
unemployed
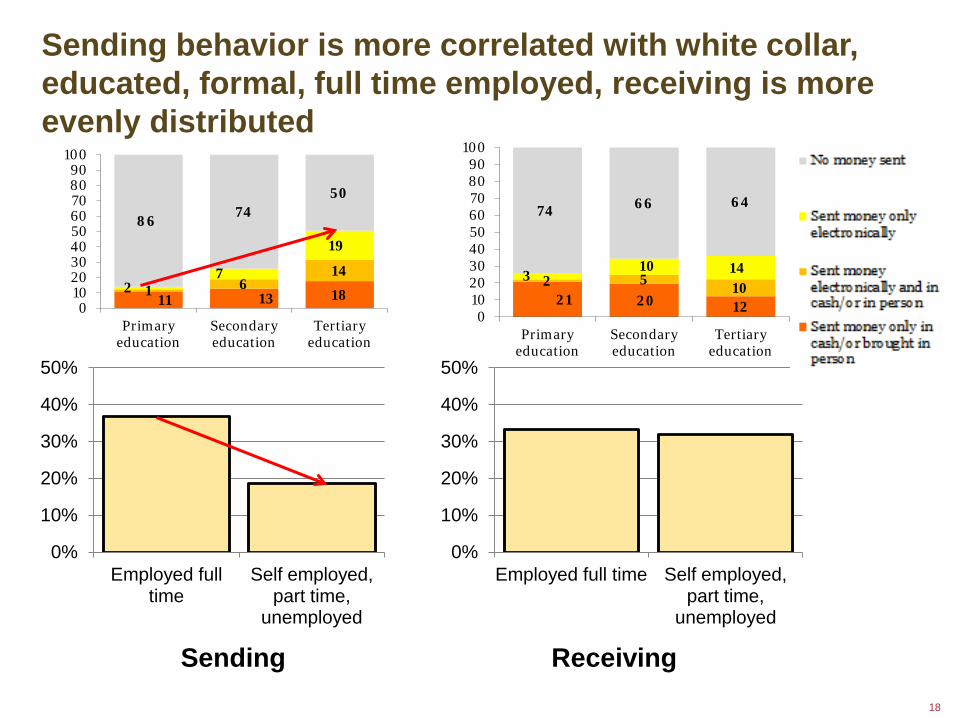
Sending behavior is more correlated with white collar, educated, formal, full time employed, receiving is more evenly distributed
Receiving Sending
11 13 18 1 6 14
2 7
19
86 74
50
0 10 20 30 40 50 60 70 80 90
100
Primary education
Secondary education
Tertiary education
21 20 12
2 5 10
3 10 14
74 66 64
0 10 20 30 40 50 60 70 80 90
100
Primary education
Secondary education
Tertiary education
19
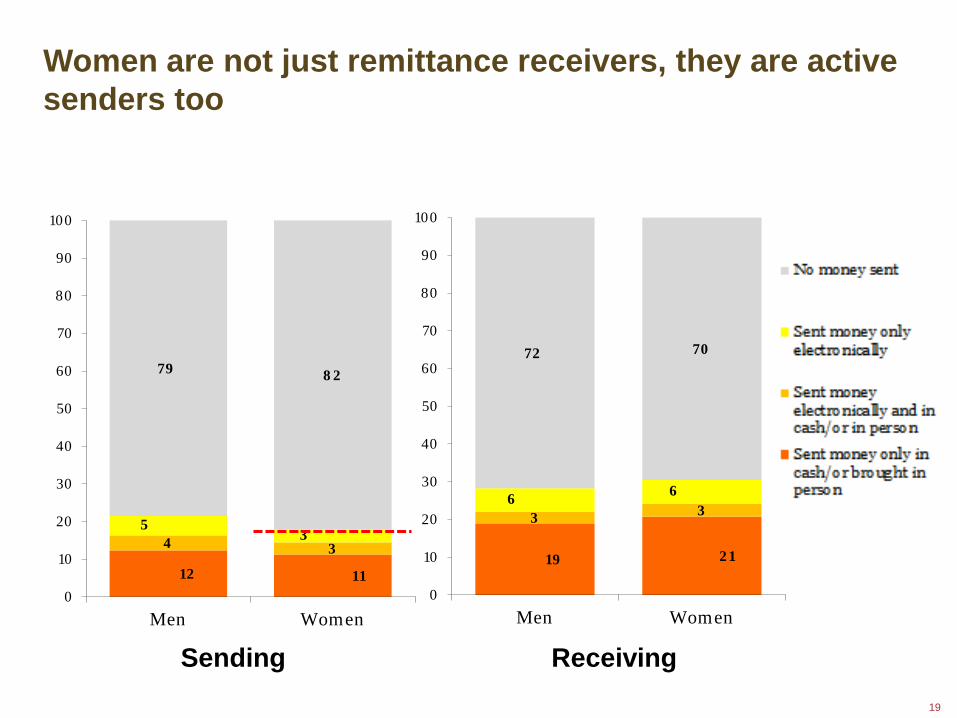
19 21
3 3 6 6
72 70
0
10
20
30
40
50
60
70
80
90
100
Men Women
Role of women
12 11
4 3
5 3
79 82
0
10
20
30
40
50
60
70
80
90
100
Men Women
Receiving Sending
Women are not just remittance receivers, they are active senders too
20
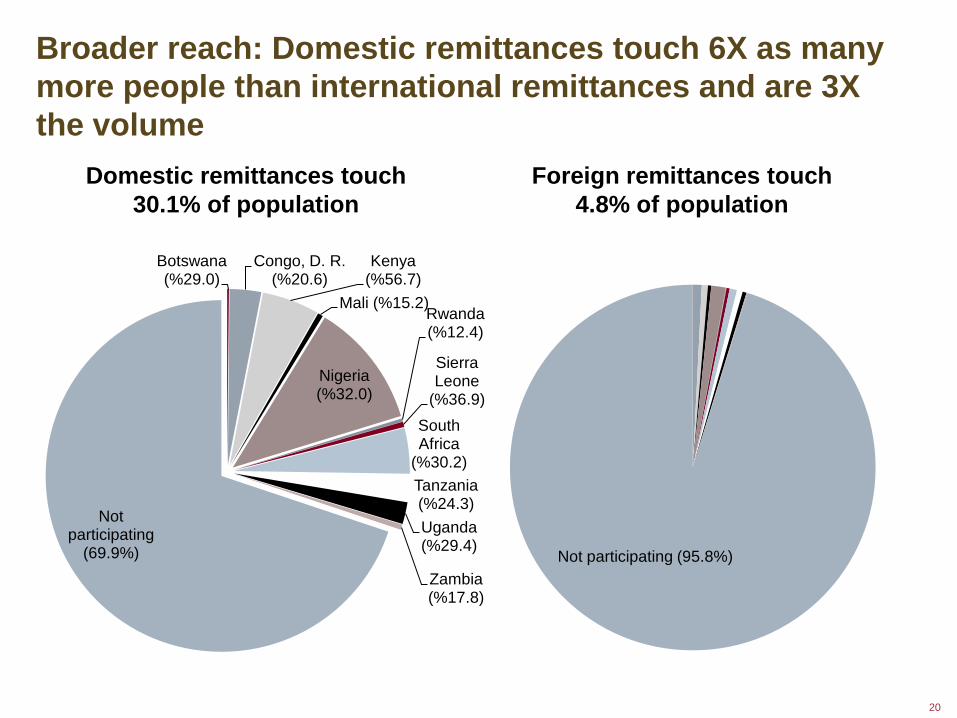
Broader reach
Botswana (%29.0)
Congo, D. R. (%20.6)
Kenya (%56.7)
Mali (%15.2)
Nigeria (%32.0)
Rwanda (%12.4)
Sierra Leone
(%36.9) South Africa
(%30.2) Tanzania (%24.3) Uganda (%29.4)
Zambia (%17.8)
Not participating
(69.9%) Not participating (95.8%)
Domestic remittances touch 30.1% of population
Foreign remittances touch 4.8% of population
Broader reach: Domestic remittances touch 6X as many more people than international remittances and are 3X the volume
21
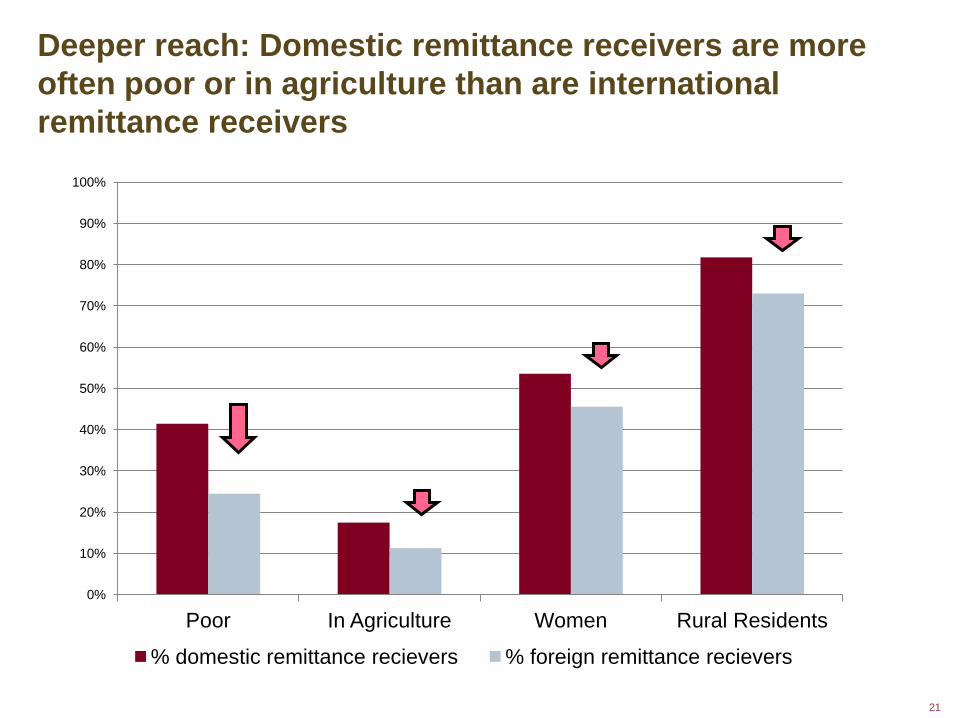
Deeper reach
0%
10%
20%
30%
40%
50%
60%
70%
80%
90%
100%
Poor In Agriculture Women Rural Residents
% domestic remittance recievers % foreign remittance recievers
Deeper reach: Domestic remittance receivers are more often poor or in agriculture than are international remittance receivers
22
Role of the public sector The public sector stands to benefit directly from widespread use of digital payment services – and can add critical volume to promote the sustainability and inclusiveness of the system
Cost savings: McKinsey study estimates government of India could save $18Bn per year by switching to electronic payments.
Less “leakage” and corruption:
Afghanistan switched payments to police from cash based payments to mobile money transfers and many thought they had been given a raise (less “leakage” to superiors).
Argentina switching to electronic safety net payments reduced number of clients who were asked for bribes to get money and 89% of clients said new system was easier and more efficient.
Targeting: In Niger, study authors argue mobile better at targeting to
women than cash, improving outcomes.
23
Mobile has greater penetration with the poor Mobile has greater penetration with the poor Banks are mostly the reserve of the rich, mobile has greater penetration with the poor
24
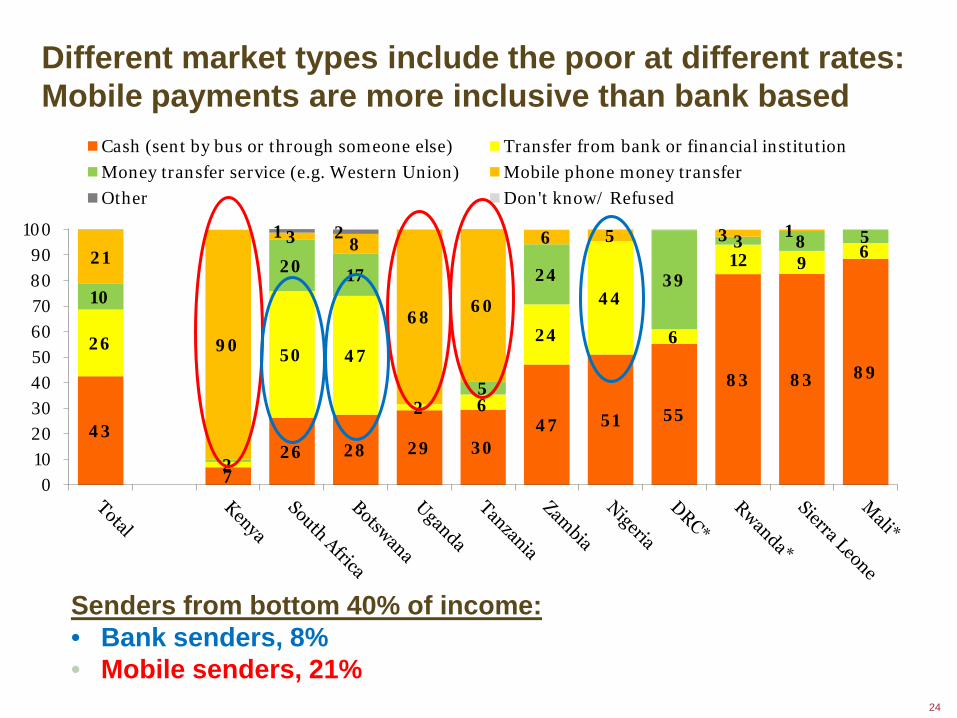
Data on different markets Channels Used To Send Money
How did you send this money?% by country
Total = population-weighted average* Less than 10% of respondents in these countries were asked this question
43
726 28 29 30
47 51 55
83 83 89
26
2
50 47
2 6
24
44
6
12 96
10
20 17
5
24 39
3 8 521
90
3 8
6860
6 5 3 11 2
0102030405060708090
100
Cash (sent by bus or through someone else) Transfer from bank or financial institution
Money transfer service (e.g. Western Union) Mobile phone money transfer
Other Don't know/ Refused
Senders from bottom 40% of income: • Bank senders, 8% • Mobile senders, 21%
Different market types include the poor at different rates: Mobile payments are more inclusive than bank based
25
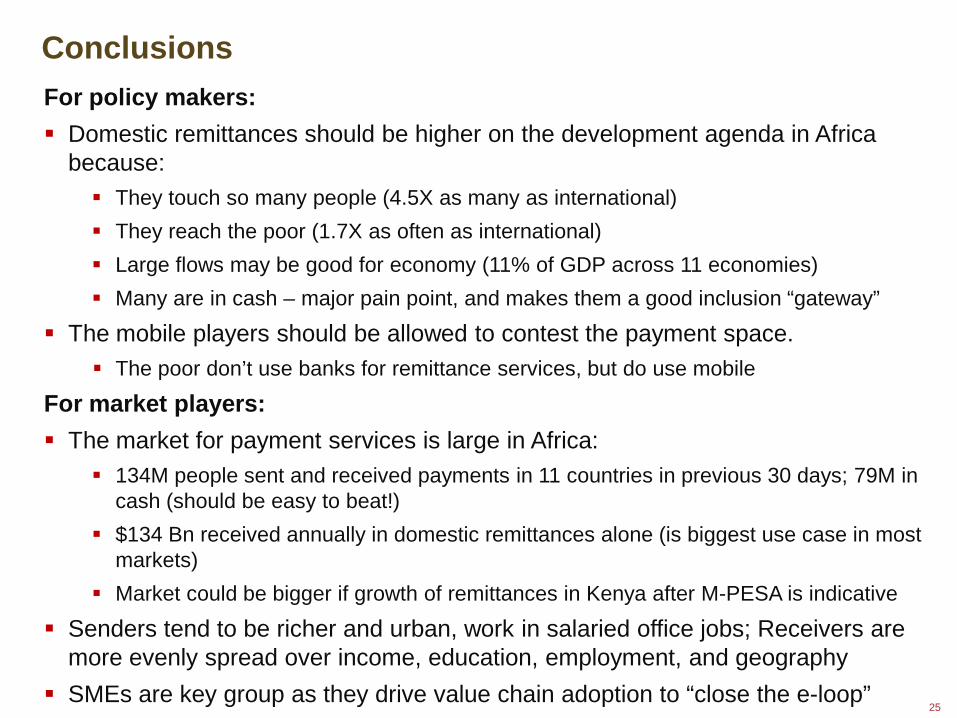
Conclusions For policy makers: Domestic remittances should be higher on the development agenda in Africa
because: They touch so many people (4.5X as many as international) They reach the poor (1.7X as often as international) Large flows may be good for economy (11% of GDP across 11 economies) Many are in cash – major pain point, and makes them a good inclusion “gateway”
The mobile players should be allowed to contest the payment space. The poor don’t use banks for remittance services, but do use mobile
For market players: The market for payment services is large in Africa:
134M people sent and received payments in 11 countries in previous 30 days; 79M in cash (should be easy to beat!)
$134 Bn received annually in domestic remittances alone (is biggest use case in most markets)
Market could be bigger if growth of remittances in Kenya after M-PESA is indicative
Senders tend to be richer and urban, work in salaried office jobs; Receivers are more evenly spread over income, education, employment, and geography
SMEs are key group as they drive value chain adoption to “close the e-loop”
Thank you for joining us!
After Hours Seminar
Microlinks and the After Hours Seminar series are products of Knowledge-Driven Microenterprise Development (KDMD) project, funded by USAID’s Microenterprise Development office.
Upcoming Events Share Feedback Stay In Touch
Please take our 3 minute survey: http://bit.ly/Iymxtu You can also visit the event page to post comments & questions.
Presenter Name: Jake Kendall Nandini Harihareswara Contact Us: [email protected] Subscribe today: microlinks.kdid.org/subscribe
May 16: Commitment Savings Find upcoming events & past presentations: microlinks.kdid.org/ afterhours
Thank you


![1.05 Mb [Download]](https://img.pdfslide.us/doc/110x75/587f2c131a28abb43f8bc435/105-mb-download.jpg)