Embed Size (px)
Citation preview
Click to edit Master title style
Click to edit Master subtitle style
2008 User Conference
Staying on Top of MetricsPresented by: George MolloGJM Associates, Inc.www.gjmassociates.com

Introduction
GJM Associates, Inc. is a consulting firm that focuses on all aspects of merchandising operations for direct marketing companies.
Our primary focus is supply-side processes, that start with merchandise analysis and planning, includes with merchandise analysis and planning, includes inventory management strategies and the critical coordination of merchandising, marketing, finance, creative and operations through all elements of the business to the ultimate and profitable fulfillment to a customer.

Introduction
• 12 years in Retail
• 3 in Wholesale
• 15 years in Catalog
• 2002-2007 Served as Chair of the DMA’s • 2002-2007 Served as Chair of the DMA’s Catalog & Multichannel Marketing Council
• Speak at conferences (User Groups, NCOF, ACCM, ECMOD)**
• Contributes articles for trade publications**
(**available on www.gjmassociates.com)

Agenda
Define & Identify Key Performance Index (KPI)
How Many? How Often?
Using High Level – MAPS Indices to Provide Direction
Agenda
Other Item Profit Factors
Detailed Item P&L
Taking Away the “Fear”
Defining KPI
Performance Indicators (KPI):
Separate the “winners” from the “try agains;” and knowing not only what to measure, but also how to measure it and what it all means, is what separates and defines levels of is what separates and defines levels of success.
You can’t fix what you don’t measure!!!
Defining KPI
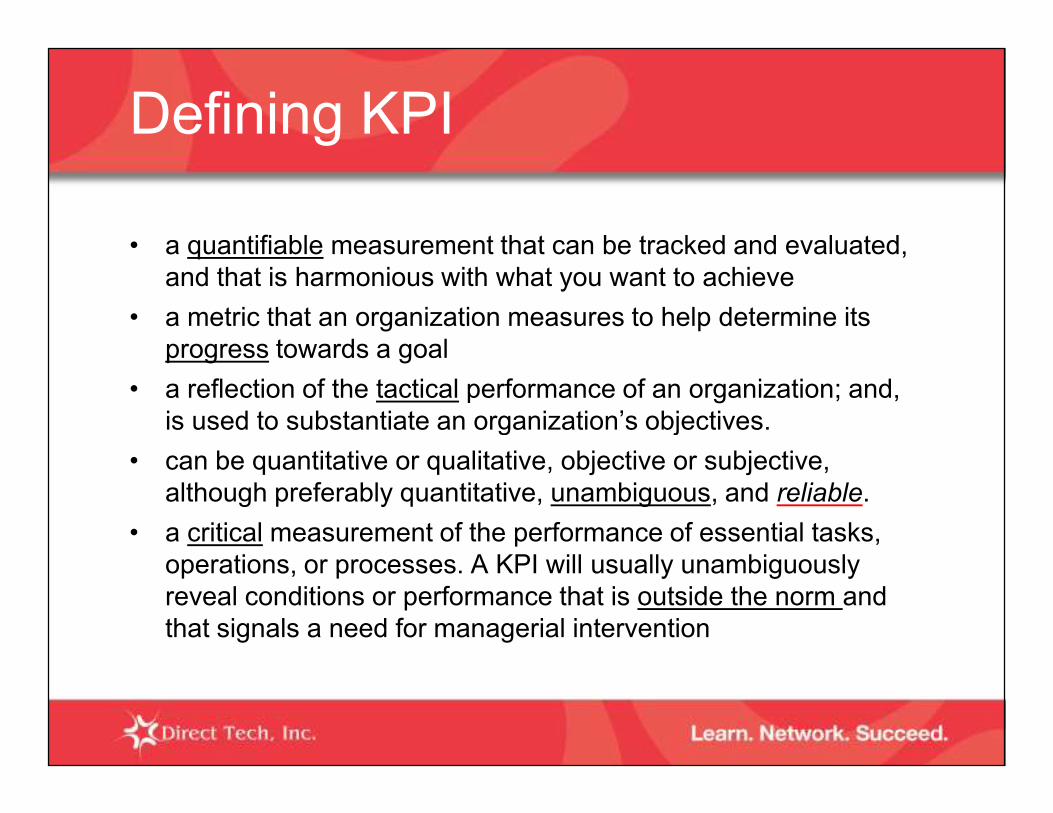
• a quantifiable measurement that can be tracked and evaluated, and that is harmonious with what you want to achieve
• a metric that an organization measures to help determine its progress towards a goal
• a reflection of the tactical performance of an organization; and, is used to substantiate an organization’s objectives. is used to substantiate an organization’s objectives.
• can be quantitative or qualitative, objective or subjective, although preferably quantitative, unambiguous, and reliable.
• a critical measurement of the performance of essential tasks, operations, or processes. A KPI will usually unambiguously reveal conditions or performance that is outside the norm and that signals a need for managerial intervention
How Many?
How Often?How Often?
When?

Identify KPIs
Corporate
• Revenue• Response
Operations
• Cost per Order
Merchandising
• Fill Rates• Cancel rates• Response
Rate• Average Order
• Expenses• Profit
Order• Cost per Call• Abandon Rate
• Carryover (DC)
• Cancel rates• Backorders• Margins• Inv. Turns

Clarifications
Fill Rates
• Initial / Final Fill
• Order vs. Item Fill
OverstockOverstock
• At Cost
• Cost of
Returns
• Total Returns
• Return to Good Stock
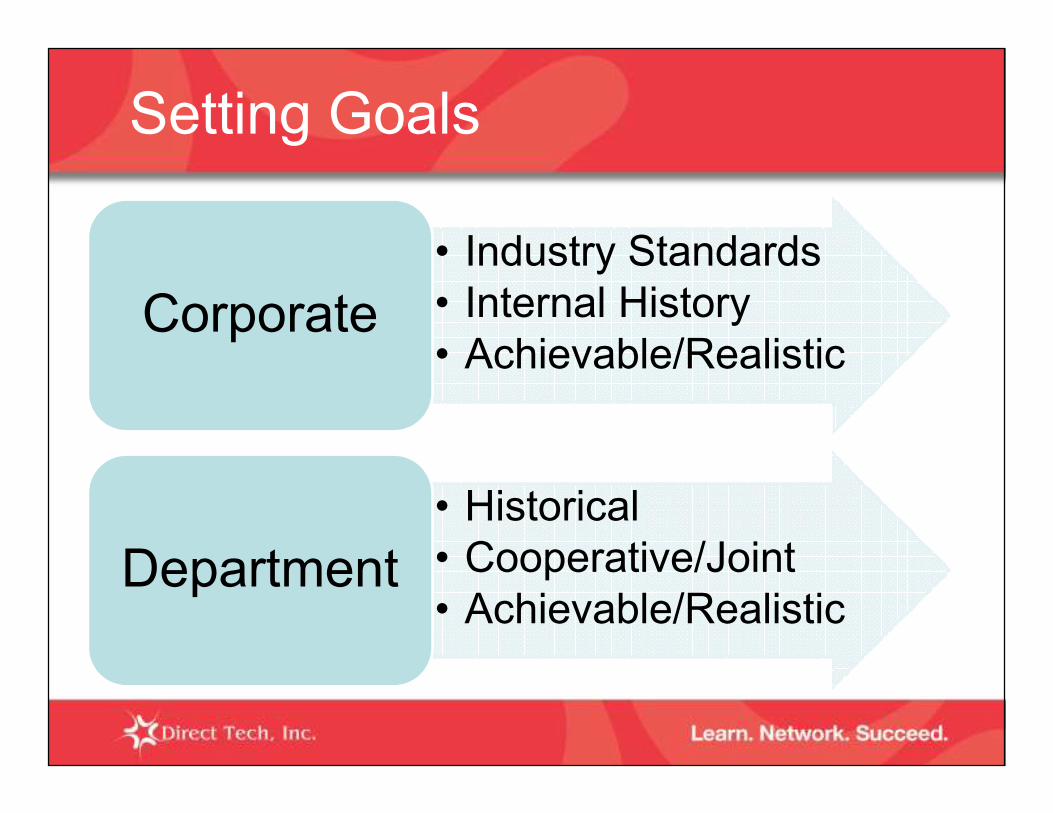
Setting Goals
• Industry Standards• Internal History• Achievable/Realistic
Corporate
• Historical• Cooperative/Joint• Achievable/Realistic
Department
Merchandising MAPS Metrics
Alternative Measurements
High Level Metrics
Creating New Metrics:
Provides “Direction”

Creating Indices
Offer a Simplified Approach
Create a Reference Base of 1.0 Create a Reference Base of 1.0
Provide Management a Top Level Review
Establishes “Relationship” Analysis

Additional MetricsStrategic Planning (Category) Level
Performance Index (rAii)
• (% of demand / % of items)
Space Index
• (% of demand / % of space)
Sell RatioSell Ratio
• (Item percent of page * cost per page) / Projected item $$ demand in Offer
Average Item Index (rAii)
• Item Demand / (Projected Item $$ Demand in Campaign/ Number of items)
Net (Ad) Margin
• Initial Margin % - Sell Ratio

Category (MAPS) View
rAii
Description Items % Dmd % Avg Itm P I Mrgn Space % S I SRNet Mgn
TOTAL DROP: 314 100.0% 5985.0 100.0% 19,061 1.00 57.9% 64.00 100.0% 1.00 43.1% 14.8%
GIFTS 87 27.7% 1310.7 21.9% 15,066 0.79 61.0% 15.00 23.4% 0.93 46.1% 14.9%
HOME 72 22.9% 1472.3 24.6% 20,449 1.07 54.6% 17.00 26.6% 0.93 46.5% 8.1%
APPAREL 53 16.9% 1897.2 31.7% 35,797 1.88 59.8% 15.00 23.4% 1.35 31.8% 28.0%
ACCESSORIES 102 32.5% 1304.7 21.8% 12,791 0.67 55.4% 17.00 26.6% 0.82 52.5% 2.9%

Additional Measures
Average Price Offered vs. Sold
Density
Detailed Space (Sqinch) Analysis
Returns
Overstock

Item ProfitabilityREVIEWING ITEM P&L
Item Profitability
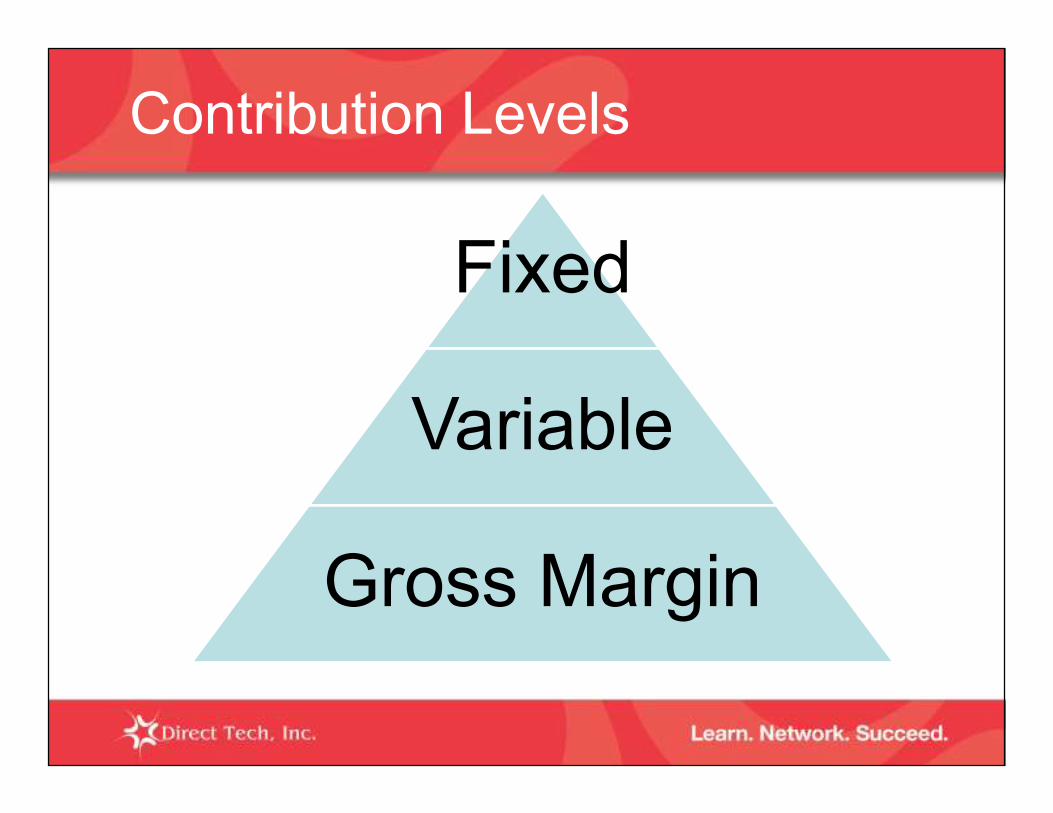
Contribution Levels
Fixed
VariableVariable
Gross Margin

Item Profitability ModelItem Summary
Item # ABC123
Description Sample Item
Cost 11.63
Inbound freight 3.0% 11.98
Retail 30.00
Unit Estimate 15000
Extended Cost 179.7 (k)
Extended Retail 450.0 (k)
Cost % 39.9%
Mark-Up % 60.1%
% of tot dmd $ -you might expect to cxl 9.0% 40.5
Total Returns as % of ships/ $(k) 11.8% 48.3
Net Sales ($k) 361.2

Item Profitability ModelCOGS
Cost of Goods Sold
standard cost 144.2
overstock (inv not sold) 10.0% 36.1 -
Cost of overstock 3.0% 1.1Cost of overstock 3.0% 1.1
returns 3.0% 1.4
other 0% 0.0
Gross Margin ($k) 214.4
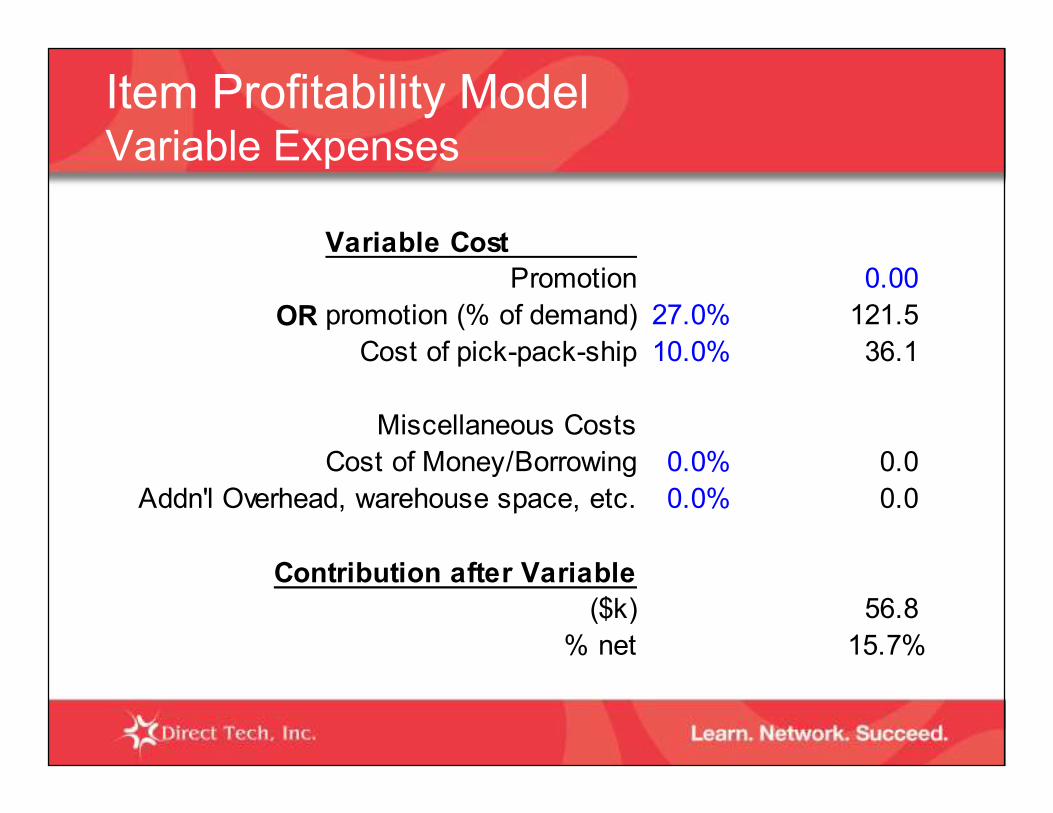
Item Profitability ModelVariable Expenses
Variable Cost
Promotion 0.00
OR promotion (% of demand) 27.0% 121.5
Cost of pick-pack-ship 10.0% 36.1
Miscellaneous Costs
Cost of Money/Borrowing 0.0% 0.0
Addn'l Overhead, warehouse space, etc. 0.0% 0.0
Contribution after Variable
($k) 56.8
% net 15.7%

Variable Cost Promotion 0.00
OR promotion (% of demand) 27.0% 121.5 Cost of pick-pack-ship 10.0% 36.1
Miscellaneous CostsCost of Money/Borrowing 0.0% 0.0
Addn'l Overhead, warehouse space, etc. 0.0% 0.0
Item Profitability ModelFixed Expenses
Addn'l Overhead, warehouse space, etc. 0.0% 0.0
Contribution after Variable($k) 56.8
% net 15.7%
Contribution after Fixed
Fixed Exp 10.0% 36.1
Profit 20.7
% net 5.7%

Keep it Simple
• “Almost Right now..is better than Exactly right later…”
Select a few KPIs to start
• Continue to “raise the bar” for profitability
Conclusions
• Continue to “raise the bar” for profitability
Set realistic goals
Educate and gain consensus
Make these metrics “second nature”

Roundtable Discussion
GroupDiscussion
Metrics you are using
Gaining consensus

Questions ?
THANK YOU !!
Questions ?

Click to edit Master title style
Click to edit Master subtitle style
2008 User Conference
Staying on Top of MetricsPresented by: George MolloGJM Associates, Inc.www.gjmassociates.com

![シマノ用 [1030 & 1030] サイズhedgehog-studio.sub.jp/ebay/tomo20150928_001.pdfシマノ用 [1030 & 730] サイズ Bearing size : 1030 (内径 3mm x 外径10mm x 厚さ4mm) &](https://img.pdfslide.us/doc/110x75/6045cd9b033164529741104c/ffc-1030-1030-hedgehog-ffc-1030-730.jpg)