Embed Size (px)
Citation preview
Molekulární biologie(KBC/MBIOG)
Ivo Frébort
Alberts et al. (2008) Molecular Biology of the Cell, 5th ed.Garland Science, New York
12. Methods of molecular biology II:Visualizing cells
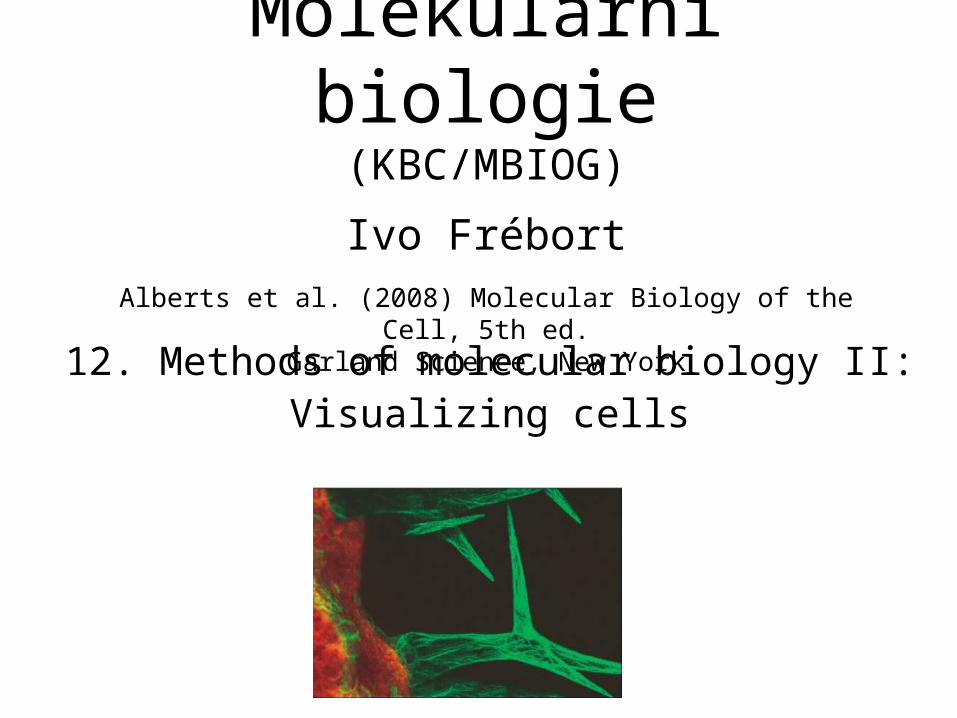
A sense of scale
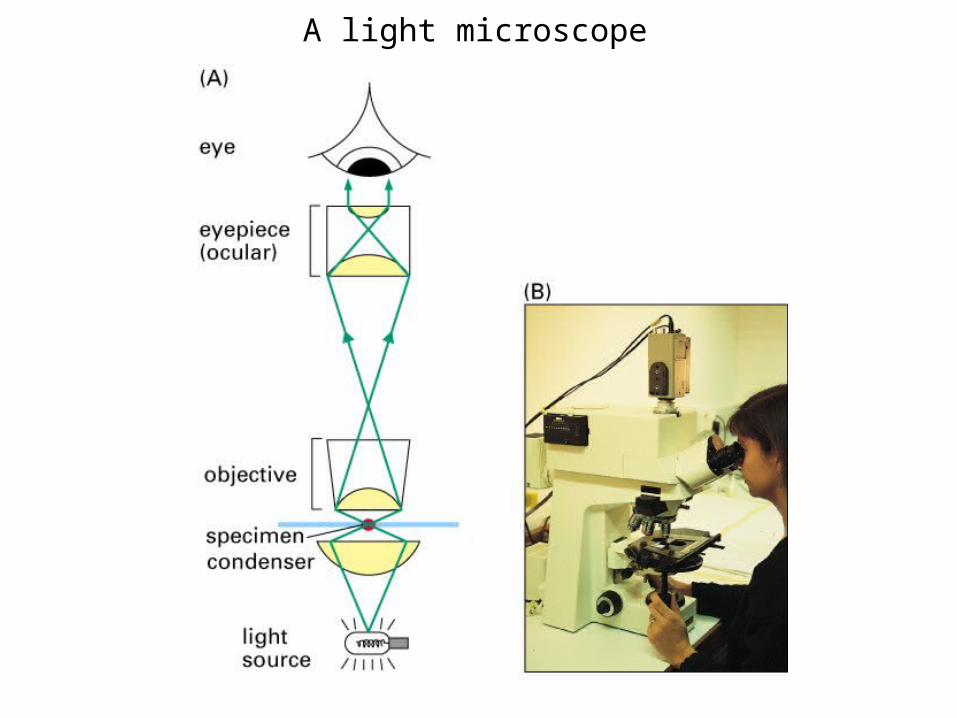
A light microscope
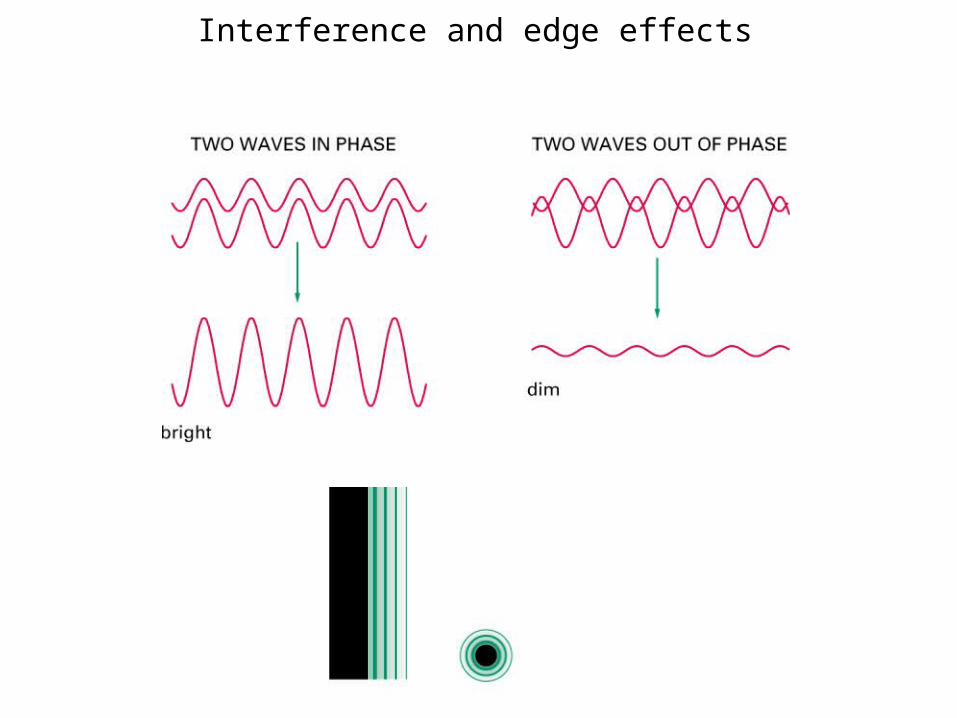
Interference and edge effects
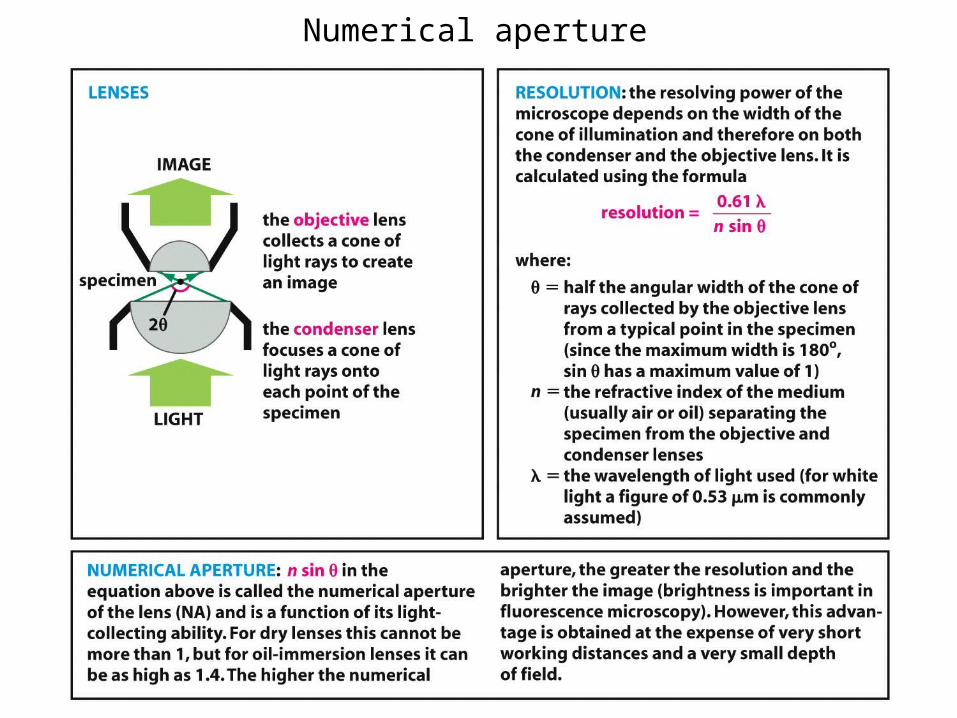
Numerical aperture
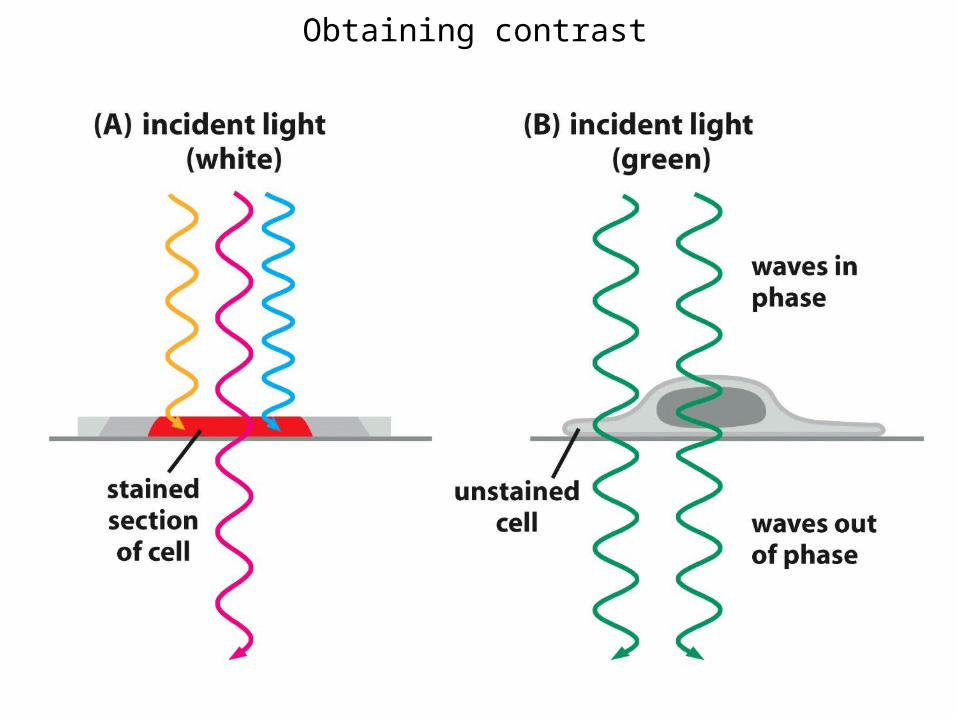
Obtaining contrast
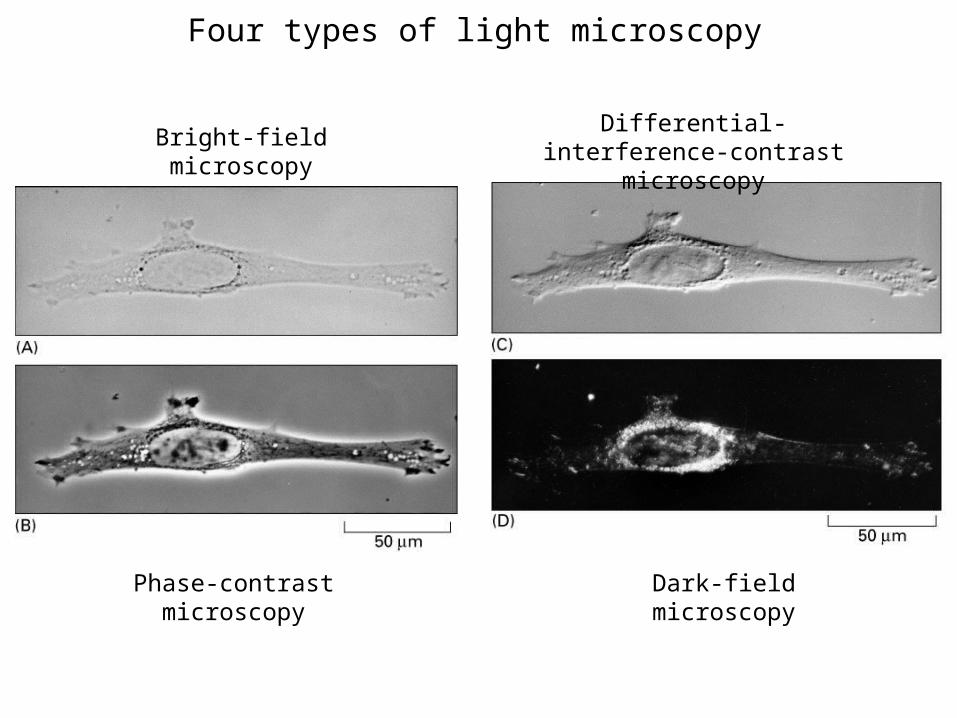
Four types of light microscopy
Bright-field microscopy
Phase-contrast microscopy
Differential-interference-contrast microscopy
Dark-field microscopy
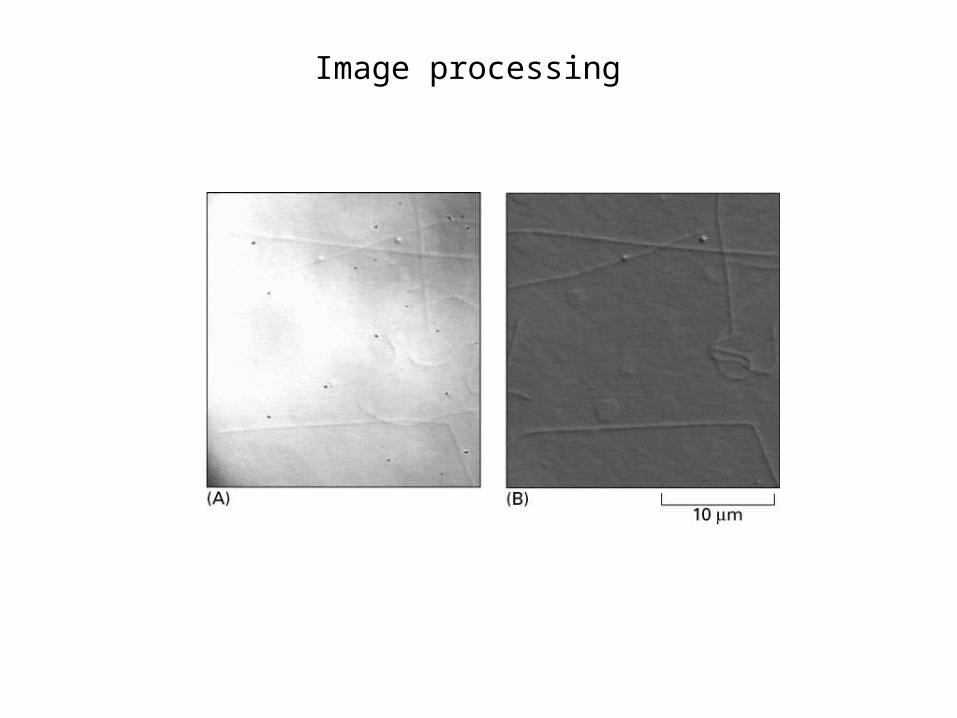
Image processing
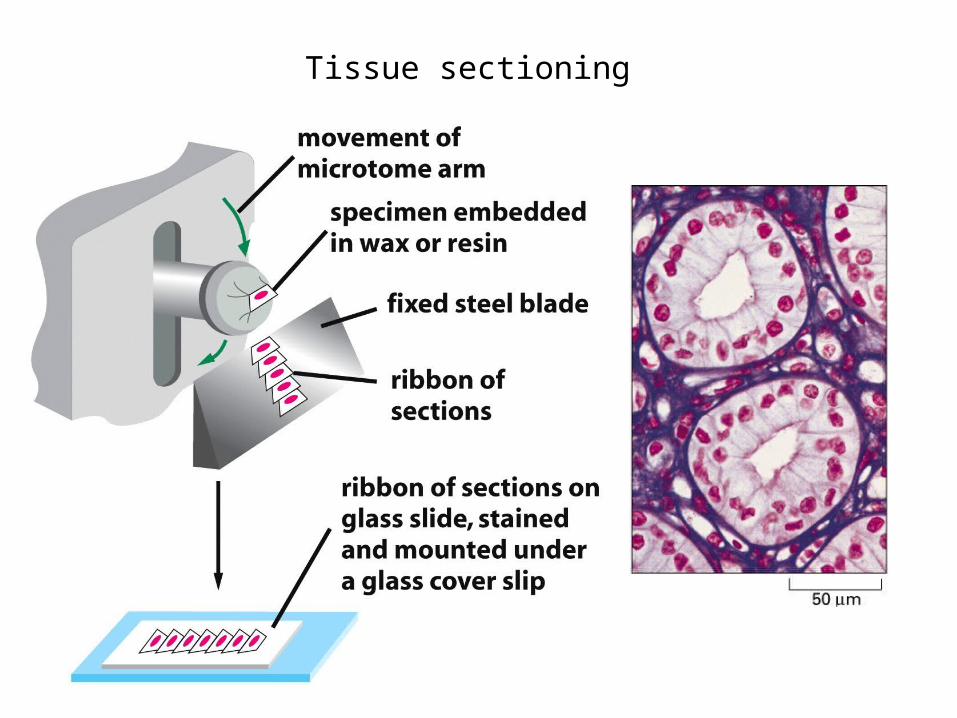
Tissue sectioning
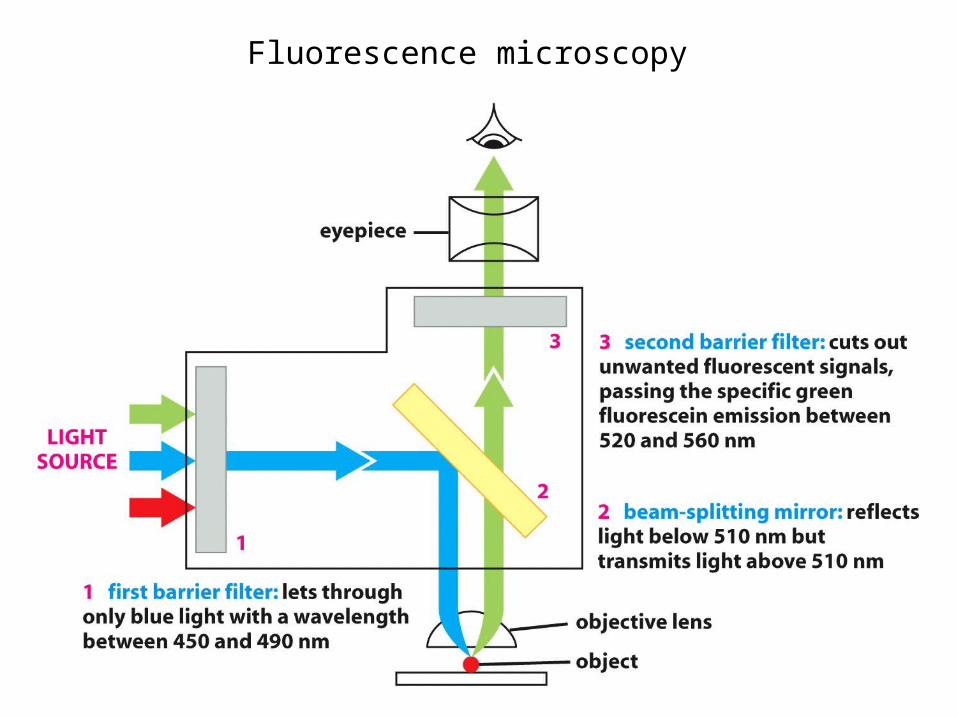
Fluorescence microscopy
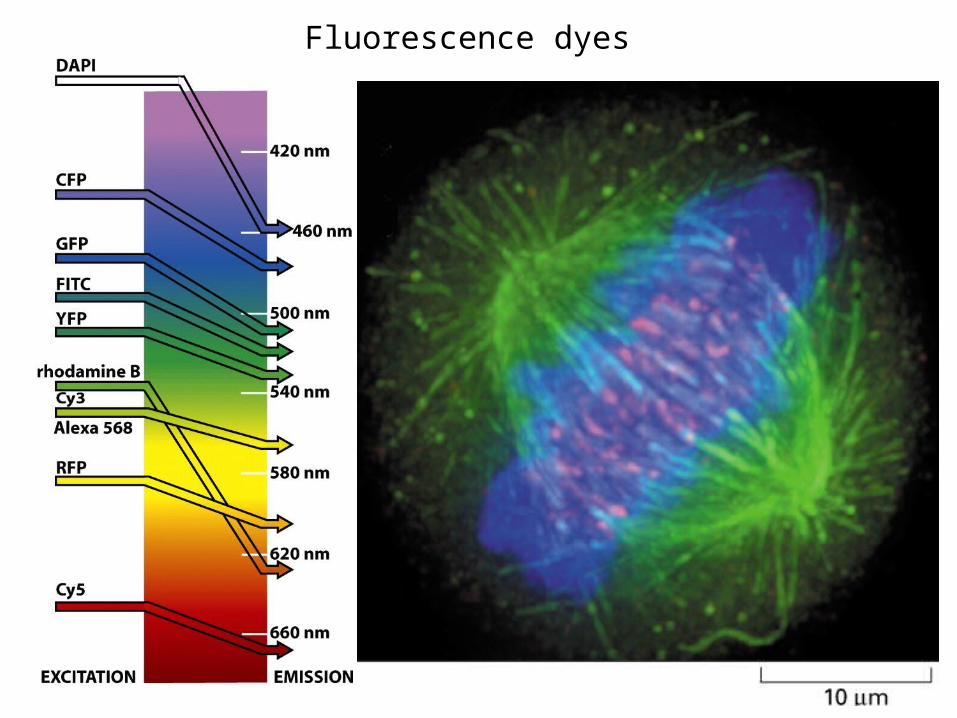
Fluorescence dyes
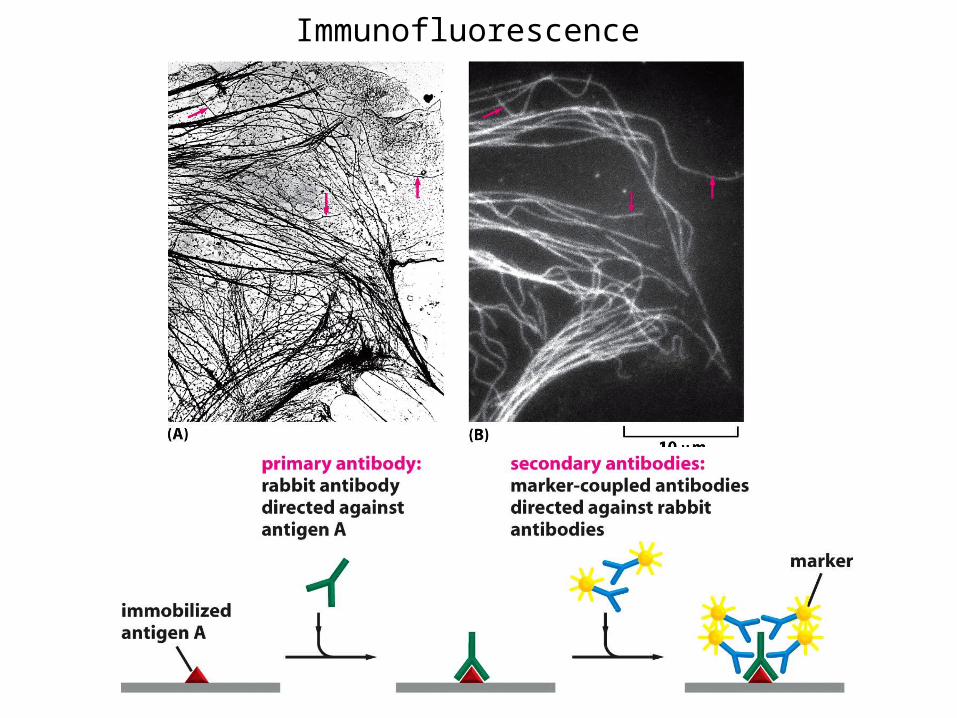
Immunofluorescence
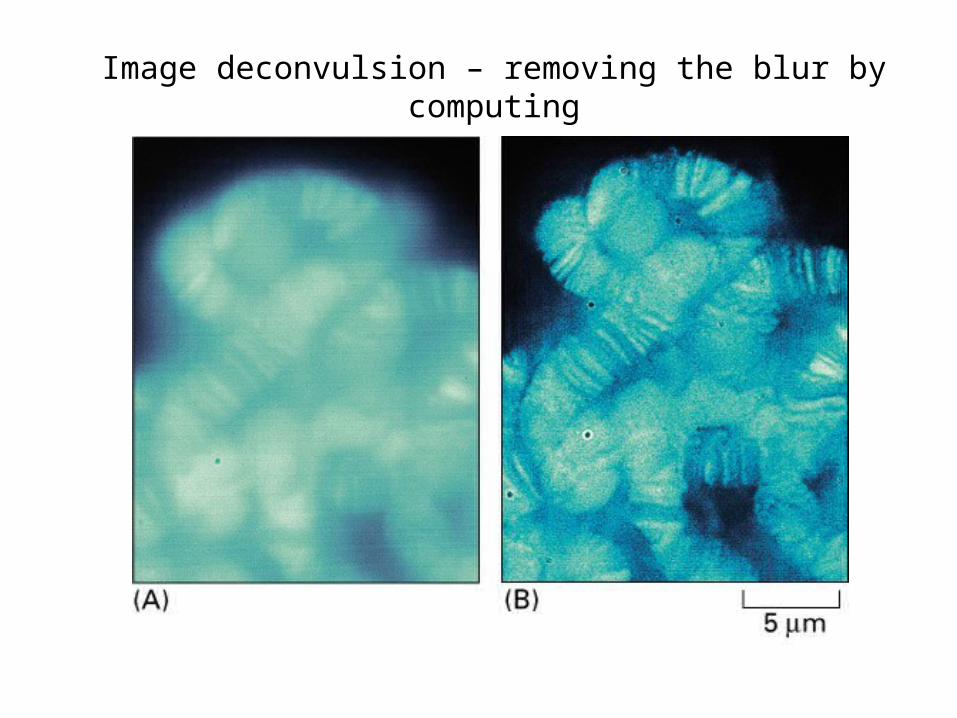
Image deconvulsion – removing the blur by computing
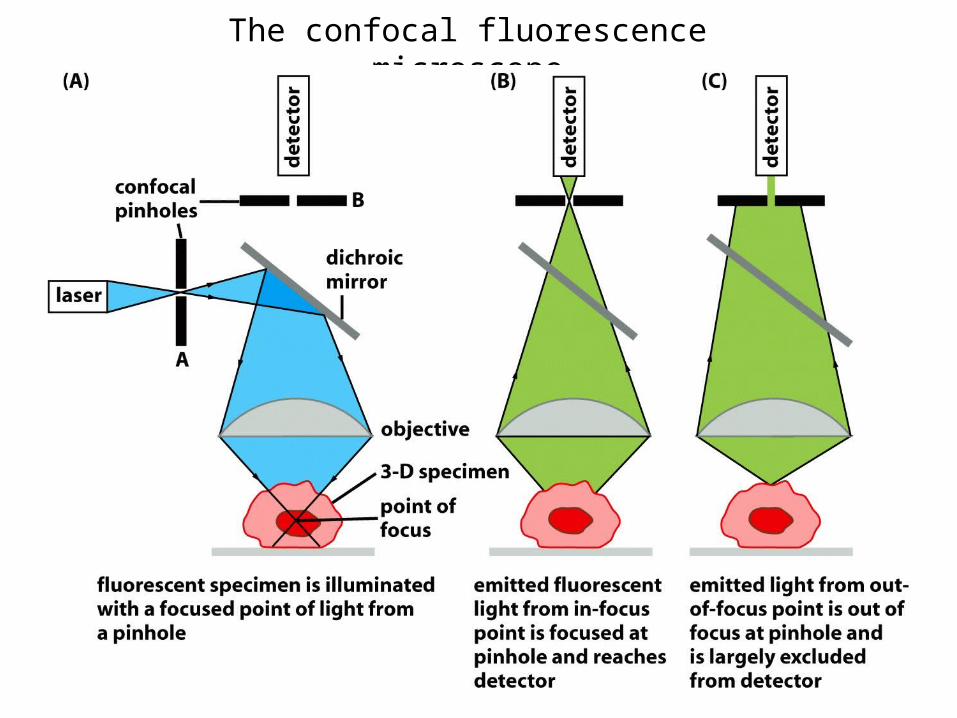
The confocal fluorescence microscope
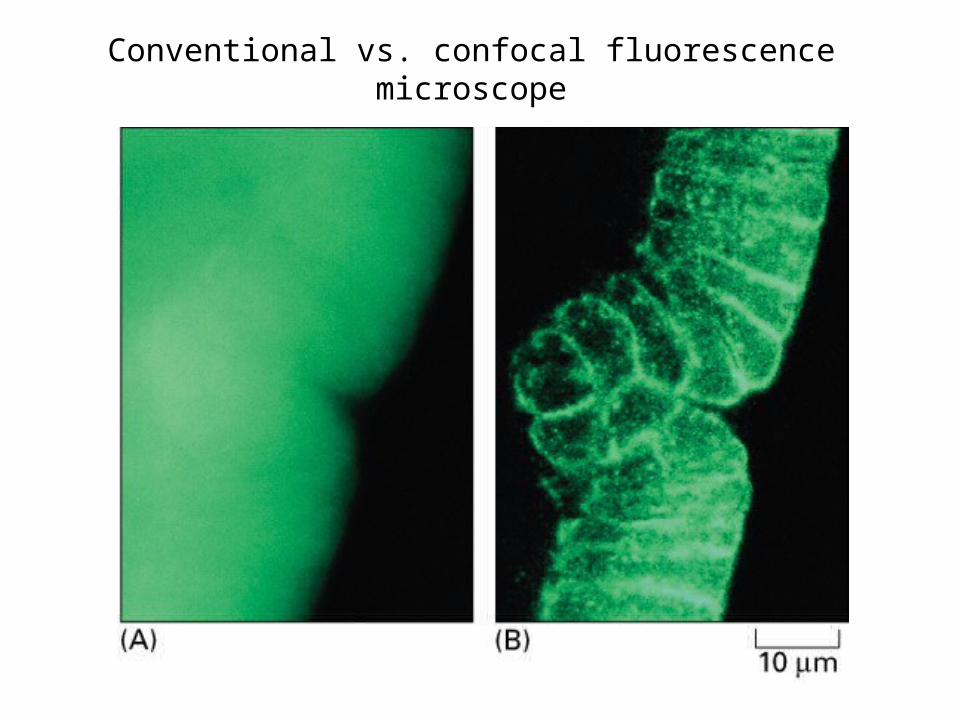
Conventional vs. confocal fluorescence microscope
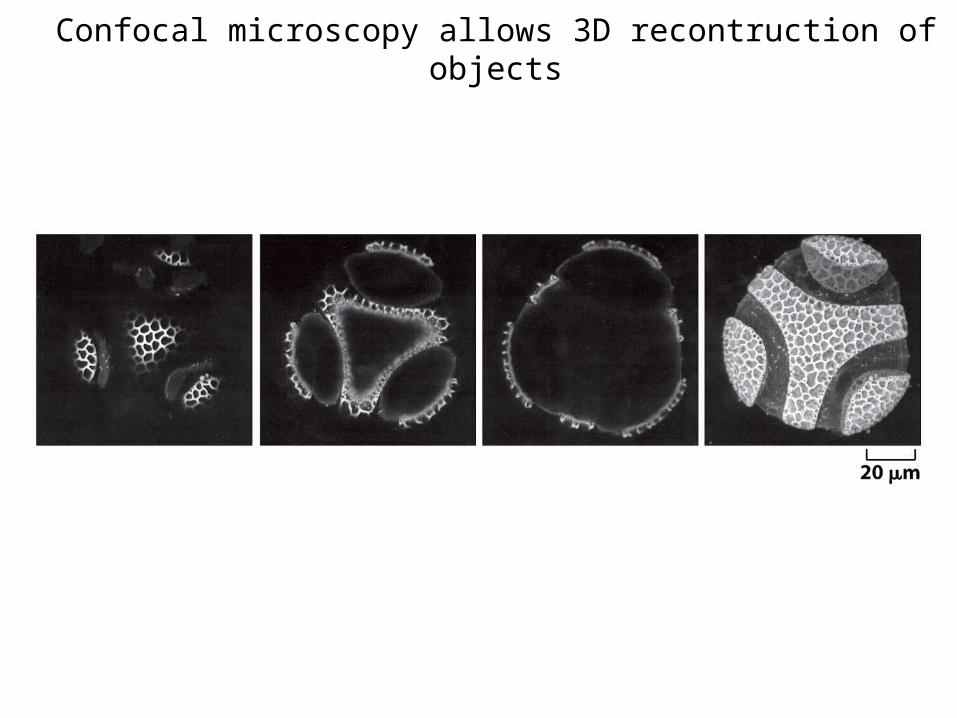
Confocal microscopy allows 3D recontruction of objects
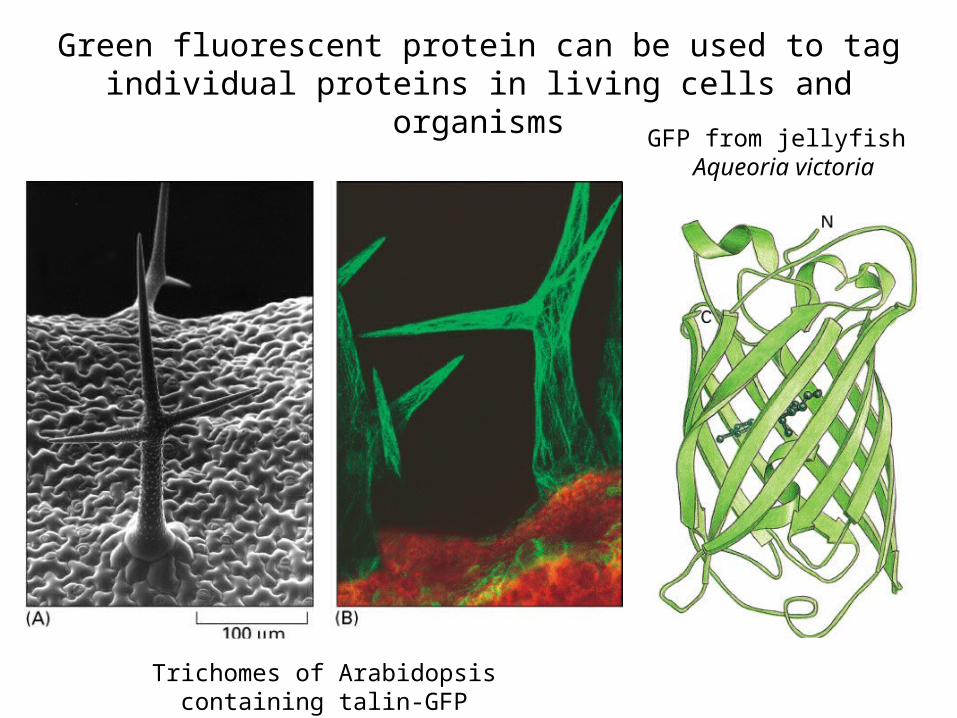
Trichomes of Arabidopsis containing talin-GFP
Green fluorescent protein can be used to tag individual proteins in living cells and organisms
GFP from jellyfish Aqueoria victoria
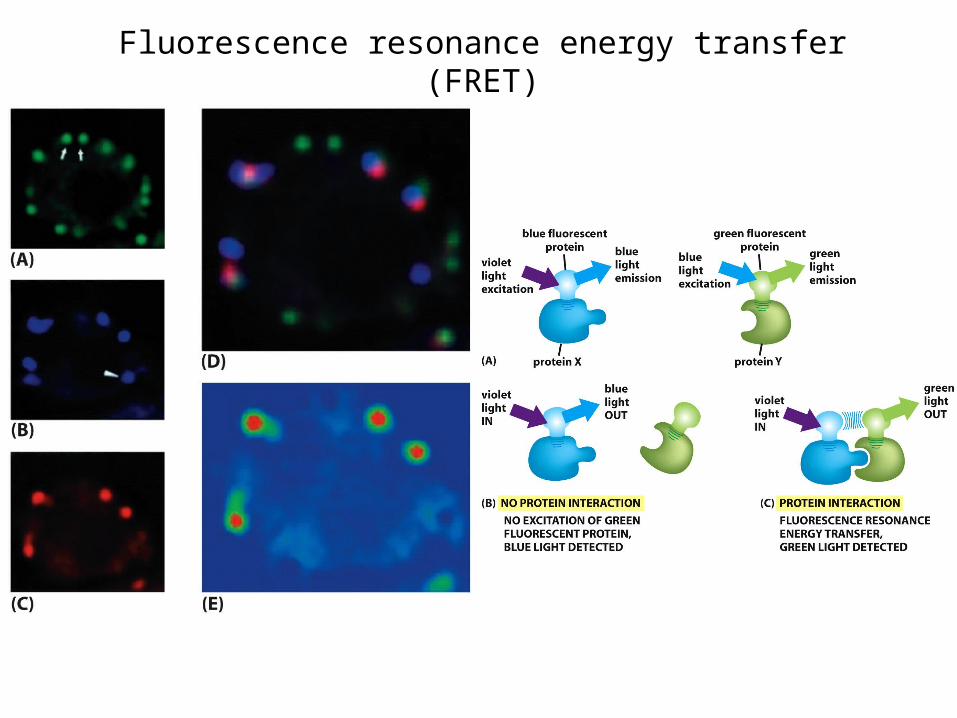
Fluorescence resonance energy transfer (FRET)
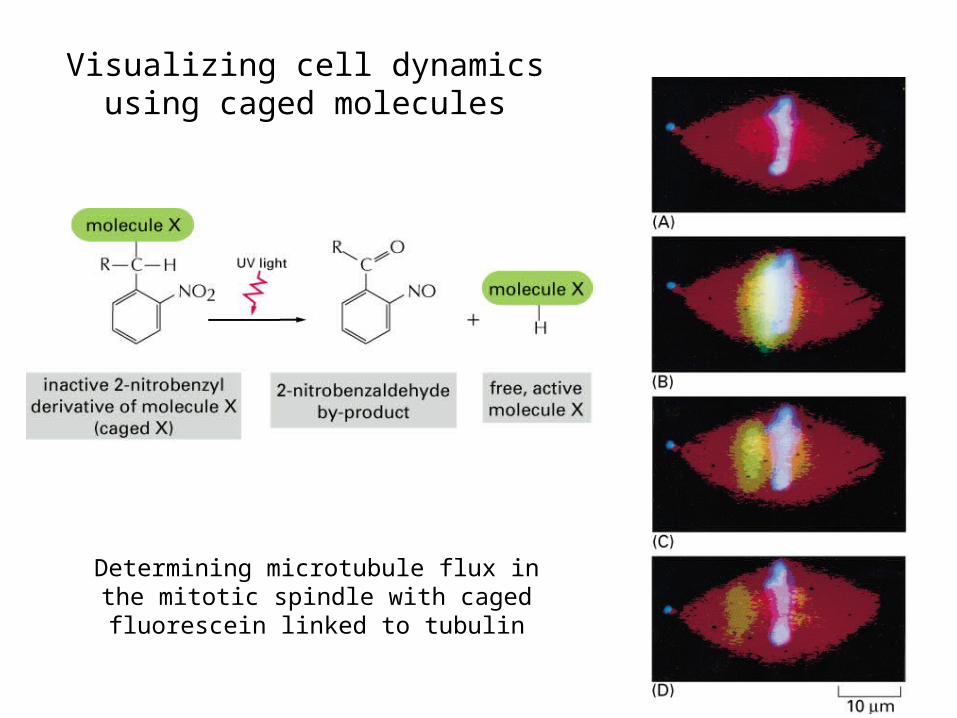
Visualizing cell dynamics using caged molecules
Determining microtubule flux in the mitotic spindle with caged fluorescein linked to tubulin
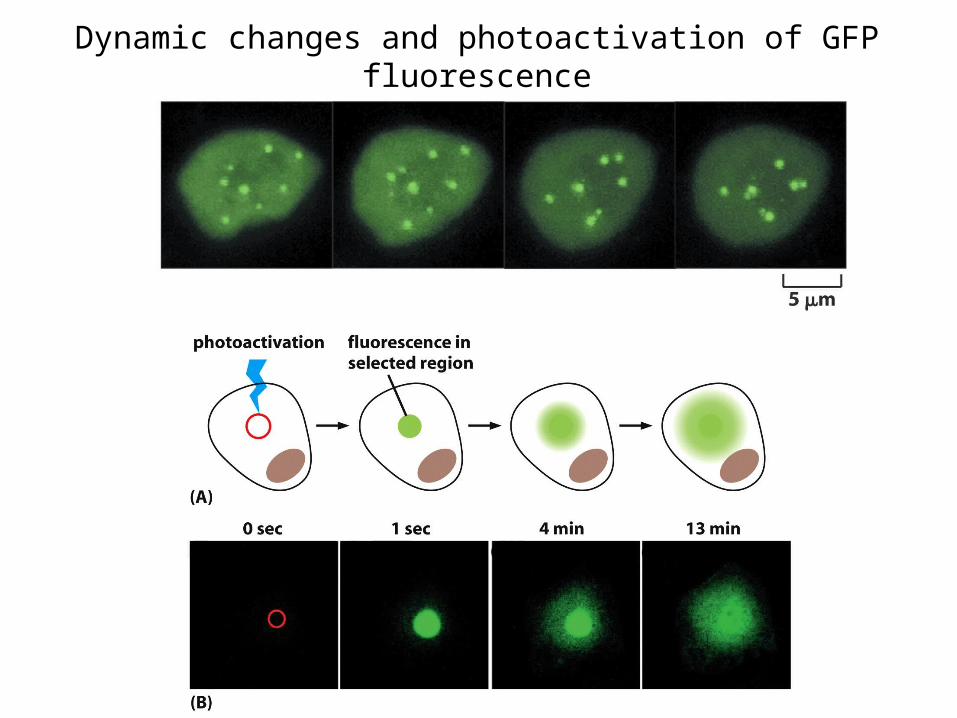
Dynamic changes and photoactivation of GFP fluorescence
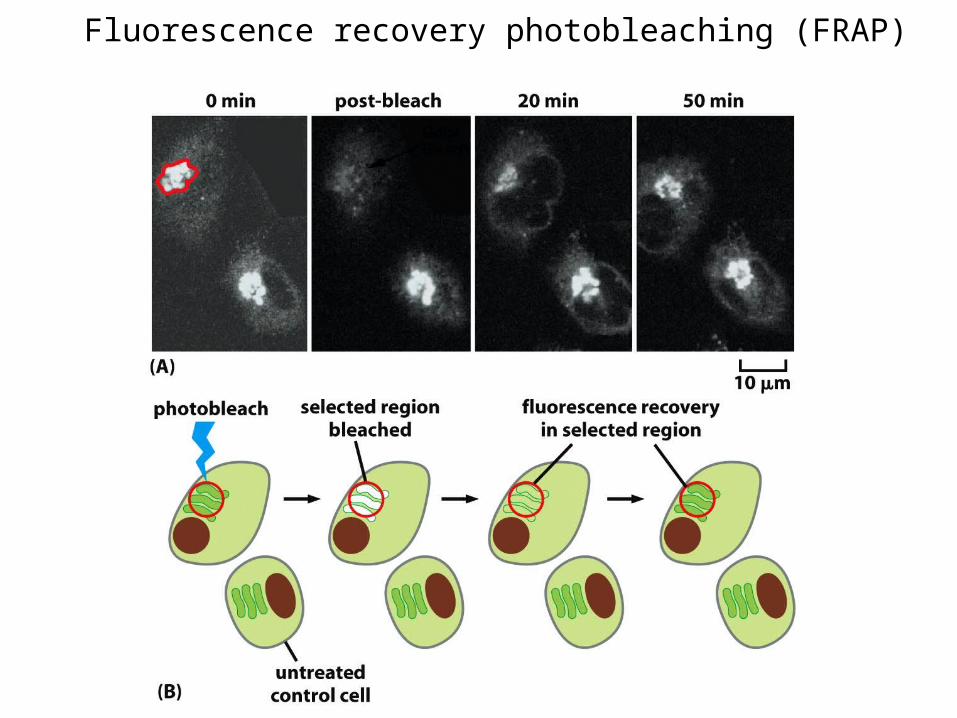
Fluorescence recovery photobleaching (FRAP)
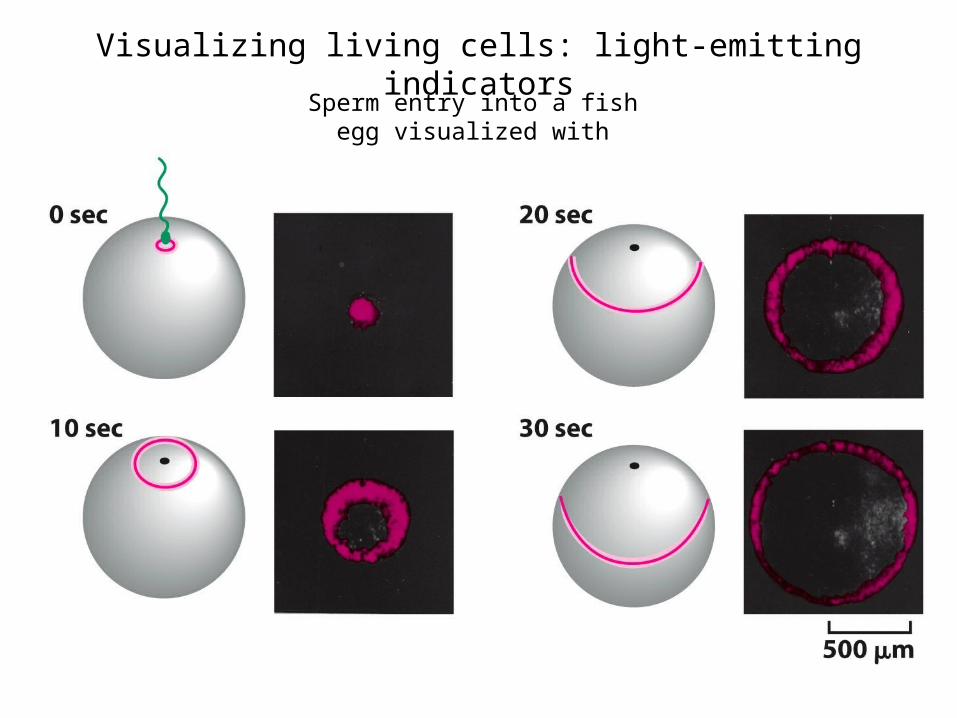
Visualizing living cells: light-emitting indicators
Sperm entry into a fish egg visualized with aequorin/Ca2+
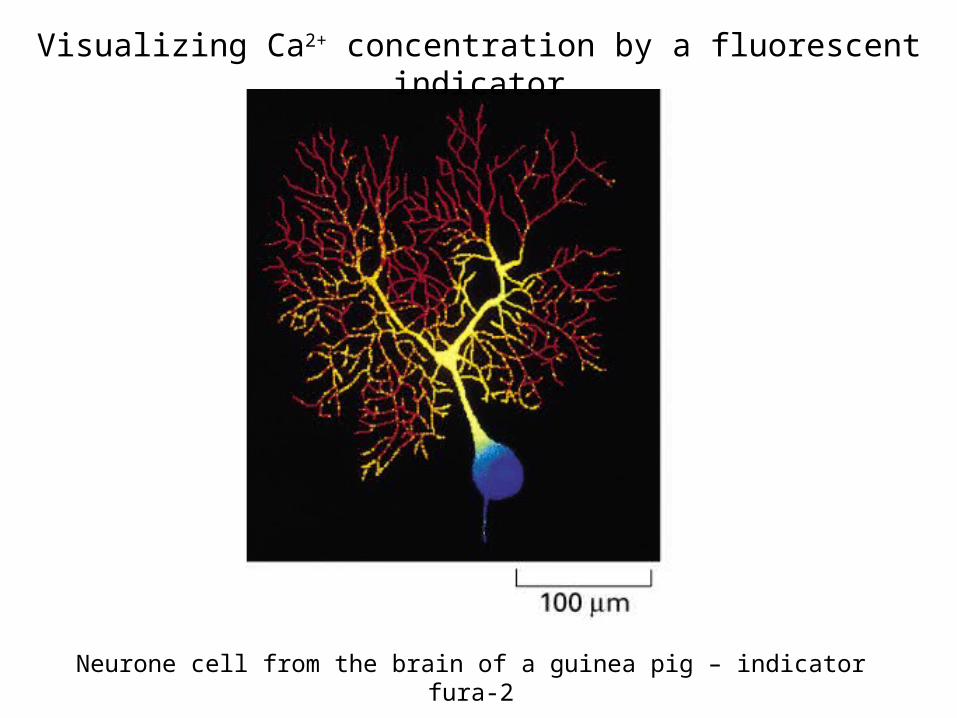
Neurone cell from the brain of a guinea pig – indicator fura-2
Visualizing Ca2+ concentration by a fluorescent indicator
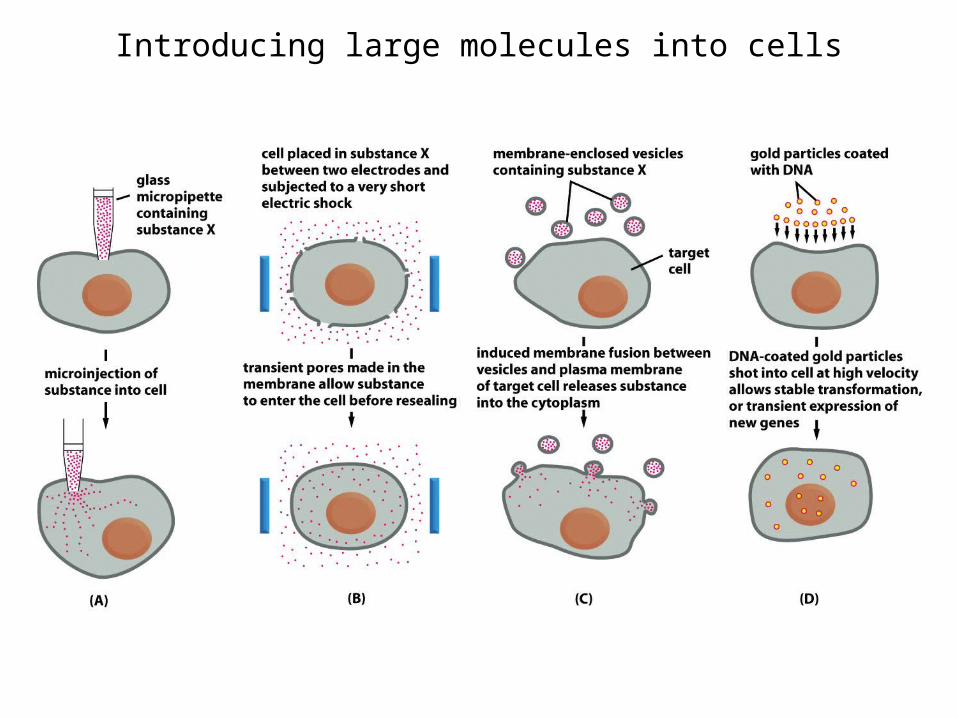
Introducing large molecules into cells
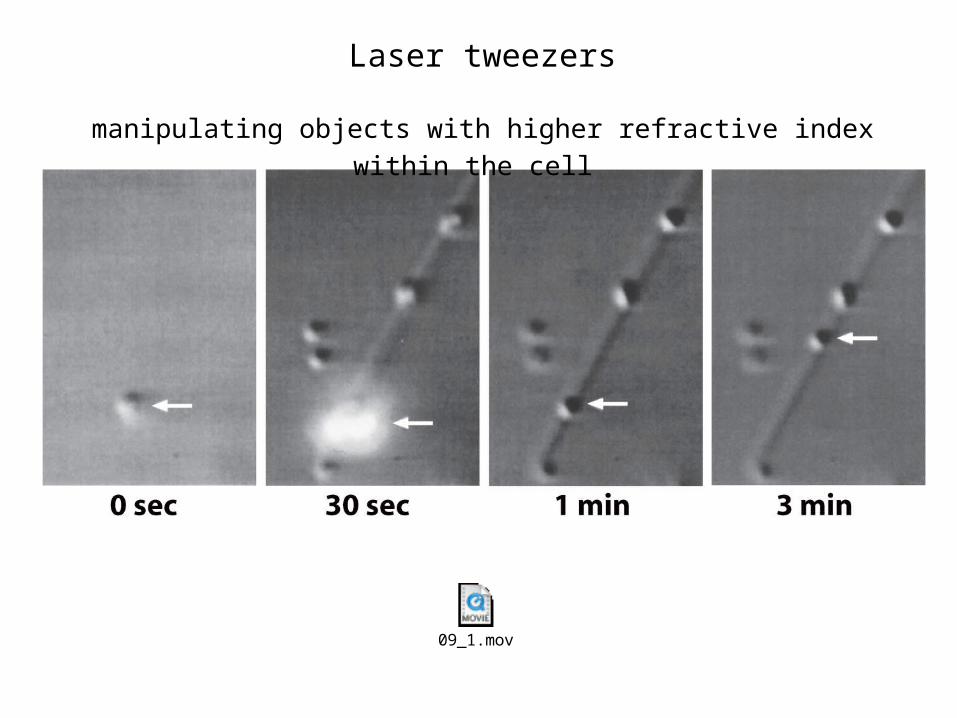
Laser tweezers
manipulating objects with higher refractive index within the cell
09_1.mov
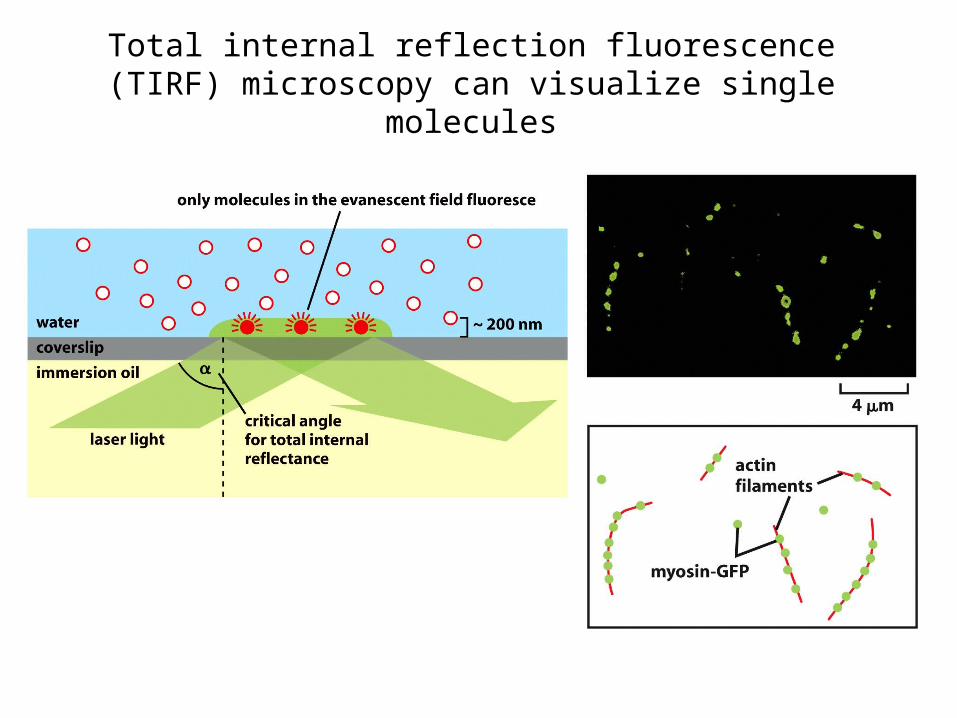
Total internal reflection fluorescence (TIRF) microscopy can visualize single molecules
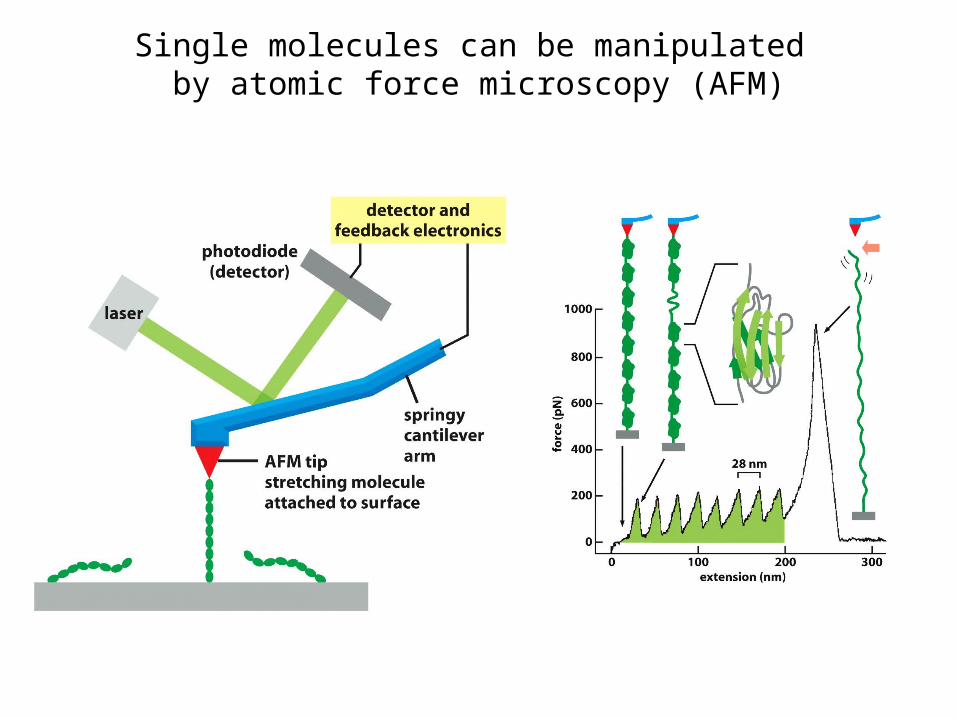
Single molecules can be manipulated by atomic force microscopy (AFM)
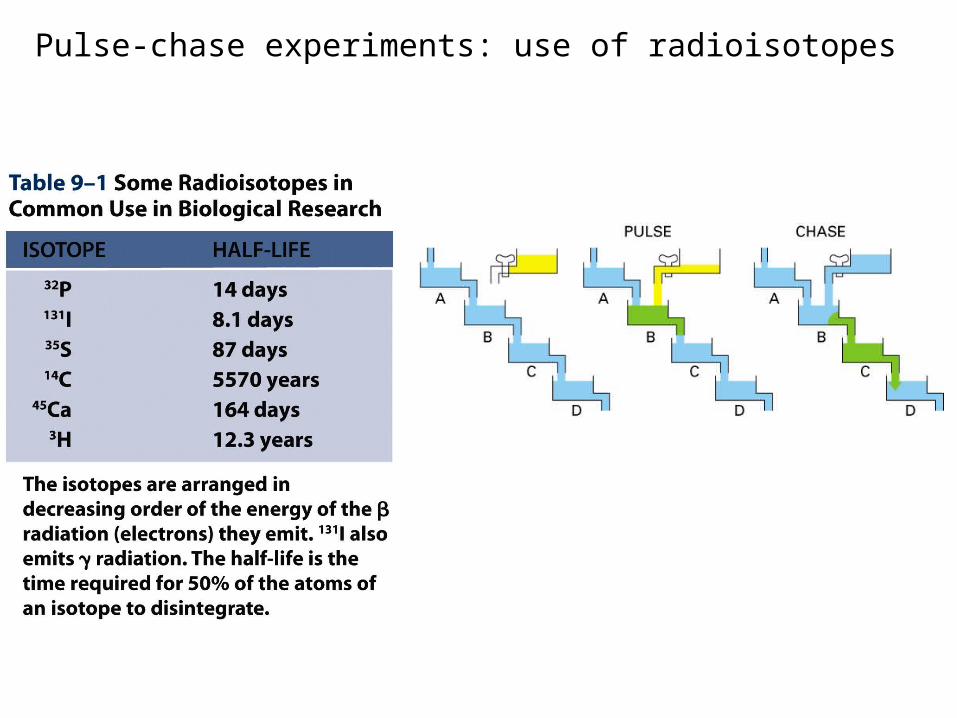
Pulse-chase experiments: use of radioisotopes
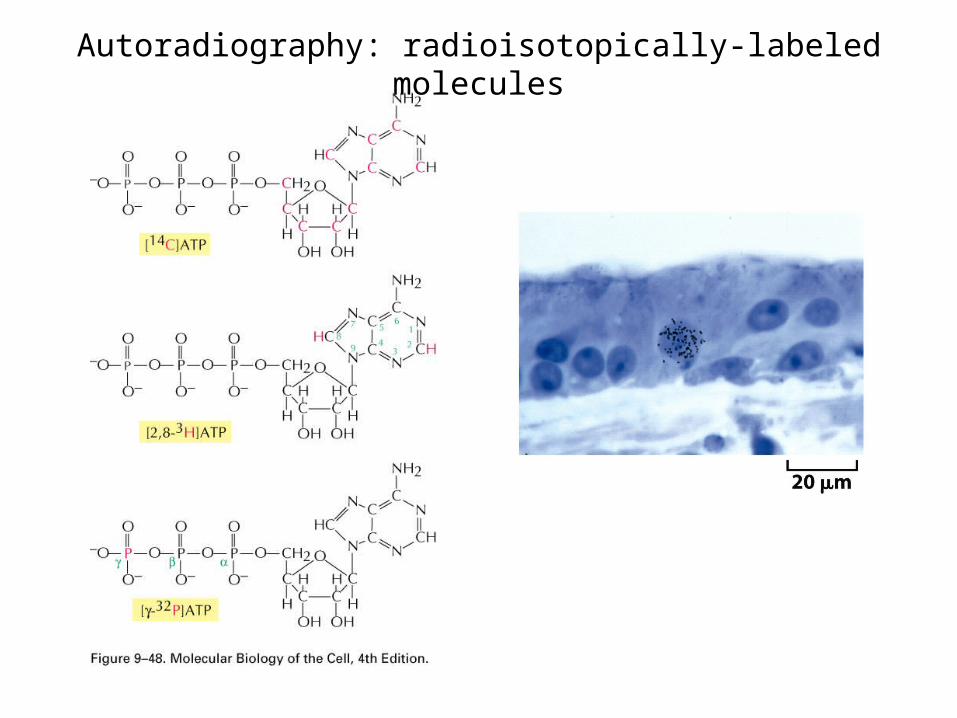
Autoradiography: radioisotopically-labeled molecules
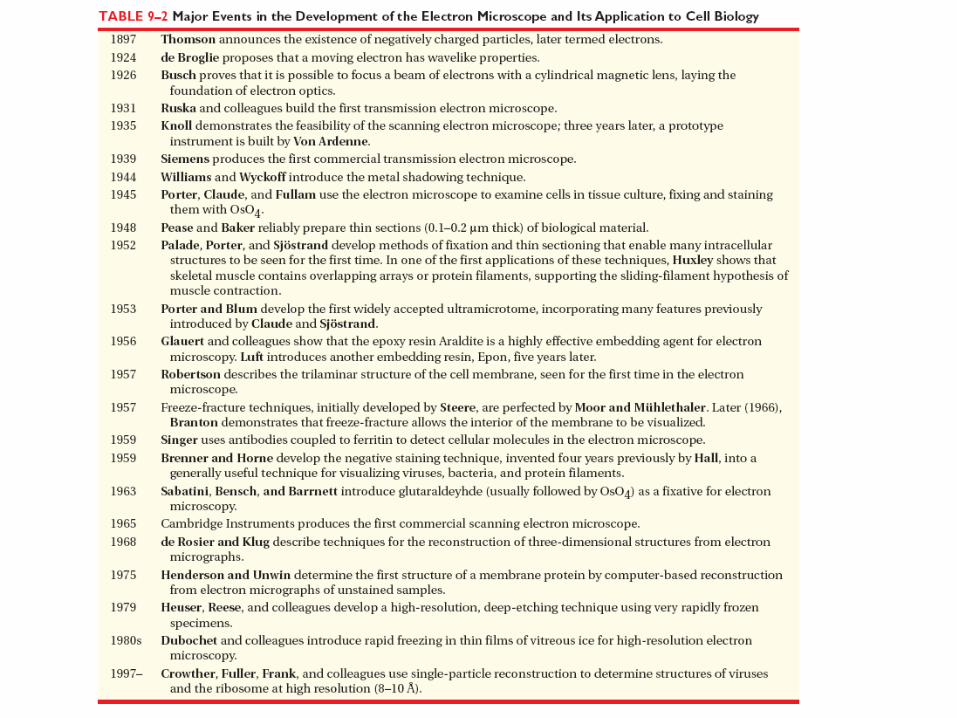
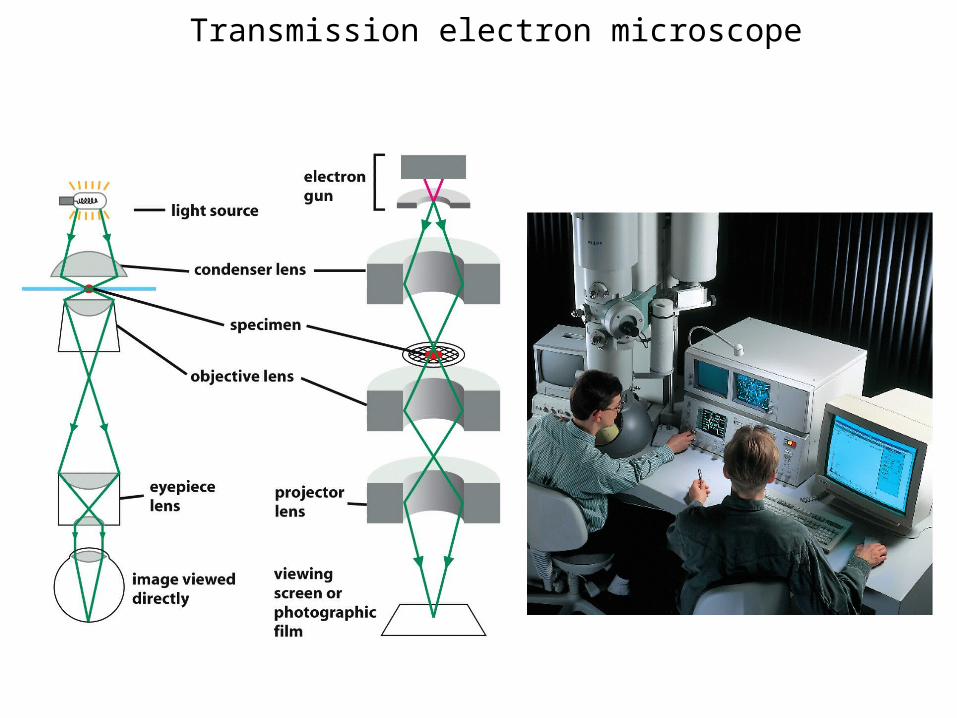
Transmission electron microscope
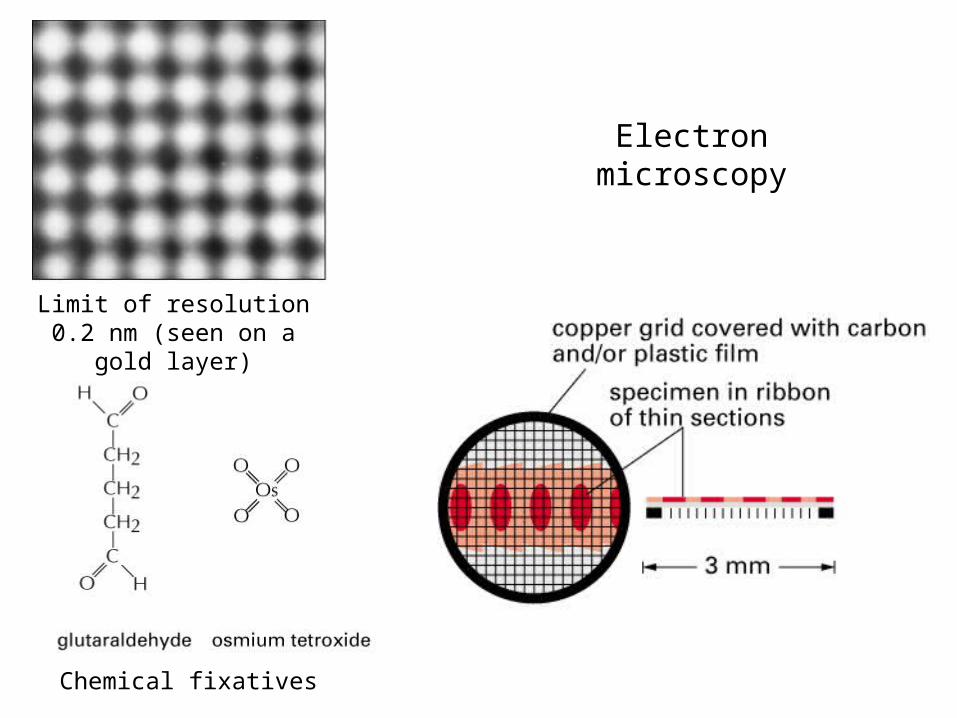
Electron microscopy
Limit of resolution 0.2 nm (seen on a gold layer)
Chemical fixatives
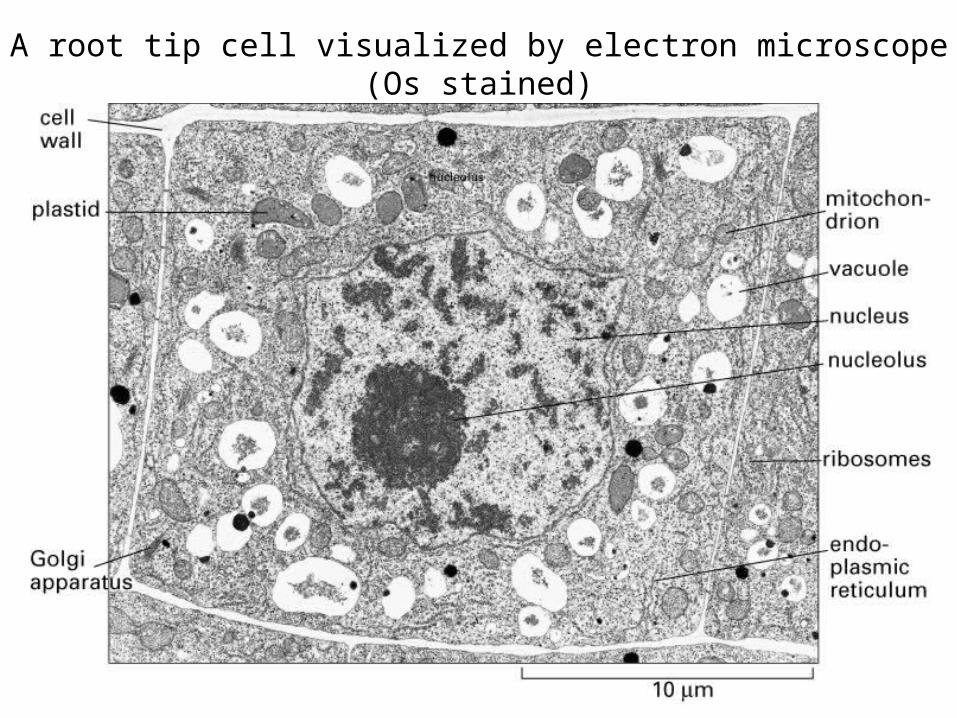
A root tip cell visualized by electron microscope (Os stained)
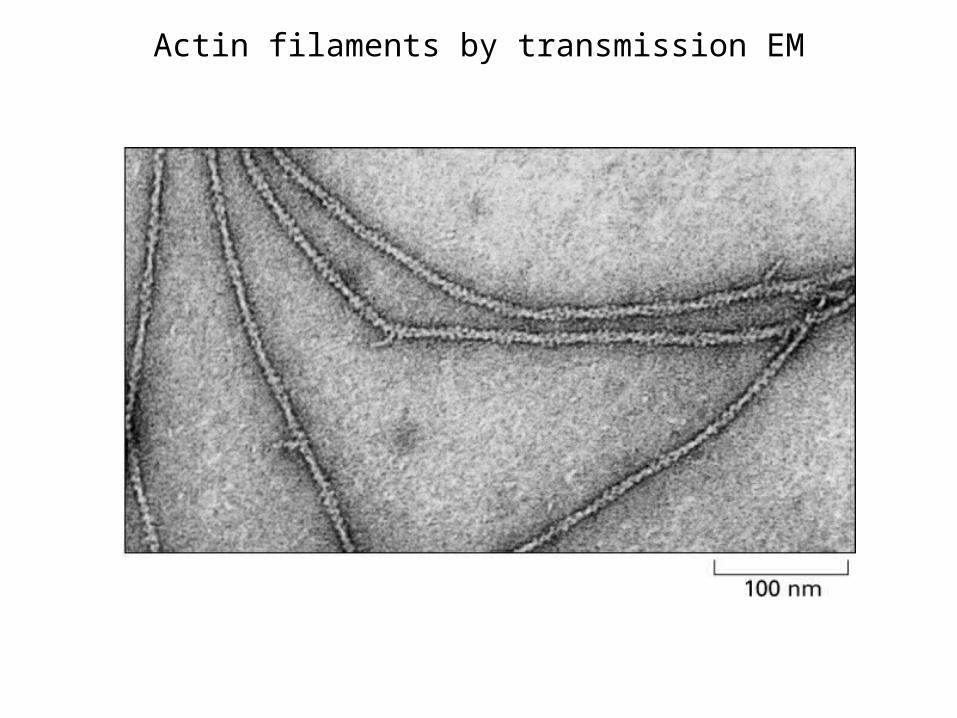
Actin filaments by transmission EM
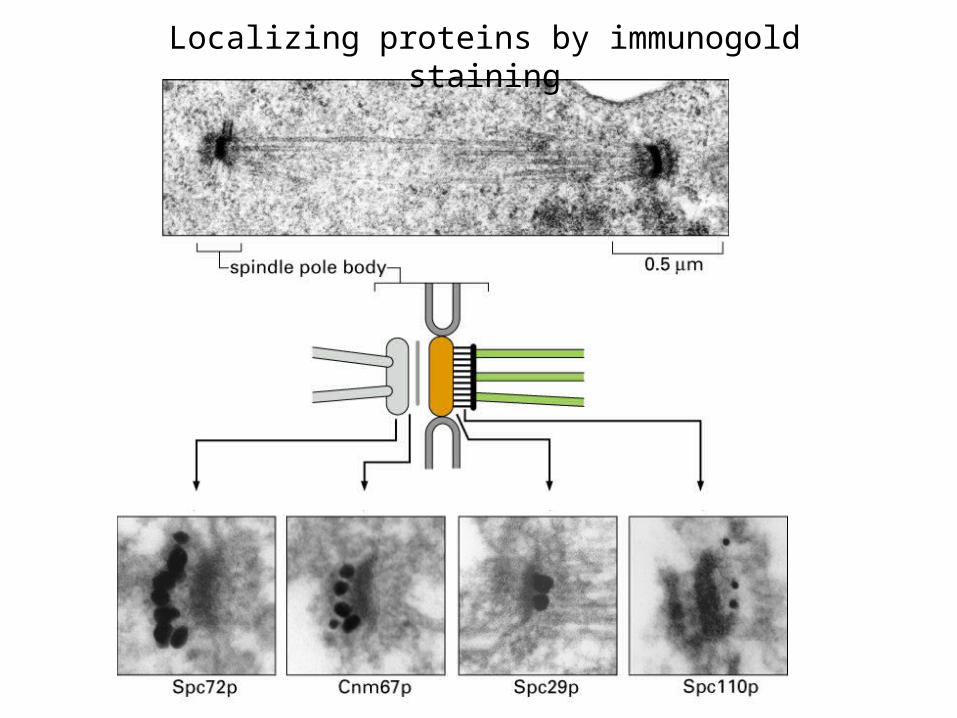
Localizing proteins by immunogold staining
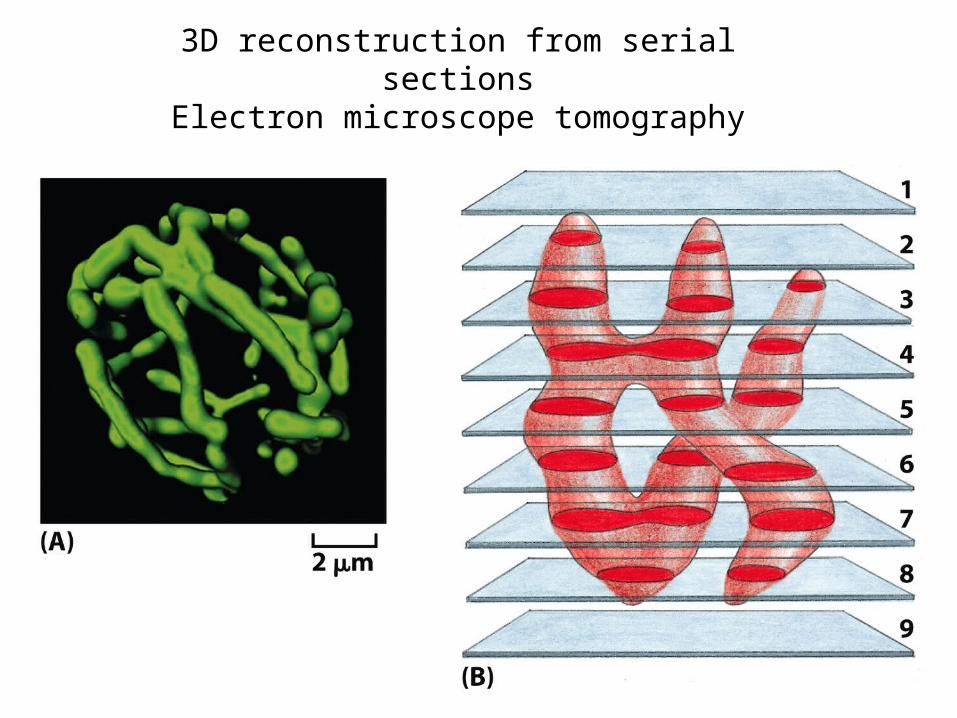
3D reconstruction from serial sectionsElectron microscope tomography
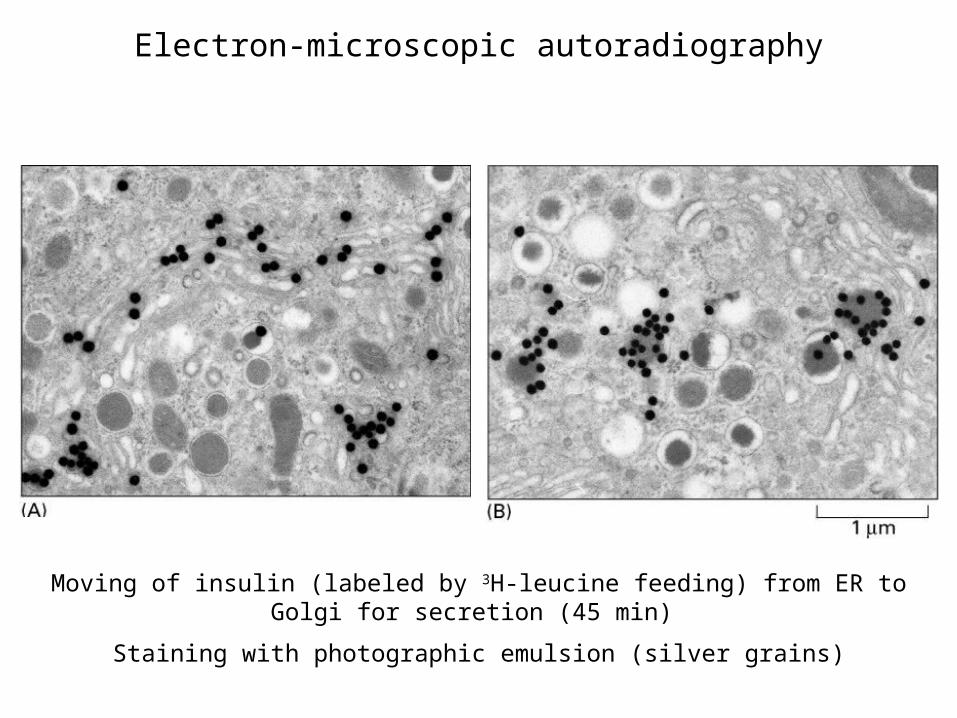
Electron-microscopic autoradiography
Moving of insulin (labeled by 3H-leucine feeding) from ER to Golgi for secretion (45 min)
Staining with photographic emulsion (silver grains)
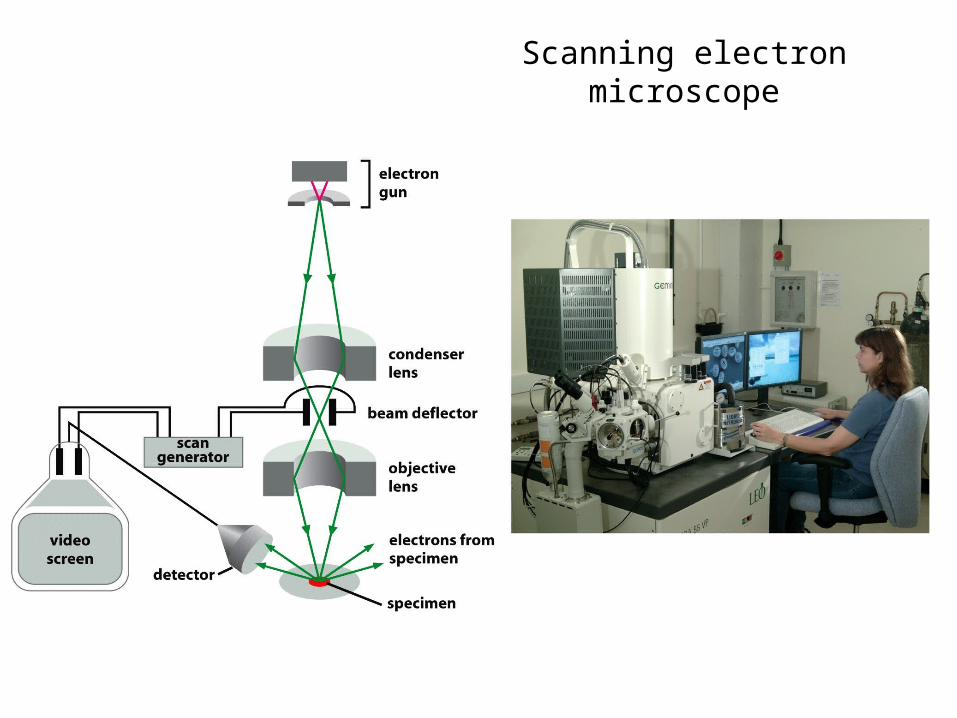
Scanning electron microscope
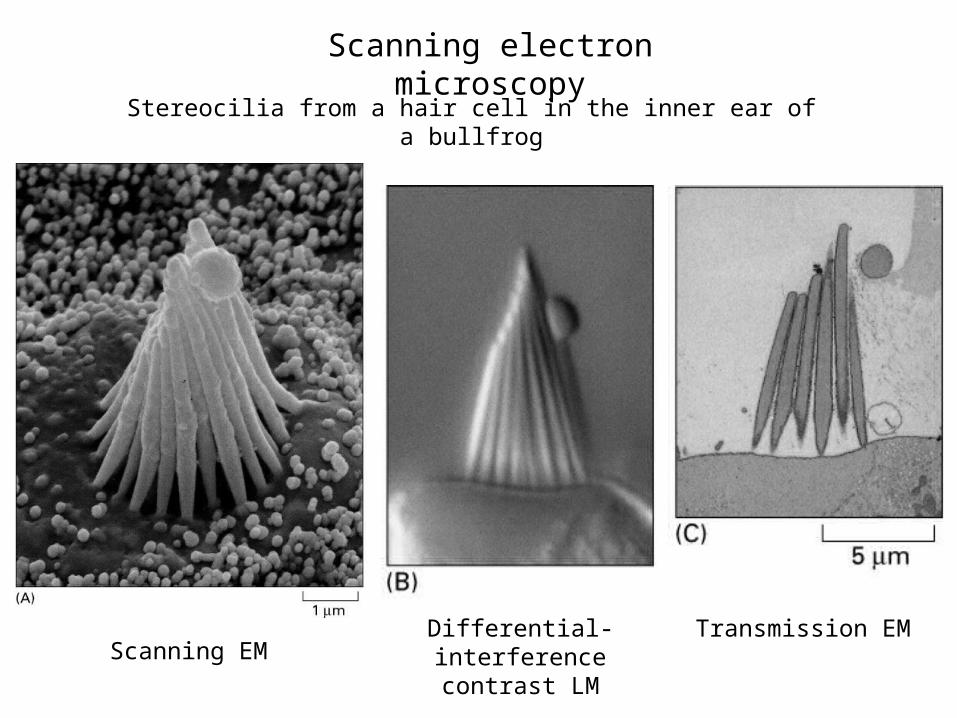
Scanning electron microscopy
Stereocilia from a hair cell in the inner ear of a bullfrog
Scanning EMTransmission EMDifferential-interference
contrast LM
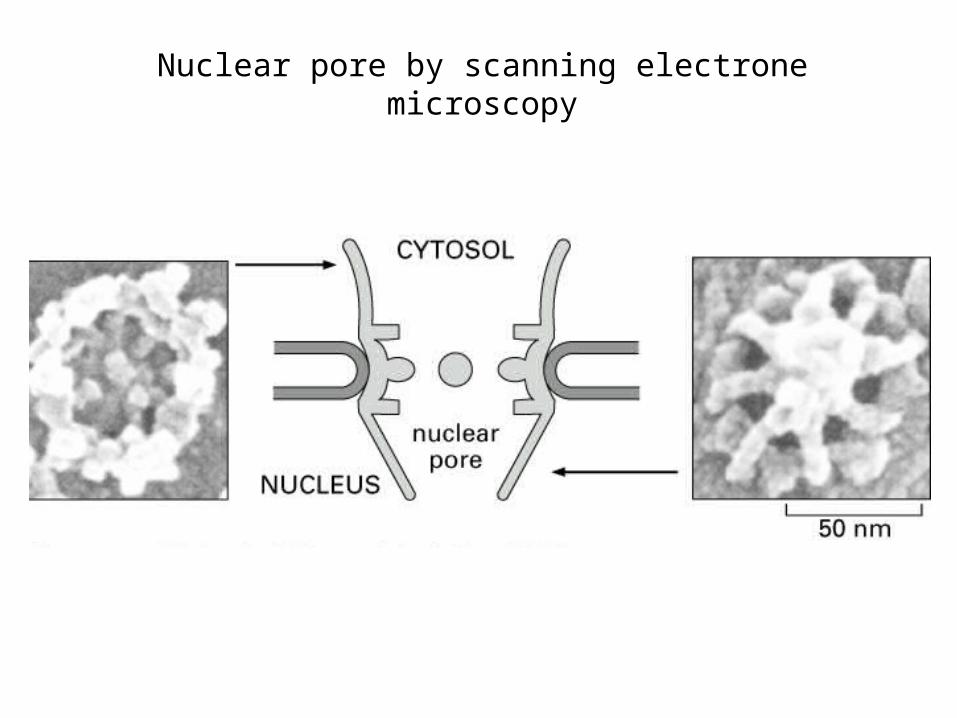
Nuclear pore by scanning electrone microscopy
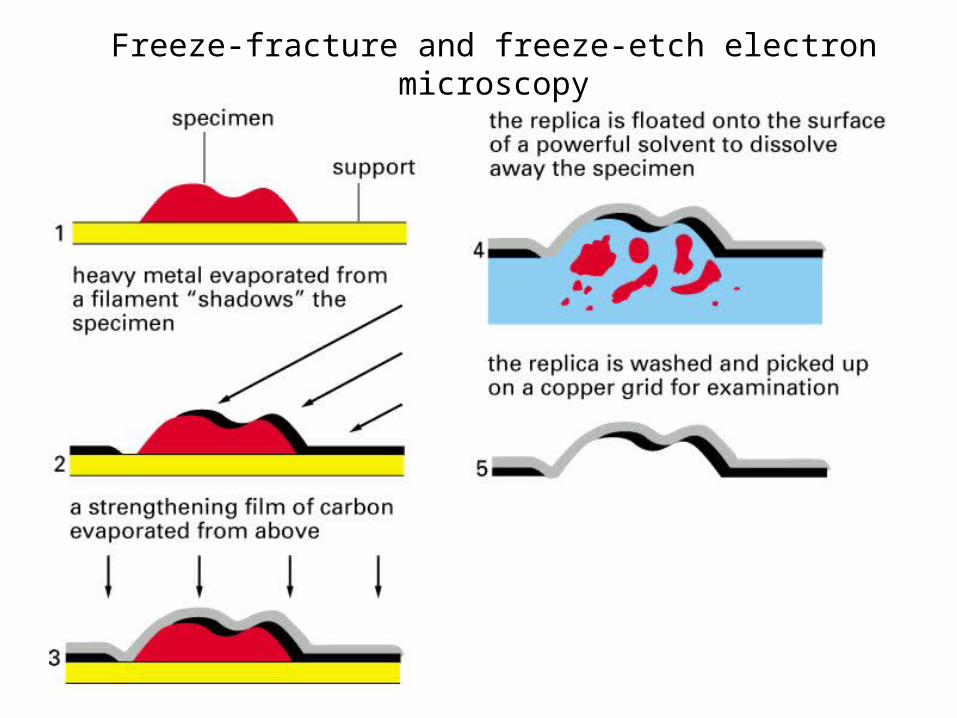
Freeze-fracture and freeze-etch electron microscopy
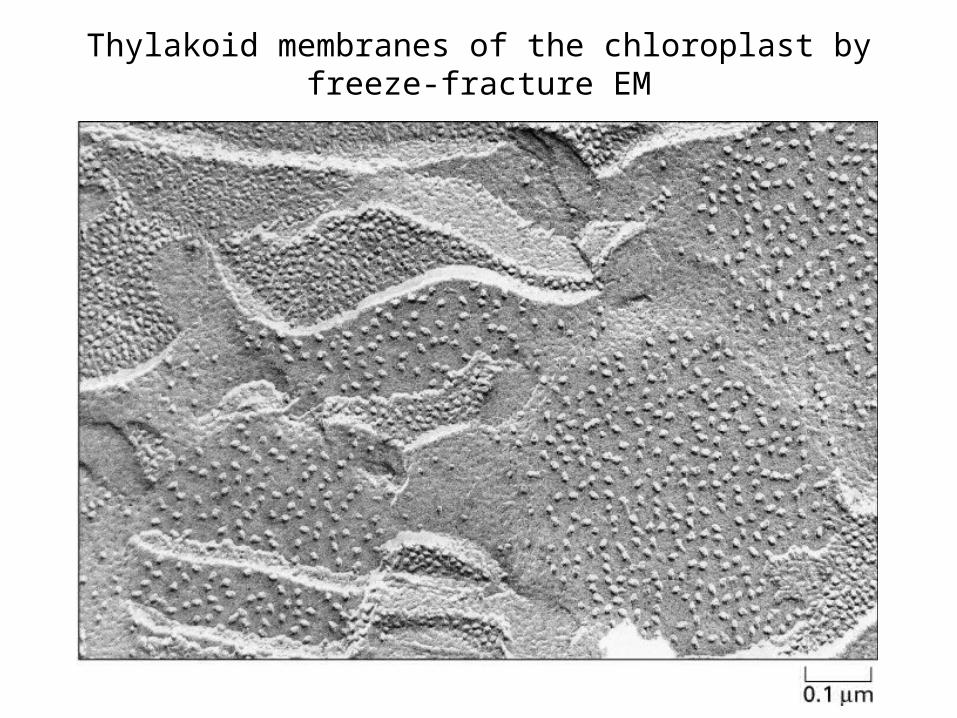
Thylakoid membranes of the chloroplast by freeze-fracture EM
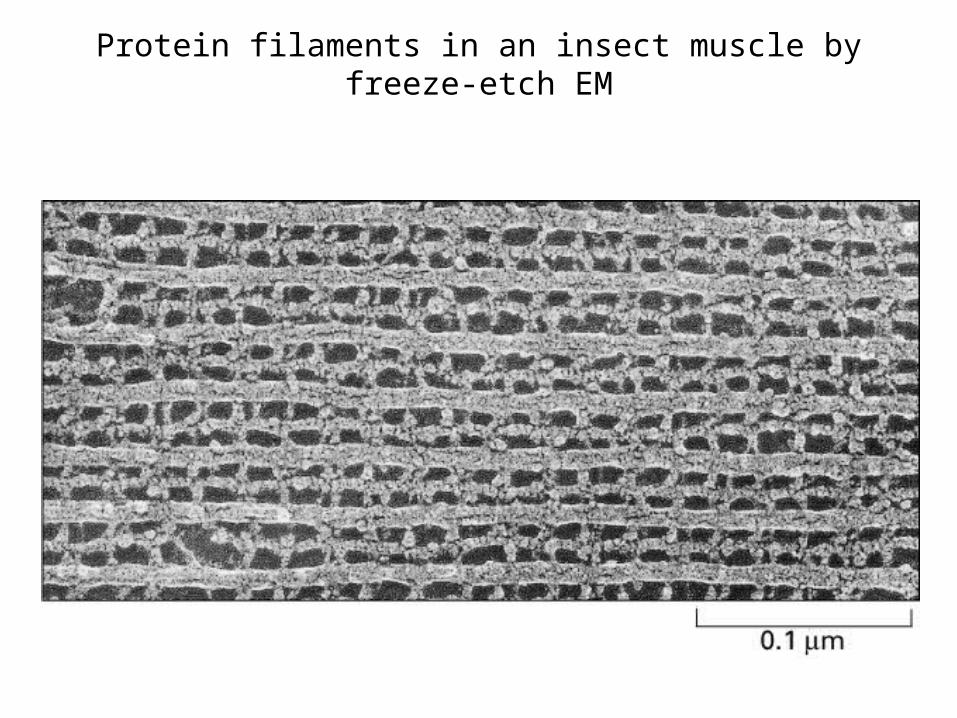
Protein filaments in an insect muscle by freeze-etch EM
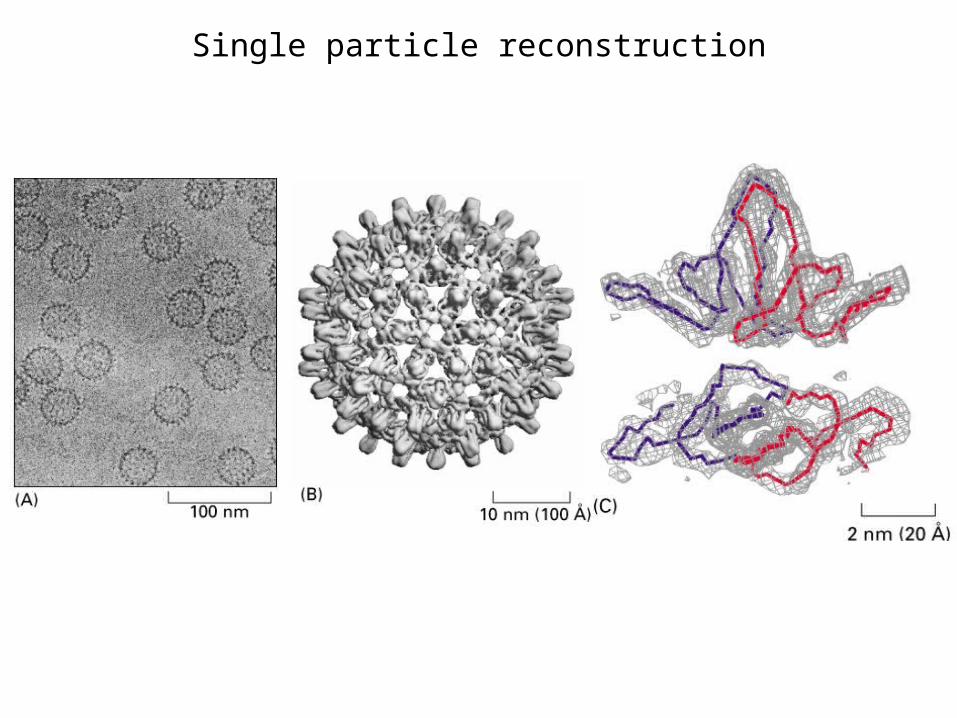
Single particle reconstruction
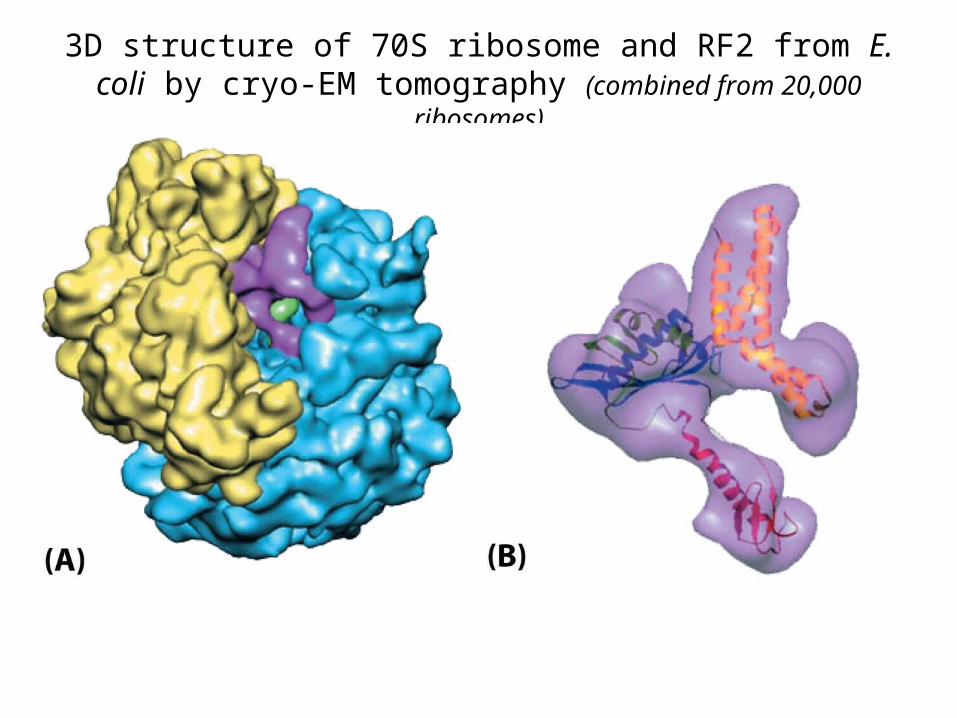
3D structure of 70S ribosome and RF2 from E. coli by cryo-EM tomography (combined from 20,000 ribosomes)