Embed Size (px)
Citation preview
Molecular UV-Visible Spectroscopy
Lecture Date: January 30th, 2013
Electronic Spectroscopy (Review)
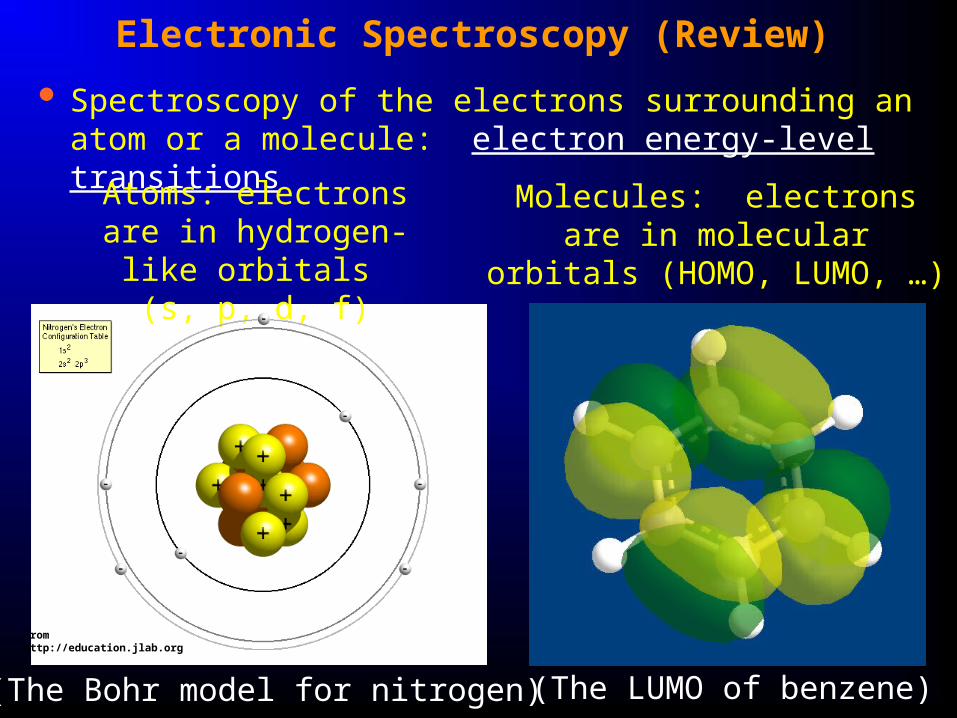
Spectroscopy of the electrons surrounding an atom or a molecule: electron energy-level transitions
Atoms: electrons are in hydrogen-like orbitals
(s, p, d, f)
Molecules: electrons are in molecular orbitals (HOMO,
LUMO, …)
(The LUMO of benzene)(The Bohr model for nitrogen)
From http://education.jlab.org
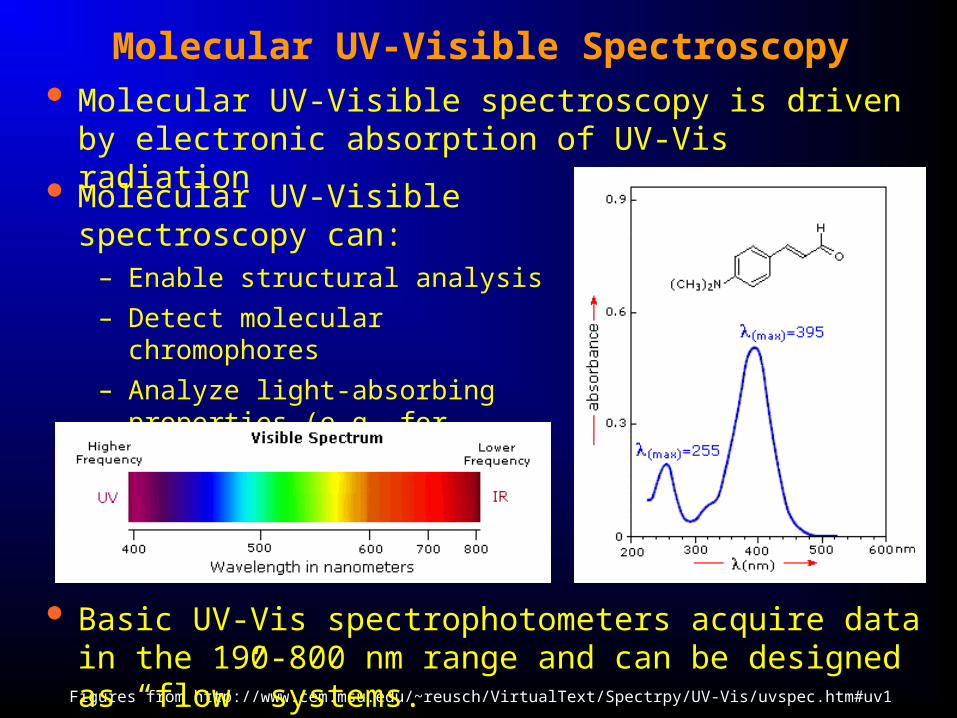
Molecular UV-Visible Spectroscopy
Molecular UV-Visible spectroscopy can:
– Enable structural analysis
– Detect molecular chromophores
– Analyze light-absorbing properties (e.g. for photochemistry)
Figures from http://www.cem.msu.edu/~reusch/VirtualText/Spectrpy/UV-Vis/uvspec.htm#uv1
Basic UV-Vis spectrophotometers acquire data in the 190-800 nm range and can be designed as “flow” systems.
Molecular UV-Visible spectroscopy is driven by electronic absorption of UV-Vis radiation
Molecular UV-Vis Spectroscopy: Terminology
UV-Vis Terminology
– Chromophore: a UV-Visible absorbing functional group
– Bathochromic shift (red shift): to longer wavelengths
– Auxochrome: a substituent on a chromophore that causes a red shift
– Hypsochromic shift (blue shift): to shorter wavelengths
– Hyperchromic shift: to greater absorbance
– Hypochromic shift: to lesser absorbance
Molecular UV-Vis Spectroscopy: Transitions
Major classes of electron transitions
– HOMO: highest occupied molecular orbital
– LUMO: lowest unoccupied molecular orbital
– Types of electron transitions:
(1) , and n electrons (mostly organics)
(2) d and f electrons (inorganics/organometallics)
(3) charge-transfer (CT) electrons
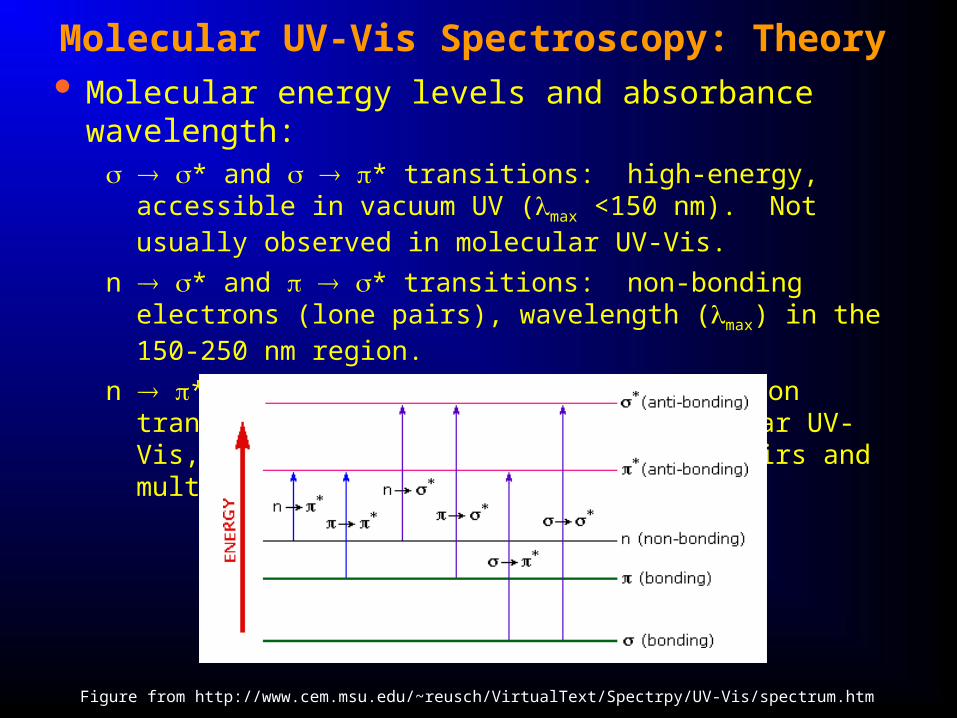
Molecular UV-Vis Spectroscopy: Theory Molecular energy levels and absorbance wavelength:
* and * transitions: high-energy, accessible in vacuum UV (max <150 nm). Not usually observed in molecular UV-Vis.
n * and * transitions: non-bonding electrons (lone pairs), wavelength (max) in the 150-250 nm region.
n * and * transitions: most common transitions observed in organic molecular UV-Vis, observed in compounds with lone pairs and multiple bonds with max = 200-600 nm.
Figure from http://www.cem.msu.edu/~reusch/VirtualText/Spectrpy/UV-Vis/spectrum.htm
Molecular UV-Vis Spectroscopy and Transition Metal and Lanthanide/Actinide Complexes
d/f orbitals– UV-Vis spectra of lanthanides/actinides are particularly sharp, due
to screening of the 4f and 5f orbitals by lower shells.
– Can measure ligand field strength, and transitions between d-orbitals made non-equivalent by the formation of a complex
Charge transfer (CT) – occurs when electron-donor and electron-acceptor properties are in the same complex – electron transfer occurs as an “excitation step”
– MLCT (metal-to-ligand charge transfer)
– LMCT (ligand-to-metal charge transfer)
– Ex: tri(bipyridyl)iron(II), which is red – an electron is exicted from the d-orbital of the metal into a * orbital on the ligand
Molecular UV-Vis Spectroscopy: Absorption
max is the wavelength(s) of maximum absorption (i.e. the peak position)
The strength of a UV-Visible absorption is given by the molar absorption coefficient ():
= 8.7 x 10¹⁹ P a
where P is the transition probability (0 to 1) – governed by selection rules and orbital overlap,
and a is the chromophore area in cm2
Molar absorption coefficient () then gives A via the Beer-Lambert Law:
A = bc
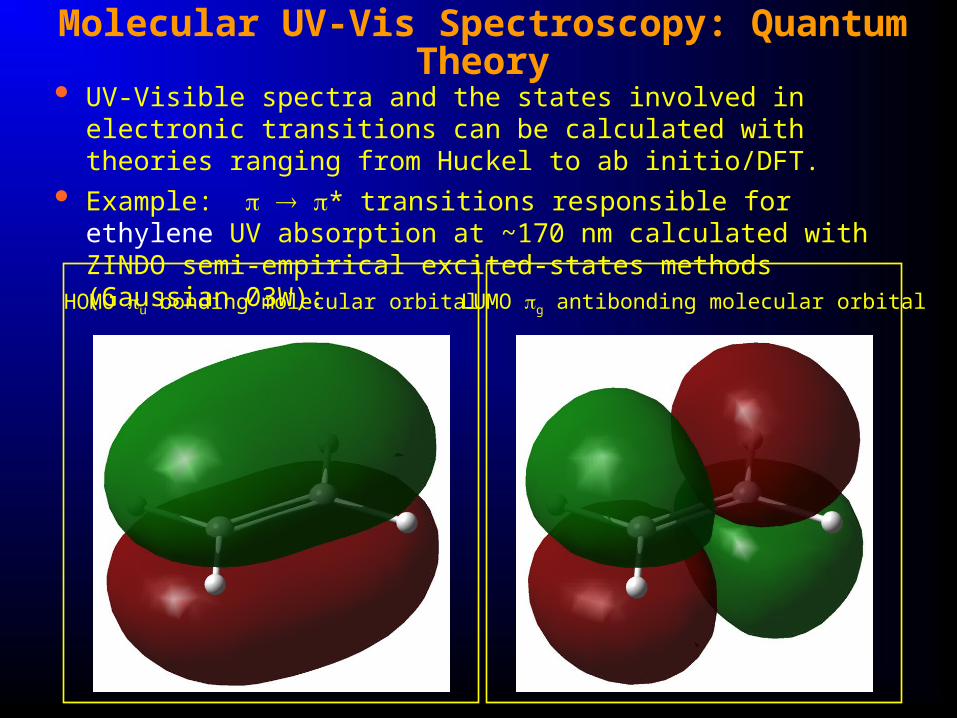
Molecular UV-Vis Spectroscopy: Quantum Theory UV-Visible spectra and the states involved in electronic transitions
can be calculated with theories ranging from Huckel to ab initio/DFT.
Example: * transitions responsible for ethylene UV absorption at ~170 nm calculated with ZINDO semi-empirical excited-states methods (Gaussian 03W):
HOMO u bonding molecular orbital LUMO g antibonding molecular orbital
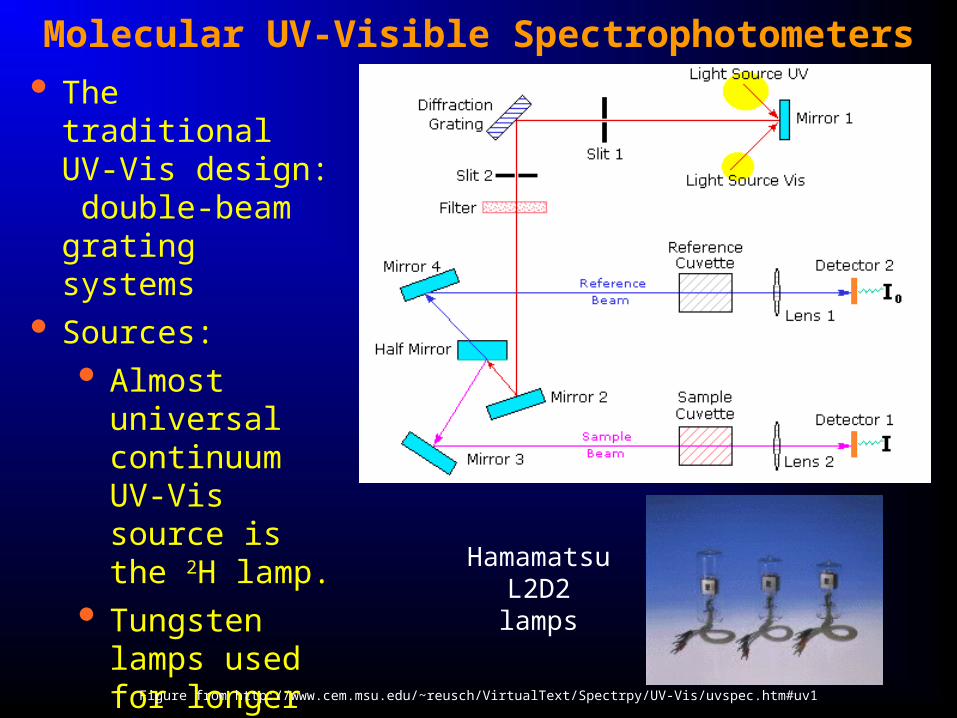
Molecular UV-Visible Spectrophotometers
The traditional UV-Vis design: double-beam grating systems
Sources:
Almost universal continuum UV-Vis source is the 2H lamp.
Tungsten lamps used for longer (visible) wavelengths.
Figure from http://www.cem.msu.edu/~reusch/VirtualText/Spectrpy/UV-Vis/uvspec.htm#uv1
Hamamatsu L2D2 lamps
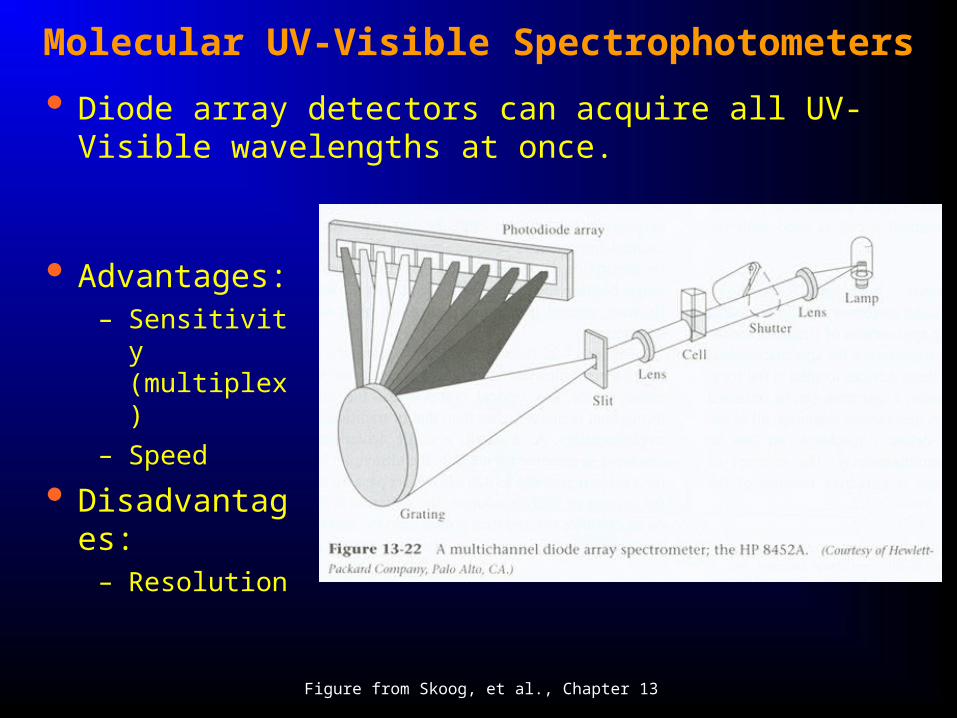
Molecular UV-Visible Spectrophotometers
Diode array detectors can acquire all UV-Visible wavelengths at once.
Advantages:– Sensitivity
(multiplex)
– Speed
Disadvantages:– Resolution
Figure from Skoog, et al., Chapter 13
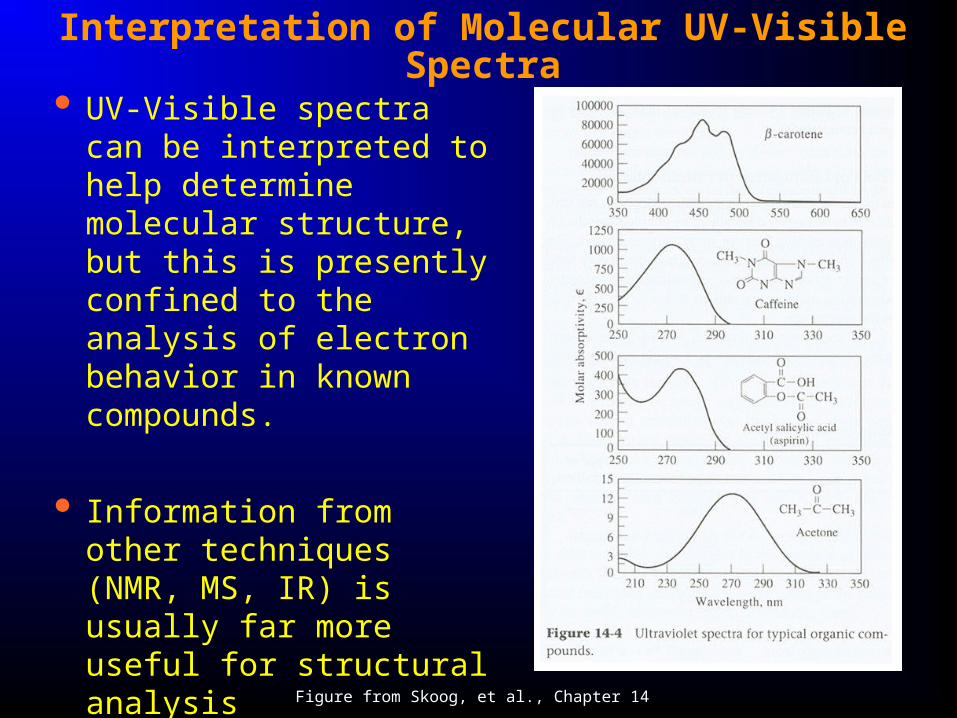
Interpretation of Molecular UV-Visible Spectra
UV-Visible spectra can be interpreted to help determine molecular structure, but this is presently confined to the analysis of electron behavior in known compounds.
Information from other techniques (NMR, MS, IR) is usually far more useful for structural analysis
However, UV-Vis evidence should not be ignored!
Figure from Skoog, et al., Chapter 14
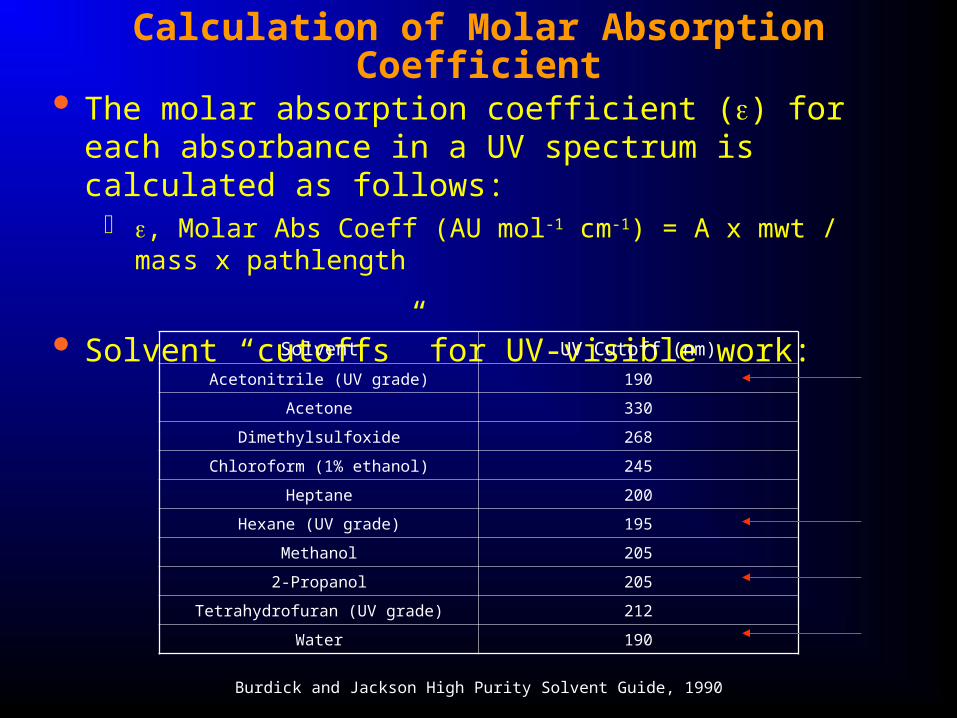
Calculation of Molar Absorption Coefficient
The molar absorption coefficient () for each absorbance in a UV spectrum is calculated as follows:
, Molar Abs Coeff (AU mol-1 cm-1) = A x mwt / mass x pathlength
Solvent “cutoffs” for UV-visible work:
Solvent UV Cutoff (nm)
Acetonitrile (UV grade) 190
Acetone 330
Dimethylsulfoxide 268
Chloroform (1% ethanol) 245
Heptane 200
Hexane (UV grade) 195
Methanol 205
2-Propanol 205
Tetrahydrofuran (UV grade) 212
Water 190
Burdick and Jackson High Purity Solvent Guide, 1990
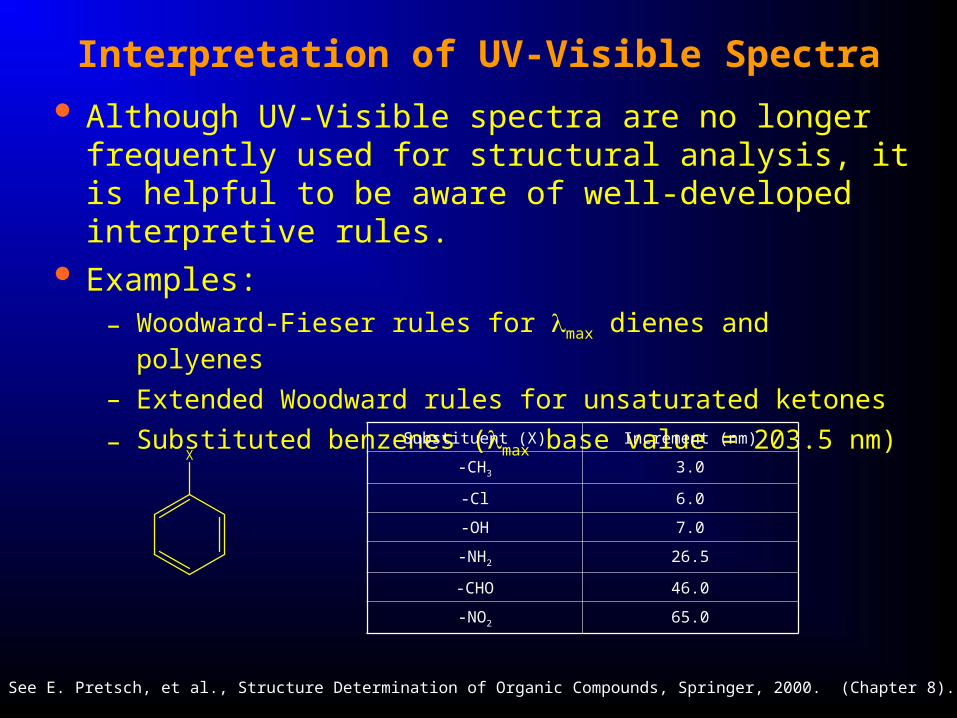
Interpretation of UV-Visible Spectra
Although UV-Visible spectra are no longer frequently used for structural analysis, it is helpful to be aware of well-developed interpretive rules.
Examples: – Woodward-Fieser rules for max dienes and polyenes
– Extended Woodward rules for unsaturated ketones
– Substituted benzenes (max base value = 203.5 nm)
See E. Pretsch, et al., Structure Determination of Organic Compounds, Springer, 2000. (Chapter 8).
XSubstituent (X) Increment (nm)
-CH3 3.0
-Cl 6.0
-OH 7.0
-NH2 26.5
-CHO 46.0
-NO2 65.0
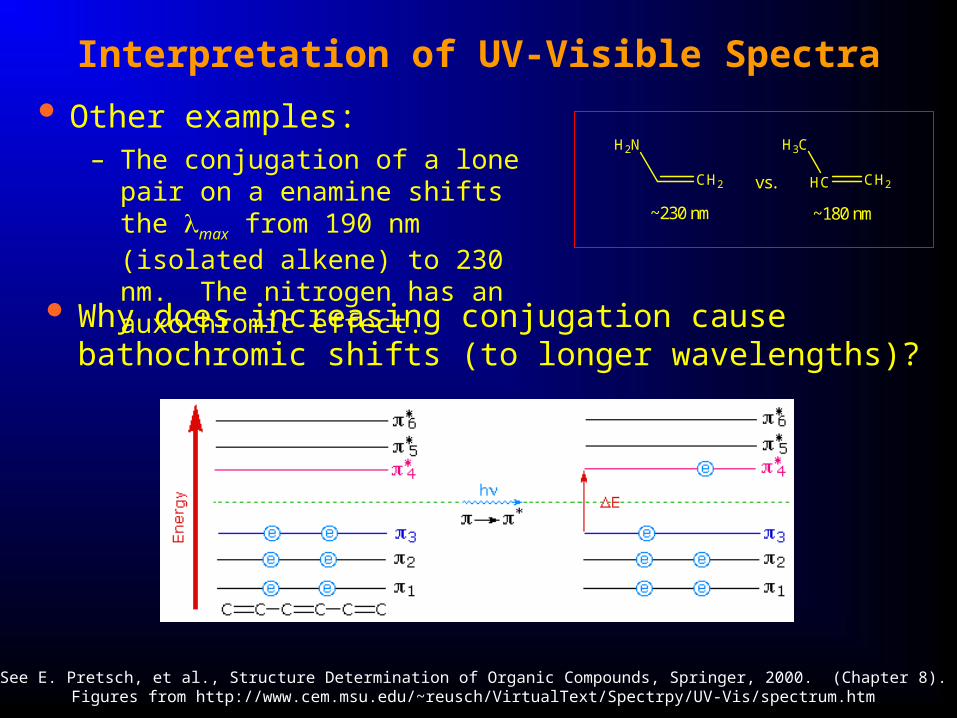
Interpretation of UV-Visible Spectra
Other examples:– The conjugation of a lone pair on a
enamine shifts the max from 190 nm (isolated alkene) to 230 nm. The nitrogen has an auxochromic effect.
See E. Pretsch, et al., Structure Determination of Organic Compounds, Springer, 2000. (Chapter 8).Figures from http://www.cem.msu.edu/~reusch/VirtualText/Spectrpy/UV-Vis/spectrum.htm
Why does increasing conjugation cause bathochromic shifts (to longer wavelengths)?
CH2 HC CH2vs.
~230 nm ~180 nm
H2N H3C
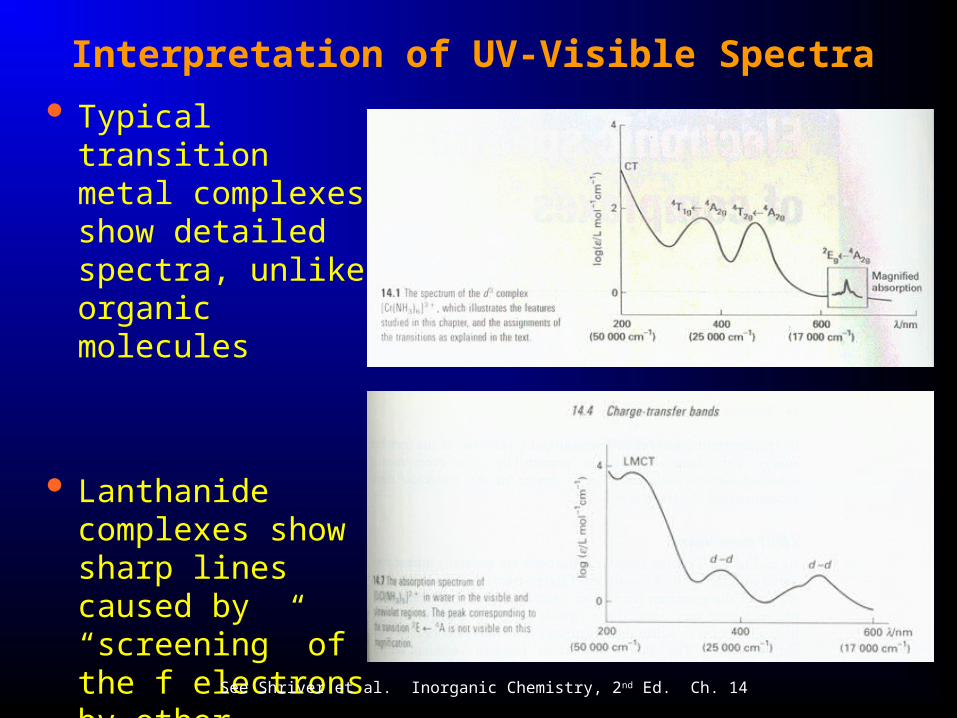
Interpretation of UV-Visible Spectra
Typical transition metal complexes show detailed spectra, unlike organic molecules
Lanthanide complexes show sharp lines caused by “screening” of the f electrons by other orbitals
See Shriver et al. Inorganic Chemistry, 2nd Ed. Ch. 14
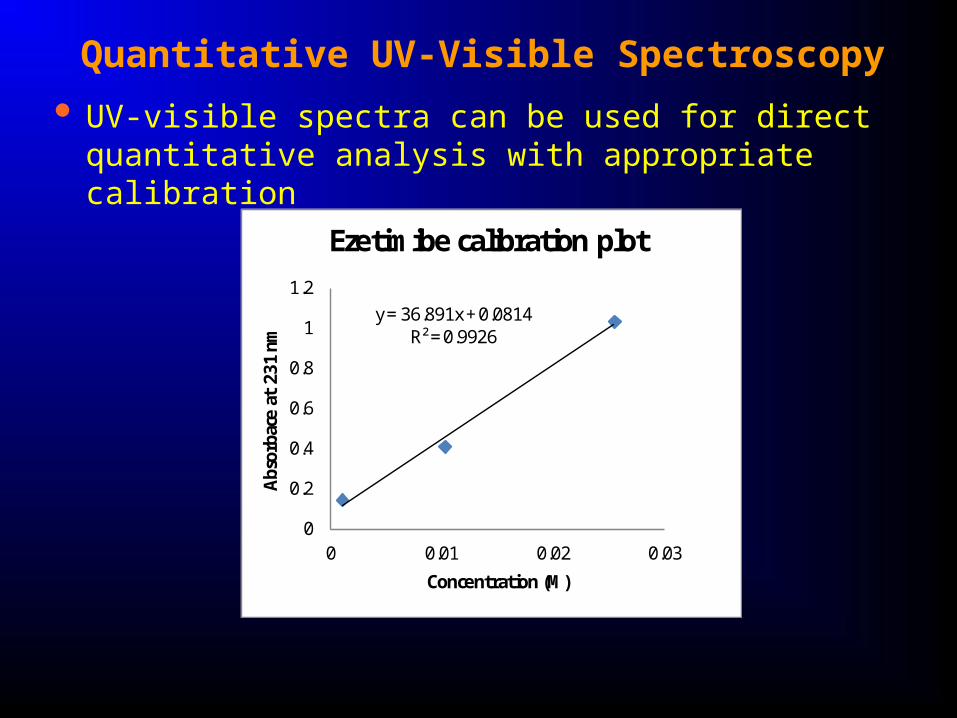
Quantitative UV-Visible Spectroscopy
UV-visible spectra can be used for direct quantitative analysis with appropriate calibration
y = 36.891x + 0.0814R² = 0.9926
0
0.2
0.4
0.6
0.8
1
1.2
0 0.01 0.02 0.03
Abs
orba
ce a
t 23
1 nm
Concentration (M)
Ezetimibe calibration plot
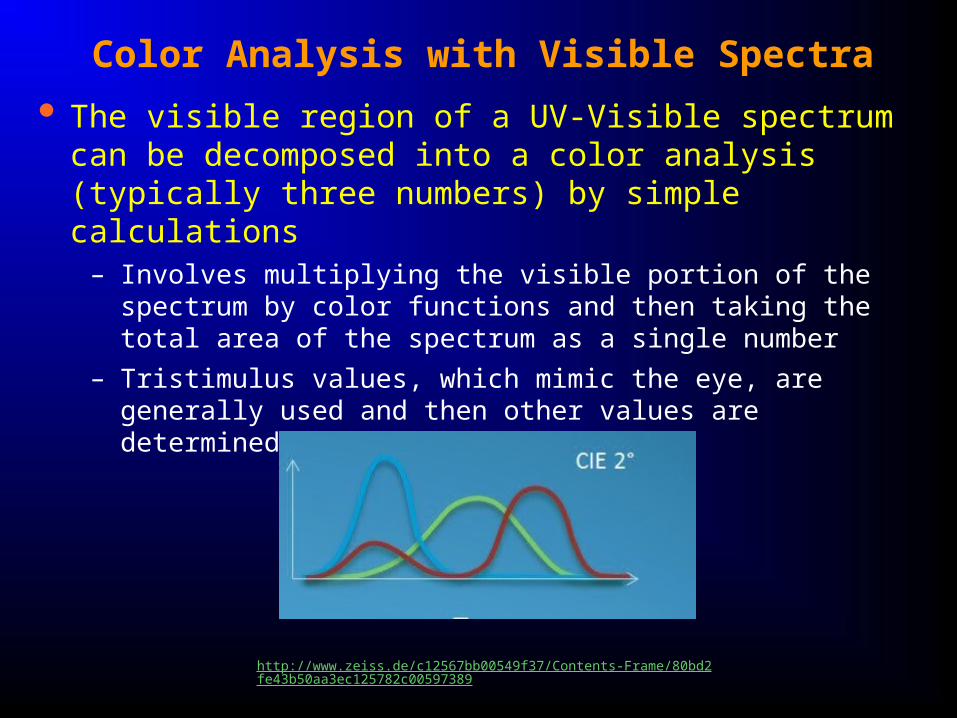
Color Analysis with Visible Spectra
The visible region of a UV-Visible spectrum can be decomposed into a color analysis (typically three numbers) by simple calculations
– Involves multiplying the visible portion of the spectrum by color functions and then taking the total area of the spectrum as a single number
– Tristimulus values, which mimic the eye, are generally used and then other values are determined from these algebraically
http://www.zeiss.de/c12567bb00549f37/Contents-Frame/80bd2fe43b50aa3ec125782c00597389
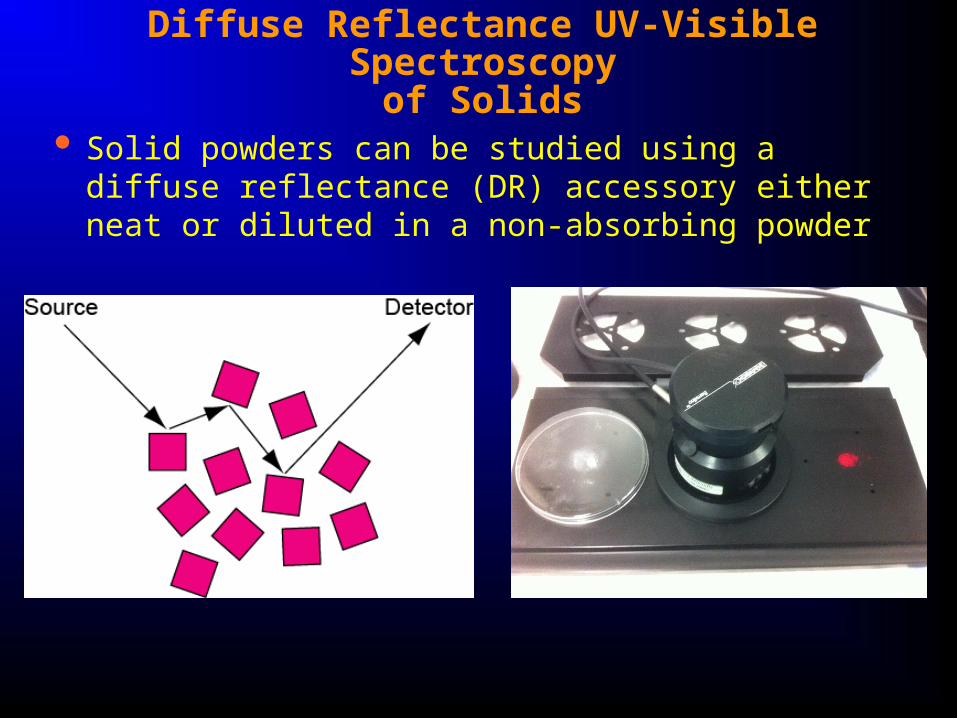
Diffuse Reflectance UV-Visible Spectroscopyof Solids
Solid powders can be studied using a diffuse reflectance (DR) accessory either neat or diluted in a non-absorbing powder
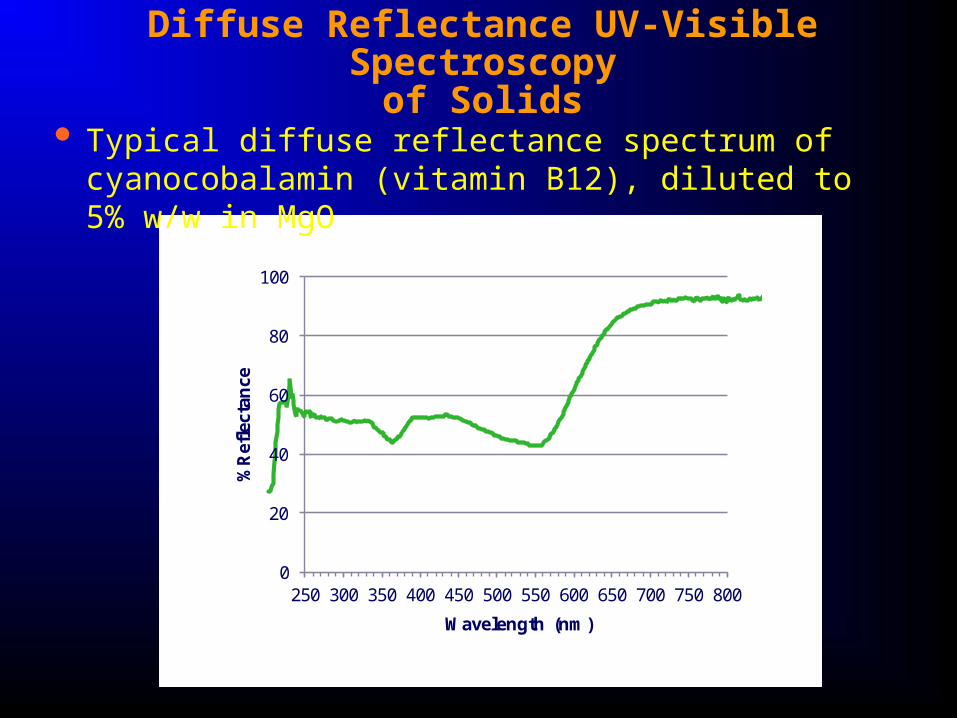
Diffuse Reflectance UV-Visible Spectroscopyof Solids
Typical diffuse reflectance spectrum of cyanocobalamin (vitamin B12), diluted to 5% w/w in MgO
0
20
40
60
80
100
250 300 350 400 450 500 550 600 650 700 750 800
%R
efle
ctan
ce
Wavelength (nm)
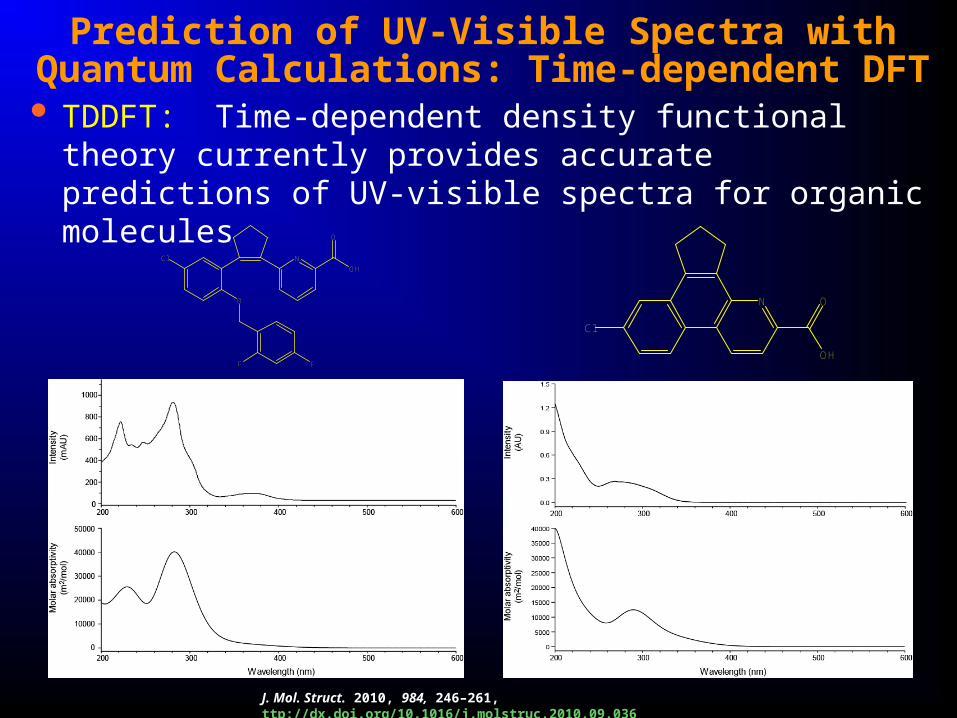
Prediction of UV-Visible Spectra with Quantum Calculations: Time-dependent DFT
TDDFT: Time-dependent density functional theory currently provides accurate predictions of UV-visible spectra for organic molecules
N
O
FF
Cl
OH
O
J. Mol. Struct. 2010, 984, 246–261, ttp://dx.doi.org/10.1016/j.molstruc.2010.09.036
N
Cl
OH
O
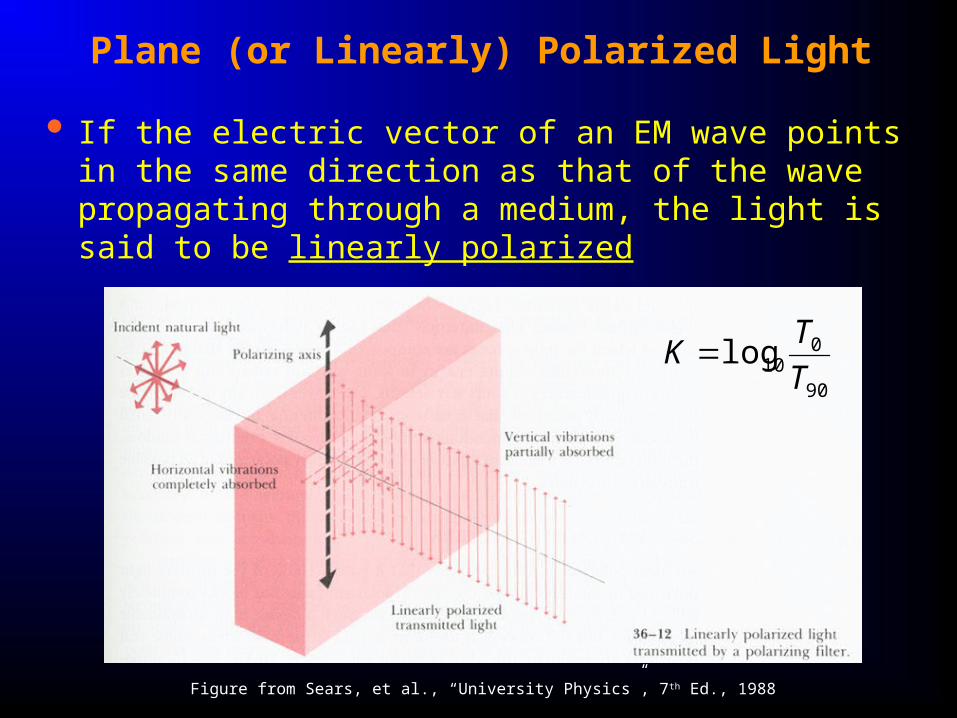
Plane (or Linearly) Polarized Light
If the electric vector of an EM wave points in the same direction as that of the wave propagating through a medium, the light is said to be linearly polarized
Figure from Sears, et al., “University Physics”, 7th Ed., 1988
90
010log
T
TK
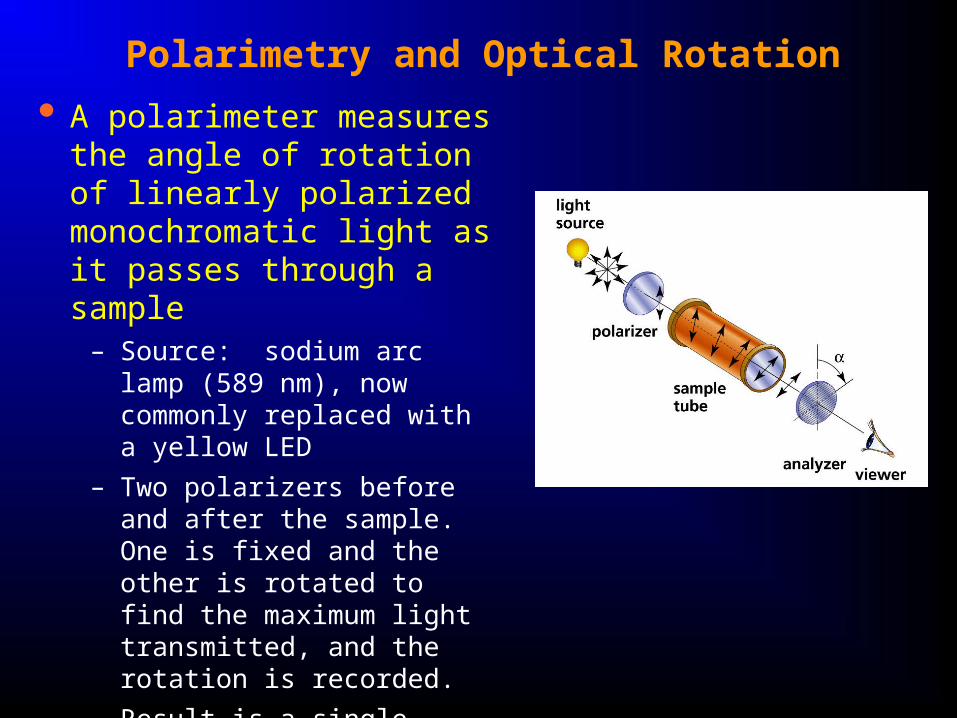
Polarimetry and Optical Rotation
A polarimeter measures the angle of rotation of linearly polarized monochromatic light as it passes through a sample
– Source: sodium arc lamp (589 nm), now commonly replaced with a yellow LED
– Two polarizers before and after the sample. One is fixed and the other is rotated to find the maximum light transmitted, and the rotation is recorded.
– Result is a single number, e.g. -10.02, the specific rotation
– What happens when we vary the wavelength?
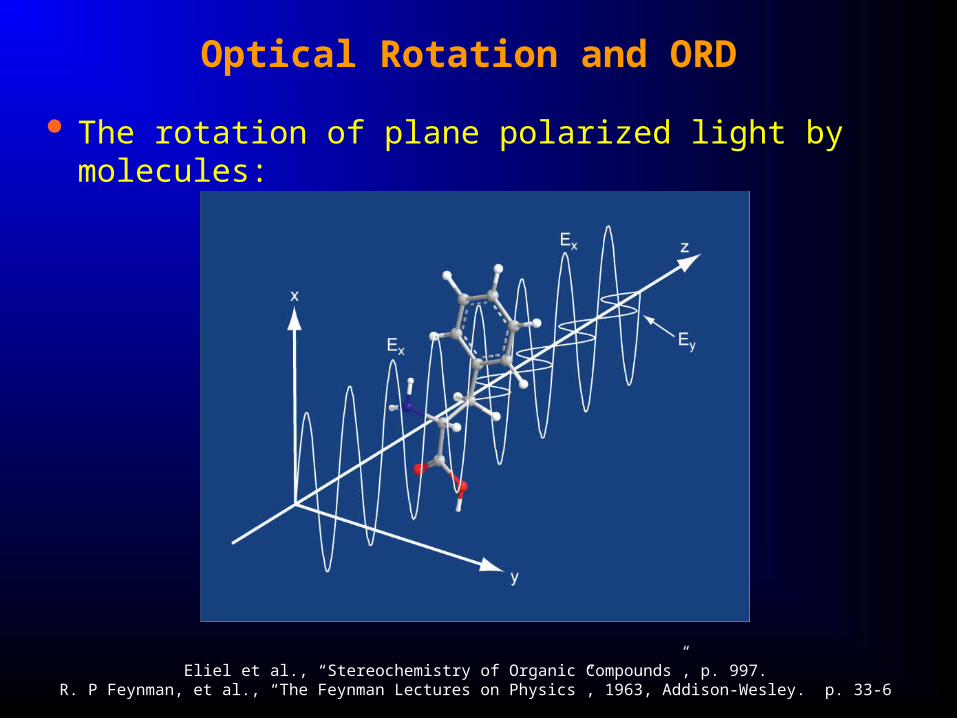
Optical Rotation and ORD
The rotation of plane polarized light by molecules:
Eliel et al., “Stereochemistry of Organic Compounds”, p. 997.R. P Feynman, et al., “The Feynman Lectures on Physics”, 1963, Addison-Wesley. p. 33-6
Optical Rotatory Dispersion (ORD)
The measurement of specific rotation as a function of wavelength, in the absence of absorption, is monotonic (and governed by the Fresnel equation)
In the vicinity of an absorption, one obtains “anomalous dispersion”
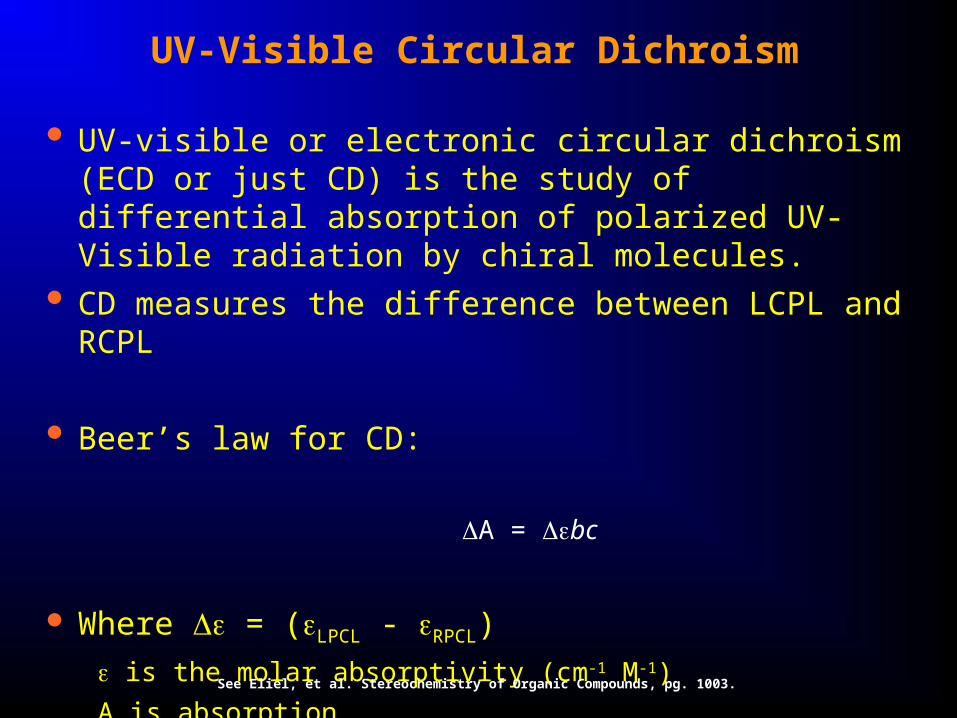
UV-Visible Circular Dichroism
UV-visible or electronic circular dichroism (ECD or just CD) is the study of differential absorption of polarized UV-Visible radiation by chiral molecules.
CD measures the difference between LCPL and RCPL
Beer’s law for CD:
A = bc
Where = (LPCL - RPCL)
is the molar absorptivity (cm-1 M-1)
A is absorption
See Eliel, et al. Stereochemistry of Organic Compounds, pg. 1003.
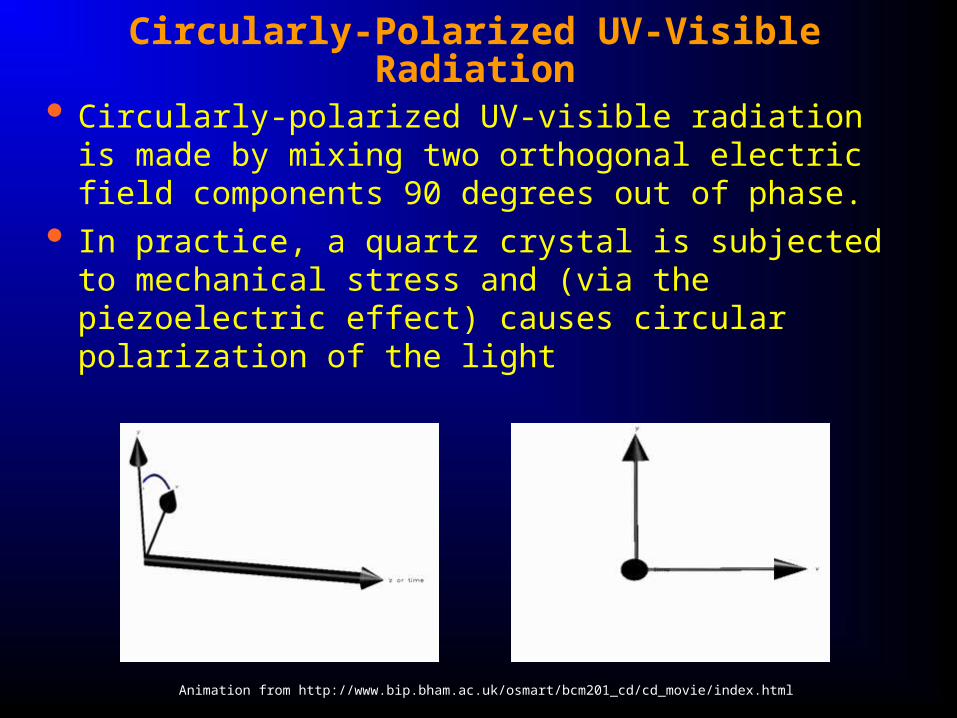
Circularly-Polarized UV-Visible Radiation
Circularly-polarized UV-visible radiation is made by mixing two orthogonal electric field components 90 degrees out of phase.
In practice, a quartz crystal is subjected to mechanical stress and (via the piezoelectric effect) causes circular polarization of the light
Animation from http://www.bip.bham.ac.uk/osmart/bcm201_cd/cd_movie/index.html
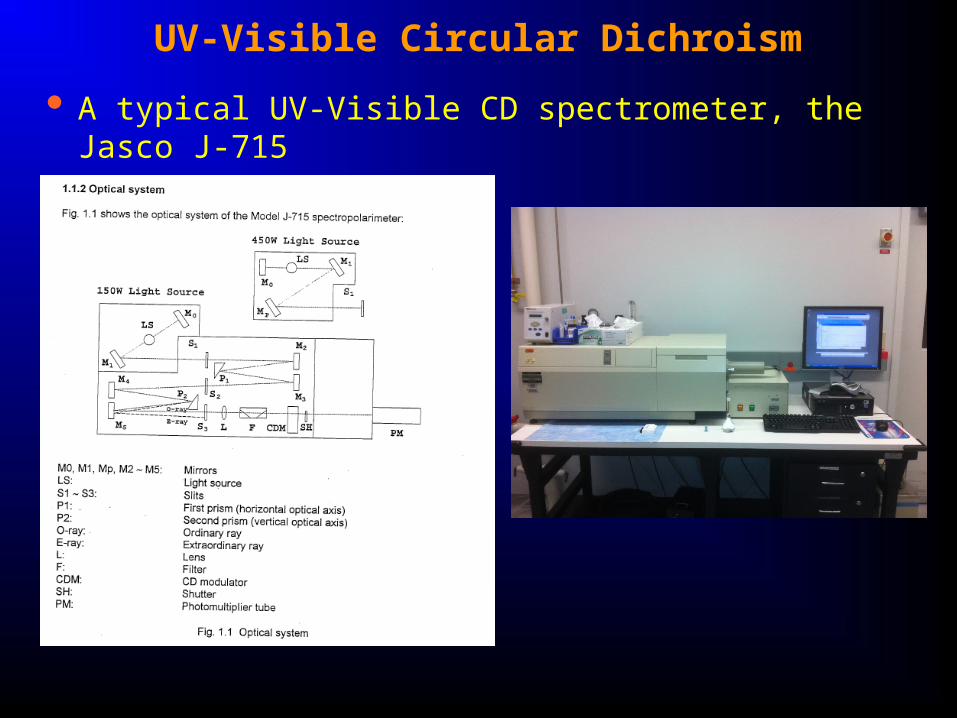
UV-Visible Circular Dichroism
A typical UV-Visible CD spectrometer, the Jasco J-715
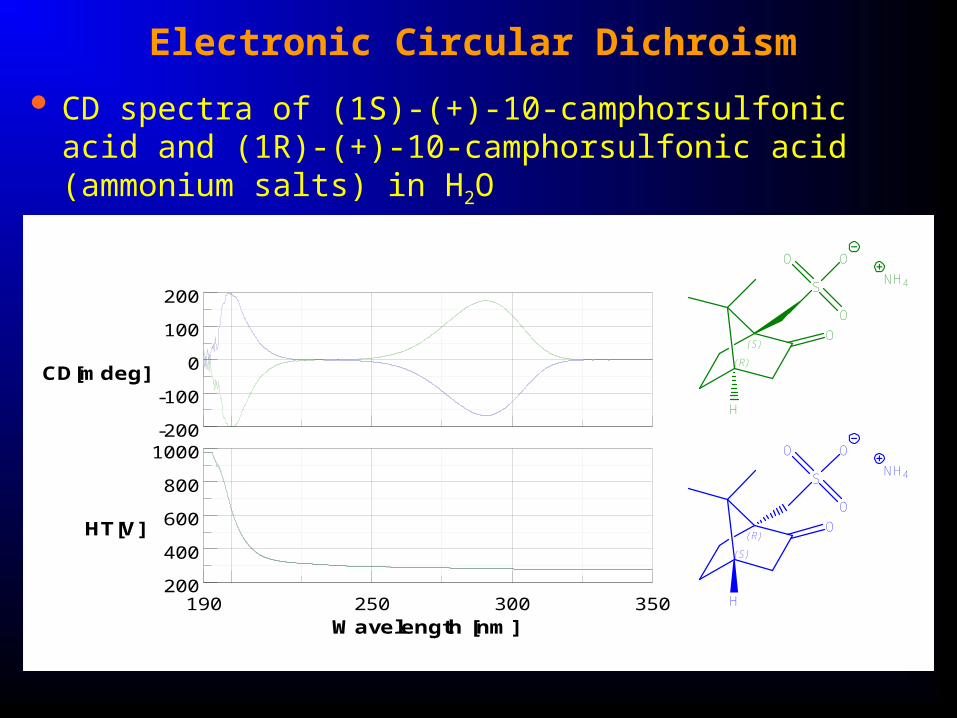
Electronic Circular Dichroism
CD spectra of (1S)-(+)-10-camphorsulfonic acid and (1R)-(+)-10-camphorsulfonic acid (ammonium salts) in H2O
-200
200
-100
0
100
CD[mdeg]
200
1000
400
600
800
190 350250 300
HT[V]
Wavelength [nm]
(R)
(S)O
S
O
O
O
NH4
H
(S)
(R)O
S
O
O
O
NH4
H
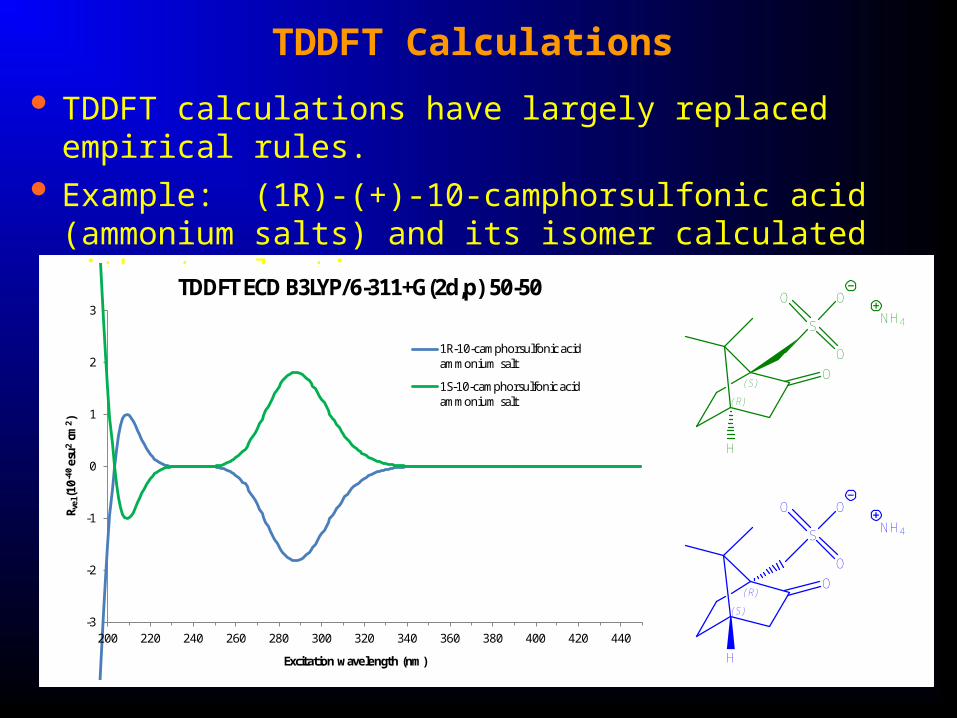
TDDFT Calculations
TDDFT calculations have largely replaced empirical rules.
Example: (1R)-(+)-10-camphorsulfonic acid (ammonium salts) and its isomer calculated without solvation:
(S)
(R)O
S
O
O
O
NH4
H
(R)
(S)O
S
O
O
O
NH4
H
-3
-2
-1
0
1
2
3
200 220 240 260 280 300 320 340 360 380 400 420 440
R vel
(10-4
0es
u2cm
2 )
Excitation wavelength (nm)
TDDFT ECD B3LYP/6-311+G(2d,p) 50-50
1R-10-camphorsulfonic acid ammonium salt
1S-10-camphorsulfonic acid ammonium salt
Electronic Circular Dichroism
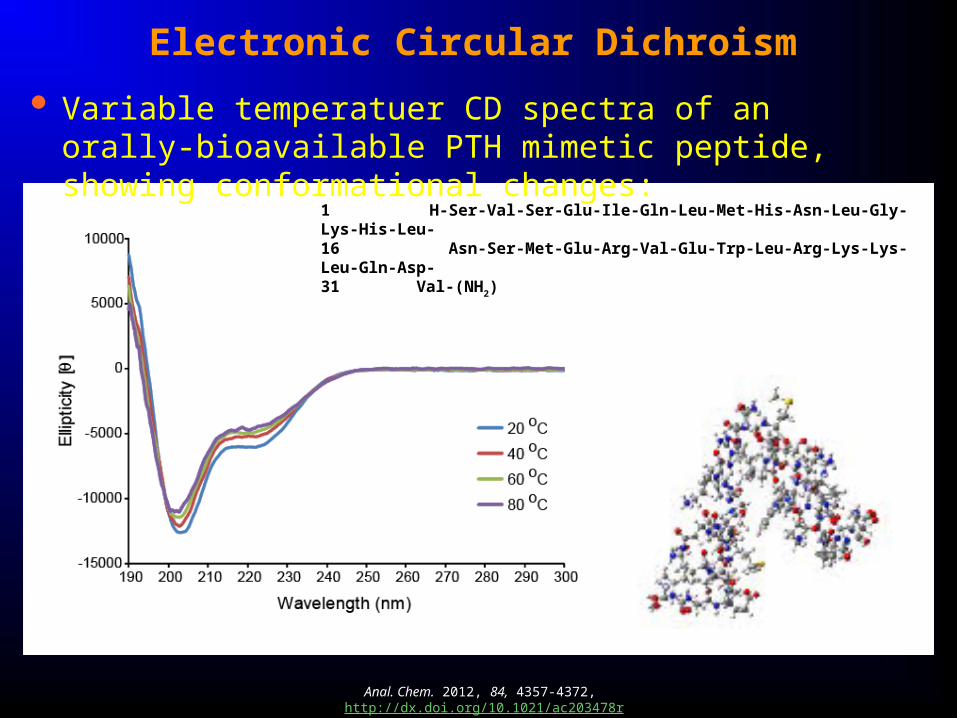
Variable temperatuer CD spectra of an orally-bioavailable PTH mimetic peptide, showing conformational changes:
1 H-Ser-Val-Ser-Glu-Ile-Gln-Leu-Met-His-Asn-Leu-Gly-Lys-His-Leu-16 Asn-Ser-Met-Glu-Arg-Val-Glu-Trp-Leu-Arg-Lys-Lys-Leu-Gln-Asp-31 Val-(NH2)
Anal. Chem. 2012, 84, 4357-4372, http://dx.doi.org/10.1021/ac203478r
Electronic Circular Dichroism
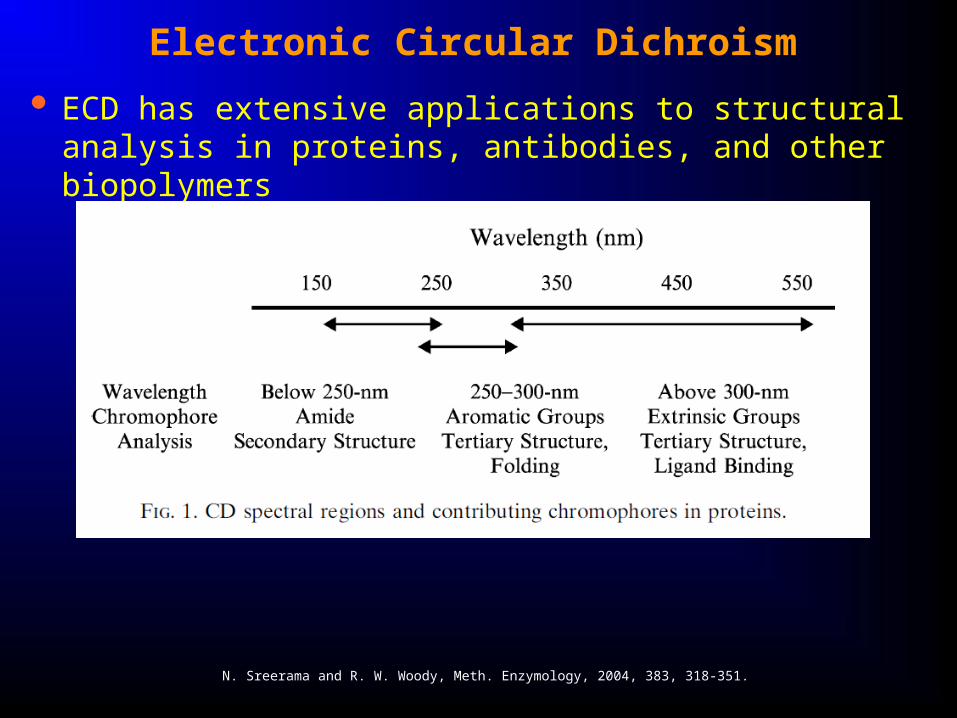
ECD has extensive applications to structural analysis in proteins, antibodies, and other biopolymers
N. Sreerama and R. W. Woody, Meth. Enzymology, 2004, 383, 318-351.
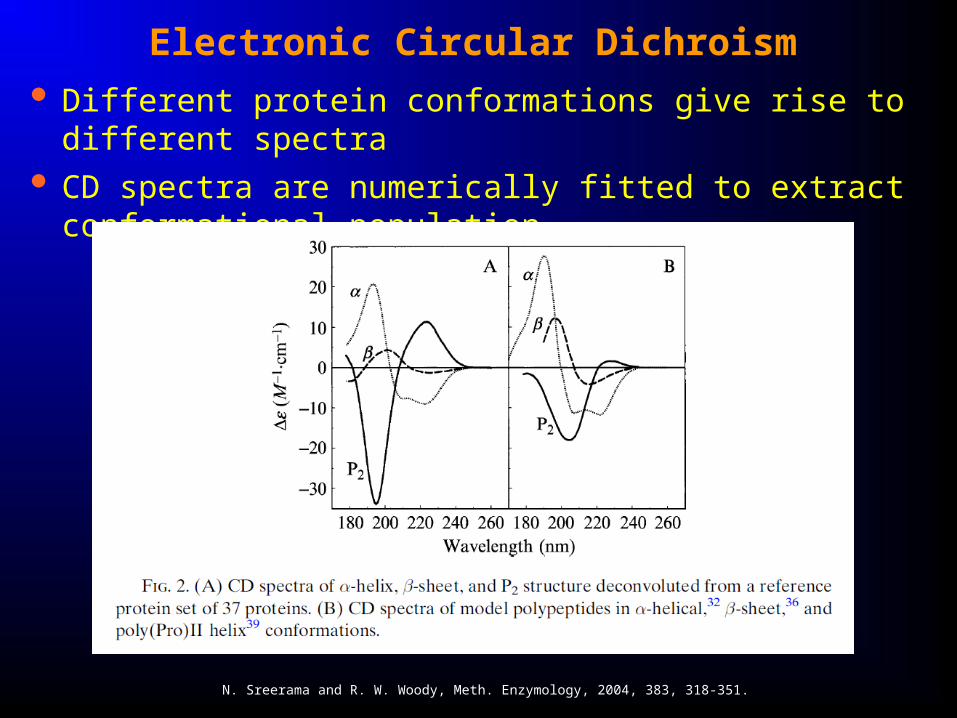
Electronic Circular Dichroism
Different protein conformations give rise to different spectra
CD spectra are numerically fitted to extract conformational population
N. Sreerama and R. W. Woody, Meth. Enzymology, 2004, 383, 318-351.
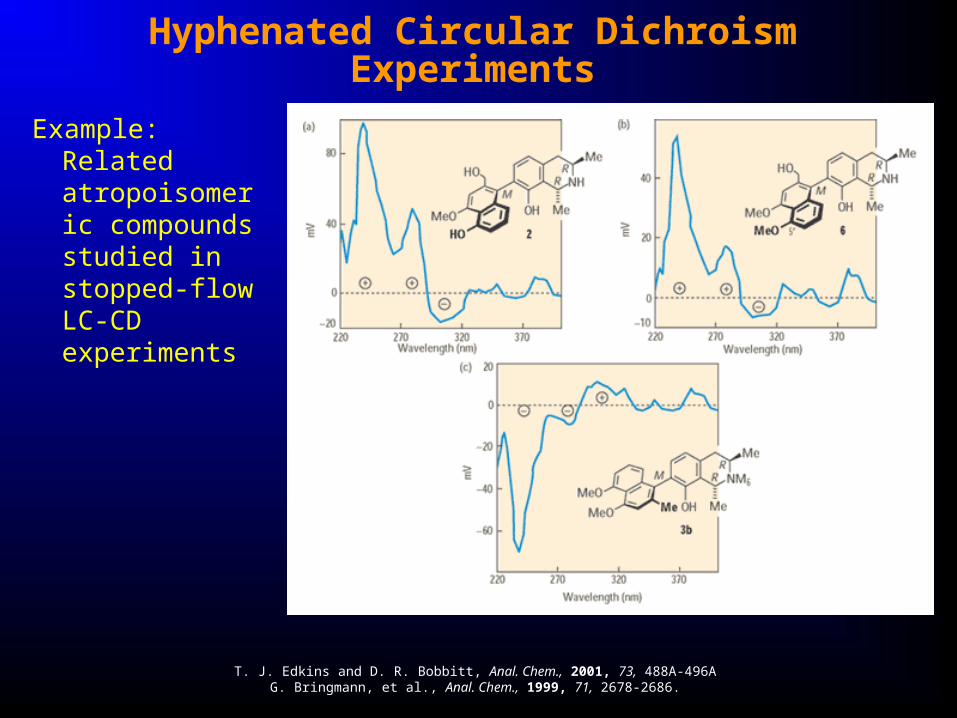
Hyphenated Circular Dichroism Experiments
Example: Related atropoisomeric compounds studied in stopped-flow LC-CD experiments
T. J. Edkins and D. R. Bobbitt, Anal. Chem., 2001, 73, 488A-496AG. Bringmann, et al., Anal. Chem., 1999, 71, 2678-2686.
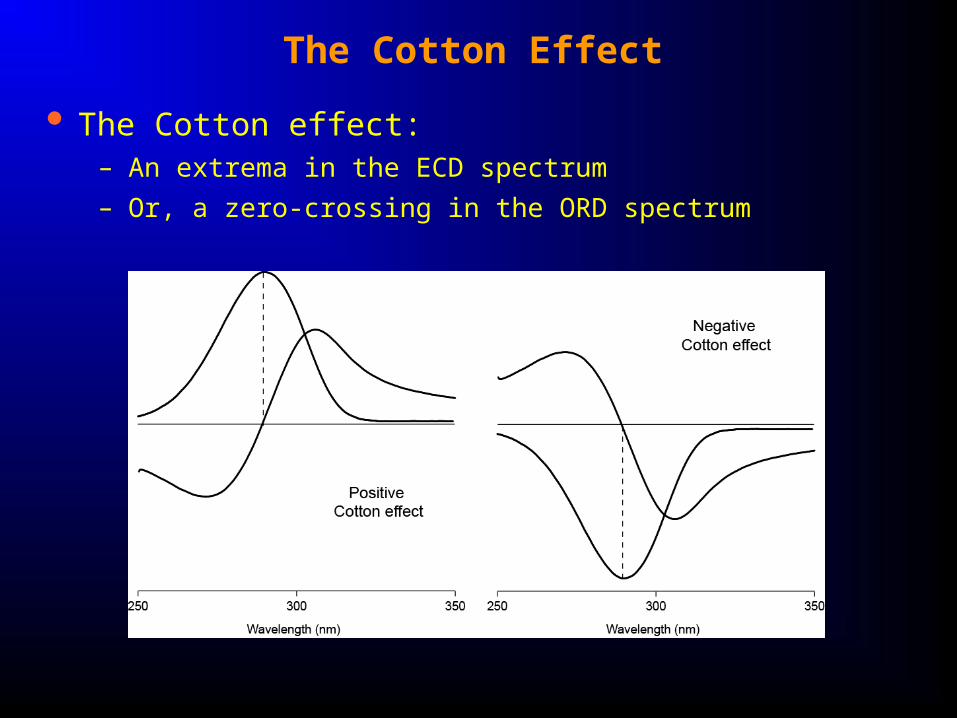
The Cotton Effect
The Cotton effect:– An extrema in the ECD spectrum
– Or, a zero-crossing in the ORD spectrum
Other Notes on Electronic Circular Dichroism
Background signals – UV absorbance that does not depend on the polarization constitutes the background (Dynamic Reserve).
DR = A/A = / = /(LPCL - RPCL)
is the molar absorptivity (cm-1 M-1)
A is absorption
DR values of 2 x10⁴ are possible
Electronic background suppression is almost always used instead of optical background suppression (technical design issues)
Elliptically Polarized Light
Combining left and right circularly polarized waves of unequal amplitudes = elliptically polarized light
Basis of ellipsometry – a surface analysis method used to study:
– Layer/film thickness
– Optical constants (refractive index and extinction coefficient)
– Surface roughness
– Composition
– Optical anisotropy
Further Reading
Optional:J. Cazes, Ed. Ewing’s Analytical Instrumentation Handbook, 3rd Edition, 2005, Marcel
Dekker, Chapters 5 and 6.
D. A. Skoog, F. J. Holler and S. R. Crouch, Principles of Instrumental Analysis, 6th Edition, 2006, Brooks-Cole, Chapters 13 and 14.
D. H. Williams and I. Fleming, “Spectroscopic Methods in Organic Chemistry”, McGraw-Hill (1966).
D. A. Lightner and J. E. Gurst, “Organic Conformational Analysis and Stereochemistry from Circular Dichroism Spectroscopy,” Wiley-VCH, 2000.