Embed Size (px)
Citation preview

American Mineralogist, Volume 97, pages 1505–1514, 2012
0003-004X/12/0809–1505$05.00/DOI: http://dx.doi.org/10.2138/am.2012.3957 1505
Molecular models of birnessite and related hydrated layered minerals
Randall T. Cygan,1,* JeffRey e. PosT,2 PeTeR J. Heaney,3 and James d. KubiCKi3
1Geochemistry Department, Sandia National Laboratories, Albuquerque, New Mexico 87185-0754, U.S.A.2Department of Mineral Sciences, Smithsonian Institution, Washington, D.C. 20560, U.S.A.
3Department of Geosciences, The Pennsylvania State University, University Park, Pennsylvania 16802, U.S.A.
absTRaCT
Birnessite and other charged layered manganese oxide minerals exhibit interlayers with variable cation-water behavior that controls many environmentally important cation exchange, adsorption, and redox processes. The occurrence of birnessite phases as fine-grained materials with corresponding high-surface areas makes them effective in controlling soil sediment and groundwater compositions, but difficult to structurally characterize using conventional analytical methods. Molecular simulations provide an alternative approach in which many details of bulk and interlayer structure can be ascertained to supplement and interpret the experimental findings. Classical and electronic structure methods are used to evaluate Na-, K-, and Ba-birnessite phases. Computational results compare favorably with structures obtained by synchrotron X-ray diffraction and difference electron Fourier mapping of the interlayer region. Based on the analysis of the 1 ns atomic trajectories, dynamics of water molecules is enhanced in the interlayer of K-birnessite relative to the limited motion of water molecules and cations in the other birnessite phases. Molecular dynamics simulations of ranciéite, a complex layered manganese oxide having octahedral vacancies, indicate multiple sites for Ca2+ in the interlayer. In ad-dition to manganese layer charge and layer structure, the hydration enthalpy for the interlayer cation affects the structure and dynamics of the interlayer in birnessite minerals.
Keywords: Birnessite, ranciéite, manganese, interlayer, water, hydration, molecular dynamics, DFT
inTRoduCTion
Birnessite-group minerals are the most common hydrated phyllomanganates and have a general formula of MXMn2O4⋅nH2O, where M is one or more interlayer cation species and Mn occurs in either tri- or tetravalent states, and they are typically found with a mean valency of +3.75 (Giovanoli et al. 1970; Post 1999; Gaillot et al. 2003; Johnson and Post 2006; Drits et al. 2007; Lopano et al. 2007). Birnessite minerals occur extensively as fine-grained phases in soils, sediments, marine nodules, and as mineral coatings. Having large surface areas and charged Mn layers, birnessite displays significant adsorption, cation exchange, and redox capacity. As a result, birnessite minerals can significantly affect the chemical composition of sediments and groundwater systems (Manceau and Charlet 1992; Paterson et al. 1994; Tu et al. 1994; Banerjee and Nesbitt 1999; Lopano et al. 2009; Zhao et al. 2009). Heavy metal and trace element mobility is strongly controlled by the presence of birnessite and other manganese oxide phases in the environment (Loganathan and Burau 1973; Nicholson and Eley 1997; Powell et al. 2006; Beak et al. 2008). Additionally, because of these unique proper-ties, natural and synthetic birnessite materials have been used in water purification, cation exchangers, catalysis, and batteries (Bach et al. 1996; Feng et al. 1999; Post 1999; Renuka and Ramamurthy 2000).
In this study, we demonstrate the ability of molecular simula-tion to accurately describe the general structure and behavior of
birnessite minerals. The fine-grained nature and atomic disorder of birnessite minerals limits the quality of structural information that can be extracted from most experimental and spectroscopic methods including those utilizing synchrotron X-ray radiation. Molecular simulation offers an opportunity to test and validate candidate models for bulk and interlayer structures of birnessite minerals and provides guidance in interpreting complicated dif-fraction and spectroscopic results. Moreover, especially for the interlayer species of birnessite where interlayer cations and water O atoms have similar X-ray scattering factors, molecular models normally incorporate explicit atomic identity that avoids compli-cations associated with partial occupancies, positional disorder, layer stacking disorder, poor crystallinity, and multiple domains.
Electronic structure calculations, primarily density functional theory (DFT) methods, have been recently used to evaluate the bulk structure of defective birnessite (Kwon et al. 2009) and the adsorption of metal contaminants onto external surfaces of the phase (Zhu et al. 2009; Kwon et al. 2010; Peña et al. 2010). Kwon et al. (2009) used spin-polarized DFT to examine the electronic states of birnessite having octahedral vacancies characteristic of biogenic birnessite phases and that can enhance adsorption behavior. A similar computational approach was incorporated by Kwon et al. (2010) to evaluate Pb2+ adsorption onto birnessite edges and by Peña et al. (2010) to compare edge site adsorption with the incorporation of Ni into the octahedral sheet. Zhu et al. (2009) used DFT and cluster models, with variable functional groups, to model pH effects on As3+ and As4+ adsorption onto birnessite surfaces.* E-mail: [email protected]

CYGAN ET AL.: MOLECULAR MODELS OF BIRNESSITE MINERALS1506
Although generally accurate in evaluating most electronic structures and local bonding phenomena, first-principle methods such as DFT are not necessarily practical for materials involv-ing long-range interactions and extended structures. It is often necessary to model relatively large simulation cells involving many hundreds or thousands of atoms to fully capture effects that ultimately can be computationally prohibitive. Also, DFT analysis of dynamical processes, such as those associated with interlayers and aqueous environments, requires ab initio mo-lecular dynamics or similar methods to capture thermally driven behavior. Moreover, the failure of most DFT methods to accu-rately model electronic dispersion limits the application of DFT to systems dominated by nonbonded interactions and hydrogen bonds (Frenkel and Smit 1996; Hamann 1997).
Alternatively, classical models based on empirical fitting of analytical expressions for potential energy as a function of atomic configuration can provide the necessary accuracy, once validated, to model the bulk structure of birnessite minerals and the behavior of the interlayer species. In particular, large-scale molecular dynamics (MD) simulations include the statistical thermodynamic sampling of the potential energy surface, by a very large number of atomic interactions, to provide an ac-curate description of structure and dynamics at environmental conditions. This study incorporates such classical simulations, involving several thousand atoms, to understand the complex dynamical behavior of several birnessite phases.
simulaTion meTHods
Mineral structures and molecular modelsMolecular models were prepared using the graphical interface of Materials Stu-
dio software (Accelrys 2010) and the Na-, K-, and Ba-birnessite structures of Lopano et al. (2007). Monoclinic unit cells were constructed and expanded to nominal 2 × 4 × 1 simulation cells with compositions of Na4Mn16O32⋅12H2O, K4Mn16O32⋅12H2O, and Ba2Mn16O32⋅12H2O. Hydrogen atoms were appended to the interlayer oxygen atoms to explicitly define water molecules. The molecular model supercells re-quire P1 symmetry and full site occupancy. The resulting defect-free models are consistent with the composition and water content of the synthetic Na-birnessite characterized by Post and Veblen (1990) and Post et al. (2002). The mixed valence states of manganese (Mn3+ and Mn4+) that are characteristic of birnessite minerals were initially assumed to be disordered throughout the layer with localized charge. Subsequent electronic structure analysis (see below) determined delocalization of the charge structure allowing manganese to be treated with a mean formal charge of +3.75, which is consistent with the Post and Veblen (1990), Post et al. (2002), and Zhao et al. (2009) analyses. Geometry-optimized structures based on the 2 × 4 × 1 cells (Fig. 1) were used to develop larger-scale supercells for subsequent MD simulation and analysis.
Molecular simulations were performed using the force field parameters of Clayff (Cygan et al. 2004), which has been used successfully in numerous simulations of hydrated mineral systems (e.g., Greathouse and Cygan 2006; Thyveetil et al. 2007; Ockwig et al. 2009; Tournassat et al. 2009; Kalinichev et al. 2010). Clayff uses primarily nonbonded interactions involving electrostatics and van der Waals terms to describe the potential energy in hydrated mineral systems for the interaction of two atoms i and j separated by a distance rij:
=π ∈
+ εσ
−
σ
Eq q e
r r r44ij
i j
ijij
ij
ij
ij
ij
2
0
12 6 (1)
where qi is the charge on atom i, e is the elementary charge on an electron, ∈0 is the permittivity of a vacuum, and εij and σij are the well depth and collision parameters for the Lennard-Jones potential energy.
Hydroxyl groups and water molecules are described by bonded interactions
based on the simple point charge (SPC) water model of Berendsen et al. (1981) incorporating bond stretching and bond bending, for water, as implemented by Teleman et al. (1987) as harmonic functions. Allowing for complete flexibility of all atoms without any constraints, Clayff provides an accurate and robust ap-proach for simulating clay minerals, layered double hydroxides, hydrated mineral surfaces, adsorption and intercalation processes, and other related minerals and interfacial phenomena.
The Clayff force field includes interaction parameters for several aqueous spe-cies, including Na+, K+, and Ba2+, that are compatible with the SPC water model (Åqvist 1990; Smith and Dang 1994; Koneshan et al. 1998). However, Clayff does not include parameters for manganese in octahedral or any other coordinating environment. Because of a lack of interaction potentials in the literature, we resort to using octahedral iron from Clayff (feo atom type) to represent manganese in the layer structure of birnessite. Octahedral Fe3+ has a low-spin ionic radius of 0.69 Å that is comparable to that observed for Mn3+ (0.72 Å) and Mn4+ (0.67 Å); radii for the high-spin states for both trivalent octahedral ions are also quite similar (Shan-non 1976). Following the partial charge convention of Clayff to better describe the covalent character of Mn-O bonds, we reduced the formal charge of the manganese atoms from +3.75 to +1.85, which is consistent with the partial charge for the O atoms in the layers of birnessite and provides the correct overall stoichiometry. It is important to recognize that Clayff, like most classical modeling methods, does not explicitly incorporate electronic effects like Jahn-Teller distortion or multiple spin states that are common to certain transition elements. Clayff effectively treats these phenomena through empirical fitting of the force field parameters to best fit end-member structures that may exhibit such electronic behavior.
A molecular model of ranciéite, a Ca-birnessite, was also developed to examine the behavior of interlayer calcium ion with manganese vacancies. Ranciéite is a defective birnessite with disordered vacancy sites in the manganese layer and has an ideal composition of Ca6Mn29o3O64⋅20H2O (Post and Appleman 1988; Ertl et al. 2005; Post et al. 2008). The model includes approximately 10% manganese vacan-cies randomly distributed across a 4 × 4 × 1 simulation cell originally based on the crystal refinement of Na-birnessite (Lopano et al. 2005). The partial charge for all manganese sites in the ranciéite model is +1.903, larger than that used for manga-nese in the non-defective birnessite models and that allows correct stoichiometry based on Clayff partial charges. The increased charge is consistent with a structure dominated by tetravalent manganese as interpreted by synchrotron X-ray diffraction of powder samples (Post et al. 2008). The recent study work of Zhao et al. (2009) provides insight on the average valence state of birnessite, especially as it relates to octahedral vacancies and heavy metal adsorption. Partial charges for layer O atoms and near-vacancy O atoms are equivalent although more advanced models for ranciéite should consider local charge effects and possible hydroxylation reactions.
Although only bulk structures of birnessite minerals are modeled in this study, it is important to recognize the contribution of edge sites to the enhanced adsorption of heavy metals onto birnessite surfaces (Banerjee and Nesbitt 1999; Villalobos
Fig. 1
figuRe 1. Orthographic views of the geometry-optimized structure of the nominal (2 × 4 × 1) simulation cell for Na-birnessite. Interlayer sodium ions are represented by green spheres, while manganese atoms are purple, oxygen atoms are red, and hydrogen atoms are white in stick representations.

CYGAN ET AL.: MOLECULAR MODELS OF BIRNESSITE MINERALS 1507
et al. 2005). Protonation and deprotonation of edge-site O atoms will depend on aqueous solution pH, and will ultimately control the availability of adsorption sites and the strength of the adsorbate-birnessite interaction. Similarly, protonation (hydroxylation) of O atoms at layer vacancy sites (e.g., ranciéite) will also affect adsorption of species on external basal surfaces and interaction of interlayer cations with the manganese layer (Appelo and Postma 1999; Peacock and Sherman 2007; Beak et al. 2008).
Molecular dynamics procedurePrior to MD simulation, molecular models were geometry-optimized allowing
all atoms and cell parameters to vary—constant pressure optimization—to obtain a fully relaxed structure at effectively 0 K. The nominal 2 × 4 × 1 cells (4 × 4 × 1 for ranciéite) were then equilibrated at 300 K and 0.1 MPa using MD in the NPT ensemble and the Forcite energy code (Accelrys 2010). A Nosé-Hoover thermostat (Nosé 1984) and Berendsen barostat (Berendsen et al. 1984) maintained isothermal and isobaric conditions, with a dynamics time step of 1 fs for a total simulation time of 150 ps. Atomic trajectories were used to derive basal d-spacings for the equilibrated structure to identify a representative structure based on the mean layer spacing. The structure was then converted to an orthogonal cell that was subsequently energy-optimized allowing a and b cell lengths (and all atoms) to relax, and then expanded to a 6 × 12 × 2 supercell (8 × 4 × 2 for ranciéite). The large cell was then equilibrated for 50 ps using a canonical ensemble (NVT) and ultimately expanded to 6 × 12 × 4 and 8 × 12 × 4 supercell for, respectively, the three birnessite and single ranciéite initial structures. Each birnessite simulation cell includes approximately 3200 atoms while the ranciéite cell is comprised of about 3800 atoms.
All subsequent MD simulations were performed with these large-scale models using the LAMMPS software (Plimpton 1995; Plimpton and Hendrickson 1996). Long-range electrostatics using LAMMPS were calculated every 1 fs using an efficient particle-particle particle-mesh summation algorithm (Plimpton and Hen-drickson 1996). Short-range interactions were evaluated every 0.5 fs with a real-space cutoff of 10.0 Å. An MD equilibration stage of 100 ps was initially simulated in the NVT ensemble, which was followed by a production stage of 1000 ps (1 ns) to generate an atomic trajectory for subsequent structural analysis.
Equilibrium was determined by monitoring system density, temperature, and structure as a function of simulated time. Typically, nominal birnessite models achieved steady state equilibrium within 50 ps of MD simulation time. A micro-canonical ensemble (NVE) was implemented for MD simulations of systems that did not initially achieve thermal equilibrium prior to NPT simulation. Large-scale models equilibrated within 50–75 ps of simulation time.
Density functional modelsDensity functional theory as implemented in the VASP software (Kresse and
Furthmuller 1996a, 1996b) was used to evaluate the valence state of Mn in Na-, K-, and Ba-birnessite. Ranciéite was not examined due to the practical limits of using DFT to model a large simulation cell that can capture the vacancy structure of this phase. Periodic planewave geometry optimizations were obtained for the nominal simulation cells using P1 symmetry at constant pressure conditions. The electronic structure convergence criterion was set to 1.0 × 10⁻⁴ eV and ionic posi-tions were relaxed until the energy gradients were less than 0.02 eV/Å. A standard set of projector-augmented wave (PAW) pseudopotentials (Blöchl 1994; Kresse and Joubert 1999) was used for the core electronic states with 3p/3d/4s electrons included as Mn valence electrons. For K and Ba, 3s/3p/4s and 5s/5p/6s electrons were mod-eled explicitly as valence electrons. For O and Na, the valence orbitals included the 2s/2p and 3s electrons, respectively. Exchange and correlation functionals were the Perdew-Burke-Ernzerhof (PBE) functionals (Perdew et al. 1996). DFT calculations were conducted with 800 eV planewave cutoff energies.
Charge analysis of the optimized birnessite structures was completed using the Wigner-Seitz radii method (Henkelman et al. 2006; Sanville et al. 2007) as implemented in VASP. Radii were selected to account for as close to 100% of the electronic charge as possible while keeping the charges on Na+, K+, and Ba2+ approximately equal to the formal charge. The radii selected were 0.5, 1.5, and 1.0 Å for H, O, and Mn, respectively. For interlayer ions Na+, K+, and Ba2+, the chosen radii were, respectively, 1.4, 1.5, and 1.6 Å. Although this charge analysis method is approximate, it is self-consistent. Because we are interested in compar-ing charges of Mn ions within the system, small errors in determining the charge are insignificant. For Na-birnessite simulations, the interlayer Na+ was evaluated in two configurations: constrained as an inner-sphere complex near the octahedral O surface and without constraint in the center plane of the interlayer coordinated symmetrically by H2O molecules.
ResulTs
Molecular dynamics simulationsResults of the molecular dynamics simulations for the Na-,
K-, and Ba-birnessite and ranciéite structures, using the nominal cells, are presented in Table 1. Lattice parameters are provided based on unit-cell values that can be directly compared to the Lopano et al. (2007) experimental results. Additionally, basal (001) d-spacing values are presented as derived from the lat-tice parameters. Basal d-spacings are particularly useful in the analysis of nano-sized materials such as birnessite and related clay minerals due to the limited long-range ordering in the stacking of the mineral layers along the c-axis and the resulting dominance of the (001) peak in the powder diffraction pattern. The d001 distance provides a practical measurement of interlayer expansion due to hydration and strength of the interlayer cation interaction with water and the birnessite layers. Table 1 also includes the equilibrium basal d-spacing value of 5.55 Å for a simulation of a fully dehydrated Na-birnessite representing a collapsed layer structure. This value compares well with the basal d-spacing of 5.3 Å measured by Post and Veblen (1990) from a transmission electron microscopy image of a dehydrated Na-birnessite. Unit-cell values for the a and b parameters are consistent (approximately 5% greater) with those determined in the synchrotron X-ray diffraction study of Lopano et al. (2007) for each of the birnessite structures. Theoretical mean basal d-spacings are accurate to within 3% for all but the K-birnessite, which is over-predicted by 6% and may be related to multiple hydration states of K+ or high-water content. The basal d-spacing for ranciéite has been determined to be 7.52 Å by synchrotron powder diffraction (Post et al. 2008). The 10% under-prediction of the layer spacing appears to be related to the disorder of Ca2+ relative to the octahedral vacancy sites.
Atomic trajectories stored during the molecular dynamics simulation provide a wealth of data for structural and dynamical analysis of the birnessite models. Figure 2 presents a snapshot of the equilibrated structure of Na-birnessite as obtained from the NVT simulation of the 6 × 12 × 4 supercell. Figure 3 pro-vides views of the nominal simulation cells for Na-birnessite and dehydrated Na-birnessite obtained from constant pressure geometry optimization. Results for the basal d-spacing of the same models obtained from NPT MD are also presented as a function of simulation time after equilibration. Snapshots of the supercells of equilibrated K-birnessite and Ba-birnessite are
Table 1. Structural data for birnessite phases derived from molecular dynamics
Na-birnessite K-birnessite Ba-birnessite Ranciéitea (Å) 5.32 5.30 5.30 5.26b 3.07 3.05 3.05 3.03c 7.17 7.79 7.81 6.99α (°) 90.0 92.8 111.2 102.3β 104.2 104.3 102.6 99.2γ 90.0 90.0 90.1 90.7Basal d-space (Å) 6.95 7.52 7.07 6.77St.dev. (Å) 0.05 0.06 0.06 0.06Dry basal d-space (Å) 5.55 Expt. basal d-space (Å) 7.14 7.09 7.09 7.52Note: Structural parameters derived from results for a 2 × 4 × 1 cell for birnessite and 4 × 4 × 1 cell for ranciéite.

CYGAN ET AL.: MOLECULAR MODELS OF BIRNESSITE MINERALS1508
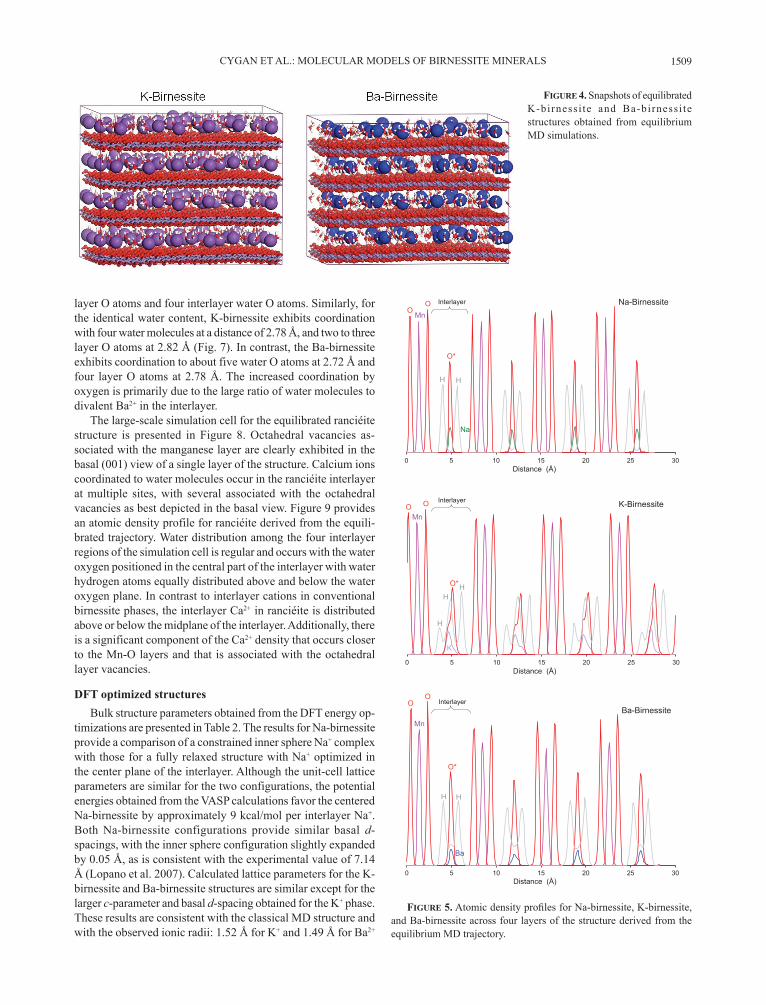
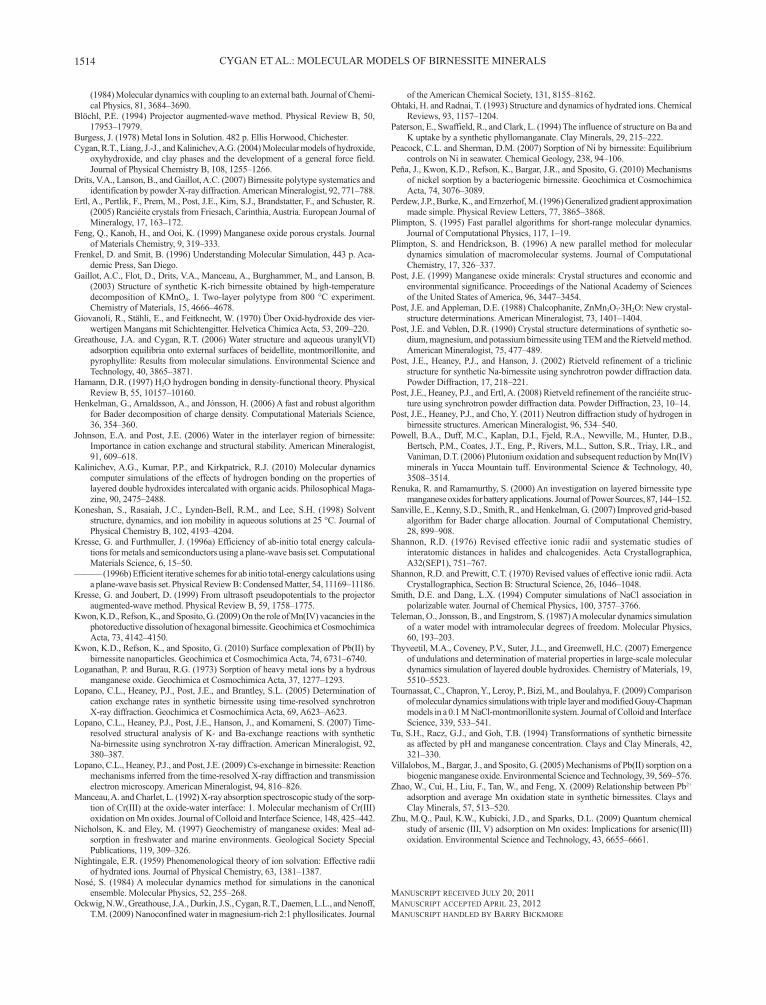
presented in Figure 4.Atomic density profiles, derived from the 1-ns trajectory
data, include structural details of the layer and interlayer compo-nents during the MD simulations. Figure 5 includes the density profiles normal to the layer structure of birnessite for the three interlayer cations. The four Mn-O octahedral layers are noted in each profile by the largest atomic densities while the interlayer
figuRe 2. Snapshot of equilibrated MD simulation cell for Na-birnessite comprised of four layers of the MnO6 octahedra and four interlayers of Na+-3H2O.
figuRe 3. Geometry-optimized structures of 2 × 4 × 1 supercell of Na-birnessite and dehydrated Na-birnessite with corresponding basal d-spacing values derived from subsequent MD simulations.
includes broader peaks associated with water molecules and the interlayer cation. The profile for the Na-birnessite exhibits the most symmetrical and regular distribution of atomic densities especially for Na+ and water molecules in the interlayer. The narrow density peaks for water O atoms, in particular, suggest a relatively restricted coordination with Na+ in the central plane of the interlayer. The K-birnessite exhibits an interlayer region that is expanded compared to Na-birnessite and includes a broad K+ peak that suggests a more disordered interlayer with multiple orientations for coordinating water molecules. The density profile for the Ba-birnessite is regular and symmetrical, and is similar to that obtained for the Na-birnessite. The density of Ba2+ occurs in the central plane of the interlayer but the positional disorder is distributed over a greater region than is observed for interlayer Na+.
Radial distribution functions (RDF) for each of the three in-terlayer cations in birnessite were derived for the large-scale MD simulations. Figure 6 includes RDFs and coordination numbers obtained from the analysis of the Na-birnessite trajectory. The dominant peak at 2.32 Å represents Na-water oxygen distances while the smaller peak at 2.78 Å accounts for Na-layer oxygen distances. The Na-water distance is consistent with sixfold co-ordination by water (Ohtaki and Radnai 1993) in a bulk aqueous environment. The coordination numbers for Na+ in birnessite suggest a similar sixfold environment but with two coordinating
CYGAN ET AL.: MOLECULAR MODELS OF BIRNESSITE MINERALS 1509
layer O atoms and four interlayer water O atoms. Similarly, for the identical water content, K-birnessite exhibits coordination with four water molecules at a distance of 2.78 Å, and two to three layer O atoms at 2.82 Å (Fig. 7). In contrast, the Ba-birnessite exhibits coordination to about five water O atoms at 2.72 Å and four layer O atoms at 2.78 Å. The increased coordination by oxygen is primarily due to the large ratio of water molecules to divalent Ba2+ in the interlayer.
The large-scale simulation cell for the equilibrated ranciéite structure is presented in Figure 8. Octahedral vacancies as-sociated with the manganese layer are clearly exhibited in the basal (001) view of a single layer of the structure. Calcium ions coordinated to water molecules occur in the ranciéite interlayer at multiple sites, with several associated with the octahedral vacancies as best depicted in the basal view. Figure 9 provides an atomic density profile for ranciéite derived from the equili-brated trajectory. Water distribution among the four interlayer regions of the simulation cell is regular and occurs with the water oxygen positioned in the central part of the interlayer with water hydrogen atoms equally distributed above and below the water oxygen plane. In contrast to interlayer cations in conventional birnessite phases, the interlayer Ca2+ in ranciéite is distributed above or below the midplane of the interlayer. Additionally, there is a significant component of the Ca2+ density that occurs closer to the Mn-O layers and that is associated with the octahedral layer vacancies.
DFT optimized structuresBulk structure parameters obtained from the DFT energy op-
timizations are presented in Table 2. The results for Na-birnessite provide a comparison of a constrained inner sphere Na+ complex with those for a fully relaxed structure with Na+ optimized in the center plane of the interlayer. Although the unit-cell lattice parameters are similar for the two configurations, the potential energies obtained from the VASP calculations favor the centered Na-birnessite by approximately 9 kcal/mol per interlayer Na+. Both Na-birnessite configurations provide similar basal d-spacings, with the inner sphere configuration slightly expanded by 0.05 Å, as is consistent with the experimental value of 7.14 Å (Lopano et al. 2007). Calculated lattice parameters for the K-birnessite and Ba-birnessite structures are similar except for the larger c-parameter and basal d-spacing obtained for the K+ phase. These results are consistent with the classical MD structure and with the observed ionic radii: 1.52 Å for K+ and 1.49 Å for Ba2+
Fig. 4
figuRe 4. Snapshots of equilibrated K-birnessi te and Ba-birnessi te structures obtained from equilibrium MD simulations.
figuRe 5. Atomic density profi les for Na-birnessite, K-birnessite, and Ba-birnessite across four layers of the structure derived from the equilibrium MD trajectory.
0 5 10 15 20 25 30
O*
Mn
H
OO
H
Na
Distance (Å)
Interlayer Na-Birnessite
0 5 10 15 20 25 30
O*
MnO O
H
K
Distance (Å)
Interlayer
H
H
K-Birnessite
0 5 10 15 20 25 30Distance (Å)
O*
Mn
OO
Ba
Interlayer
H H
Ba-Birnessite

CYGAN ET AL.: MOLECULAR MODELS OF BIRNESSITE MINERALS1510
in octahedral coordination (Shannon and Prewitt 1970; Shannon 1976). In contrast, the Lopano et al. (2007) experimental data indicate an identical basal d-spacing for both K- and Ba-birnessite phases, observed at 7.09 Å. DFT results for the Ba-birnessite suggest that the divalent cation and hydrogen bonded water molecules locally distort the planar configuration of basal O atoms, which is not observed in the K-birnessite.
Cation-water distances derived from the DFT energy mini-mizations are listed in Table 3. Coordination numbers and bond distances closely track those derived from experimental X-ray studies of hydrated cations as compiled by Ohtaki and Radnai (1993). These results suggest that the DFT calculations are pro-viding reasonable predictions of cation coordination polyhedra and that the interatomic distances do not change dramatically from what is observed in aqueous electrolyte solutions. The av-erage cation to bridging oxygen distance is 0.1 to 0.3 Å longer than the corresponding cation-water oxygen distance suggest-ing that water molecules form stronger bonds and contribute significantly to the enthalpy of birnessite minerals, consistent with the classical MD results.
Charge analysis of the manganese atoms derived from the electronic structures of the three optimized birnessite compounds
indicates a consistent distribution of equal charge residing on all of the manganese atoms. A residual charge of +2.74 (±0.01) is calculated for each of the manganese in Na-birnessite based on the contribution of 10.26 electrons of the 13 valence electrons for each manganese atom among the s, p, and d orbitals of the molecular electronic structure. These results clearly demonstrate the delocalization of electron charge for manganese and validate the use of equivalent charges for all manganese in the classical modeling using Clayff. This manganese charge is scaled by about 30% in the molecular simulations to be consistent with the birnessite stoichiometry and the oxygen partial charges of Clayff (Cygan et al. 2004). It should be noted that biogenic birnessite having significant octahedral vacancies may not exhibit such delocalization of the manganese electrons (Kwon et al. 2009).
disCussion
Results derived from MD trajectory analysis indicate that the interlayer structure of birnessite is strongly dependent on the interlayer cation, as was also observed in the synchrotron X-ray diffraction study of Lopano et al. (2007). The basal d-spacings (Table 1) demonstrate that, for a given water content, the expan-sion of the interlayer defined by the octahedral Mn-O layers depends on the charge and size of the cation. Alternatively, one can compare hydration energies of the three different interlayer cations to interpret this expansion. The enthalpy of hydration for Na+ is –96.7 and –76.7 kcal/mol for K+, while the divalent
0
5
10
15
20
0 1 2 3 4 5 6
Inte
nsity
Distance (Å)
Na-Ow
Na-O
CNw =4
CNO =2
figuRe 6. Radial distribution function and coordination numbers for sodium ions in the interlayer of Na-birnessite obtained from equilibrium MD trajectory.
0
2
4
6
8
10
12
14
16
1.0 1.5 2.0 2.5 3.0 3.5 4.0
Inte
nsity
Distance (Å)
Ba-BirnessiteK-BirnessiteNa-Birnessite Na-O
Na-Ow
Ba-O
K-O
Ba-Ow
K-Ow
figuRe 7. Radial distribution functions for the local structure of the interlayer cation with coordinating layer O atoms (O) and interlayer water O atoms (Ow) derived from equilibrium MD trajectories.
figuRe 8. Snapshot from equilibrium MD trajectory showing two views of the ranciéite simulation cell comprised of four layers of the MnO6 octahedra and four interlayers of Ca2+-3.33H2O. The upper image is for a view of a single manganese layer and two interlayers normal to the basal plane and depicts calcium ions mostly associated with the octahedral vacancies in the layer.
(010)
(001)
Fig. 8

CYGAN ET AL.: MOLECULAR MODELS OF BIRNESSITE MINERALS 1511
Ba2+ exhibits a significantly greater hydration enthalpy of –311.4 kcal/mol (Burgess 1978). Rather than compare the hydration sphere geometries of the solvated cation complexes (Lopano et al. 2007), it is helpful to reconcile the structures through the hydration enthalpies and the potential energies sampled through MD simulations.
Sodium birnessite represents the most-ordered interlayer environment of the structures simulated in this study. The rela-tively weak hydration energy of Na+ is dominated by the stronger electrostatics interactions between the negatively charged Mn-O layers and the positive Na+. Sodium cations occur exclusively in the central plane of the interlayer (Figs. 1 and 5) being co-ordinated by interlayer water O atoms and layer O atoms. This energetically favored configuration leads to a relatively compact and ordered interlayer structure. Hydrogen bonds occur between H atoms of the interlayer water molecules and the layer O at-oms. Potassium birnessite exhibits a less-developed interlayer structure in comparison to Na-birnessite, although the Na+ and
K+ hydration enthalpies differ by only 20 kcal/mol. Based on the atomic density profiles, K-birnessite exhibits positional disorder of K+ and the coordinating water molecules. This behavior is observed for each of the four interlayers associated with the large-scale simulation cell. As a result, the hydrogen bonding between water and layer O atoms is less developed and the interlayer is expanded.
Although Ba2+ possesses a large ionic radius of 1.49 Å (Shan-non 1976) and a hydration radius of 4.0 Å (Nightingale 1959), the structure for Ba-birnessite derived from simulation exhibits a mean basal d-spacing of 7.07 Å, which is not much different from that observed (6.95 Å) for Na-birnessite (Table 1). The relatively ordered interlayer structure of Ba-birnessite (Fig. 5) exhibits a slight broadening of the Ba2+ density peak compared to the Na+ results, and Ba2+ is clearly positioned in the central plane of the interlayer. The water molecules appear strongly ordered in coordination about Ba2+ as expected for a divalent cation with a large hydration enthalpy.
Ranciéite exhibits a significantly different interlayer structure due to the octahedral vacancies in the manganese layer and the relatively large hydration enthalpy of –380.6 kcal/mol for Ca2+ (Burgess 1978). The ordered distribution of water O atoms in the interlayer, as determined by MD simulation, is consistent with the Rietveld refinement of Post et al. (2008). Mean distance for Ca2+-Owater from simulation is 2.38 Å, compared with the experi-mental value of 2.24 Å (Post et al. 2008). Simulations indicate a vertical arrangement of the water molecules in the interlayer with hydrogen bonding developed between the water H atoms and the layer O atoms. Approximately half of the interlayer Ca2+ is observed directly associated with the octahedral vacancies due to the electrostatic interaction of the divalent cation with the effective negative charge of the vacancy. A mean distance of 2.32 Å for the Ca2+-Olayer is obtained from the MD simulations although this value is high compared to the 2.07 Å observed experimentally (Post et al. 2008). However, the authors suggest that the Ca-O distance is unreasonably short because of positional disorder associated with the Ca and O. Competition in stabilizing Ca2+ in the site near the layer vacancy or through hydration in the interlayer drives the overall equilibration and potential energy of the ranciéite system.
The complex interplay of stabilizing interactions—includ-ing cation-layer electrostatics, cation hydration, water-water interactions, and hydrogen bonding—are important aspects in understanding the structures and behaviors of birnessite miner-als. Molecular dynamics simulations provide an opportunity to investigate these interactions especially with regard to the dynamical aspects of water in the interlayer and how water interactions facilitate cation exchange. In this effort, the atomic trajectories for the equilibrated birnessite cells were analyzed to obtain contour maps of the interlayer species. Trajectories were examined, over the 1 ns simulation period, by extracting atomic densities for each of the interlayer atoms to obtain a 50 × 50 spatial array of approximately 0.5 Å2 bins and cover a single interlayer region for each birnessite cell. The resulting contour maps are presented in Figure 10 for Na-, K-, and Ba-birnessite and in Figure 11 for ranciéite.
Each atomic density contour map exhibits the coordination, and spatial variation of coordination, of interlayer cation with
0 5 10 15 20 25 30Distance (Å)
O*
Mn
O
O
Ca
Interlayer
H H
Ranciéite
figuRe 9. Atomic density profi les for ranciéite across four layers of the structure derived from the equilibrium MD trajectory.
Table 3. Coordination number and average bond distances for cations in birnessite from DFT optimization
Na-birnessite K-birnessite Ba-birnessite Inner sphere Centered Na+ Na+
Coordination number 5.0 5.5 6.0 9.0Experimental value* ~6 ~6 ~9.5
Distance (Å)Cation-bridging oxygen 2.49 2.62 2.85 2.92Cation-water oxygen 2.31 2.31 2.75 2.83Experimental value* 2.4 2.8 2.9* Ohtaki and Radnai (1993).
Table 2. Structural data for birnessite phases derived from DFT optimization
Na-birnessite K-birnessite Ba-birnessite Inner sphere Centered Na+ Na+
a (Å) 4.99 4.98 4.98 5.27b 3.84 3.83 3.82 4.05c 7.31 7.28 7.94 7.43α (°) 90.6 90.4 93.0 99.2β 102.2 103.3 103.3 101.3γ 89.9 89.7 90.0 90.1Basal d-space (Å) 7.14 7.09 7.71 7.19Expt. basal d-space (Å) 7.14 7.14 7.09 7.09

CYGAN ET AL.: MOLECULAR MODELS OF BIRNESSITE MINERALS1512
water molecules. Hydrogen contours (light gray contour lines) assist in evaluating the direction of the water dipole especially for the more ordered and vertically disposed interlayer configura-tions associated with Na- and Ba-birnessite phases. The contour map for Na-birnessite indicates a relatively dense contour for Na+ sites that are typically coordinated by four and, occasionally, five water molecules (cf. Fig. 6). For the simulation time period, Na+ is effectively static showing minimal positional disorder across the simulation cell, and similar behavior, as expected, is observed for coordinating water molecules. Barium birnessite exhibits a similar interlayer contour map that, in this case, due to the divalent cation, includes more water-water interactions. There is limited water hopping within the Ba-birnessite interlayer as indicated by the diffuse contour lines for water oxygen, which occurs near relatively close Ba2+-Ba2+ interactions.
Density contours for the K-birnessite simulation are in marked contrast to the relatively static behavior observed for Na- and Ba-birnessite examples. Water oxygen contours are significantly diffuse throughout much of the interlayer region as are the corresponding hydrogen contours. The diffuse nature of oxygen contours represents sizable dynamics and transport of water molecules in the interlayer. Multiple diffusion pathways for water among K+ sites are clearly indicated in the K-birnes-site contour map of Figure 10. Isolated domains of relatively static K+ occur with water oxygen contours exhibiting limited or local dynamics. In comparison to the restricted cation motions exhibited in the Na- and Ba-birnessite examples, interlayer K+ contours indicate more dynamical motion that appears fairly anisotropic in the a- and b-dimensions and correlated with the water dynamics; no cation diffusion is observed in any of the MD simulations. Again, the relatively low-hydration enthalpy for K+ controls much of this dynamical behavior. While hydrogen bonding exists in all birnessite MD simulations, the nature of hydrogen bonding in the K-birnessite interlayer is somewhat unique in that a significant fraction of hydrogen bonding occurs in the central plane of the interlayer and not primarily at the water-layer oxygen interface.
Figure 10 includes insets of difference electron Fourier (DELF) maps of the birnessite interlayer obtained by Lopano et al. (2007) using synchrotron X-ray diffraction of cation ex-change reactions with synthetic Na-birnessite. DELF maps have been rescaled and positioned to be spatially consistent with the simulated contour maps generated by MD. The Na-birnessite DELF map represents the initial conditions prior to exchange with 0.01 M KCl or BaCl2 aqueous solutions; the K-birnessite and Ba-birnessite DELF maps were obtained after 228 and 142 min of treatment, respectively. Although the Rietveld refinements and experimental DELF contours make no discrimination among interlayer cation and water O atoms due to similarities in X-ray scattering factors, the MD simulations allow explicit assignments of atom types to clearly identify contributing atomic components
figuRe 11. Contour map of interlayer species for ranciéite derived from equilibrium MD trajectory. Dark green contours represent Ca2+ ions. Water O atoms are indicated by dark blue contours and H atoms by gray contours.
Fig. 10
figuRe 10. Contour maps of interlayer species for Na-birnessite (Na+ = green), K-birnessite (K+ = pink), and Ba-birnessite (Ba2+ = light blue) derived from equilibrium MD trajectories. Water O atoms are indicated by dark blue contours and H atoms by gray contours. Experimental DELF X-ray maps of the interlayer region are overlayed onto the simulation data. The X-ray maps represent a roughly sixfold expanded region of the original averaged data.
Fig. 11

CYGAN ET AL.: MOLECULAR MODELS OF BIRNESSITE MINERALS 1513
in the contour maps. The positional ordering observed experi-mentally for Na-birnessite is clearly reproduced in the MD results of Figure 10, especially considering the small domain represented by the large-scale simulation cell in comparison with the long-range averaging of the experimental data over micrometer-sized materials. It is important to note that the experimental DELF maps, as presented in the figure insets, represent a sixfold sym-metrically expanded region of the original averaged data.
Experimental diffraction results for K-birnessite indicate a continuous rotation of the electron density ellipsoids with in-creased K+ exchange for Na+ resulting in the general anisotropic diffraction ellipsoids being aligned along the a-axis (Lopano et al. 2007). There is some supporting evidence of this alignment for both K+ and water O atoms from the MD simulation but only for the relatively stable K+-nH2O coordinations. A large proportion of the water O atoms are being transported during the simulation period and their diffuse contour signatures have not established a preferred orientation. In contrast, the DELF map for Ba-birnessite exhibits significant splitting during cation exchange that is interpreted by Lopano et al. (2007) as positional disordering during the exchange of Ba2+ for Na+. The theoretical atomic density map provides a snapshot of a possible configura-tion of cation-water distribution during the continuous exchange process. In general, MD simulations support an interpretation that cation exchange for birnessite proceeds through transport of interlayer cations rather than a dissolution-precipitation process that involves the coexistence of end-member phases.
Recently, Post et al. (2011) reported H atom positions for synthetic Na- and K-birnessites, using Rietveld refinements and powder neutron diffraction data. The study revealed that in Na-birnessite H atom positions are located about 1 Å above and below the central plane in the interlayer region, and the water molecules are oriented vertically with H atoms directed toward layer O atoms. This result agrees well with the MD-derived atomic density profiles in Figure 5, discussed above, for Na-birnessite that show narrow H density peaks also about 1 Å on either side of the centrally located water/Na position, and with the model orientations of the water molecules shown in Figure 3. The neutron study shows that the interlayer water molecules in K-birnessite are oriented such that one of the H atom posi-tions is pointed approximately toward the layer O and the other is directed within the interlayer central region containing the water/K positions. Again, this result is consistent with the ori-entations of the water molecules in Figure 4 and atomic density profiles in Figure 5 that exhibit H atom profiles for K-birnessite within, and above and below, the interlayer central plane. The broader H profiles in Figure 5 also explain the more diffuse neutron scattering density peaks observed in Fourier difference maps by Post et al. (2011) for H in K-birnessite compared to that of Na-birnessite.
In contrast to the conventional birnessite minerals, ranciéite exhibits atomic contour maps (Fig. 11) with a more open network of water molecules, and the water noticeably associated with the interlayer cations. Although diffuse water oxygen contours are observed, water transport is exhibited but localized to single hydration spheres of the Ca2+. High-density contours for Ca2+ indicate a static localized behavior for the interlayer cations where the large hydration energy for Ca2+ controls much of the
water behavior and overall dynamics in the interlayer.Results from molecular simulations of birnessite and ran-
ciéite suggest a complex and dynamic interlayer structure that is controlled by the interaction of cations with water and with the manganese layer. Density functional theory and electronic structure calculations of nominal-sized simulation cells of birnes-site indicate delocalizaton of electrons among manganese atoms, and a bulk structure that is consistent with classical models using Clayff force field. Although there is some disagreement with experimental basal d-spacing, particularly for K-birnessite, both computational methods provide models that are generally consistent with experiment and hydration thermodynamics. Classical MD simulations of large-scale models of birnessite allow flexibility in evaluating interlayer structure and behavior that are prevented by practical limits in simulation cell size using DFT methods. The complex structure of ranciéite, for example, including multiple Ca2+ sites (and their disorder) and manganese vacancies, can be fully captured in the large-scale MD simulations.
Development of accurate molecular models to predict the structure and behavior of complex hydrated minerals is a chal-lenge in modern mineralogy. Results from recent analytical and experimental investigations of birnessite minerals, in particular, provide an opportunity to apply computational chemistry meth-ods to interpret experimental findings and provide a molecular basis for evaluating interlayer structure and understanding cation exchange processes. Future large-scale classical MD or ab initio MD investigations of water confinement in phases like birnessite and clay minerals may better elucidate these important environmental processes.
aCKnowledgmenTsThe authors acknowledge the expertise of Justin Durkin in the analysis of the
many gigabytes of data associated with the MD trajectories. The senior author is grateful for the funding and long-term support provided by the Geosciences Research Program of the U.S. Department of Energy, Office of Basic Energy Sci-ences. Sandia National Laboratories is a multi-program laboratory managed and operated by Sandia Corporation, a wholly owned subsidiary of Lockheed Martin Corporation, for the U.S. Department of Energy’s National Nuclear Security Ad-ministration under contract DE-AC04-94AL85000. Jeffrey Post and Peter Heaney were supported by funds from NSF grant EAR07-45374. James Kubicki was supported by the Center for Environmental Kinetics (CEKA, CHE-0431328), an NSF-DOE environmental molecular sciences institute. Computational support for DFT calculations was provided by CEKA and the Research and Cyberinfrastructure Center at The Pennsylvania State University.
RefeRenCes CiTedAccelrys (2010) Materials Stuido, Release Accelrys Software Inc., San Diego.Appelo, C.A.J. and Postma, D. (1999) A consistent model for surface complexation
on birnessite (-MnO2) and its application to a column experiment. Geochimica et Cosmochimica Acta, 63, 3039–3048.
Åqvist, J. (1990) Ion-water interaction potentials derived from free energy perturba-tion simulations. Journal of Physical Chemistry, 94, 8021–8024.
Bach, S., PereiraRamos, J.P., and Baffier, N. (1996) Rechargeable 3 V Li cells using hydrated lamellar manganese oxide. Journal of the Electrochemical Society, 143, 3429–3434.
Banerjee, D. and Nesbitt, H.W. (1999) Oxidation of aqueous Cr(III) at birnessite surfaces: Constraints on reaction mechanism. Geochimica et Cosmochimica Acta, 63, 1671–1687.
Beak, D.G., Basta, N.T., Scheckel, K.G., and Traina, S.J. (2008) Linking solid phase speciation of Pb sequestered to birnessite to oral Pb bioaccessibility: Implications for soil remediation. Environmental Science and Technology, 42, 779–785.
Berendsen, H.J.C., Postma, J.P.M., van Gunsteren, W.F., and Hermans, J. (1981) Interaction models for water in relation to protein hydration. In B. Pullman, Ed., Intermolecular Forces, p. 331–342. D. Reidel, Dordrecht.
Berendsen, H.J.C., Postma, J.P.M., Vangunsteren, W.F., Dinola, A., and Haak, J.R.
CYGAN ET AL.: MOLECULAR MODELS OF BIRNESSITE MINERALS1514
(1984) Molecular dynamics with coupling to an external bath. Journal of Chemi-cal Physics, 81, 3684–3690.
Blöchl, P.E. (1994) Projector augmented-wave method. Physical Review B, 50, 17953–17979.
Burgess, J. (1978) Metal Ions in Solution. 482 p. Ellis Horwood, Chichester.Cygan, R.T., Liang, J.-J., and Kalinichev, A.G. (2004) Molecular models of hydroxide,
oxyhydroxide, and clay phases and the development of a general force field. Journal of Physical Chemistry B, 108, 1255–1266.
Drits, V.A., Lanson, B., and Gaillot, A.C. (2007) Birnessite polytype systematics and identification by powder X-ray diffraction. American Mineralogist, 92, 771–788.
Ertl, A., Pertlik, F., Prem, M., Post, J.E., Kim, S.J., Brandstatter, F., and Schuster, R. (2005) Ranciéite crystals from Friesach, Carinthia, Austria. European Journal of Mineralogy, 17, 163–172.
Feng, Q., Kanoh, H., and Ooi, K. (1999) Manganese oxide porous crystals. Journal of Materials Chemistry, 9, 319–333.
Frenkel, D. and Smit, B. (1996) Understanding Molecular Simulation, 443 p. Aca-demic Press, San Diego.
Gaillot, A.C., Flot, D., Drits, V.A., Manceau, A., Burghammer, M., and Lanson, B. (2003) Structure of synthetic K-rich birnessite obtained by high-temperature decomposition of KMnO4. I. Two-layer polytype from 800 °C experiment. Chemistry of Materials, 15, 4666–4678.
Giovanoli, R., Stähli, E., and Feitknecht, W. (1970) Über Oxid-hydroxide des vier-wertigen Mangans mit Schichtengitter. Helvetica Chimica Acta, 53, 209–220.
Greathouse, J.A. and Cygan, R.T. (2006) Water structure and aqueous uranyl(VI) adsorption equilibria onto external surfaces of beidellite, montmorillonite, and pyrophyllite: Results from molecular simulations. Environmental Science and Technology, 40, 3865–3871.
Hamann, D.R. (1997) H2O hydrogen bonding in density-functional theory. Physical Review B, 55, 10157–10160.
Henkelman, G., Arnaldsson, A., and Jónsson, H. (2006) A fast and robust algorithm for Bader decomposition of charge density. Computational Materials Science, 36, 354–360.
Johnson, E.A. and Post, J.E. (2006) Water in the interlayer region of birnessite: Importance in cation exchange and structural stability. American Mineralogist, 91, 609–618.
Kalinichev, A.G., Kumar, P.P., and Kirkpatrick, R.J. (2010) Molecular dynamics computer simulations of the effects of hydrogen bonding on the properties of layered double hydroxides intercalated with organic acids. Philosophical Maga-zine, 90, 2475–2488.
Koneshan, S., Rasaiah, J.C., Lynden-Bell, R.M., and Lee, S.H. (1998) Solvent structure, dynamics, and ion mobility in aqueous solutions at 25 °C. Journal of Physical Chemistry B, 102, 4193–4204.
Kresse, G. and Furthmuller, J. (1996a) Efficiency of ab-initio total energy calcula-tions for metals and semiconductors using a plane-wave basis set. Computational Materials Science, 6, 15–50.
——— (1996b) Efficient iterative schemes for ab initio total-energy calculations using a plane-wave basis set. Physical Review B: Condensed Matter, 54, 11169–11186.
Kresse, G. and Joubert, D. (1999) From ultrasoft pseudopotentials to the projector augmented-wave method. Physical Review B, 59, 1758–1775.
Kwon, K.D., Refson, K., and Sposito, G. (2009) On the role of Mn(IV) vacancies in the photoreductive dissolution of hexagonal birnessite. Geochimica et Cosmochimica Acta, 73, 4142–4150.
Kwon, K.D., Refson, K., and Sposito, G. (2010) Surface complexation of Pb(II) by birnessite nanoparticles. Geochimica et Cosmochimica Acta, 74, 6731–6740.
Loganathan, P. and Burau, R.G. (1973) Sorption of heavy metal ions by a hydrous manganese oxide. Geochimica et Cosmochimica Acta, 37, 1277–1293.
Lopano, C.L., Heaney, P.J., Post, J.E., and Brantley, S.L. (2005) Determination of cation exchange rates in synthetic birnessite using time-resolved synchrotron X-ray diffraction. Geochimica et Cosmochimica Acta, 69, A623–A623.
Lopano, C.L., Heaney, P.J., Post, J.E., Hanson, J., and Komarneni, S. (2007) Time-resolved structural analysis of K- and Ba-exchange reactions with synthetic Na-birnessite using synchrotron X-ray diffraction. American Mineralogist, 92, 380–387.
Lopano, C.L., Heaney, P.J., and Post, J.E. (2009) Cs-exchange in birnessite: Reaction mechanisms inferred from the time-resolved X-ray diffraction and transmission electron microscopy. American Mineralogist, 94, 816–826.
Manceau, A. and Charlet, L. (1992) X-ray absorption spectroscopic study of the sorp-tion of Cr(III) at the oxide-water interface: 1. Molecular mechanism of Cr(III) oxidation on Mn oxides. Journal of Colloid and Interface Science, 148, 425–442.
Nicholson, K. and Eley, M. (1997) Geochemistry of manganese oxides: Meal ad-sorption in freshwater and marine environments. Geological Society Special Publications, 119, 309–326.
Nightingale, E.R. (1959) Phenomenological theory of ion solvation: Effective radii of hydrated ions. Journal of Physical Chemistry, 63, 1381–1387.
Nosé, S. (1984) A molecular dynamics method for simulations in the canonical ensemble. Molecular Physics, 52, 255–268.
Ockwig, N.W., Greathouse, J.A., Durkin, J.S., Cygan, R.T., Daemen, L.L., and Nenoff, T.M. (2009) Nanoconfined water in magnesium-rich 2:1 phyllosilicates. Journal
of the American Chemical Society, 131, 8155–8162.Ohtaki, H. and Radnai, T. (1993) Structure and dynamics of hydrated ions. Chemical
Reviews, 93, 1157–1204.Paterson, E., Swaffield, R., and Clark, L. (1994) The influence of structure on Ba and
K uptake by a synthetic phyllomanganate. Clay Minerals, 29, 215–222.Peacock, C.L. and Sherman, D.M. (2007) Sorption of Ni by birnessite: Equilibrium
controls on Ni in seawater. Chemical Geology, 238, 94–106.Peña, J., Kwon, K.D., Refson, K., Bargar, J.R., and Sposito, G. (2010) Mechanisms
of nickel sorption by a bacteriogenic birnessite. Geochimica et Cosmochimica Acta, 74, 3076–3089.
Perdew, J.P., Burke, K., and Ernzerhof, M. (1996) Generalized gradient approximation made simple. Physical Review Letters, 77, 3865–3868.
Plimpton, S. (1995) Fast parallel algorithms for short-range molecular dynamics. Journal of Computational Physics, 117, 1–19.
Plimpton, S. and Hendrickson, B. (1996) A new parallel method for molecular dynamics simulation of macromolecular systems. Journal of Computational Chemistry, 17, 326–337.
Post, J.E. (1999) Manganese oxide minerals: Crystal structures and economic and environmental significance. Proceedings of the National Academy of Sciences of the United States of America, 96, 3447–3454.
Post, J.E. and Appleman, D.E. (1988) Chalcophanite, ZnMn3O7⋅3H2O: New crystal-structure determinations. American Mineralogist, 73, 1401–1404.
Post, J.E. and Veblen, D.R. (1990) Crystal structure determinations of synthetic so-dium, magnesium, and potassium birnessite using TEM and the Rietveld method. American Mineralogist, 75, 477–489.
Post, J.E., Heaney, P.J., and Hanson, J. (2002) Rietveld refinement of a triclinic structure for synthetic Na-birnessite using synchrotron powder diffraction data. Powder Diffraction, 17, 218–221.
Post, J.E., Heaney, P.J., and Ertl, A. (2008) Rietveld refinement of the ranciéite struc-ture using synchrotron powder diffraction data. Powder Diffraction, 23, 10–14.
Post, J.E., Heaney, P.J., and Cho, Y. (2011) Neutron diffraction study of hydrogen in birnessite structures. American Mineralogist, 96, 534–540.
Powell, B.A., Duff, M.C., Kaplan, D.I., Fjeld, R.A., Newville, M., Hunter, D.B., Bertsch, P.M., Coates, J.T., Eng, P., Rivers, M.L., Sutton, S.R., Triay, I.R., and Vaniman, D.T. (2006) Plutonium oxidation and subsequent reduction by Mn(IV) minerals in Yucca Mountain tuff. Environmental Science & Technology, 40, 3508–3514.
Renuka, R. and Ramamurthy, S. (2000) An investigation on layered birnessite type manganese oxides for battery applications. Journal of Power Sources, 87, 144–152.
Sanville, E., Kenny, S.D., Smith, R., and Henkelman, G. (2007) Improved grid-based algorithm for Bader charge allocation. Journal of Computational Chemistry, 28, 899–908.
Shannon, R.D. (1976) Revised effective ionic radii and systematic studies of interatomic distances in halides and chalcogenides. Acta Crystallographica, A32(SEP1), 751–767.
Shannon, R.D. and Prewitt, C.T. (1970) Revised values of effective ionic radii. Acta Crystallographica, Section B: Structural Science, 26, 1046–1048.
Smith, D.E. and Dang, L.X. (1994) Computer simulations of NaCl association in polarizable water. Journal of Chemical Physics, 100, 3757–3766.
Teleman, O., Jonsson, B., and Engstrom, S. (1987) A molecular dynamics simulation of a water model with intramolecular degrees of freedom. Molecular Physics, 60, 193–203.
Thyveetil, M.A., Coveney, P.V., Suter, J.L., and Greenwell, H.C. (2007) Emergence of undulations and determination of material properties in large-scale molecular dynamics simulation of layered double hydroxides. Chemistry of Materials, 19, 5510–5523.
Tournassat, C., Chapron, Y., Leroy, P., Bizi, M., and Boulahya, F. (2009) Comparison of molecular dynamics simulations with triple layer and modified Gouy-Chapman models in a 0.1 M NaCl-montmorillonite system. Journal of Colloid and Interface Science, 339, 533–541.
Tu, S.H., Racz, G.J., and Goh, T.B. (1994) Transformations of synthetic birnessite as affected by pH and manganese concentration. Clays and Clay Minerals, 42, 321–330.
Villalobos, M., Bargar, J., and Sposito, G. (2005) Mechanisms of Pb(II) sorption on a biogenic manganese oxide. Environmental Science and Technology, 39, 569–576.
Zhao, W., Cui, H., Liu, F., Tan, W., and Feng, X. (2009) Relationship between Pb2+ adsorption and average Mn oxidation state in synthetic birnessites. Clays and Clay Minerals, 57, 513–520.
Zhu, M.Q., Paul, K.W., Kubicki, J.D., and Sparks, D.L. (2009) Quantum chemical study of arsenic (III, V) adsorption on Mn oxides: Implications for arsenic(III) oxidation. Environmental Science and Technology, 43, 6655–6661.
Manuscript received July 20, 2011Manuscript accepted april 23, 2012Manuscript handled by barry bickMore