Embed Size (px)
Citation preview
journal of MOLECULAR
LIQUIDS ELSEVIER Journal of Molecular Liquids 89 (2000) 33-45
www.elsevier.nl/locate/molliq
Femtosecond time-resolved fluorescence spectra of a coumaxin dye in glycerol
Hiroshi Murakami Advanced Photon Research Center,
Kansai Research Establishment, Japan Atomic Energy Research Institute
Umemidai 8-1, Kizucho, Sourakugun, Kyoto 619-0215, Japan Received l0 May 2000; accepted 11 November 2000
A B S T R A C T In order to obtain information on the structural relaxation of glass-forming materials, we
have performed femtosecond time-resolved fluorescence spectroscopy for a coumarin dye in glycerol at room temperature, where the time window of observation was ~ 1 ns. A sum- frequency generation technique was used by means of a mode-locked Ti:Sapphire laser. The time-resolved fluorescence spectrum has shown a time-dependent red shift up to 1 ns. The analysis of the time evolution of the peak energy of the spectrum reveals that the energy relaxation in the electronic excited state of the dye molecule has two components of the order of 100 fs and 100 ps. It is considered that the fast and slow components are attributed to the vibrational relaxation and a-relaxation of the matrix, respectively. Further, the existence of a component on a time scale of a few ps, perhaps due to the so-called fast fl-procees, is suggested.
© 2000 Elsevier Science B.V. All rights reserved.
1 I N T R O D U C T I O N The structural dynamics of glass-forming materials such as liquids and polymers are cur-
rently a topic of interest. It has been shown from extensive experimental studies that there exist three characteristic structural dynamics in various glass-forming materials [1]. The first is responsible for the boson peak in low-frequency vibrational excitations. The second is the structural relaxation with a time scale of the order of a few ps, which is often called the fast r-process. It is worth noting that there is another r-process, i.e., the slow r-process or Johari- Goldstein process, which is characterized by an Arrhenius temperature dependence of its time constant, while the time constant of the fast r-process hardly changes with temperature. Al- though the slow process relaxes at least several orders of magnitude more slowly than the fast one, the two processes are regarded as local motion. The last is the a-relaxation closely related to the viscosity of the material. The a-relaxation is characterized by a nonexponential tempo- ral behavior and a non-Arrhenius temperature dependence of the relaxation time. Since these structural dynamics have been observed in various kinds of glass-forming materials such as van der Waals and hydrogen-bridged network liquids and polymers, each process may be explained by a common physical mechanism. The mechanisms, however, are under active debate.
The above structural dynamics of glass-forming materials have been investigated mainly by dielectric relaxation, neutron and light scattering, while hardly in the time domain. A method to study the structural dynamics of glass-forming materials in the time domain is to employ a
0167-7322/00/$ - see front matter © 2000 Elsevier Science B.V. All rights reserved. PII S0167-7322(00) 00172-0
34
dye molecule as a probe, i..e., to measure the time-resolved fluorescence (TRF) spectra of a dye molecule in a glass-forming material. When the dye molecule is excited by light irradiation, the electronic state changes abruptly, followed by various relaxation processes in the surroundings of the dye molecule during the lifetime of the electronic excited state so as to lower the energy through interaction between the dye molecule and the surroundings. Accordingly, such relax- ation processes are reflected in the TRF spectrum as the energy relaxation in the electronic excited state of the dye molecule, because the dye molecule in the excited state fluoresces. In fact, it has been shown in various materials doped with dye molecules that TRF spectra offer significant information on the structural dynamics of the matrices {2]-[6]. The lifetime of the electronic excited state of dye molecules is typically of the order of a nanosecond. Thus, if we employ femtosecond TRF spectroscopy using, for instance, a sum-frequency generation (in other words, up-conversion) technique [7, 8], it is possible to investigate the energy relaxation of dye molecules in materials in the time range from femtoseconds to nanoseconds. The above mentioned three structural dynamic processes in glass-forming materials occur in this time win- dow, and so, for example, the crossover of the fast ,q-process and c~-relaxation may be accessible using this method.
Glycerol is a typical glass-forming material. Therefore, the structural dynamics of glycerol have been investigated by a variety of experimental techniques, such as dielectric relaxation spectroscopy [9]-[11], light and neutron scattering measurements [12]-[14]. As for experiments using a dye molecule as a probe, the TRF spectroscopies of dye molecules in glycerol have been performed by using a time-correlated single-photon counting method [4, 151 and by using a laser-based multifrequency-phase and modulation fluorometer [6]. The model of inhomogeneous broadening of the spectra with taking into account the role of solvent-solute reorientation in the excited state of dye molecules has explained the dependence of the energy-resolved fluorescence decays on excitation wavelength in dyes in glycerol [15]. On the other hand, it has been pointed out that the temporal behavior of the TRF spectrum of dye molecules in glycerol is different from that in ethanol [4]. The difference was ascribed to the existence of a network among solvent molecules through hydrogen bonds in glycerol. Transient hole-burning (THB) spectroscopies have been done for dye molecules in glycerol on time scales of the order of picoseconcks [16] and from microseconds to milliseconds [17]. It has been shown in the ps experiment that the broadening of the THB spectrum occurs within 200 ps owing to the structural relaxation above 250K, while the time-dependent behavior of the THB spectrum was assigned to the c~-relaxation of the matrix in the measurement from microseconds to milliseconds. Femtosecond TRF and THB speetroscopies, however, have not been performed yet for dye molecules in glycerol. The TRF spectroscopy is more convenient than the THB one because the TRF spectroscopy probes only the electronic excited state while overlapping ground and excited state effects and the excited state absorption often make the analysis of the THB spectra difficult [18].
Thus, in the present study, we have obtained the femtosecond TRF spectrum of coumarin 540A (C540A) dissolved in glycerol (Gly) at room temperature up to 1 ns using a long optical delay line with high resolution for determining positions.
2 E X P E R I M E N T A L P R O C E D U R E
Coumarin 540A (Exciton, laser grade) dissolved in glycerol (Nacalai Tesque, spectral grade) (C540A/Gly) was used as a sample without further purification. It is known that a double bond in a dye molecule possibly reacts with oxygen by light irradiation and breaks into a single bond. Therefore, oxygen in the sample was exchanged for nitrogen by bubbling nitrogen gas into the sample and then a flow cell system of the sample was hermetically sealed. These processes were
A b s o r p t i o n F l u o r e s c e n c e
~9
35
350 400 450 500 550 600 Wavelength / nm
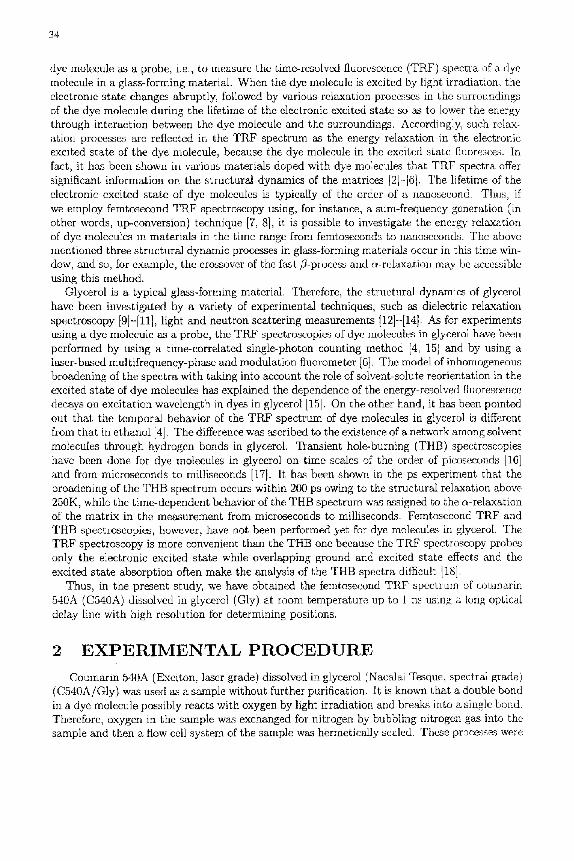
Fig. 1 The steady-state absorption and fluorescence spectra of C540A/Gly at room temperature. The excitation for the fluorescence spectrum was made at 410 nm.
performed in a glove bag. We employed the sample with concentration of ,-~ 7 × 10 -4 mol/l in the TRF measurement, where the absorbance of it was ~ 1 per 1 mm optical path length at the excitation wavelength of 410 nm. On the steady-state fluorescence measurement, the concentration of the sample was N 1 x 10 -6 mol/1 so that the effect of the reabsorption of fluorescence might be negligible.
Steady-state absorption and fluorescence spectra were recorded with absorption (Shimadzu UV-3101PC) and fluorescence (Shimadzu RF-5300PC) spectrometers, respectively. The ab- sorption and fluorescence spectra of the sample at room temperature are depicted in Fig.1.
A sum frequency generation technique was employed for femtosecond TRF spectroscopy. In this technique, the fluorescence from a sample excited by a femtosecond laser pulse is mixed with the laser pulse in a nonlinear crystal to generate sum frequency radiation. Since the mixing process occurs only during the presence of the laser pulse, it is possible to gate the fluorescence roughly with the temporal width of the laser pulse. We can select the sum frequencies by tuning the phase-matching angles of the nonlinear crystal. The intensity of the sum frequency light is proportional to the product of the intensity of the fluorescence and that of the gate pulse. Since the intensity of the gate pulse is constant, the temporal behavior of the fluorescence intensity at a certain wavelength can be obtained as that of the intensity of the sum frequency radiation by changing the time interval between the excitation and gate pulses using a variable optical delay line.
Figure 2 shows a schematic diagram of the experimental system. The light source was a mode-locked Ti:Sapphire laser (Clark-MXR NJA-5) pumped by a CW, multiline argon ion laser (Coherent Innova 306), which provided a 96 MHz pulse train with average power of 300
36
Mode-locked Ti:Sapphire laser
Argon ion laser
PM,
f + C o
B B O
B B O H S - 03
L1 Sample I ' ~ ~ ~ ' ~ 2 6 °
PM ] Optical I , delay
L2
I HWP
M
Amplifier 1---[ Photon counter M
Computer
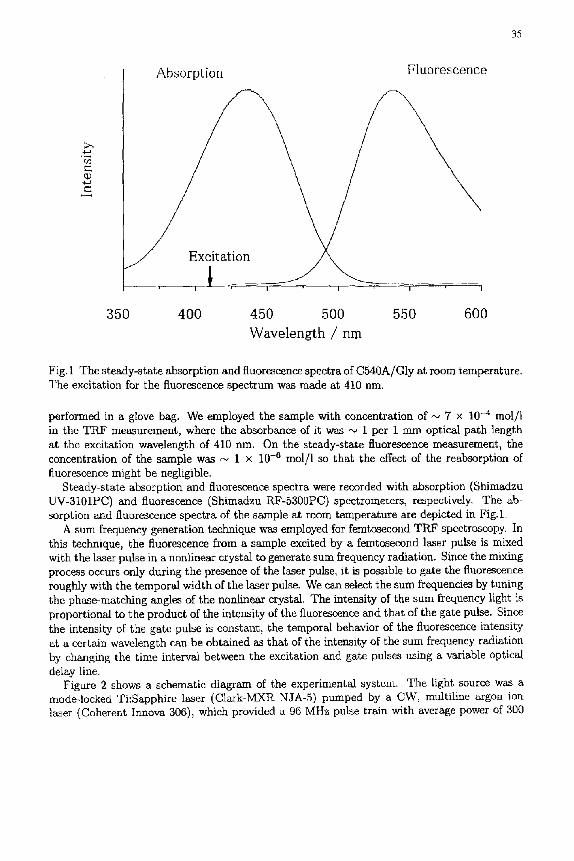
Fig.2 Schematic diagram of the experimental system for femtosecond time-resolved fluores- cence spectroscopy, as, frequency of fundamental pulse; BBO,/3-barium borate; H$, harmonic separator; M, mirror; HWP, half-wave plate; L1 and L2, lens; PM, off-axis parabolic mirror; co; + co, sum frequency; MC, monochrometer; PT, photomultiplier tube. Details are described in the text.
mW and pulse duration of ~ 120 fs (full width at the half-maximum of autocorrelation). The lasing wavelength was fixed at 820 nm (co) in the present measurement. The second harmonic (2co, 410nm) of the mode-locked Ti:Sapphire laser wan first generated by type I mixing in a 0.8-mm-thick /?-barium borate (BBO) crystal (CASIX) and was used to excite the sample. The excitation pulse was reflected on a harmonic separator (HS) and was focused into a quartz sample flow cell with a path length of I mm by a 6 cm focal length lens (L1) after passing through an optical delay line controlled by a stepping-motor driven translation stage (TIIK KR), the length of which is about 70 cm with a 3 #m resolution for determining positions. The average power of the excitation pulse was adjusted to ~ 10 mW at the sample cell. The fluorescence emitted from the sample was collected and focused into a I-ram-thick BBO crystal (CASIX) by a pair of off-axis parabolic aluminum-coated mirrors (PM) (Shimadzu) with a focal length of 141.6 mm. The residual fundamental pulse was used as a gate pulse and focased into the BBO crystal by a 15 em focal length lens (L2). The polarization of the gate pulse was rotated by a half-wave plate (HWP) to be parallel to that of the excitation pulse. The fluorescence and the gate pulse interacted noncollinearly in the BBO crystal, where the crossing angle between the two was about 15 °. The sum frequency light (col + co, col: frequency of the fluorescence satisfying the phase-matching condition) was separated from other light, i.e., the gate pulse,
37
nonphase-matched harmonics of the laser pulse and fluorescence, by using a combination of an iris diaphragm and optical filters, and then it was detected by a cooled photomultiplier tube (PT) (Hamamatsu Rll04P) combined with a 10 cm focal length monochrometer (MC) (Jasco M10). The signal from the PT was amplified by a 300 MHz amplifier (Stanford Research Systems, SRS; SR445) and counted by a gated photon counter (SRS SR400). A personal computer controlled the photon counter and translation stage. The instrumental response function to the excitation light pulse in this experimental system, i.e. the cross-correlation trace between the excitation and gate pulses, is shown as a broken line in Fig.3 (a). The full width at half maximum of it was about 200 fs.
>, 4-9
~q
02 4.-9
470 nm (a) (b)
I I s
6 i Ilal
i........................ 550 nm
I I I I I I
-2 0 2 4 6 8 Delay t ime / ps
'//...470 nm
550 nm
I I I I [
0 200 400 600 800 1000
Delay time / ps
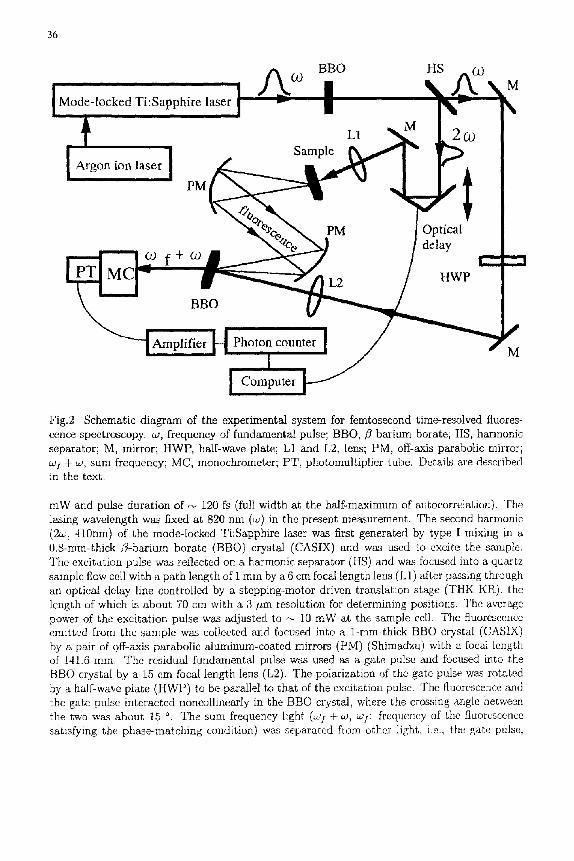
Fig.3 Time behavior of the fluorescence intensity of C540A/Gly measured at 470 and 550 nm at room temperature (scattered squares); (a) and (b) are for 10 ps and 1 ms time scales, respectively. The solid lines were obtained from the convolution of a sum of exponentials with the instrumental response flmction (a broken line in Fig.3(a)) to the excitation light.
We reconstructed the TRF spectrum at an arbitrary time after light excitation according to the following procedure: (1) the fluorescence decay curves were measured every 10 nm from 460 nm to 580 nm up to 1 ns; (2) the curves obtained were fitted to a convolution of a sum of exponentials (~. a~(A)e~p(-t/ri(A)), A:wavelength, az(A):preexponential factor, ri()~):time
constant) with the instrumental response function. The number of exponential functions used was five at almost all the wavelengths; (3) the integrated intensity of the deconvoluted curves was normalized by the intensity of the steady-state fluorescence spectrum at the corresponding wavelength, where we employed the spectrum measured with the fluorescence spectrometer with no further correction. In this procedure, the deconvoluted curves from 1 ns after the excitation were extrapolated by the sum of exponentials obtained in the fitting procedure up to 1 ns, because the population-decay process from the electronic excited state to the ground one with a lifetime of ~2 ns was dominant after I ns; (4) finally, the data on the normalized curves at a given time after the excitation were lined up every 10 nm from 460 nm to 580 nm.
38
We estimated the peak position of the T R F spectrum on a frequency (i/) scale, where the TRF speetrmn was divided by r ,4 because the intensity of fluorescence is proportional to t/4.
3 E X P E R I M E N T A L R E S U L T S A N D D I S C U S S I O N
The time evolution of the fluorescence intensity measured at 470 and 550 nm is shown as two typical results in Figs.3(a) and 3(b) (scattered squares). The figures cover 10 ps and 1 ns time scales, respectively. The time profiles of the fluorescence intensity are reproduced well by the convolution of a sum of exponentials with the instrumental response function to tile excitation light pulse, where the calculated curves are represented by a solid line in Fig.3. Good agreement between the experimental result and the calculated curve was also obtained at the other wavelengths.
, ~ ' , 4
¢/3
CD
0
J 1000 580
460
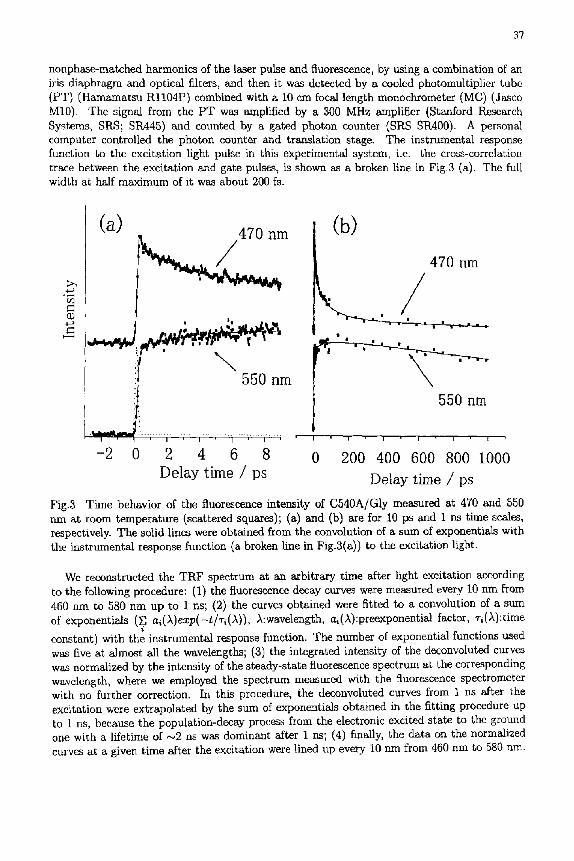
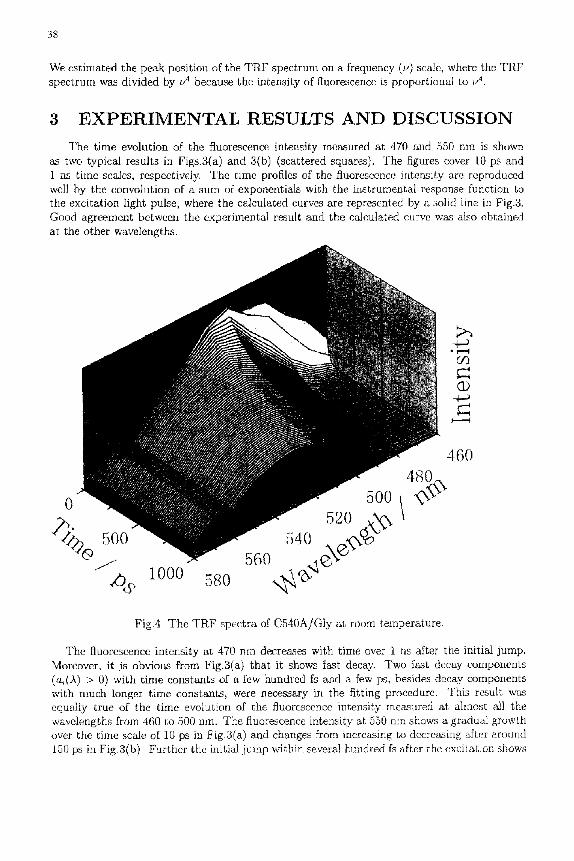
Fig.4 The T R F spectra of C540A/GIy a~ room temperature.
The fluorescence intensity at 470 nm decreases with time over 1 ns after the initial jump. Moreover, it js obvious from Fig.3(a) that it shows fast decay. Two fast decay components (a,(,k) > 0) with t ime constants of a few hundred fs and a few ps, besides decay components with much longer time constants, were necessary in the fitting procedure. This result was equally true of the time evolution of the fluorescence intensity measured at almost all the wavelengths from 460 to 500 nm. The fluorescence intensity at 550 mn shows a gradual growth over the time scale of 10 ps in Fig.3(a) and changes from increasing to decreasing after around 150 ps in Fig.3(b). Further the initial jump within several hundred fs after the excitation shows
39
steepness less than that of the instrumental response function, while the slope of it at 470 nm is almost the same as that of the instrumental response function. This implies that there exists some fast rise component (ai(A) < 0) in the dynamics of the fluorescence intensity at 550 nm. In fact, two fast rise components with time constants which are roughly equal to those at 470 nm were derived from the fitting procedure. The same result was obtained for the time evolution of the fluorescence intensity in the wavelength range from 510 to 580 nm. As to behavior of the fluorescence intensity on a longer time scale, it has been also found that there are decay and rise profiles on time scales from several ten to several hundred ps on the short and long wavelength sides, respectively, in addition to the decay component due to the lifetime (~ 2 ns) of the electronic excited state of the dye molecule which is common to all wavelengths. The clear correspondence, however, was absent between the time constants of the decay and rise in contrast to the case of the fast components.
I
<D
19600-
19200"
18800
18400
' ' ' ' " t ' ' ' ' ' ' " t ' ' ' ' ' ' " l ' ' ' ' ' ' " I ' ' ' ' ' " i
0.1 1 10 100 1000
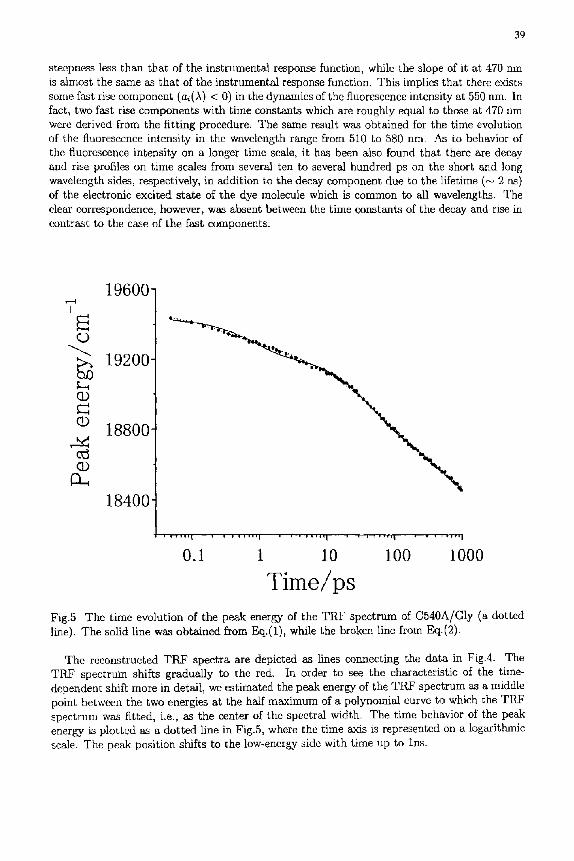
Time/ps Fig.5 The time evolution of the peak energy of the T R F spectrum of C540A/Gly (a dotted line). The solid line was obtained from Eq.(1), while the broken line from Eq.(2).
The reconstructed T R F spectra are depicted as lines connecting the data in Fig.4. The TRF spectrum shifts gradually to the red. In order to see the characteristic of the time- dependent shift more in detail, we estimated the peak energy of the T R F spectrum as a middle point between the two energies at the half maximum of a polynomial curve to which the TRF spectrum was fitted, i.e., as the center of the spectral width. The t ime behavior of the peak energy is plotted as a dotted line in Fig.5, where the time axis is represented on a logarithmic scale. The peak position shifts to the low-energy side with time up to Ins.
40
I i i
popuIation
excited state
.uo o co°c
excitation
g round state
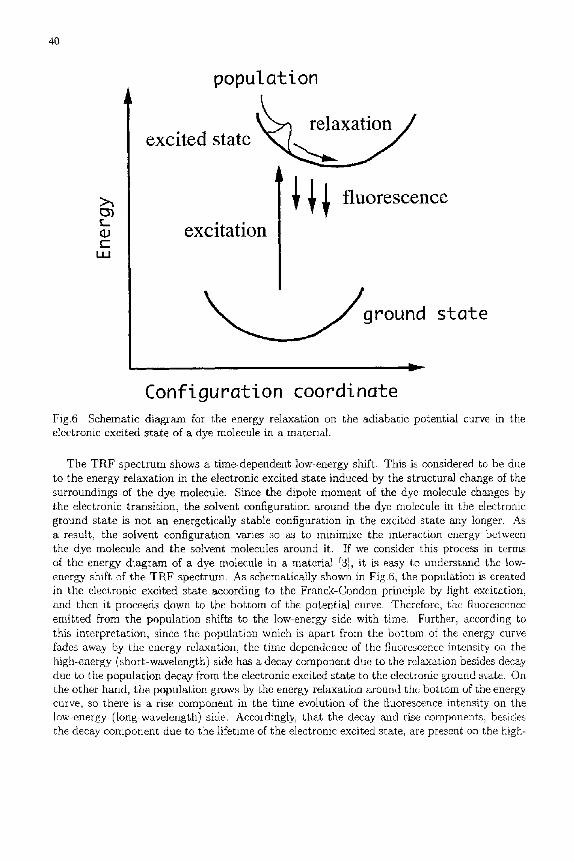
Configuration coordinate Fig.6 Schematic diagram for the energy relaxation on the adiabatic potential curve in the electronic excited state of a dye molecule in a material.
The TRF spectrum shows a time-dependent low-energy shift. This is considered to be due to the energy relaxation in the electronic excited state induced by the structural change of the surroundings of the dye molecule. Since the dipole moment of the dye molecule changes by the electronic transition, the solvent configuration around the dye molecule in the electronic ground state is not an energetically stable configuration in the excited state any longer. As a result, the solvent configuration varies so as to minimize the interaction energy between the dye molecule and the solvent molecules around it. If we consider this process in terms of the energy diagram of a dye molecule in a material [3], it is easy to understand the low- energy shift of the TRF spectrum. As schematically shown in Fig.6, the population is created in the electronic excited state according to the Franck-Condon principle by light excitation, and then it proceeck~ down to the bottom of the potential curve. Therefore, the fluorescence emitted from the population shifts to the low-energy side with time. Further, according to this interpretation, since the population which is apart from the bottom of the energy curve fades away by the energy relaxation, the time dependence of the fluorescence intensity on the high-energy (short-wavelength) side has a decay component due to the relaxation besides decay due to the population decay from the electronic excited state to the electronic ground state. On the other hand, the population grows by the energy relaxation around the bottom of ~he energy curve, so there is a rise component in the time evolution of the fluorescence intensity on the low-energy (long-wavelength) side. Accordingly, that the decay and rise components, besides the decay component due to the lifetime of the electronic excited state, are present on the high-
41
and low-energy sides in the energy-resolved fluorescence intensity, respectively, corresponds to that the TRF spectrum shifts roughly on the time scale on which the rise and decay occur. We calculated the time evolution of the energy-resolved fluorescence intensities when the TRF spectrum with a time-independent Gaussian spectral shape shows a shift expressed by two exponentials with time constants of 0.1 and 1, and decays with the electronic excited-state lifetime of 10. As a result, it has been found that the time behavior of the energy-resolved fluorescence intensity on the high-energy side can be explained by three exponential decays indicating the existence of the shift with two time scales and the population decay from the excited state, while, on the low-energy side, by two exponential rises and one exponential decay.
Next we analyze the time-dependent shift of the peak energy of the TRF spectrum using a nonlinear least squares method. As obviously seen in Fig.5, the peak-energy shift of the TRF spectrum shows a time profile distinguished from a single exponential one. From the result of the fit of the time evolution of the fluorescence intensity to the convolution of a sum of exponentials with the instrumental response function, it is supposed that there exist at least three components in the time-dependent shift of the TRF spectrum. The two fast ones occur in a few hundred fs and a few ps, and the slow one on a time scale from several ten to several hundred ps. On the assumption that these components are three independent processes, the time-dependent change of the peak energy of the TRF spectrum can be expressed as a sum of three certain functions, each of which characterizes the dynamics of the process. Therefore, we first try to fit the time dependence of the peak energy of the TRF spectrum to a sum of two exponentials, and then to a sum of three ones. The exponential form of relaxation means that the structural fluctuation obeys a Gaussian-Markovian process, in other words, corresponds to Debye-type relaxation.
It has been found that the time evolution of the peak energy cannot be expressed well not only by a single exponential but also by a sum of two exponentials. On the other hand, it can be reproduced roughly by a sum of three exponentials,
Pl(t) = B + A1 exp(- t / r l ) + A2exp(-t/'r2) + A3exp(-t/ra), (1)
as shown by a solid line in Fig.5, where B -- 18400, A1 = 200, A2 = 400, A3 = 400 (cm-1), r~=0.8, T2=40, and ~-s----450 (ps). The parameter B corresponds to the peak energy of the TRF spectrum for t --+ co. Further, a sum of an exponential and stretched exponential is tried because glycerol shows the a-relaxation with a stretched exponential form at room temperature [22, 23 I. Figure 5 demonstrates that the experimental result agrees fairly well with the curve (broken line) calculated from the following expression:
Pl(t) = B + A1 exp(- t /r l ) + A2 exp{-(t/r2)~}, (2)
using B=18400, A~ = 100, A2 = 1000 (em-~), ri=0.30, r2=140 (ps) and/~=0.5. According to the analysis by Eqs.(1) and (2), the peak energy of the TRF spectrum shows
the time-dependent shift on two time scales; one is of the order of 100 Is, and the other is much longer, characterized by the two exponentials in Eq.(1) or by the stretched exponential in Eq.(2). These time scales correspond to those of the decay or rise components observed in the time profiles of the energy-resolved fluorescence intensity. This result is consistent with the description on Fig.6, although the time-dependent shift on a few ps time scale is absent in the TRF spectrum, which we refer to below.
The TRF spectrum shows a very fast shift of the order of 100 fs. Horng and co-workers have measured ~100 fs TRF spectra of eoumarin 153, which is another name of eoumarin 540A, in various polar solvents with low viscosity at room temperature [2]. Coumarin 153 in cyclohexane shows almost no time-dependent change of the TRF spectrum due to the eonfigurational change
42
of the solvent molecules. Therefore the solution was excited at 366 nm with excess vibrational energy on the order of 3500 cm -~ deposited into the solute, and the effect of intramolecular vibrational relaxation on the TRF spectrum was explored. They have demonstrated that the TRF spectrum which is calculated by modeling the intraznolecular vibrations of coumarin 153 as a single harmonic mode displays a large-amplitude, quickly decaying components due to the intramolecular vibrational relaxation to the blue apart from the peak position of the steady- state fluorescence spectrum, while that from the experiment does not show it at sufficiently early times. It has been concluded that the intramolecular vibrational relaxation of the dye molecule has almost no contribution to the TRF spectra with time resolution of ~100 fs because it occurs very quickly (~ 30fs) compared with the instrument response.
It has been found that such quickly decaying components as described above does not appear in the TRF spectra at sufficiently early times in C540A/Cly, that is, tim spectral shape of the TRF spectra at sufficiently early times shows almost no dramatic departures from that at later tinms. Moreover the excitation wavelength is 410 nm in C540A/Gly, and so the excess vibrational energy deposited into the solute molecule is comparable to that in coumarin 153 in cyclohexane. Therefore it will be reasonable to consider that the time-dependent shift of the order of 100 fs in the T R F spectrum of C540A/Gly is not due to the energy relaxation induced by the intramolecular vibrations of the dye molecule but to that by the motion of the solvent molecules. Horng et al. have concluded by comparison with computer simulations [19] that ultrafast (100-300fs) peak shifts of the T R F spectra are attributed to small amplitude inertial rotational motion of solvent molecules. C540A/Gly, however, may show an energy relaxation mechanism different from that of the dye solutions examined by Horng ct al., because glycerol shows much higher viscosity due to hydrogen bonds even at room tempe.rature, in fact, glycerol shows the boson peak in the low-frequency excitation spectra [i3, 1@ and it has been suggested that the boson peak results from the localized collective motions of the hydrogen- bonded hydroxyl groups in glycerol [20t.
There exists the rise or decay component with a time constant of a few ps in the time profiles of the energy-resolved fluorescence intensity of C540A/Gly. Hence the time-dependent shift on the time scale is supposed to be observed in the TRF spectrum, as described on Fig.6. It, however, is possible enough to reproduce the time evolution of the peak energy of the TRF spectrum using Eqs.(1) and (2) with no term with such a time constant. This is possibly because the peak-energy shift of the TRF spectrum due to the energy relaxation on this time scale is very small compared with those due to the other energy relaxations and is buried in the spectral uncertainty of the TRF spectra reconstructed at an interval of 10 nm. The fast /~-proccss has been observed in glycerol, although the extent of it is rather small in comparison with that of other glass-tbrming materials [9, 13, 14, 21]. The rise and decay occur roughly on the same time scale as the fast /3-process. Further the fact that the magnitude of the fast /f-process is small in glycerol can be connected with the small peak-energy shift of the TRF spectrum of C540A/Gly. Thus the fast ,G-process of glycerol may contribute to the energy relaxation which is responsible for the rise and decay with a time constant of a few ps in the energy-resolved fluorescence dynamics of C540A/GIy.
It has been found that the steady-state fluorescence spectrum of C540A/Gly depends slightly on the excitation energy at room temperature, which suggests that there exists energy relaxation with a time scale comparable to, or longer than, the lifetime (~2 ns) of the electronic excited state of the dye molecule. This supports the existence of the time-dependent shift of the TIfF spectrum which is explained using the exponential with a time constant of 450 ps in Eq.(1) or using the stretched exponential in Eq.(2).
It has been shown that the structural a-relaxation shows a stretched exponential time behav- ior at room temperature in glycerol [22, 231 . This indicates that glycerol may show cooperative
43
motion due to some hydrogen-bonded network at room temperature. We note that the melting point of glycerol (291 K) is close to room temperature, and so glycerol is almost in the super- cooled state at room temperature. Thus, it will be natural that a stretched exponential time behavior is observed in the energy relaxation of C540A/Gty at room temperature. Accordingly, we next discuss the parameter values obtained from the analysis using Eq.(2).
The parameter values of the stretched exponential obtained in C540A/GIy are different from those for glycerol by other techniques such as dielectric relaxation [22] and neutron scattering [23]. This is considered to be because we probe the structural dynamics of the surroundings of the dye molecule. The relaxation time r~ in Eq.(2) is 140 ps, while it is of the order of ns in glycerol. In order to obtain information on the reason for this difference, it would be worth considering a solute molecule in a polar solvent which shows Debye relaxation with a relaxation time rD in a continuum model [24, 25]. In this ease, the longitudinal relaxation time rL of the solvent which undergoes the effect of a sudden change in the dipole moment of the solute is connected with the Debye relaxation time as rL ~-- (e~ /%) ' rD, where coo and e0 are the dielectric constants of the solvent for optical and zero frequencies, respectively. In the case of glycerol, rc is one-tenth to one-fifteenth as large as r~ from this relation [26]. It is interesting to point out that the ratio of 7-2 (140 ps) to the relaxation time (2-12 ns) estimated by dielectric spectroscopy for glycerol [10, 11, 22] is roughly the same as that obtained from this relation. Although we cannot apply this relation directly for r2 in the stretched exponential, we can say that the screening effect is responsible for the deviation of ~'2 from the relaxation time obtained in glycerol. On the other hand, the stretching exponent/3 is 0.5 for C540A/Giy, while it ranges about from 0.6 to 0.8 for glycerol, depending on the experimental techniques. The stretching exponents of the stretched exponential which were determined from the time- dependent peak-energy shifts of the transient hole-burning spectrum [171 and the time-resolved phosphorescence spectrum [27] for dye solutions were compared with those derived by dielectric spectroscopy for the solvents, and the former exponents were smaller than the latter by 0.1-0.2. Accordingly, it is considered that the smaller parameter values of the stretched exponential in C540A/Gly are due to the doping effect of the dye molecule into glycerol. Thus, it is reasonable that the nonexponential component in the energy relaxation of C540A/Gly is caused by the rearrangement of the solvent molecule responsible for the c~-relaxation of the matrix, and the TRF spectrum shows the time-dependent shift expressed by Eq.(2). In the case of Eq.(1), it seems to be difficult to interpret the exponential term with a time constant of 40 ps. Further the experimental result agrees better with the curve calculated from Eq.(2) than with that from Eq.(1). Although the energy relaxation due to vibrational relaxation of the solvent molecules is regarded as exponential, it is not well understood whether the vibrational relaxation on a time scale of a few hundred fs shows Debye-type relaxation. Further investigation is necessary.
4 C O N C L U S I O N
We have obtained fs TRF spectra of coumarin 540A in glycerol at room temperature up to 1 ns. A time-dependent red shift has been observed in the TRF spectra. It has been found that the time evolution of the peak energy of the TRF spectrum is well expressed by a sum of an exponential with a time constant of a few hundred fs and a stretched exponential with a time constant of 140 ps and a stretching exponent of 0.5. The parameter values in the stretched exponential are consistent with those obtained for the a-relaxation of glycerol if one takes account of the doping effect of the dye molecule into glycerol. On the other hand, the fast component is considered to be due to the vibrational relaxation of the solvent molecules. Further the existence of the energy relaxation in the electronic excited state on a time scale
44
of a few ps has been suggested from the analysis of the energy-resolved fluorescence dynamics. This relaxation may be attributed to the so-called fast/3-process of the matrix.
A C K N O W L E D G M E N T S
The author is grateful to Dr. M. Yoshizawa for helpful advice in constructing the experi- mental system of femtoseeond TRF spectroscopy and to Dr. S. Nagai, Dr. It. Daido, and Dr. J. Koga for valuable discussions.
References
[1] See, for example, Proceedings of the International Discussion Meeting on Relaxations in Complex Systems, edited by K. L. Ngai, E. Riande, G. B. Wright [J. Non-Cryst. Solids 172-174 (1994)]; ibid. edited by K. L. Ngai, E. Riande, M. D. Ingram IJ. Non-Cryst. Solids 235-237 (1998)]; M. D. Ediger, C. A. Angell, S. R. Nagel, J. Phys. Chem. 100 (1996) 13200
[2] M. L. Horng, J. A. Gardecki, A. Papazyan, M. Maroncelli, J. Phys. Chem. 99 (1995) 17311
[3] S. Kinoshita, N. Nishi, T. Kushida, Chem. Phys. Lett. 134 (1987) 605; S. Kinoshita, N. Nishi, J. Chem. Phys. 89 (1988) 6612
[4] H. T. Oh, Y. Kanematsu, A. Kurita, T. Kushida, J. Lumin. 66&67 (1996) 310
[5] H.Murakami and T.Kushida, Phys. Rev. B54 (1996) 978; H. Murakami, T. Kushida, H. Ta~hiro, J. Chem. Phys. 108 (1998) 10309
[6] E. Bismuto, D. M. Jameson, E. Gratton, J. Am. Chem. Soc. 109 (1987) 2354
[7] J. Shah, IEEE J. Quantum Electron. 24 (1988) 276
[8] M. Yoshizawa, K. Suzuki, A. Kubo, S. Saikan, Chem. Phys. Lett. 290 (1998) 43
[9] P. Lunkenheimer, A. Pimenov, M, Dressel, Yu. G. Goncharov, R. BShmer, A. Liodl, Phys. Rev. Lett. 77 (1996) 318
[10] N. Menon, K. P. O'Brien, P. K. Dixon, L. Wu, S. R. Nagel, J. Non-Cryst. Solids 141 (1992) 61
Ill) A. SchSnhals, F. Kremer, A. Hofmaan, E. W. Fischer, Physica A201 (1993) 263
[121 S. Kojima, K. Takanashi, A. Yoshiwara, J. Mol. Struc. 349 (1995) 227
[131 A. P. Sokolov, A. Kisliuk, D. Quitmann, A. Kudlik, E. RSssler, J. Non-Cryst. Solids 172- 174 (1994) 138
[141 J. Wuttke, I. Chang, F. Fujara, W. Petry, Physica B234-236 (1997) 431; J. Wuttke, J. Hernandez, G. Li, G. Coddens, H. Z. Cummins, F. Fujara, W. Perry, H. Sillescu, Phys. Rev. Lett. 72 (1994) 3052
[15] M. J. E. Morgenthaler, S. R. Meech, K. Yoshihara, Chem Phys. Lett. 197 (1992) 537
[16] J. Yu, M. Berg, J. Chem. Phys. 96 (1992) 8741
45
I17) A. Kurita, K. Maksumoto, Y. Shibata, T. Kushida, J. Lumin. 76&77 (1998) 295
[18] S. Kinoshita, H. Itoh, H. Murakami, H. Miyasaka, T. Okada, N. Mat~iga~ Chem. Phys. Left. 166 (1990) 123; H. Murakami, S. Kinoshita, Y. Hirata, T. Okada, N.Mataga, J. Chem. Phys. 97 (1992) 7881
[191 M. MaronceIli, J. Chem. Phys. 94 (1991) 2084
[20] T. Uchino, T. Yoko, Science 273 (1996) 480
[21] W. Schnauss, F. Fujara, H. SiUescu, J. Chem. Phys. 97 (1992) 1378
[22] P. Lunkenheimer, A. Pimenov, B. Schiener, R. BShmer, A. Liodl, Europhys. Left. 33 (1996) 611
[23] J. Wuttke, W. Petry, S. Pouget, J. Chem. Phys. 105 (1996) 5177;J. Wu~tke, I. Chang, O. G. Randl, F. Fujara, W. Petry, Phys. Rev. E54 (1996) 5364
[24] B. Bagchi, D. W. Oxtoby, G. R. Fleming, Chem. Phys. 86 (1984) 257
[25] M. A. Kahlow, W. Jarz~ba, T. J. Kang, P. F. Barbara, J. Chem. Phys. 90 (1989) 151
[26] J. Yu, P. Earvolino, M. Berg, J. Chem. Phys. 96 (1992) 8750
[27] R. Richert, Chem. Phys. Lett. 199 (1992) 355