Embed Size (px)
Citation preview

MOLECULAR DYNAMICS SIMULATION OF DAMAGE
CASCADE FORMATION IN ION BOMBARDED SOLIDS
A Thesis
by
DI CHEN
Submitted to the Office of Graduate Studies of Texas A&M University
in partial fulfillment of the requirements for the degree of
MASTER OF SCIENCE
August 2011
Major Subject: Nuclear Engineering

MOLECULAR DYNAMICS SIMULATION OF DAMAGE
CASCADE FORMATION IN ION BOMBARDED SOLIDS
A Thesis
by
DI CHEN
Submitted to the Office of Graduate Studies of Texas A&M University
in partial fulfillment of the requirements for the degree of
MASTER OF SCIENCE
Approved by: Co-Chairs of Committee, Lin Shao Tahir Cagin Committee Member, Xinghang Zhang Head of Department, Raymond Juzaitis
August 2011
Major Subject: Nuclear Engineering

iii
ABSTRACT
Molecular Dynamics Simulation of Damage Cascade Formation in Ion Bombarded
Solids. (August 2011)
Di Chen, B.S., JiLin University
Co-Chairs of Advisory Committee: Dr. Lin Shao Dr. Tahir Cagin
Presented in this thesis are the results from an integrated experimental and modeling
study on damage cascade formation in ion bombarded solids. The molecular dynamics
(MD) simulations were performed by using LAMMPS (Large-scale Atomic/Molecular
Massively Parallel Simulator). In one subtask, we studied damage cascade interactions
caused by two 2 keV Si atoms simultaneously bombarding a crystalline Si substrate. We
found that the enhanced displacement creation appears primarily in the thermal spike
stage with all atoms at energies less than the displacement threshold. The study lead to
the conclusion that the cascade interactions increased local melting by increasing energy
deposition density, thus promoting defect creation. In another subtask, we studied
radiation damage in Si0.8Ge2 layer caused by Agn clusters with number of atoms in a
cluster, n, taking values from 1 to 4. It showed that strained SiGe, a material known to
have poor radiation tolerance, still follows the overlap model, rather than the direct
amorphization model. In the third subtask, MD simulation has shown that crowdion
defects formed in bcc Fe are propagating along <111> directions. Crowdion defect starts
to form when damage cascade reaches the maximum volume and contributes a second

iv
peak in defect buildups with increasing times. Upon defect recombination, crowdion
defects shrink and form <111> oriented dumbbell defects at the crowdion end. In
subsequent structural relaxation, <111> dumbbell defects rotate and finally align
themselves with <110> directions. The surviving dumbbell defects represent a
significant contribution to the final defect distribution after thermal spike formation.
The overall research reveals atomic scale details of damage buildups at early stages
of defect developments. Although the target systems cover both semiconductor materials
and metal, these results show that MD simulation is a powerful tool to show the details
at a spatial and time scale beyond experiments. These details are very important to
develop understanding the precursor formation in defect clustering in such a case.

v
DEDICATION
To my family

vi
ACKNOWLEDGEMENTS
I would like to thank Dr. Lin Shao without whom this thesis would not have been
finished. His supervision, advice, guidance, as well as encouragement and support were
invaluable for me.
I would like to thank my co-chairs of committee, Dr. Tahir Cagin and committee
member Dr. Xinghang Zhang for their help and support. Especially, Dr. Cagin, who
gave me great help on my Molecular Dynamics simulation study. Without this study, I
could not have finalized these projects. The members in Dr. Cagin’s group also offered
me valuable information without any reservation.

vii
NOMENCLATURE
Bcc Body -Centered Cubic
EAM Embedded-Atom Method Fcc Face-Centered Cubic Fe Ferrum Ge Gallium He Helium Kev Kilo Electron Volt LAMMPS Large-scale Atomic/Molecular Massively Parallel Simulator MD Molecular Dynamics
Mev Mega Electron Volt Nm Nanometer PKA Primary Knock-on Atom Ps Picoseconds RBS Rutherford Backscattering Spectrometry Si Silicon SiGe Silicon Gallium SRIM Stopping and Range of Ion in Matter

viii
TDE Threshold Displacement Energy (TDE) V Volt ZBL Ziegler, Littmark and Biersack

ix
TABLE OF CONTENTS
Page
ABSTRACT.…………...…....………….…….………….…..…………………….…….iii
DEDICATION…….……………………..……………..………….….….……......….….v
ACKNOWLEDGEMENTS.….………………………..…………….………..…..……..vi
NOMENCLATURE…………….………………....………...……………….……….…vii
LIST OF FIGURES………………….….…………………..…….……..…….…………xi
CHAPTER I INTRODUCTION………………………………….………………….…...1
CHAPTER II MOLECULAR DYNAMICS…………………….……………………….6
2.1 Molecular Dynamics Background…….…...…………….......…………………....6 2.2 The Simulation Proceeds ..................................................................................... 7 2.3 Potentials in MD Simulations .............................................................................. 8 2.4 Pair Potentials and Many-body Potentials ............................................................ 9 2.5 LAMMPS .......................................................................................................... 10
CHAPTER III MOLECULAR DYNAMICS SIMULATION OF DEFECT……………... CREATION DUE TO INTERACTIONS OF DAMAGE CASCADE IN SELF ION…… IRRADIATED SI………….…….………........................................................................12
3.1 Introduction of Gibbon’s Overlap Model ........................................................... 12 3.2 Method Used for MD Simulation of Radiation Damage Overlap........................ 13 3.3 Results and Discussion ....................................................................................... 14
CHAPTER IV USING CLUSTER ION BOMBARDMENT TO DETERMINE………… AMORPHIZATION MODE..…………………………………………...........................26
4.1 Introduction of Irradiated Amorphization ........................................................... 26 4.2 Method of MD Simulation for Irradiated Si ....................................................... 27 4.3 Results and Discussion ...................................................................................... 29

x
Page
CHAPTER V MOLECULAR DYNAMICS SIMULATION OF ION FOCUSING…….. AND CROWDION FORMATION IN SELF-ION IRRADIATED FE...…….....……...38
5.1 Introduction of Radiation Damage in Fe ............................................................ 38 5.2 Method of MD Simulation for Irradiated Fe ...................................................... 39 5.3 Results and Discussion ...................................................................................... 40
CHAPTER VI CONCLUSION………….……………………….………….……….….48
REFERENCES………………..………………………………………………….….…..50
APPENDIX A………..…………………....……………………………….…………….53
APPENDIX B…………….……………….………….………………………...…….….55
APPENDIX C…………….…………………….…....…………………………..…..…..59
VITA……………………….…………………………………………………………….67

xi
LIST OF FIGURES
Page
Fig 1 Schematic of a nuclear pressure vessel and a displacement cascade generated by a neutron[9] .................................................................................................... 4
Fig 2 The simulation proceeds of molecular dynamics simulation ................................. 8 Fig 3 MD simulation obtained displacement numbers at time 21.5t ps and
1.5t ps ........................................................................................................... 15 Fig 4 Time evolution of displacement numbers in Si upon simultaneous
bombardments by two Si ions with a separation distance of (a) 0.6 nm and (b) 0.6 nm. ...................................................................................................... 17
Fig 5 The times reaching maximum displacement numbers for two Si ions
bombarding at different separation distance. ...................................................... 18 Fig 6 Defect annealing efficiencies calculated by using the maximum displacements
and the final displacements at time 21.5t ps , for different ion separation distances. ........................................................................................................... 20
Fig 7 Kinetic energy distributions of displacements created at time 0.2t ps after
bombardments by two Si ions at a separation distance of 0.6 nm. The distribution for single ion irradiation is also plotted for comparisons. .......... 22
Fig 8 Permanently damaged volume created per incident atom in cluster ions
with size 1 to 5 atoms, predicated from Eq. (4.1) by assuming the direct amorphization (m=1), single overlap (m=2), or double overlap (m=3) models. .. 30
xii
Page Fig 9 Channeling RBS spectra of 2 MeV He ions along <100> axis in virgin and
Agn-irradiated Si0.8Ge0.2 layers. The random spectrum is plot for comparison..... 31
Fig 10 Displacements of Si and Ge atoms, extracted from Fig. 9, for Agn cluster ion irradiated Si0.8Ge0.2 layer. ................................................................................. 33
Fig 11 MD simulations of displacement creation in Si0.8Ge0.2 layer upon Agn ion
irradiation. The insets show the displacements caused by a Ag4 cluster and by a Ag monomer at t=1ps. ................................................................................... 34
Fig 12 Displacements (Si+Ge) in Agn-irradiated Si0.8Ge0.2 layers at t=1ps, obtained
from MD simulations. ...................................................................................... 35 Fig 13 Damage cascade evolution from MD simulation of a bcc <100> Fe crystal
irradiated by one 1 keV Fe ion at 0.1 ps,0.3 ps 1 ps,and 30 ps. .......................... 41 Fig 14 Numbers of interstitials and vacancies as a function of times after 2 keV Fe ion
bombardment of a bcc <100> Fe crystal. .......................................................... 42 Fig 15 Number of interstitials in a bcc <100> Fe crystal caused by a 2 keV Fe ion. ...... 44 Fig 16 Images of typical crowdion and dumbbell defect evolution from MD
simulation .......................................................................................................... 45 Fig 17 Angles between the (100) plane and the dumbbell defect orientation as a
function of times upon 2 keV Fe ion bombardment. The zero degree corresponds to the perfect aliment along <110> direction. ................................ 46

1
CHAPTER I
INTRODUCTION
Radiation damage resulting from ion solid interactions has been a subject of
intensive research efforts during the past decades [1]. Understanding radiation damage
creation in solids is important for a wide range of application including ion implantation
for device doping and development of radiation tolerant materials used under harsh
environments involving particle bombardments [2]. While studies on semiconductors
and insulators are primarily driven by the need for ion beam modification [3], studies on
radiation damage in metals has been driven greatly by the needs for materials
applications in harsh environments, i.e. fission and fusion reactors [1,4].
In a civilian thermal neutron reactor which includes the types of boiling water
reactor and pressure water reactor, uranium oxide is used as nuclear fuels, which are
surrounded by fuel cladding materials made of Zircaloy. Under normal operation
conditions, the fuel center can reach a temperature as high as 800oC. There are huge
amount of radiation damage occurring inside the fuel due to interaction of fission
fragments, alpha, beta, gamma rays, and neutrons. The fission fragments have a typical
kinetic energy of about 170 MeV (total), while the neutrons have a typical kinetic energy
of 5 MeV. Both of them can lead to high energy recoil of fuel target elements.
____________
This thesis follows the style of Nuclear Instrument & Methods in Physics Research B.
2
The creation of high energetic particles will lead to two primary ion solid
interactions: electronic excitation of electrons and displacement of target nuclei from
their original lattice sites. Due to large free flying path of neutrons, they will escape from
the nuclear fuel and penetrate through the cladding materials and directly interaction
with coolant and other in-core structural components. For a typical reactor lifetime of 30
years, averagely a given target atoms in the fuel assembly will experience over 50 dpa,
while the dpa stands for displacement per atoms. Such a high damage level significantly
alters the microstructures of the in-core components. As a consequence, these materials
have serious degradations including swelling, corrosion, embrittlement, cracking,
blistering, flaking, etc. These radiations induced phenomena greatly limited the reactor
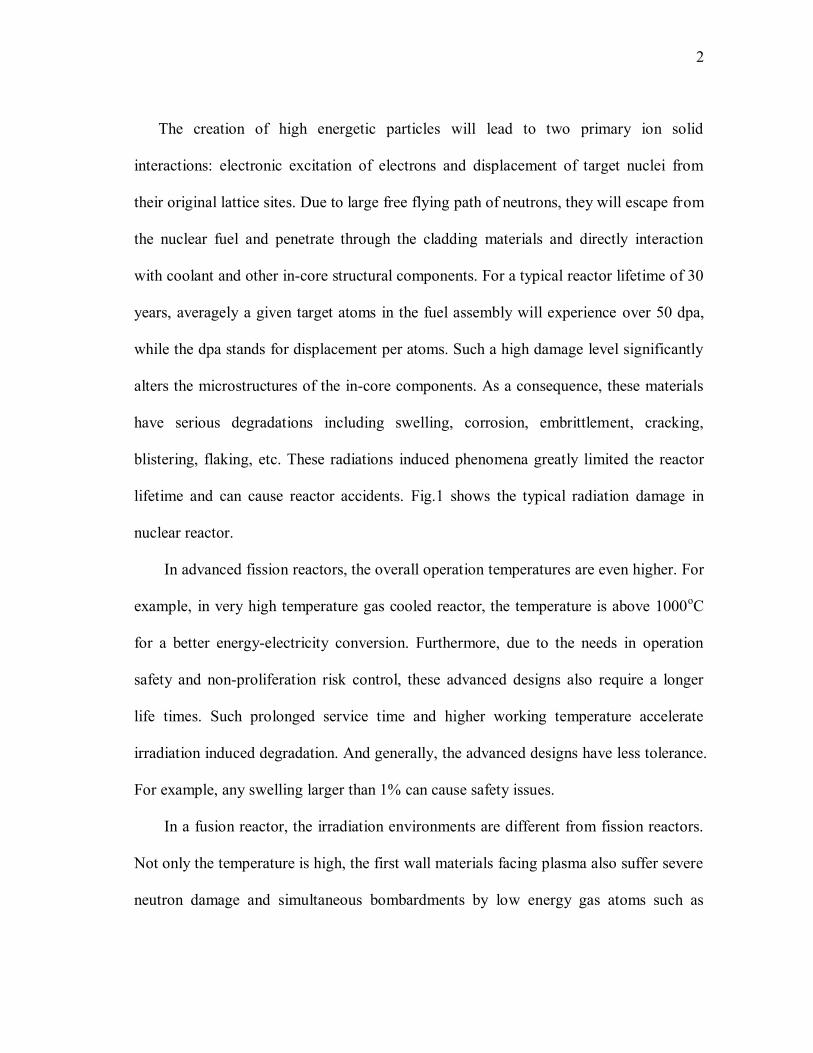
lifetime and can cause reactor accidents. Fig.1 shows the typical radiation damage in
nuclear reactor.
In advanced fission reactors, the overall operation temperatures are even higher. For
example, in very high temperature gas cooled reactor, the temperature is above 1000oC
for a better energy-electricity conversion. Furthermore, due to the needs in operation
safety and non-proliferation risk control, these advanced designs also require a longer
life times. Such prolonged service time and higher working temperature accelerate
irradiation induced degradation. And generally, the advanced designs have less tolerance.
For example, any swelling larger than 1% can cause safety issues.
In a fusion reactor, the irradiation environments are different from fission reactors.
Not only the temperature is high, the first wall materials facing plasma also suffer severe
neutron damage and simultaneous bombardments by low energy gas atoms such as
3
helium and deuterium. These gas atoms can stabilize the void formation and accelerate
surface erosion.
Radiation damage affects each step of fuel cycles. For example, cracking during dry
storage and permanent disposal is one serious issue. The container safety for spent fuel
storage is still an issue unsolved. Any cracking can cause the leakage of radioactive
materials and contamination of underground water systems.
Driven by the need to make reactor safer, as well as the needs for the next
generation reactors, materials with enhanced radiation tolerance are needed. Towards
this goal, we need to develop in depth understanding on the failure mechanism. Not
limited to measure the macroscopic properties, studies need to reach microscopic details,
and even atomic levels, to develop understanding necessary for materials engineering.
This requires an integration of modeling and experimental studies. Particularly, due to
limitation from current characterization tools, the knowledge on defect developments at
a time scale and spatial scale beyond experiments are largely missing. Driven by this
purpose, this thesis works is aimed to develop fundamental understanding by using
atomic scale modeling.
4
Fig 1. Schematic of a nuclear pressure vessel and a displacement cascade generated by a
neutron[5]
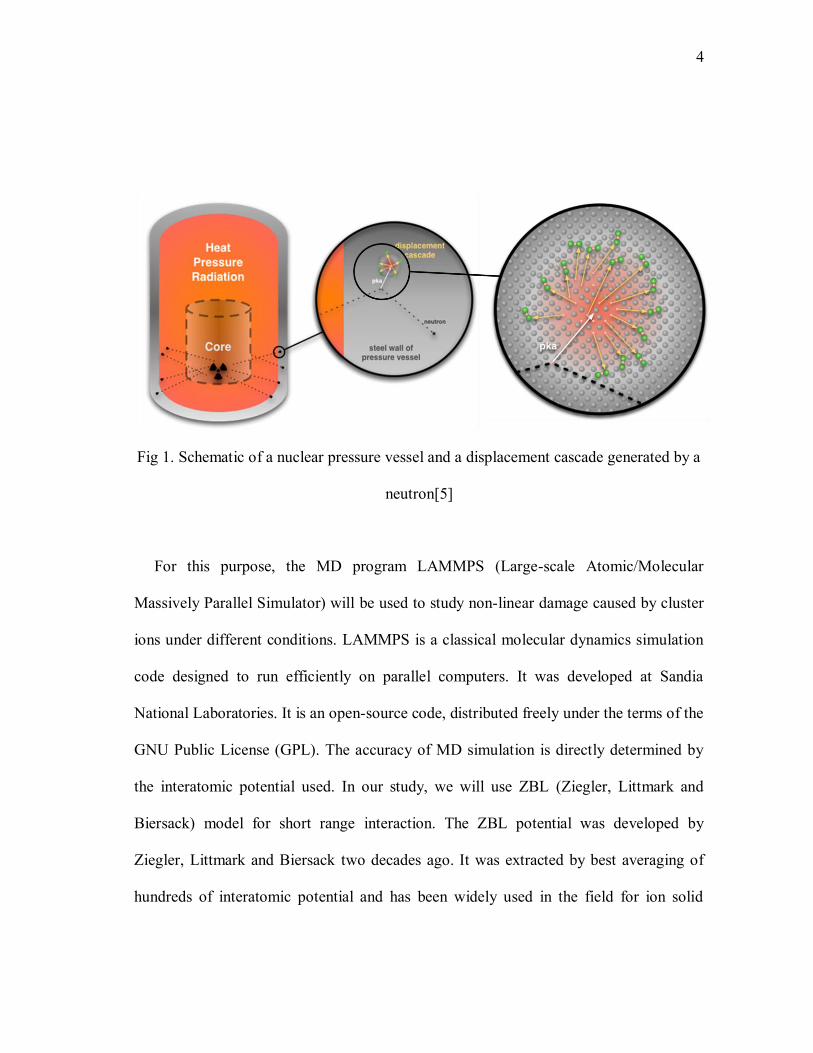
For this purpose, the MD program LAMMPS (Large-scale Atomic/Molecular
Massively Parallel Simulator) will be used to study non-linear damage caused by cluster
ions under different conditions. LAMMPS is a classical molecular dynamics simulation
code designed to run efficiently on parallel computers. It was developed at Sandia
National Laboratories. It is an open-source code, distributed freely under the terms of the
GNU Public License (GPL). The accuracy of MD simulation is directly determined by
the interatomic potential used. In our study, we will use ZBL (Ziegler, Littmark and
Biersack) model for short range interaction. The ZBL potential was developed by
Ziegler, Littmark and Biersack two decades ago. It was extracted by best averaging of
hundreds of interatomic potential and has been widely used in the field for ion solid

5
interaction. The smooth transition from long range potential to ZBL potential guarantees
the accuracy in ion-solid interaction over a wide range of interaction distance. The final
damage distribution, after typically a few picronsections, can be quantitatively extracted
by counting the number of atoms having anenergy a few eVs larger than bond energy.

6
CHAPTER II
MOLECULAR DYNAMICS
2.1 Molecular Dynamics Background
Molecular dynamics (MD) is a computational method to predict the movement of
one atom under a force contributed by other atoms of a typical size of millions. Such a
movement goes back to contribute to the status of other atoms. Therefore, behaviors of
individual atoms, as well as the global responses of a bulk sample, can be well predicted.
The foundation of the MD simulation is the Newton’s second law. In order to integrate
Newton’s equation, we can make such assumption that the position and the velocity of
each atom can be calculated by Taylor’s expansion (2.1).
(2.1)
Where r is the position, v is the velocity, a is the acceleration. we can rewrite the
displacements at small time steps as
(2.2)
Summing these two equations, one obtains

7
(2.3)
This formula uses positions at time t and t- to calculate new positions at time t+
(2.2 2.3). One advantage by such calculation is that it largely reduces the errors
introduced when a relatively larger time step is used. In most MD simulation, this
formula is used as basic integration algorithms.
2.2 The Simulation Proceeds
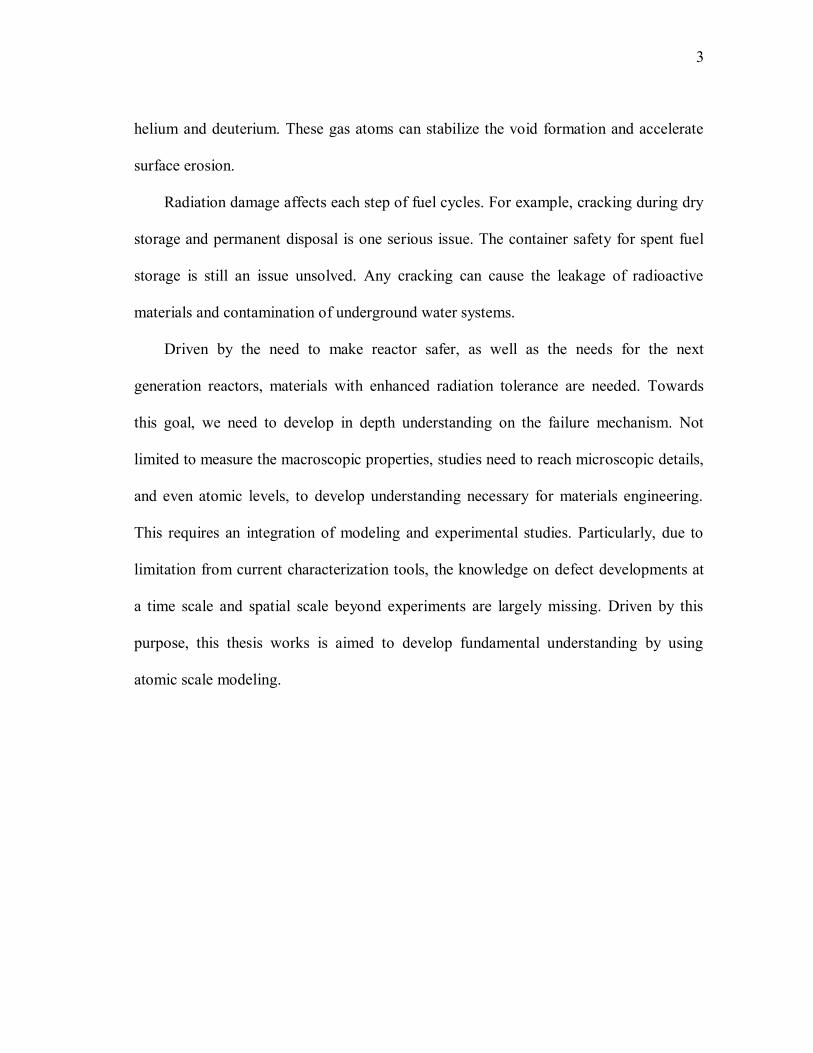
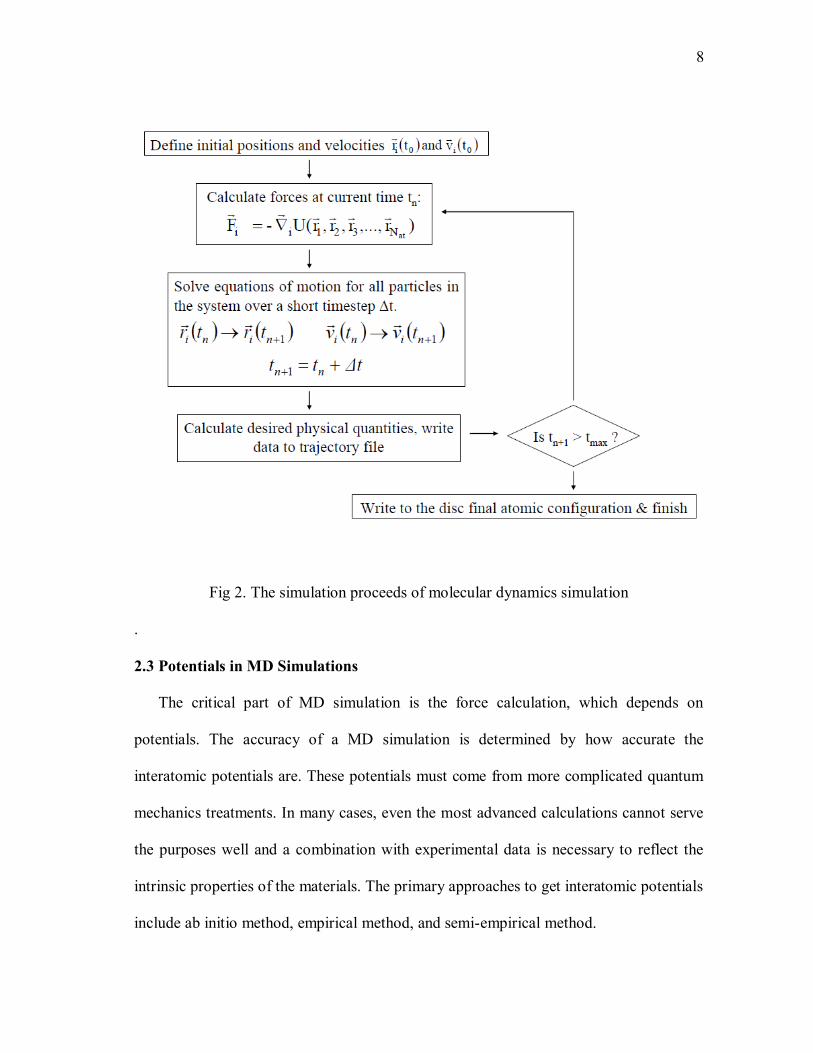
Fig.2 schematically shows MD simulation procedure. At beginning, positions and
velocities of all atoms are defined, then forces are calculated based on the potential
gradients. Then, displacement equations are solved for all atoms in the system over time
step and physical quantities of interest are extracted, such as temperature, energy,
pressure etc. If the total computational time satisfies , the program will go back
to the stage of calculating forces, so on repeating the steps within the loop, until finally
.
8
Fig 2. The simulation proceeds of molecular dynamics simulation
.
2.3 Potentials in MD Simulations
The critical part of MD simulation is the force calculation, which depends on
potentials. The accuracy of a MD simulation is determined by how accurate the
interatomic potentials are. These potentials must come from more complicated quantum
mechanics treatments. In many cases, even the most advanced calculations cannot serve
the purposes well and a combination with experimental data is necessary to reflect the
intrinsic properties of the materials. The primary approaches to get interatomic potentials
include ab initio method, empirical method, and semi-empirical method.

9
Ab-initio methods totally rely on the quantum mechanics. The potentials are created
by the quantum mechanical calculation based on solving a multi-body Schrödinger
equations. The advantage of the method is that almost everything starts from the first
principles. However, certain errors exist due to necessary assumptions and approximated
used to simplify the process. Also certain details are not completely clear such as
electron-electron interactions in heavy atoms.
Semi empirical potentials are also based on quantum mechanics calculation, but
certain items are neglected in the calculation, For example, in Hartree-Fock calculations
the overlapping of specific atomic orbitals are neglected, and the corresponding
contribution is replaced by experimental results, in such a way the computations are less
costly. For empirical potentials, the overlap of specific atomic orbitals are totally
neglected and many free parameters are introduced to predict experimental observations.
2.4 Pair Potentials and Many-body Potentials
Pair potentials are used to describe the interactions between two isolated atoms, so it
is also called pair potential. There are many ways to describe pair potentials, for example,
one most popular one is Lennard-Jones potential [6], which is excellent for rare gas.
Equation 2.5 is the mathematic form of Lennard-Jones potential. But it is oversimplified
for describing other non-gas elements and complex systems.
(2.5)

10
(2.6)
Multi-body potentials are very different from pair potentials. The potentials must
include the effects of three or more particles interacting with each other. One typical
example is embedded-atom method (EAM) potential (2.5) [7]. which is based on
calculation from a sum of the contributions from surrounding atoms.
2.5 LAMMPS
There are many commercial softwares available for MD simulation (APPENDIX A).
LAMMPS is one widely used in many areas. LAMMPS (Large-scale Atomic/Molecular
Massively Parallel Simulator) is created and maintained by Sandia National Laboratories
[8], as a free open-source code and written in C++. The details of information can be
given from LAMMPS official website.
In order to make MD simulation run on LAMMPS, input file, potential file, and
executable file are needed. However, to utilize LAMMPS for damage calculations,
modification and extra cares are needed. Although LAMMPS provides many default
potentials which predict bulk properties very well, they are not suitable for short range
atomic interactions like those encountered in ion solid interactions. The standard input
file of LAMMPS was provided in APPENDIX B. Besides, LAMMPS do not have
functions to differentiate defects. Self-made software is needed to extract defect
information. Furthermore, LAMMPS does not provide visualization capability, though
this can be readily solved by using other software such as VMD and PyMOL. We have
11
provided the software for defect calculation as an APPENDIX C at the end. In
APPENDIX C, C++ code was used to determine vacancies and interstitials by the
distance.

12
CHAPTER III
MOLECULAR DYNAMICS SIMULATION OF DEFECT
CREATION DUE TO INTERACTIONS OF DAMAGE CASCADE IN
SELF ION IRRADIATED SI
3.1 Introduction of Gibbon’s Overlap Model
Understanding radiation damage creation in solids is important for a wide range of
applications in semiconductor industry and nuclear industry. In particular case, the
radiation damage is created under the high flux radiation. It is quite different from the
case of low flux radiation. The ion bombardment happens independently, that means
damage cascade created bu one ion can’t reach to another. While when the flux is high
enough, it increases the chance of damage overlap. Interactions among damage cascades
created by different ions play an important role in defect formation [9]. Such interactions
are particularly important in high flux ion irradiation and, as one example under extreme
conditions, in cluster ion irradiation in which multiple atoms in the same cluster
bombard a solid simultaneously [10].
In an analytical approach to account for the damage cascade interactions, Gibbon first
introduced an overlap mode [11], based on the following assumptions: (1) each
individual damage cascade is described as a partially damaged zone; and (2) the
overlapping of two (or more) partially damaged zones forms a permanent damage zone.
This model suggests that for two simultaneously arrived ions, the closer the proximity,
13
the higher the permanent damage. Later, Dennis and Hale proposed a modified model in
which a single damage cascade consists of a permanently damaged core and surrounding
partial damage region [12]. Following this model, for two damage cascades being close
to each other, the final damage would result from the competition between the
overlapping of the partial damage regions (which increases defect formation efficiency)
and the overlapping of the permanent damage region (which reduces defect formation
efficiency). With decreasing separation distance, permanent damage may first increase
then decrease, due to the transition between two overlapping mechanisms. The above
pictures, however, are not validated by atomic scale modeling. Also, it remains unclear
about the nature of so called damage overlapping.
3.2 Method Used for MD Simulation of Radiation Damage Overlap
In the present study, the classical molecular dynamics code LAMMPS [13] was used
to exam interactions of two damage cascades spaced in close proximity. A <100> Si was
bombarded simultaneously by two Si ions of 2 keV, with their initial separation distance
ranging from 0.24 nm (bond length for a Si dimmer) to 7.5 nm. The Si-Si interatomic
potential was described by a Tersoff potential [14], with a smooth transition to Ziegler-
Biersack-Littma at close atomic distances [15]. The cell contains 0.5 million atoms with
periodical boundaries. The damage development was simulated up to 21.5 ps upon ion
hitting. Both Si ions hit the <100> Si substrate at an incident angel of 9 o to avoid
channeling phenomenon.

14
3.3 Results and Discussion
Fig.3 plots the displacements per atom as a function of separation distances. The data
were collected at 1.5 ps and 21.5 ps, respectively. The most noticeable feature of both
curves is the creation of peak damage at the separation distance of ~0.6 nm. At very
large separation distance, the damage is low and stays at the roughly the same level.
With distances reduced to be less than 1.0 nm, the damage drastically increases and
reaches a peak at a separation distance of 0.6 nm. Beyond that, the damage quickly drops
with reducing separation distance. For a single ion irradiation, the displacement number
is 120, approximately a factor of 2 larger than what obtained from binary collision code
SRIM [15]. Findings from Fig.3 support the major features predicted by the empirical
overlapping model, although the mode is based on a crude assumption on its cylindrical
damage tomography [12].

15
Fig 3. MD simulation obtained displacement numbers at time 21.5t ps and 1.5t ps
MD simulations agree with the model that at large separation distance, damage
creation is independent of separation distance due to the lack of cascade interactions. If
the separation distance satisfying 2a pdr r r , where pdr is the radius of partially
damaged zone and ar the radius of permanent damage zone, damage is enhanced due to
overlapping. If 2 ar r , damage creation is determined by the competition between the
overlapping of the partial damage and the overlapping of the permanent damage. As
shown in Fig. 3, displacement peaks at r =0.6 nm, which could be regarded as barely

16
touching of two permanent damage region with ar =0.3 nm. At zero separation distance
with a complete overlapping, the normalized displacement per atom is 2 2pdr . Since,
according to MD simulation, the displacement number at small separation distance drops
to a value comparable to that of single ion irradiation, we have 2 22pd ar r . This
suggest that 0.42pdr nm, which agrees with MD simulation result that at ~1 nm
( 2 pdr ), displacement start to rise.
It is unclear from Fig. 3 though, at which defect development stage, overlapping leads
to enhanced defect creation. For clarification, Fig. 4 (a) and 4 (b) show the displacement
number changes as a function of time for 0.6r nm and 0.6r nm , respectively. At the
beginning of the collision stages (t<0.2 ps), displacements increase with roughly the
same creation rate and defect buildups are insensitive to separation distances. At the time
of a fraction of ps, displacements reach maximum, but their peak values and the times to
reach these peaks, are different under different separation distances. Finally, at longer
times during quenching and annealing stages, displacements drop and became saturated
at different numbers.

17
Fig 4. Time evolution of displacement numbers in Si upon simultaneous bombardments
by two Si ions with a separation distance of (a) 0.6 nm and (b) 0.6 nm.
As the first attempt to understand the separation distance dependent defect creation,
we calculated defect annealing efficiency by using the final defect number
(corresponding to the longest computation time t=21.5 ps) and the peak damage. As
shown in Fig. 5, the ratios have small fluctuations and range from 0.5 to 0.6. On the
other hand, as shown in Fig. 3 for t=21.5 ps, there are 184 displacements created for r=

18
7.5 nm and 124 displacements for r=0.6 nm. This corresponds to ~50% difference in
defect creation, which is much larger than the small fluctuations observed in Fig.5. As a
result, we believed that the large differences in final defect numbers are primarily caused
by the difference in peak damage.
Fig 5. The times reaching maximum displacement numbers for two Si ions bombarding
at different separation distance.
Careful investigations on Fig. 3 suggest that the higher the maximum displacements,
the longer the time required reaching the maximum. Fig.6 plots the corresponding time
for peak damage creation as a function of ion separation distance. Although the data
19
exposes fluctuations, the trend agrees in principle with that observed in Fig.4 The
damage is peaked at 0.6 nm and drop at either longer separation distance or shorter
distances. This observation leads to one possible explanation (yet to be verified): if
overlapping changes the kinetic energy of the displacement and shifts the energy
distribution upward to higher numbers, this could lead to more displacement creating,
and correspondingly, requires longer time to reach maximum damage creation.
To verify the above hypothesis, Fig.7 compares the kinetic energy distributions of
single ion and of dimmer at r=0.6 nm. Both distributions correspond to t=0.2 ps, which
is 0.08 ps ahead of the time for the dimmer to reach maximum damage. Surprisingly,
although the dimmer has enhanced defect creating at later time, there is no evidence that
its kinetic energy distribution was shifted upward to a higher value. For both energy
distributions, except for a few displacements having a kinetic energy of 10-13 eV,
majority of the displacements has values less than 10 eV. For the dimmer, although
displacements keep increasing, the kinetic energy distribution at t=0.2 ps shows that
there are no atoms energetic enough to cause further displacements since all of them
have kinetic energies less than the displacement threshold in Si, which is about 15 eV
[16]. Thus, the observed enhanced damage under overlapping could not be explained by
the standard binary collision model, since such a soft energy distribution does not expect
to create defects.

20
Fig 6. Defect annealing efficiencies calculated by using the maximum displacements and
the final displacements at time 21.5t ps , for different ion separation distances.
Discussions so far suggest that the key to understand the overlapping effects is not in
the collision stage but in the thermal pike stage in which energy redistribution at low
energy region is dominant. According to the modeling works done by Santos et al.[17],
defect creations at energy below the displacement threshold are possible if the deposited
energy is high enough to induce melting. Due to quick heat dissipation after the melting,
amorphous packets are expected to form in the originally molten region [17]. Whether
an energy deposition can induce melting is determined by the competition between the

21
energy deposition density and the energy dissipation rate [17]. Santo et al. calculated the
critical time period to melt a Si sample having different initial energy densities and
found that the higher the kinetic energies, the quicker the time to covert the energy to the
potential energy required for melting. The value of 1 eV/atom was found to be the
threshold value for metling [17]. This number is consistent with the fact that for liquid Si
at the melting temperature, the kinetic energy is about 0.3 eV/atom and the potential
energy of 0.7 eV/atom[18]. For these zones having energy densities close to 1 eV/atom,
the required incubation period for melting is relatively long[17]. For example, it requires
27 ps to melt a region having kinetic energy of 1 eV/atom [17]. A longer incubation
period means more difficulties to induce melting due to energy dissipation. On the other
hand, the region of low energy deposition density may not lead to defect formation
directly, but the overlapping of such regions could increase energy deposition density
and reduce the incubation period. So melting could be promoted and subsequent defect
creation be enhanced. We believe such overlapping enhanced melting is the main
mechanism of damage enhancement.

22
Fig 7. Kinetic energy distributions of displacements created at time 0.2t ps after
bombardments by two Si ions at a separation distance of 0.6 nm. The distribution for
single ion irradiation is also plotted for comparisons.
For damage cascade formation in reality, it is difficult for light ion irradiation to
cause local melting since the damage tomography is featured by separated point defect
formation. Even small damage zone is formed, quick energy dissipation will inhibit
melting. For heavy ion irradiation, it often creates large damage cascades with in-core
region well exceeding the energy deposition density of 1eV/atom. Due to very short time
required to reach liquid phase formation, i.e. 35 fs for 4 eV/atom, it is reasonable to treat

23
this in-core region as a permanent damage region and surrounding out-core region as
partial damage region. For a dimmer spaced at a very short separation distance, damage
will be enhanced due to overlapping of out-core regions and, reduced due to overlapping
of the in-core regions. As a result, the final defect number is determined by this
competition process and depends on the ratio between two regions.
In addition to the above mechanism, enhanced melting is expected when two damage
cascades interact and cause temperature enhancement in localized regions. Previous MD
simulations have shown that with increasing ambient temperature, the size of molten
regions in Cu increase [19]. With two damage cascade in close proximity, energy
dissipation from each other will reduce temperature gradients and thus increase
incubation period for melting. This may promote melting for the the region have density
deposition density close to 1eV/atom.
In MD simulation, electron excitation is normally neglected. In classical theory, the
electronic stopping will not lead to atomic displacements, particularly for the ion solid
interaction at low energy region, as the present study. It needs to point, however, a
similar thermal spike exist in the electron subsystem. Electron excitation and ionization
occur in a very short time scale (of the order of 10-15s), which is much faster than the
time scale of damage cascade (of the order of 10-12s). Thermalization of such excited
electrons also occurs at a very short time scale (of the order of 10-15s). As a result, the
thermal spikes in two different subsystems (electron vs. atoms) could be separated [20].
Due to much short time scale for electron heating and thermalization, contribution of
heating from electron-phonon interactions should have small effects on the melting
24
process. Furthermore, although two ions hit the substrate simultaneously, the difference
in ion trajectories will cause some time difference in electron thermal spike formation,
which makes it difficult to have spike overlapping for the electron system.
The study is critical to understand radiation damage caused by cluster ions for which
multiple atoms are bonded together as a heavy project bombarding the solids [21-26].
Upon penetration, a cluster will dissociate into individual atoms after a few monolayers.
But cascades causing by individual atoms from the same cluster keep close proximity,
thus leading to significant overlaps. Numerous experimental studies show that cluster
ion bombardments have nonlinearly enhanced irradiation damage and sputtering [21-26].
Shao et al. have applied the concept of overlapping and develop an analytical model for
describing cluster ion damage [26]. The model, however, was based on the assumption
that each individual damage cascade consist of partial damage only, an extension from
early model from Gibbons. This present study suggests that it might necessary to
introduce an amorphous core region for each damage cascade to account for the
observation that at very close proximity, the defect creation efficiency drops.
In summary, using MD simulations we have shown that for two 2 keV Si ions
simultaneously bombarding a Si substrate, the numbers of displacement created are
sensitive to the separation distance between two atoms. Using single ion irradiation as
reference, the damage per ion is enhanced and peaked at 0.6r nm . For r>0.6 nm, the
defect numbers decrease with increasing separation distance and approach to the value
corresponding to the singe ion irradiation. For r<0.6 nm, the defect numbers also drops
at very short separation distance. Such an observation verified the key assumption made
25
in the previous empirical overlapping modelthe existence of permanent damage and
partial damage regions. Time evolution of defect numbers shows that enhanced
displacement creation does not occur in the collision stage, but in the thermal spike stage
in which all displacements have energies below the displacement threshold. This
suggests the damage enhancement comes from increased melting of the damage cascade
regions.

26
CHAPTER IV
USING CLUSTER ION BOMBARDMENT TO DETERMINE
AMORPHIZATION MODE
4.1 Introduction of Irradiated Amorphization
In order to extent the concept of radiation damage overlap to applications, we used
silver clusters with different size bombard Strained SiGe. Strained SiGe technology has
been utilized as a substrate engineering to achieve enhanced carrier mobility in advanced
microelectronics [27-28]. Understanding radiation response of strained Si is important
for device doping using ion impanation technique, and for evaluation of device
reliability in harsh environments involving particle irradiation, such as out space. For ion
bombardment of solid crystalline materials, Gibbons introduced the overlap model to
describe damage accumulation as mentioned in Chapter IV [11]. This model assumes
that each ion incident on a target will create a partially damaged region, and overlap of
these regions will cause permanent damage [11].It is generally believed that bulk Si
follows such an overlap model [11]. But amorphization mechanism in strained Si is not
known. Previous studies have shown that SiGe layers have poor radiation tolerance
when compared with strain-free Si [11, 29]. In a heterogeneous Si/SiGe superlattice, the
SiGe layer is preferentially amorphized under ion bombardments [11, 29]. One
hypotheise, yet to be determined, is that strain may change the amorphziation
mechanism into a direct amorphization model, in which permanent damage forms
directly upon individual ion hits, without damage overlap[30].

27
One primary approach to study amoprhization mechanism of solids is to obtain
damage buildups as a function of ion fluencies. The method, however, leads to similar
fluence dependence for both direct amorphizatin and overlap models. In the present
study, we propose to use cluster ion irradiation as a tool to study amorphization
mechanism in a SiGe layer. The experiment observations were further compared with
analytical mode and molecular dynamics simulations to gain insights into the mechanism.
Strained layer samples were grown by molecular beam epitaxy at 650 oC. The
sample consisted of 50 nm Si0.8Ge0.2 on the top of a 200 nm Si buffer layer, which is
grown on a <100> Si substrate. Samples were irradiated with Agn cluster ions at room
temperature with cluster size (the number of atoms in a cluster) taking n=1,2,3, and 4,
respectively. For all cluster sizes, energy per Ag atom is always 12 keV and the
equivalent Ag atomic fluence is always 2.5×1013 cm-2. According to the Stopping and
Range of Ions in Matter code[31], the projected range of Ag atoms is 12 nm. Samples
were characterized by Rutherford backscattering spectrometry with a 2 MeV He analysis
beam. Backscattering yields were detected by a semiconductor detector at 170°, with an
energy resolution of 17 keV.
4.2 Method of MD Simulation for Irradiated Si
MD simulation was performed by using LAMMPS (Large-scale Atomic Molecular
Massively Parallel Simulator) code [13]. For both Si-Si and Si-Ge pairs, Tersoff
potentials [14] were smoothly connected to ZBL(Ziegler-Biersack-Littmark) potentials
[15] at short atomic distances. For both Ag-Si and Ag-Fe pairs, ZBL potential are used

28
only due to the nature of ion-solid interactions. The target has a cell size of 35 nm × 35
nm × 35 nm which contains about 2,200,000 atoms with periodical boundary conditions.
20% Si atoms were replaced by Ge atoms randomly to simulate a Si0.8Ge0.2 film. Ag
atoms bombard with a tilt angle of 9 o from the target normal to avoid channeling effects.
Damage developments were simulated at a time step of 0.25 fs.
In Gibbons’ model, partially damaged regions are created by individual ions which
are randomly distributed. Thus, significant overlapping occurs only under high fluence
irradiation. For cluster ion irradiation, atoms in one cluster arrive at the sample surface
simulataneously, and overlapping occurs within the cluster, regardless of cluster
fluencies. The level of overlapping is determined by cluster size and distribution of an
individual damage volume within a cluster. Shao et al. has derived the following
analytical equation [24]
1
0
1 exp!
km
d
k
nV n
k
(4.1)
where dV is the volume of permanent damage in a cluster, m is the number of
overlapping required to cause permanent damage, n is the cluster size and δ is volume
correction factor, which is defined as the ratio of individual damage volume created by
one atom ( sV ) to the average damage volume created by one cluster ( cV ). cV is
virtually created by bombardments of atoms one by one from the same spot. Thus cV
equals averaged sV . Based on this picture, early data from Sigmund et al. on ratio of sV

29
to the averaged sV can be used [32]. Through curve fitting of data in Ref. 32, we
obtained the following expression
3
2 10.52 0.46exp[ ( / ) /1.02]M M (4.2)
Where 1M and 2M are mass of the incident and target atom, respectively.
4.3 Results and Discussion
Fig. 8 plots the damage creation per Ag atom ( /dV n ) as a function of Ag cluster size
n . The curve was predicted by using equation (4.1) with 0.6 , which is obtained
from equation (4.2) by using a mean atomic mass 2 37M for Si0.8Ge0.2. For the direct
amorphization model (m=1), damage decreases with increase sizes. This is
understoodable since structure collapses directly upon monomer bombardment, and any
overlapping within the cluster will lead to repeated damage, which in turn reduces the
power of damage creation per atom. For single overlap model (m=2), damage quickly
increases to a saturation and slightly decreases with larger cluster size. Saturation is the
result of balance between permanent damage creation due to overlapping of partial
damage and repeated damage creation due to overlapping of created permanent damage.
For double overlap model (m=3), formation of permanent damage and its subsequent
overlapping are difficult for small clusters, it requires a large cluster size to reach
damage saturation.

30
Fig 8. Permanently damaged volume created per incident atom in cluster ions with size 1
to 5 atoms, predicated from Eq. (4.1) by assuming the direct amorphization (m=1),
single overlap (m=2), or double overlap (m=3) models.
Fig.9 shows channeling RBS spectra obtained from samples irradiated with Ag
clusters of sizes from n=1 to n=4. For both Si and Ge signals, the backscattering yields
are increasing with increasing Ag cluster sizes. The inset shows the enlarged spectra for
Si damage and the straight line was used to read yields of irradiated samples ( Y ), virgin
sample under channeling ( vY ) and virgin sample under random mode ( ranY ). The fraction
0 2 4 6
0.0
0.1
0.2
0.3
0.4
0.5
0.6Ag into Si
0.8Ge
0.2
m=3
m=2
m=1 direct amorphization
Perm
anen
t d
am
age
per
ato
m (
arb
i. u
nit)
Ag cluster size

31
of displacements at the damage peak was calculated by 1 [( ) / ( )]ran ran vf Y Y Y Y .
The way to read random yield considers the resolution limit for such shallowly located
damage peaks.
Fig 9. Channeling RBS spectra of 2 MeV He ions along <100> axis in virgin and Agn-
irradiated Si0.8Ge0.2 layers. The random spectrum is plot for comparison.
Fig.9 plots the extracted displacement fraction for Si and Ge. Damage is nonlinearly
enhanced as a function of cluster size. The observations, in comparison with Fig. 10,
lead to conclusion that the Si0.8Ge0.2 layer does not follow a direct amorphization mode.
300 400
0
5000
10000
Ge
Si
Random
Ag4
Ag3
Ag2
Ag1
Virgin
RB
S Y
ield
Channel number

32
Further comparision to extract the value m is questionable here since the analytical mode
is too simplified without considering atomic scale defect interactions. The displacement
ratios are ranged from about 0.2 for monomers and 0.4 for Ag4 clusters. This suggests
that the Ag fluence were appropriately selected: the fluence is high enough to create
damage in the sensitive level for RBS (>0.02) and low enough to avoid significant
overlapping between clusters. Furthermore, there is no noticeable difference between
displacement creation for Si and Ge in the same Si0.8Ge0.2. It is obvious in Fig.10 that
the enhancement of radiation damage is a function of the size of Ag cluster. That means
each atom in Ag cluster creates lager damage than the damage create by single atom.
This is very important if we intent to build amorphization in materials and also important
for us to understand the mechanism of the interactions between energetic clusters and
materials. In this case, that result is significant helpful for us to understand such
amophization phenomenon.

33
Fig 10. Displacements of Si and Ge atoms, extracted from Fig. 9, for Agn cluster ion
irradiated Si0.8Ge0.2 layer.
Fig.11 shows the time dependence of displacement creation by different Agn clusters
obtained by using MD simulations. For each curve, displacement numbers were
normalized by cluster sizes. With increasing cluster sizes, both damage peak and the
residual damage after thermal spike quenching increase. The largest cluster Ag4 creates
about 1000 displacements per atom at t=1ps, while Ag monomers creates only about 300
displacements per atom. The insets show the corresponding 3-D damage cascade
formation at t=1ps. For monomer irradiation, damage is peaked at the projected range,
1 2 3 4
0.2
0.3
0.4 Si
GeF
ractio
n o
f d
isp
lace
me
nt a
t d
am
ag
e p
ea
k
Cluster size

34
while for Ag4 cluster, damage is peaked at the near surface region, which can be
attributed to a high degree of overlapping for individual damage cascades near the
surface.
Fig 11. MD simulations of displacement creation in Si0.8Ge0.2 layer upon Agn ion
irradiation. The insets show the displacements caused by a Ag4 cluster and by a Ag
monomer at t=1ps.
Fig. 12 plots the displacement per Ag atom for different Agn clusters at t=1ps. The
error bars represent the range of displacements created by randomly changing azimuthal
angles of incident ions. Nonlinearly enhanced damage by cluster bombardment is
obvious, which agree with RBS channeling data. No attempt is made in the present study
0.0 0.2 0.4 0.6 0.8 1.0
0
200
400
600
800
1000
1200
1400
Ag1
Ag4
Dis
pla
cem
ents
Time(ps)
Ag4
Ag3
Ag2
Ag1

35
to directly compare RBS data with MD simulation since the time scale of the modeling
is too short. For selected cases, MD simulation up to 20 ps has been performed which
suggest the residual damage does not change too much (<20%) when compared with that
at 1 ps.
Fig 12. Displacements (Si+Ge) in Agn-irradiated Si0.8Ge0.2 layers at t=1ps, obtained from
MD simulations.
In a crystalline solid, introducing point defects will increase system energy. If this
energy is higher than a threshold energy, structure either collapses or form large defect
1 2 3 4
200
400
600
800
1000
Dis
pla
cem
ents
Ag cluster size

36
clusters to reduce the energy [8]. This picture actually can explain both the
heterogeneous and homogenous amorphization/permanent-damage-formation models.
The primary difference between two modes is that for heterogenous model energy
increases are contributed by overlapping of damage volumes, which often occurs in
heavy ion irradiation, while for homogenous model, the energy increase is caused by
accumulation of point defects which often occurs in light ion irradiation. The presence
of Ge atoms, together with strain and localized stress, inevitably increase the system
energy. Although it is expected the required energy to achieve amorphization transition
or permanent damage is reduced in strained Si, the present study suggests that the
material still needs overlapping for this process.
Strain or Ge chemical effects on diffusivities of point defect and formation energy of
defect clusters [33]. A small change in migration energy of mobile defects can greatly
change interstitial-vacancy recombination process. Strain can also affect kinetics of
defect formation. In previous study by Vos et al. [29], it was suggested that creation of
displacements does not differ greatly between strained Si and Si, but the subsequent
defect rearrangement of the defects plays a role in determining radiation response of the
material. This is consistent with the observation from Crosby et al. those dislocation
loops densities significantly increase in strained Si [34]. These observations suggest the
necessity to systematically study the kinetics of defect reactions, which is beyond the
scope of the present study.
In summary, based on the very different damage buildup behaviors between
monomer ion irradiation and cluster ion irradiation, we proposed to use cluster ion

37
bombardments as a tool to understand amorphization mechanism for crystalline solids.
By applying this technique to strained Si0.8Ge0.2 layer by using Agn cluster ion irradiation,
we have show that the strained layer follows overlap model for
amorphization/permanent damage formation. The observed nonlinear enhancement in
damage formation agrees with MD simulations.

38
CHAPTER V
MOLECULAR DYNAMICS SIMULATION OF ION FOCUSING
AND CROWDION FORMATION IN SELF-ION IRRADIATED FE
5.1 Introduction of Radiation Damage in Fe
In Chapters IV and V, we have talked about radiation damage in Si and SiGe, but
radiation damage in metal is quite different. Studies on radiation damage in metals has
been driven greatly by the needs for materials applications in harsh environments, i.e.
fission and fusion reactors [35]. Progress towards fundamental understanding of defect
developments has been aided by emerging atomic scale characterization and quantum
mechanics many-body simulations. Among them, molecular dynamics (MD) simulation
is an important modeling tool to reveal the damage development at early stage of a few
picroseconds. This time scale corresponds to damage cascade formation, a phenomenon
involves damage deposition and subsequent quenching process in a period so short that
materials behaviors cannot be predicted by knowledge obtained under equilibrium
conditions [4].
Early MD simulation showed that damage cascade is featured by a vacancy rich core
surround by an interstitial shell [36]. Damage cascade forms when the mean flying
distance of projectile becomes comparable to the mean atomic distance of a target solid,
thus they are created when projectiles or recoiled target atoms have a typical energy of a
few keVs [4]. Later MD simulations show additional features of damage cascades. A
chain-like atomic displacements, so called crowdion [4], is formed along certain atomic

39
row directions. Crowdion is initialized from the damage cascade core, and is a
concequence of subsequent displacements along an atomic row. In literature, such
displacements are described as ion focusingatomic shifting over a limited distance
along the direction of one atomic row. Displacements end when the last displaced atom
does not have enough kinetic energy to displace the next atom.
At the end of damage cascade formation, most point defects disappear due to kinetic
defect recombination. Surviving defects begin to take stable configurations after
structure relaxation [4]. These defects are precursors to extended defects, which are the
source of series of materials degradation phenomenon [37-40]. In this study, crowdion
formation in self ion irradiated iron (Fe) is investigated by using MD simulation to
obtain further atomic scale details.
5.2 Method of MD Simulation for Irradiated Fe
MD simulation was performed by using LAMMPS. The details about the parallel
spatial-decomposition, neighbor-finding and communication algorithms can be found in
Ref. 13. The Fe-Fe interatomic potential was described by embedded-atom method
(EAM) [7]. EAM is based on fitting to both experimental results and first principle
calculations, and predicts thermal and mechanical properties with high accuracy. The
EAM potential is generally superior to the second-moment approximation of the tight-
binding method for simulation of metals [41]. In MD simulations, one 2 keV Fe atom
bombarded a bcc Fe at room temperature, with an incident angle of 9o to avoid
channeling effect. Random thermal oscillation of atoms, which is crucial to simulate

40
defect reactions, has been considered by following the standard procedure in MD
simulation of damage creation [42]. The inelastic energy loss is not considered since
electronic stopping is negligible for such low energy ion irradiation. The Fe target has a
cell size of 14 nm × 14 nm × 14 nm which contains about 250,000 atoms. Periodical
boundary conditions, except for the surface, were used but the cell size was large enough
to contain a single damage cascade completely without damage overlapping. Damage
developments up to 30 ps were simulated at a time step of 0.25 fs. An atom became an
interstitial when it was located away from the lattice site with displacements at least 0.3
of lattice parameter [43]. A vacancy was created if there was no atom within the radius
of 0.3 of lattice parameter [43]. The above criteria have been used generally in MD
simulation of metals, with good sensitivity to identify dumbbell defects.
5.3 Results and Discussion
Fig.13 show damage cascade evolution at 0.1 ps, 0.3 ps, 1 ps, and 30 ps after ion
bombardment. For best imaging, the cell size is much smaller than the super cell used in
MD simulation. The red circles refer to vacancies and the green circles refer to
interstitials. From 0.1 ps to 0.3 ps, damage cascade volume is increasing. Also at 0.3 ps,
chain-like crowdion defects form with a length ranging from 2 nm to 5 nm. The
crowdion defect formation is realized by a series of substituting collisions, with a typical
knock-on energy close to 30 eV (Fe displacement energy). At 1 ps, significant defect
recombination leads to shrinkage of the damage cascade volume. Defect recombination
also restores displacements along crowdions, but leave dumbbell defects at the end of

41
crowdions. One dumbbell defect is featured by two interstitials sitting at each side of an
empty lattice site. MD simulations show that the two interstitials are oriented along
original crowdion direction. At 30 ps, most defects disappear. It is worthy to note that at
this time scale dumbbell defects resulting from crowdion formation represent a
considerable fraction of surviving defects.
Fig 13. Damage cascade evolution from MD simulation of a bcc <100> Fe crystal
irradiated by one 1 keV Fe ion at 0.1 ps,0.3 ps 1 ps,and 30 ps.

42
Fig 14. plots interstitial and vacancy numbers as a function of times. Displacements
first increases, then decrease at a time longer than 0.3 ps. Interstitial and vacancy
numbers are roughly the same at the beginning but vacancies begin to be slightly richer
at about 0.3 ps, which corresponds to the time reaching a maximum cascade volume.
Our analysis further suggests that the defect imbalance is caused by sputtering of atoms
from the surface, which occurs when the damage cascade begins to touch the surface
significantly.
0.0 0.2 0.4 0.6 0.8 1.0
0
100
200
300
400
500
600
700
800
Def
ects
Time(ps)
vacancy
interstitial atom
Fig 14. Numbers of interstitials and vacancies as a function of times after 2 keV Fe ion
bombardment of a bcc <100> Fe crystal.

43
One important feature observed in Fig.14 is that beyond 0.3 ps, defect numbers show
a second peak at about 0.45 ps. The time dependent damage buildups can be described
by a small Gaussian peak superimposed on a big one. The second peak is attributed to
delayed defect creation due to crowdion formation. While the damage cascade core
begins to have defect recombination, crowdions are being formed. The time difference
between 0.3 ps and 0.45 ps represents an effective lifetime of crowdion defects. The
defects survived from crowdion relaxation play a role in determining the tail region of
the curve. From 0 to 0.3 ps, the displacement buildups have a smooth curve which
means the total number of defects is large enough that two peaks observed cannot be
explained by statistic fluctuations. This has been further confirmed by repeating ion
bombardment with different bombardment conditions, i.e. by changing incident angles.
Fig.15 shows a more clearly picture that two Gaussian curves are used to fit it. It is
obvious that the process consists of two parts, one comes from the crowdion creation,
the other one comes from the normal thermal spike. That prove the importance the
crowdion in the damage cascade formation.

44
Fig 15. Number of interstitials in a bcc <100> Fe crystal caused by a 2 keV Fe ion.
Fig.16 shows the relaxation of a typical crowdion defect as a function of times. At
beginning, the crowdion is aligned along <111> direction. With increasing times,
crowdion shrinks and, at times beyond 0.6 ps, the survived dumbel defects begin to
rotate towards <110> direction. Fig.17 plots the orientation of defects, the angle between
one dumbbell defect and (100) plane, as a function of time. At the time of 0.83 ps, the
angle becomes zero and dumbbell defect is perfectly align along the <110> direction.

45
Fig 16. Images of typical crowdion and dumbbell defect evolution from MD simulation.
Vacancy in Fe has an inward relaxation and interstitals has an outward relaxation [1].
The strain field around one vacancy is compensated by inserting an interstitial. Thus
forming a dumbbell defect cost less energy than forming three isolated point defects.
<110> oriented dumbbell defects have been identified by previous studies as the
preferred defect configuration in most bcc metals [1]. Consider that <110> direction has
the largest atomic distance, the energy cost to insert one interstitial along <110> is the
least. The dumbbell defects are mobile and subsequent defect clustering leads to larger
defects.

46
0.68 0.70 0.72 0.74 0.76 0.78 0.80 0.82 0.84
0
5
10
15
20
25
Ang
le(
o)
Time(ps)
Fig 17. Angles between the (100) plane and the dumbbell defect orientation as a function
of times upon 2 keV Fe ion bombardment. The zero degree corresponds to the perfect
aliment along <110> direction.
The present study shows that crowdion defect formation is an important mechanism
for displacement transport in the damage cascade formation. Dumbell defects are
scattered in a region larger than the damage cascades and crowdion induced dumbbell
defects contribute significantly to the defect developments.
MD simulation has shown that crowdion defects formed in bcc Fe are propagating
along <111> directions. Crowdion defect starts to form when damage cascade reaches
the maximum volume and contributes a second peak in defect buildups with increasing

47
times. Upon defect recombination, crowdion defects shrink and form <111> oriented
dumbbell defects at the crowdion end. In subsequent structural relaxation, <111>
dumbbell defects rotate and finally align themselves with <110> directions. The
surviving dumbbell defects represent a significant contribution to the final defect
distribution after thermal spike formation.

48
CHAPTER VI
CONCLUSION
Molecular dynamic simulation has been used to simulate damage cascade formation
in ion bombarded solids. Based on MD simulations result, we have shed light into
atomic scale of damage cascade formation in selected ion-target systems.
In the Chapter V the formation and structural relaxation of crowdion in self ion
irradiated Fe were studied. MD simulation has shown that crowdion defects formed in
bcc Fe are propagating along <111> directions. Crowdion defect starts to form when
damage cascade reaches the maximum volume and contributes a second peak in defect
buildups with increasing times. Upon defect recombination, crowdion defects shrink and
form <111> oriented dumbbell defects at the crowdion end. In subsequent structural
relaxation, <111> dumbbell defects rotate and finally align themselves with <110>
directions. The surviving dumbbell defects represent a significant contribution to the
final defect distribution after thermal spike formation. It is conclued that crowdion
forms along the direction with highest linear atomic density and crowdion subsequently
rotates toward the direction has the lowest atomic density. In addition, crowdion play an
important role for determining defect tomography.
In Chapter III MD simulations show that for two 2 keV Si ions simultaneously
bombarding a Si substrate, the numbers of displacement created are sensitive to the
separation distance between two atoms. Using single ion irradiation as reference, the
damage per ion is enhanced and peaked at 0.6r nm . For r>0.6 nm, the defect numbers

49
decrease with increasing separation distance and approach to the value corresponding to
the singe ion irradiation. For r<0.6 nm, the defect numbers also drops at very short
separation distance. Such an observation verified the key assumption made in the
previous empirical overlapping modelthe existence of permanent damage and partial
damage regions. Time evolution of defect numbers shows that enhanced displacement
creation does not occur in the collision stage, but in the thermal spike stage in which all
displacements have energies below the displacement threshold. This suggests the
damage enhancement comes from increased melting of the damage cascade regions.
Based on the very different damage buildup behaviors between monomer ion irradiation
and cluster ion irradiation in Chapter IV, we proposed to use cluster ion bombardments
as a tool to understand amorphization mechanism for crystalline solids. By applying this
technique to strained Si0.8Ge0.2 layer by using Agn cluster ion irradiation, we have show
that the strained layer follows overlap model for amorphization/permanent damage
formation. The observed nonlinear enhancement in damage formation agrees with MD
simulations. The defect formation/amorphization mechanisms of strained SiGe
alloy.Although the strained layer has less radiation tolerance, the defect formation still
follows single overlap model, as that of nonstrianed Si.

50
REFERENCES
[1] G.S. Was, Fundamentals of Materials Science: Metals and Alloys, Springer, New
York, 2007.
[2] J.A. Brinkman, J. Appl. Phys. 25, (1954) 961.
[3] M. Nastasi and J. W. Mayer, Ion Implantation and Synthesis of Materials, Springer-
Verlag, Berlin, 2007.
[4] M.A. Nastasi, J.W. Mayer, and J.K. Hirvonen, Ion-solid Interactions: Fundamentals
and Applications, Cambridge University Press, Cambridge, 1996.
[5] A. Calder website http://www.liv.ac.uk/~afcalder/dispcasc.html (accessed on Nov 2007)
[6] WL. Jorgensen, J. Chandrasekhar, JD.Madura, RW. Impey, ML.Klein, J.Chem.Phys;
79, (1983) 926.
[7] M. S. Daw and M. I. Baskes, Phys.Rev.Lett. 50, (1983) 1285.
[8] S. Plimpton, Fast parallel algorithms for short-rangemolecular dynamics J. Comput.
Phys. 117 (1995) 1–19.
[9] G. S. Was, Fundamental of Radiation Materials Science, Springer-Verlag Berlin
Heidelberg, 2007
[10] T. Aoki, J. Matsuo, Z. Insepov, I. Yamada, Phys. Res. B 121, (1997) 49.
[11] J.F. Gibbons, Proc. IEEE 60, (1972) 1062.
[12] J.R. Dennis and E.B. Hale, J. Appl. Phys. 49, (1978) 1119.
[13 ] S. J. Plimpton, J.Comp.Phys; 117, (1995) 1.
[14] J. Tersoff. Phys. Rev. Lett. 56, 632 (1986).

51
[15] J.F. Ziegler, J.P. Biersack, U. Littmark, Stopping and Ranges of Ions in Matter,
pergamon, New York, 1985.
[16] L.A. Miller, D.K. Brice, A.K. Prinja, and S.T. Picraux, Phys. Rev. B 49, (1994)
16953.
[17] I. Santos, L.A. Marqués, and L. Pelaz, Phys. Rev. B 74, (2006) 174115.
[18] L. A. Marqués, L. Pelaz, M. Aboy, and J. Barbolla, Nucl. Instrum. Methods Phys.
Res. B 216, (2004) 57.
[19] H. Hsieh, T. Diaz de la Rubia, and R.S. Averback, Phys. Rev. B 40, 9986 (1989).
[20] I.M. Lifshitz, I.M. Kaganov, and L.V. Tanatarov, J. Nucl. Energy A 12, 69 (1960)
[21] I. Yamada, G.H. Takaoka, M.I. Current, Y. Yamashita and M. Ishii, Nucl. Instr. and
Meth. B 74, (1993) 341.
[21] W.K. Chu, Y.P. Li, J.R. Liu, J.Z. Wu, S.C. Tidrow, N. Toyoda, J. Matsuo and I.
Yamada, Appl. Phys. Lett. 72, (1998) 246.
[23] J.W. Tape, Nucl. Instr. and Meth. 132, (1976) 75.
[24] P. Sigmund, I.S. Bitensky and J. Jensen, Nucl. Instr. and Meth. B 112, (1996) 1.
[25] H.H. Andersen and H.L. Bay, J. Appl. Phys. 45, (1974) 953.
[26] L. Shao, M. Nastasi, X. Wang, J. Liu and W-K Chu, Nucl. Instr. and Meth. B 242,
(2006). 503
[27] D.J. Paul, Semiconductor Science and Technology, 19, (2004), 75.
[28] M. Lee, E. Fitzgerald, M. Bulsara, M. Currie, and A. Lochtefeld, J. Appl. Phys. 97,
(2005) 011101.
52
[29] M. Vos, C. Wu, I.V. Mitchell, T.E. Jackman, J. Baribeau, and J. McCaffrey, Appl.
Phys. Lett. 58, (1991) 951.
[30] M. Martin, P.E. Thompson, J. Carter, L. Zhu, M. Hollander and L. Shao, Nuclear
Instrum. Methods in Phys. Res. B 266, (2008). 2483.
[31] J.F. Ziegler, Nucl. Instrum. Methods Phys. Res. B 219-220, 1027 (2004);
[32] P. Sigmund, G. Scheidler, and G. Roth, Proc. of the Int'l Conf. on Solid-State-
Physics Research with Accelerators, A. Goland, Ed. (1968), 374.
[33] A. Antonelli and J. Bernholc, Phys. Rev. B 40, (1989) 10643.
[34] R. T. Crosby,a_ K. S. Jones, M. E. Law, and L. Radic, P. E. Thompson, J. Liu, Appl.
Phys. Lett. 87, (2005) 192111.
[35] M. Nastasi and James W. Mayer, Ion Implantation and Synthesis of Materials,
Springer-Verlag, Berlin, 2007.
[36] H.R. Paneth, Phys. Rev. 80, (1950) 708.
[37] J.A. Brinkman, J. Appl. Phys. 25, (1954) 961.
[38] T. Diaz de la Rubia, R. S. Averback, and H. Hsieh, J. Mater. Res. 4, (1989) 579.
[39] A. Meldrum, S.J. Zinkle, L.A. Boatner, R.C. Ewing, Nature 395, (1998) 56.
[40] M. S. Daw and M. I. Baskes,Phys Rev Lett, 50, (1983) 1285.
[41] F. Cleri and V. Rosato, Phys. Rev. B 48, (1993) 22.
[42] D.C. Rapaport, The Art of Molecular Dynamics Simulation, Cambridge University
Press, Cambridge, United Kingdom, 1995.
[43] D. J. Bacon, Tomas Diaz de la Rubia, Journal of Nuclear Materials 216, (1994) 275.

53
APPENDIX A
list of MD simulation software
AutoDock suite of automated docking tools, Autodock Vina improved local search algorithm, suite of automated docking tools, Abalone (classical, implicit water) ABINIT (DFT) ACEMD (running on NVIDIA GPUs: heavily optimized with CUDA) ADUN (classical, P2P database for simulations) AMBER (classical) Ascalaph (classical, GPU accelerated) CASTEP (DFT) CPMD (DFT) CP2K (DFT) CHARMM (classical, the pioneer in MD simulation, extensive analysis tools) COSMOS (classical and hybrid QM/MM, quantum-mechanical atomic charges with
BPT) Desmond (classical, parallelization with up to thousands of CPU's) Culgi (classical, OPLS-AA, Dreiding, Nerd, and TraPPE-UA force fields) DL_POLY (classical) ESPResSo (classical, coarse-grained, parallel, extensible) Fireball (tight-binding DFT) GPIUTMD (classical, accelerated by GPUs, optimized with CUDA) GROMACS (classical) GROMOS (classical) GULP (classical) Hippo (classical) HOOMD-Blue (classical, accelerated by NVIDIA GPUs, heavily optimized with CUDA) Kalypso MD simulation of atomic collisions in solids LAMMPS (classical, large-scale with spatial-decomposition of simulation domain for
parallelism) LPMD Las Palmeras Molecular Dynamics: flexible an modular MD. MacroModel (classical) MACSIMUS (classical, polarizability, thread-based parallelization) MDynaMix (classical, parallel) MOLDY (classical, parallel) latest release Materials Studio (Forcite MD using COMPASS, Dreiding, Universal, cvff and pcff
forcefields in serial or parallel, QMERA (QM+MD), ONESTEP (DFT), etc.) MOSCITO (classical)

54
NAMD (classical, parallelization with up to thousands of CPU's) nano-Material Simulation Toolkit NEWTON-X (ab initio, surface-hopping dynamics) ORAC (classical) ProtoMol (classical, extensible, includes multigrid electrostatics) PWscf (DFT) RedMD (coarse-grained simulations package on GNU licence) S/PHI/nX (DFT) SIESTA (DFT) Tremolo-X VASP (DFT) TINKER (classical) YASARA (classical) XMD (classical)

55
APPENDIX B
Standard input file for LAMMPS
#innitialization
clear
units metal
dimension 3 # Dimensions of space for simulation. 3D is default
newton on on # Newton's 3rd law for pairwise and bonded interactions
# Processors n m o define the proc. grid
boundary p p p # Rules or boundary
atom_style atomic # Rules for atom styles. Atomic is default
# atom_modify
# Atom definition
read_data polyfe.lammps
#read_restart restartGBfe27w
lattice bcc 1
56
region 1 block 95 98.08908 0 98.08908 0 98.08908
region 2 block -20 95 0 98.08908 0 98.08908
group group1 region 1
group group2 region 2
group id id 83740
#group id2 id 432002
#Settings
mass 1 55.845
pair_style eam/fs
pair_coeff * * Fe_mm.eam.fs Fe
min_style sd
minimize 1.0e-12 1.0e-12 1000 1000
#velocity all create 100 56565
#velocity group1 create 300 54545 rot yes dist gaussian

57
velocity group2 create 300 54545 rot yes dist gaussian
velocity all zero linear
velocity all zero angular
fix 1 group2 npt 300 300 1 aniso NULL NULL 0.0 0.0 0.0 0.0 10 drag 1.0
#fix 1 group2 nvt 100 100 1.0 drag 0.2
#fix 1 all nve
fix 11 group1 setforce 0 0 0
#set atom 216001 x -5 y 57.75 z 58
#velocity id set 820.205 130.085 42.985
#velocity id set 0 0 0
fix 3 id setforce 0 0 0
#fix 4 id2 setforce 0 0 0
compute 1 all ke/atom
#min_style cg
#run_style verlet
thermo 10
timestep 0.0005
58
dump atom all xyz 100 grainfe.xyz
#dump atoms all custom 100 feGB1ps-15 id x y z c_1
run 1000
unfix 1
#write_restart restartGBfe-151ps

59
APPENDIX C
C++ code for determining vacancy and interstitial
#include <fstream>
#include <iostream> #include <math.h> #include <vector> using namespace std; float rad = 0.86,range=130; float stable = 0.5; float maxx=127; float maxy=127; float maxz=127; float minx = 2; float miny = 1; float minz = 1; float sBox = 2; float eBox = 127; float coe = 2; //int SK = 2; //int step = 5; void main() { char filename[] = "data/sample.xyz"; char firstFrame[] = "data/standrad.xyz"; char searchFile[] = "data/sample"; char savefilename[] = "data/A.SEG"; char savefilename2[] = "data/B.txt"; char savefilename3[] = "data/C.SEG"; char savefilename4[] = "data/D.txt"; char NumString[20]; char keyword[256]; int Num, temp, n=0,count=0; float posx,posy,posz; float posxx,posyy,poszz; float nposx,nposy,nposz; float xxx,yyy,zzz,vvv; float dis,dis1,dis2,dis3; float min,max; vector<float> px,py,pz; vector<float> tx,ty,tz; vector<float> cx,cy,cz; vector<float> vx,vy,vz,vv; vector<int> sphereStat; vector<int> atomStat;
60
ifstream is(filename, ios::in); ifstream is3(searchFile, ios::in); ifstream sds(firstFrame, ios::in); ofstream ofs(savefilename,ios::out); ofstream ofs2(savefilename2,ios::out); ofstream ofs3(savefilename3,ios::out); ofstream ofs4(savefilename4,ios::out); ofs<<"from pymol.cgo import *"<<endl; ofs<<"from pymol import cmd"<<endl; ofs<<"box = ["<<endl; ofs<<"LINEWIDTH, 1.0,"<<endl; ofs<<"BEGIN, LINES,"<<endl; ofs<<"COLOR, 0.8, 0.8, 0.8,"<<endl; ofs<<"VERTEX,"<<eBox<<","<<eBox<<","<<eBox<<","<<endl; ofs<<"VERTEX,"<<eBox<<","<<sBox<<","<<eBox<<","<<endl; ofs<<endl; ofs<<"VERTEX,"<<eBox<<","<<eBox<<","<<eBox<<","<<endl; ofs<<"VERTEX,"<<eBox<<","<<eBox<<","<<sBox<<","<<endl; ofs<<endl; ofs<<"VERTEX,"<<eBox<<","<<eBox<<","<<eBox<<","<<endl; ofs<<"VERTEX,"<<sBox<<","<<eBox<<","<<eBox<<","<<endl; ofs<<endl; ofs<<"COLOR, 0.5, 1.0, 0.5,"<<endl; ofs<<"VERTEX,"<<sBox<<","<<sBox<<","<<sBox<<","<<endl; ofs<<"VERTEX,"<<sBox<<","<<eBox<<","<<sBox<<","<<endl; ofs<<endl; ofs<<"VERTEX,"<<sBox<<","<<sBox<<","<<sBox<<","<<endl; ofs<<"VERTEX,"<<sBox<<","<<sBox<<","<<eBox<<","<<endl; ofs<<endl; ofs<<"VERTEX,"<<sBox<<","<<sBox<<","<<sBox<<","<<endl; ofs<<"VERTEX,"<<eBox<<","<<sBox<<","<<sBox<<","<<endl; ofs<<endl; ofs<<"COLOR, 0.8, 0.8, 0.8,"<<endl; ofs<<"VERTEX,"<<eBox<<","<<sBox<<","<<eBox<<","<<endl; ofs<<"VERTEX,"<<sBox<<","<<sBox<<","<<eBox<<","<<endl; ofs<<endl; ofs<<"VERTEX,"<<eBox<<","<<sBox<<","<<eBox<<","<<endl; ofs<<"VERTEX,"<<eBox<<","<<sBox<<","<<sBox<<","<<endl; ofs<<endl; ofs<<"VERTEX,"<<eBox<<","<<eBox<<","<<sBox<<","<<endl; ofs<<"VERTEX,"<<sBox<<","<<eBox<<","<<sBox<<","<<endl; ofs<<endl; ofs<<"VERTEX,"<<eBox<<","<<eBox<<","<<sBox<<","<<endl; ofs<<"VERTEX,"<<eBox<<","<<sBox<<","<<sBox<<","<<endl; ofs<<endl; ofs<<"VERTEX,"<<sBox<<","<<eBox<<","<<eBox<<","<<endl; ofs<<"VERTEX,"<<sBox<<","<<eBox<<","<<sBox<<","<<endl; ofs<<endl; ofs<<"VERTEX,"<<sBox<<","<<eBox<<","<<eBox<<","<<endl; ofs<<"VERTEX,"<<sBox<<","<<sBox<<","<<eBox<<","<<endl; ofs<<endl;

61
ofs<<"END"<<endl; ofs<<"]"<<endl; ofs3<<"from pymol.cgo import *"<<endl; ofs3<<"from pymol import cmd"<<endl; ofs3<<"box = ["<<endl; ofs3<<"LINEWIDTH, 1.0,"<<endl; ofs3<<"BEGIN, LINES,"<<endl; ofs3<<"COLOR, 0.8, 0.8, 0.8,"<<endl; ofs3<<"VERTEX,"<<eBox<<","<<eBox<<","<<eBox<<","<<endl; ofs3<<"VERTEX,"<<eBox<<","<<sBox<<","<<eBox<<","<<endl; ofs3<<endl; ofs3<<"VERTEX,"<<eBox<<","<<eBox<<","<<eBox<<","<<endl; ofs3<<"VERTEX,"<<eBox<<","<<eBox<<","<<sBox<<","<<endl; ofs3<<endl; ofs3<<"VERTEX,"<<eBox<<","<<eBox<<","<<eBox<<","<<endl; ofs3<<"VERTEX,"<<sBox<<","<<eBox<<","<<eBox<<","<<endl; ofs3<<endl; ofs3<<"COLOR, 0.5, 1.0, 0.5,"<<endl; ofs3<<"VERTEX,"<<sBox<<","<<sBox<<","<<sBox<<","<<endl; ofs3<<"VERTEX,"<<sBox<<","<<eBox<<","<<sBox<<","<<endl; ofs3<<endl; ofs3<<"VERTEX,"<<sBox<<","<<sBox<<","<<sBox<<","<<endl; ofs3<<"VERTEX,"<<sBox<<","<<sBox<<","<<eBox<<","<<endl; ofs3<<endl; ofs3<<"VERTEX,"<<sBox<<","<<sBox<<","<<sBox<<","<<endl; ofs3<<"VERTEX,"<<eBox<<","<<sBox<<","<<sBox<<","<<endl; ofs3<<endl; ofs3<<"COLOR, 0.8, 0.8, 0.8,"<<endl; ofs3<<"VERTEX,"<<eBox<<","<<sBox<<","<<eBox<<","<<endl; ofs3<<"VERTEX,"<<sBox<<","<<sBox<<","<<eBox<<","<<endl; ofs3<<endl; ofs3<<"VERTEX,"<<eBox<<","<<sBox<<","<<eBox<<","<<endl; ofs3<<"VERTEX,"<<eBox<<","<<sBox<<","<<sBox<<","<<endl; ofs3<<endl; ofs3<<"VERTEX,"<<eBox<<","<<eBox<<","<<sBox<<","<<endl; ofs3<<"VERTEX,"<<sBox<<","<<eBox<<","<<sBox<<","<<endl; ofs3<<endl; ofs3<<"VERTEX,"<<eBox<<","<<eBox<<","<<sBox<<","<<endl; ofs3<<"VERTEX,"<<eBox<<","<<sBox<<","<<sBox<<","<<endl; ofs3<<endl; ofs3<<"VERTEX,"<<sBox<<","<<eBox<<","<<eBox<<","<<endl; ofs3<<"VERTEX,"<<sBox<<","<<eBox<<","<<sBox<<","<<endl; ofs3<<endl; ofs3<<"VERTEX,"<<sBox<<","<<eBox<<","<<eBox<<","<<endl; ofs3<<"VERTEX,"<<sBox<<","<<sBox<<","<<eBox<<","<<endl; ofs3<<endl; ofs3<<"END"<<endl; ofs3<<"]"<<endl; char str[1024];
62
char str2[1024]; char str3[1024]; is.getline(str,1024); sscanf(str,"%d",&Num); itoa(Num, NumString, 10); is.getline(str,1024); sds.getline(str2,1024); sds.getline(str2,1024); for(int i=0; i<9; i++) is3.getline(str3, 1024); for(int i=0;i<Num;i++) { is.getline(str,1024); sds.getline(str2,1024); is3.getline(str3, 1024); sscanf(str,"%d %f %f %f",&temp,&posx,&posy,&posz); tx.push_back(posx); ty.push_back(posy); tz.push_back(posz); sphereStat.push_back(0); atomStat.push_back(0); } cx.resize(Num); cy.resize(Num); cz.resize(Num); px.resize(Num); py.resize(Num); pz.resize(Num); vx.resize(Num); vy.resize(Num); vz.resize(Num); vv.resize(Num); //count++; ofs<<"# FRAME "<<count<<endl; ofs<<"atoms = ["<<endl; ofs<<" ]"<<endl; ofs<<endl; ofs<<"obj = box + atoms"<<endl; ofs<<endl; ofs<<"cmd.load_cgo(obj,'segment', "<<count<<")"<<endl; ofs<<endl; ofs3<<"# FRAME "<<count<<endl; ofs3<<"atoms = ["<<endl; ofs3<<" ]"<<endl; ofs3<<endl; ofs3<<"obj = atoms + atoms"<<endl;

63
ofs3<<endl; ofs3<<"cmd.load_cgo(obj,'segment', "<<count<<")"<<endl; ofs3<<endl; int test_count = 0; while(!is.eof()) { for(int i=0; i<9; i++) is3.getline(str3, 1024); is.getline(str,1024); sds.getline(str2,1024); if(strcmp(str, NumString) == 0) { test_count++; cout<<test_count<<endl; is.getline(str,1024); sds.getline(str2,1024); count++; if(count <=0 ) continue; n++; ofs<<"# FRAME "<<count<<endl; ofs<<"atoms = ["<<endl; ofs3<<"# FRAME "<<count<<endl; ofs4<<"# FRAME "<<count<<endl; ofs3<<"atoms = ["<<endl; cout<<"start processing frame "<<count<<"!"<<endl; for(int i=0;i<Num;i++) { atomStat[i] = 1; sphereStat[i] = 1; } for(int i=0;i<Num;i++) { is.getline(str,1024); sds.getline(str2,1024); is3.getline(str3, 1024); sscanf(str,"%d %f %f %f",&temp,&nposx,&nposy,&nposz); sscanf(str2,"%d %f %f %f",&temp,&posxx,&posyy,&poszz); sscanf(str3,"%d %f %f %f %f",&temp,&xxx,&yyy,&zzz,&vvv); cx[i] = nposx; cy[i] = nposy; cz[i] = nposz; px[i] = posxx; py[i] = posyy; pz[i] = poszz; vx[i] = xxx; vy[i] = yyy; vz[i] = zzz; vv[i] = vvv;
64
dis = sqrt((nposx-px[i])*(nposx-px[i])+(nposy-py[i])*(nposy-py[i])+(nposz-pz[i])*(nposz-pz[i])); if(dis>stable && dis<range) { for(int j=0;j<Num;j++) { dis2=sqrt((nposx-px[j])*(nposx-px[j])+(nposy-py[j])*(nposy-py[j])+(nposz-pz[j])*(nposz-pz[j])); if(dis2<rad) { atomStat[i] = 0; sphereStat[j] = 0; break; } } } else { atomStat[i] = 0; sphereStat[i] = 0; } } // if(count==2) { ofs<<"COLOR,0.000,1.000,0.000,"<<endl; int c1=0,c2=0; for(int i=0;i<Num;i++) { if(atomStat[i]==1) { if(cx[i]<=maxx && cy[i]<=maxy && cz[i]<=maxz && cx[i]>=minx && cy[i]>=miny && cz[i]>=minz) { c1++; ofs<<"SPHERE,"<<cx[i]<<","<<cy[i]<<","<<cz[i]<<","<<0.7<<","<<endl; for(int j=0; j<Num; j++) { //cout<<vv[j]<<endl; float dis = abs(cx[i]-vx[j])+abs(cy[i]-vy[j])+abs(cz[i]-vz[j]); if(dis<0.0001)

65
{ ofs4<<vv[j]<<endl; if(vv[j]>15) { //cout<<vv[j]<<endl; ofs3<<"COLOR,1.000,0.000,0.000,"<<endl; ofs3<<"SPHERE,"<<cx[i]<<","<<cy[i]<<","<<cz[i]<<","<<1<<","<<endl; } if(vv[j]<15 && vv[j]>3) { //cout<<vv[j]<<endl; ofs3<<"COLOR,2.000,1.000,0.000,"<<endl; ofs3<<"SPHERE,"<<cx[i]<<","<<cy[i]<<","<<cz[i]<<","<<1<<","<<endl; } if(vv[j]<3 && vv[j]>0.5) { //cout<<vv[j]<<endl; ofs3<<"COLOR,1.000,1.000,0.000,"<<endl; ofs3<<"SPHERE,"<<cx[i]<<","<<cy[i]<<","<<cz[i]<<","<<1<<","<<endl; } if(vv[j]<0.5 && vv[j]>0.1) { //cout<<vv[j]<<endl; ofs3<<"COLOR,0.000,1.000,0.000,"<<endl; ofs3<<"SPHERE,"<<cx[i]<<","<<cy[i]<<","<<cz[i]<<","<<1<<","<<endl; } if(vv[j]<0.1 && vv[j]>0.05) { //cout<<vv[j]<<endl; ofs3<<"COLOR,0.000,1.000,1.000,"<<endl; ofs3<<"SPHERE,"<<cx[i]<<","<<cy[i]<<","<<cz[i]<<","<<1<<","<<endl; } if(vv[j]<0.05 && vv[j]>0) { //cout<<vv[j]<<endl; ofs3<<"COLOR,0.000,0.000,1.000,"<<endl; ofs3<<"SPHERE,"<<cx[i]<<","<<cy[i]<<","<<cz[i]<<","<<1<<","<<endl; } break;

66
} } } } } ofs<<"COLOR,1.000,0.000,0.000,"<<endl; for(int i=0;i<Num;i++) { if(sphereStat[i]==1) { if(px[i]<=maxx && py[i]<=maxy && pz[i]<=maxz && px[i]>=minx && py[i]>=miny && pz[i]>=minz) { ofs<<"SPHERE,"<<px[i]<<","<<py[i]<<","<<pz[i]<<","<<0.7<<","<<endl; c2++; } } } ofs2<<count<<" "<<c1<<" "<<c2<<endl; ofs<<" ]"<<endl; ofs<<endl; ofs<<"obj = box + atoms"<<endl; ofs<<endl; ofs<<"cmd.load_cgo(obj,'segment', "<<count<<")"<<endl; ofs<<endl; ofs3<<" ]"<<endl; ofs3<<endl; ofs3<<"obj = box + atoms"<<endl; ofs3<<endl; ofs3<<"cmd.load_cgo(obj,'segment', "<<count<<")"<<endl; ofs3<<endl; for(int i=0;i<Num;i++) { tx[i] = cx[i]; ty[i] = cy[i]; tz[i] = cz[i]; } } } } cout<<count<<" records"<<endl; sds.close(); is.close(); is3.close(); ofs.close(); ofs2.close(); ofs3.close(); ofs4.close(); cout<<"done!"<<endl;

67
VITA
Di Chen was born in Nei Mongol, China. He started college in 2001 at Jilin
University. He graduated with a bachelors degree in physics in July 2005. He started
graduate study in 2005 at Peking University, and graduated with a Master of Science
degree in nuclear physics in July 2008. He entered Texas A&M University in
September 2008. His research areas are mainly on molecular dynamics simulation of
radiation damages. He can be contacted through the Department of Nuclear Engineering,
Texas A&M University, College Station, Texas 77843-3133.