Embed Size (px)
Citation preview
Molecular Dynamics and Experimental Study of
Conformation Change of
Poly(N-isopropylacrylamide)-hydrogels in Mixtures
of Water and Methanol
Jonathan Walter,† Jan Sehrt,† Jadran Vrabec,‡ and Hans Hasse∗,†
Laboratory of Engineering Thermodynamics, University of Kaiserslautern, Kaiserslautern,
Germany, and Thermodynamics and Energy Technology, University of Paderborn, Paderborn,
Germany
E-mail: [email protected]
∗To whom correspondence should be addressed†University of Kaiserslautern‡University of Paderborn
1
Abstract
The conformation transition of poly(N-isopropylacrylamide) hydrogel as a function of the
methanol mole fraction in water/methanol mixtures was studied both experimentally and by
atomistic molecular dynamics simulation with explicit solvents. The composition range in
which the conformation transition of the hydrogel occurs was determined experimentally at
268.15, 298.15 and 313.15 K. In these experiments cononsolvency, i.e. collapse at intermedi-
ate methanol concentrations while the hydrogel is swollen in both pure solvents, is observed at
268.15 and 298.15 K. The composition range in which the cononsolvency is present does not
significantly depend on the amount of cross-linker. The conformation transition of the hydro-
gel is caused by the conformation transition of the polymer chains of its backbone. Therefore,
conformation changes of single backbone polymer chains arestudied by massively parallel
molecular dynamics simulations. The hydrogel backbone polymer is described with the force
field OPLS-AA, water with the SPC/E model and methanol with the model of the GROMOS-
96 force field. During simulation, the mean radius of gyration of the polymer chains is moni-
tored. The conformation of the polymer chains is studied at 268, 298 and 330 K as a function
of the methanol mole fraction. Cononsolvency is observed at268 and 298 K which is in agree-
ment with the present experiments. The structure of the solvent around the hydrogel backbone
polymer is analysed using H-bond statistics and visualization. It is found that cononsolvency is
caused by the fact that the methanol molecules strongly attach to the hydrogel’s backbone poly-
mer, mainly with their hydroxyl group. This leads to the effect that the hydrophobic methyl
groups of methanol are oriented towards the bulk solvent. The (hydrogel + solvent shell) ap-
pears, hence, hydrophobic and collapses in water-rich solvents. As more methanol is present
in the solvent, the effect disappears again.
Keywords: cononsolvency, hydrogen bonds, force field, molecular model, degree of swelling,
polymer
2
Introduction
Hydrogels are three-dimensional hydrophilic polymer networks. Their most characteristic property
is their swelling in aqueous solutions. Hydrogels are used in many applications. Super absorbers,
such as in diapers1 and contact lenses,2 are well established examples. Other interesting applica-
tions like in drug delivery systems,3 tissue engineering,4 micro actuators5 or epicardial restraint
therapies,6 are discussed. To fully exploit the potential of hydrogels,it is crucial to understand,
describe and predict their swelling behavior.
The hydrogel which was studied in the present work is built upof poly(N-isopropylacrylamide)
(PNIPAAm) and is cross-linked with N,N’-methylenebisacrylamide (MBA). PNIPAAm is one of
the most extensively studied hydrogels in the scientific literature and is mainly used in bioengineer-
ing applications.7 The degree of swelling of PNIPAAm in equilibrium is significantly influenced
by the solvent type and the temperature.8–13Upon variation of these factors, the hydrogel typically
shows a region where it is swollen and a region where it is collapsed. In between those two regions
lies the region of conformation transition.
Amiya et al.11 measured the degree of swelling of PNIPAAm hydrogels as a function of the
methanol mole fraction in water/methanol mixtures at 273.15, 295.15 and 315.15 K. Mukae et
al.12 measured the same properties at 298.15 K, Althans et al.14 at seven different temperatures
between 298.15 and 308.15 K. These studies show that the hydrogel is collapsed at 315.15 K
in pure water and swollen in pure methanol. For all other studied temperatures, the hydrogel is
swollen in both pure solvents, but shows a region in which it is collapsed at intermediate methanol
concentrations. This phenomenon is termed cononsolvency.
For systems with PNIPAAm polymers, cononsolvency was discussed in several studies.15–17Win-
nik et al.17 investigated this phenomenon by means of the lower criticalsolution temperature
(LCST) of the PNIPAAm polymer in water/methanol mixtures asa function of the methanol con-
centration.
The reasons for cononsolvency are discussed differently bydifferent authors.12,15,17–19In order to
explain the different conformations of PNIPAAm in water/methanol mixtures, the behavior of the
3
solvent molecules in the hydration shell of the polymer or hydrogel was studied by monitoring the
H-bonds or the interactions between the polymer and the two solvents with different experimental
methods.
Mukea et al.12 investigated PNIPAAm hydrogels in water/alcohol mixturesat 298.15 K. They mea-
sured the H-bonds between the hydrogel and the solvents withFTIR spectroscopy and found that
the hydrogel is strongly dehydrated in the collapsed state.Therefore, the hydrogel mainly interacts
with itself when collapsed. Further, they measured a higheramount of alcohol in the hydrogel than
in the bulk solvent, leading to a higher degree of swelling inseveral pure alcohols than in pure
water at 298.15 K. This leads to the conclusion that methanolis the better solvent. Mukea et al.12
also found that the interactions between water and methanolare stronger than the ones between
methanol and PNIPAAm when the hydrogel is collapsed. They compared the conformation transi-
tion with the partial molar volume of methanol in water/methanol mixtures, observing a minimum
at approximately the same solvent composition and assumed arelation between these properties.
In contradiction to these results, Cheng et al.,19 using Laser light scattering and FTIR, only found
a weak decrease of the number of H-bonds when the polymer collapses in pure water above the
LCST.
Winnik et al.17 investigated cononsolvency for PNIPAAm polymers in water/methanol mixtures
at different temperatures. Using turbidity measurements,they found a flexible PNIPAAm coil in
methanol and a stiffer and more elongated PNIPAAm coil in water. This leads these authors to the
conclusion that methanol is the better solvent for PNIPAAm.
Investigating the interactions between PNIPAAm polymers and the two solvent species in wa-
ter/methanol mixtures, Schild et al.15 used infrared spectra, optical densities and calorimetry.They
came to the conclusion that the relevant interactions for the conformation transition are the ones
between the polymer chain and the solvent molecules.
Tanaka et al.18 described the volume transition of PNIPAAm polymers in water/methanol mixtures
based on models for cooperative and competitive hydration.They predicted a strong decrease of
the H-bonds between the polymer and the solvents in the cononsolvency region and also stated that
4
methanol is a better solvent for PNIPAAm than water.
Molecular dynamics simulations can give a detailed insightinto these phenomena on the atomistic
level. The orientation of the solvents at the surface of PNIPAAm monomers in water/methanol
mixtures was investigated in detail by Pang et al.20 They found that the solvents are bound with
their polar sites to the polar sites of the monomer.
In a preceding study of our group,21 it was shown that the conformation transition of PNIPAAm
upon changing the temperature can be predicted by molecularsimulation. In the present work,
the influence of the solvent composition on the conformationtransition of PNIPAAm in wa-
ter/methanol mixtures was investigated. The effect was studied both by atomistic molecular dy-
namics simulation and by experiment. The molecular simulations are based on the force field
OPLS-AA22,23 for PNIPAAm, SPC/E24 for water and different explicit models from the literature
for methanol. The conformation transition of the hydrogel is dominated by the interactions be-
tween the solvent molecules and the hydrogel backbone polymer.21 Therefore, single PNIPAAm
chains were investigated by molecular simulations. In these simulations, the radius of gyration and
the structure of the solvent around single chains was monitored. The results are compared to the
experimental data for the degree of swelling of PNIPAAm hydrogel in water/methanol mixtures as
a function of the methanol mole fraction at different temperatures.
Experimental procedure and results
Chemically cross-linked hydrogels were synthesized in thepresent work by polymerizing N-
isopropylacrylamide (NIPAAm) and by cross-linking it withN,N’-methylenebisacrylamide (MBA).
The experimental method is only briefly described here as it is the same that was described earlier
by Hüther and Maurer.9 Polymerization and cross-linking were simultaneously carried out by free
radical polymerization in oxygen-free deionized water at 298.15 K under nitrogen atmosphere.
The reactions were initiated by small amounts of ammonium peroxodisulfate (starter) and sodium
disulfite (accelerator).
5
For the synthesis, the monomer NIPAAm (Aldrich, 97 %, CAS 2210-25-5), the cross-linking agent
MBA (Fluka,≥ 99 %, CAS 110-26-9), and the initiators ammonium peroxodisulfate ((NH4)2S2O8)
(Aldrich,≥ 98 %, CAS 7727-54-0) and sodium disulfite (Na2S2O5) (Fluka,≥ 98 %, CAS 7681-57-
4) were used without further purification. Oxygen-free, bi-distilled water was used for synthesis.
After synthesis, the hydrogel particles were thoroughly washed with deionized water and dried in
a vacuum oven.
Hydrogels can not be characterised by a few numbers like it isdone with specification chemi-
cals. They are rather characterised by their production process. The following concentrations refer
to the aqueous solution in which the polymerization was carried out: Total mass fractionxmgel of
polymerizable material
xmgel =
mNIPAAm+mMBA
mtotal, (1)
mole fraction of cross-linking agentxnMBA
xnMBA =
nMBA
nNIPAAm+nMBA, (2)
and mass fraction of the initiatorxms
xms =
ms
mtotal. (3)
Here,m andn are the mass and mole number, respectively. The parameters for the two hydrogels
synthesized in the present work are presented in 1. The hydrogels differ mainly in the degree of
cross-linking.
For each swelling experiment, ten dried hydrogel particleswere used. The amount of mass of the
dried hydrogel particle was determined with a precision micro balance (type MX5, Mettler Toledo,
Giessen, Germany) before the mixture of oxygen-free deionized water and methanol (Roth, 99%,
CAS 67-56-1) was added to the particles. The solvent mixturewas prepared with a precision bal-
ance (type XS4002S DeltaRange, Mettler Toledo, Gießen, Germany). The hydrogel in the solvent
was then thermostatted for about two weeks. An air oven (typeICP 600, Memmert, Schwabach,
Germany) was used at 298.15 and 313.15 K, a cryostat (type F34, Julabo, Seelbach, Germany) with
6
a glysantine/water mixture as coolant was used at 268.15 K. For the temperature measurement, a
calibrated platinum resistance thermometer with an overall uncertainty of±0.1 K was used. After
reaching equilibrium, the hydrogel particles were taken out of the solvent and the surface solvent
was removed. The mass of the swollen particles was then determined with the precision micro
balance. The degree of swelling of each particle was calculated as the ratio of mass of the swollen
hydrogelmgel to the mass of the dry hydrogelm(dry)gel
q =mgel
m(dry)gel
. (4)
For the ten particles, the arithmetic mean and the standard deviation of the degree of swelling were
calculated. The experiments were performed at temperatures of 268.15, 298.15 and 313.15 K for
various compositions of the water/methanol mixture. The experimental results are summarized in
2 and 3.
Discussion of experimental results
1 and 2 present experimental results for the degree of swelling of the two hydrogels in wa-
ter/methanol mixtures for different temperatures as a function of the mole fraction of methanol.
1 shows the influence of the temperature on the degree of swelling of Hydrogel 1. The influence
of the amount of cross-linker is discussed by directly comparing the results for Hydrogel 1 and
Hydrogel 2 at 298.15 K in 2. The error bars denote the standarddeviations, which are mostly
within the symbol size.
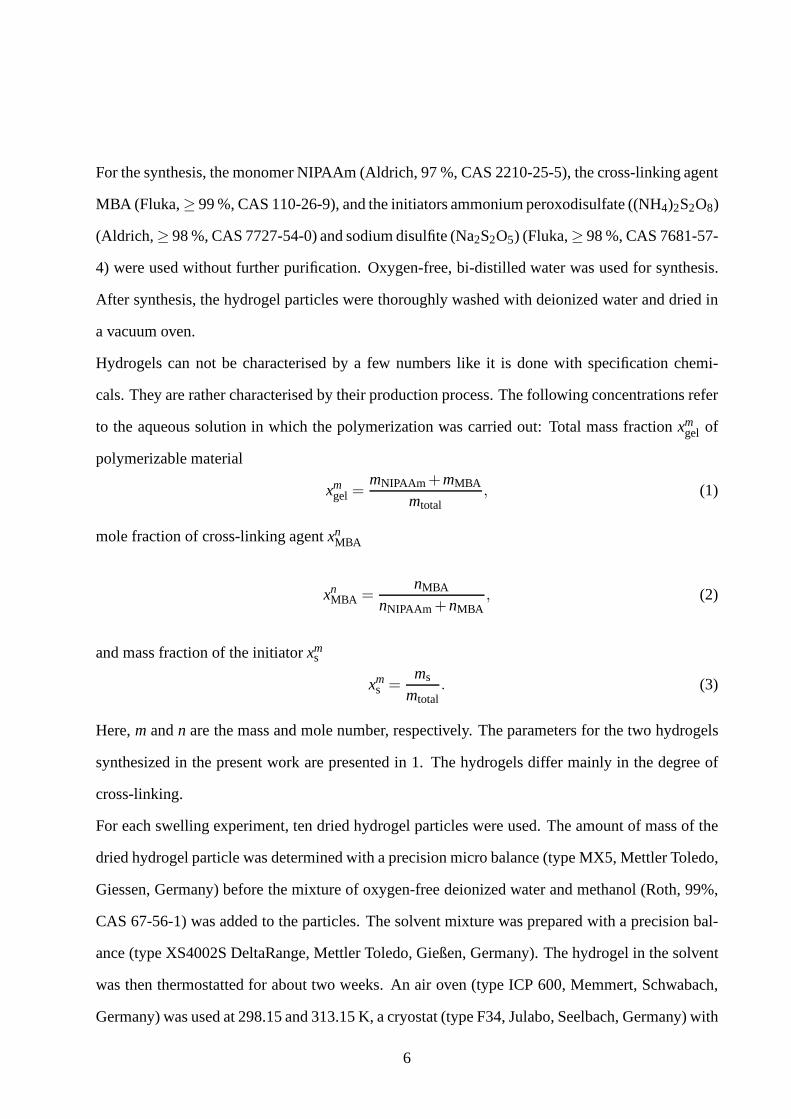
The results for Hydrogel 1 are presented in 1. For all three temperatures, the hydrogel is swollen
in pure methanol. The degree of swelling in pure methanol andmethanol-rich mixtures is only
very weakly temperature dependent. Higher temperatures lead to a lower degree of swelling. In
pure water, the hydrogel is swollen at 298.15 K and collapsedat 313.15 K. At 298.15 K the hy-
drogel shows a stronger swelling in pure water than in pure methanol. At 268.15 K, the degree of
swelling can not be measured in pure water, because it is below freezing temperature. At 268.15
7
and 298.15 K cononsolvency was observed: even though the hydrogel is swollen both in pure wa-
ter (or water-rich mixtures at 268.15 K) and pure methanol, there is a composition range of the
solvent mixture where the hydrogel is collapsed. Adding small amounts of methanol to pure water
leads to a strong decrease of the degree of swelling, whereasadding small amounts of water to
pure methanol has hardly any effect. There seems to be a shallow local maximum of the degree
of swelling in the region of high methanol mole fractions. Thus, the cononsolvency region is ob-
served on the water-rich side of the diagram shown in 1. In thecononsolvency region at 298.15 K,
the hydrogel collapses significantly, but not to the level that is observed at the other temperatures.
This is supported by the findings of Winnik et al.,17 who reported no cononsolvency for PNIPAAm
polymers in water/methanol mixtures below about 263 K.
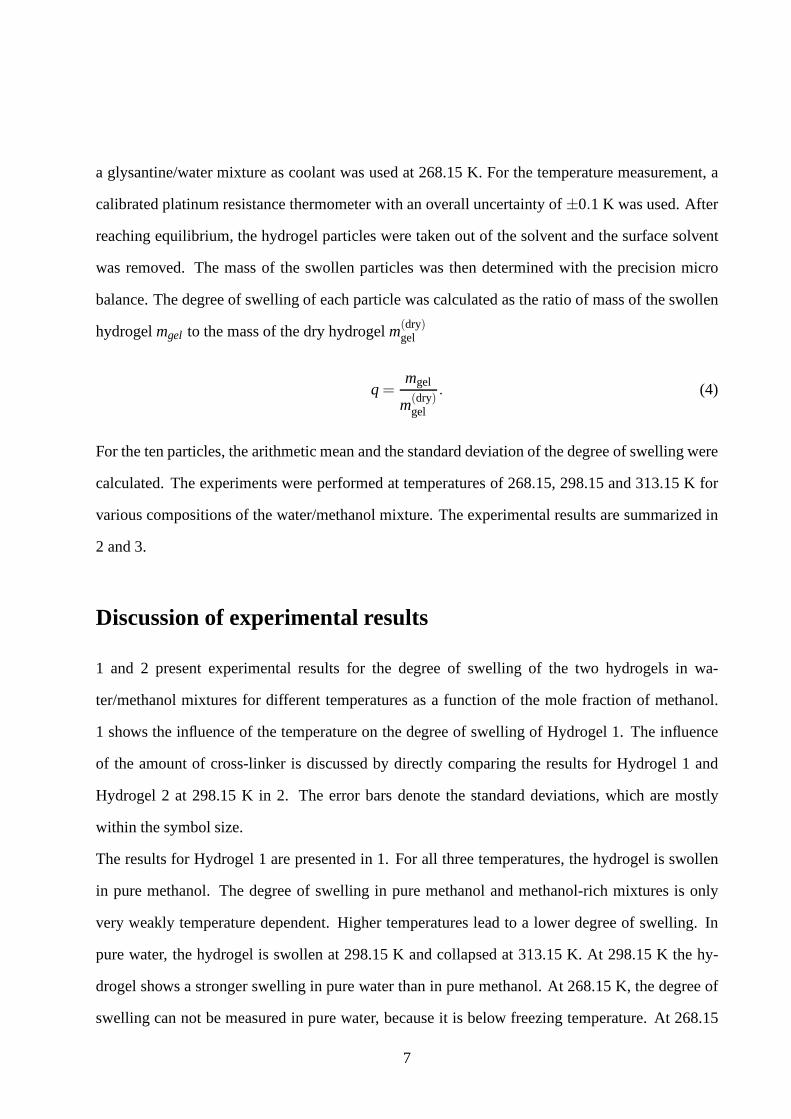
For Hydrogel 2, the results are qualitatively the same as forHydrogel 1. These results are pre-
sented in 3. In 2, the two hydrogels are compared for the temperature of 298.15 K. The two
hydrogels mainly differ in the degree of cross-linking (cf.1). The degree of swelling is higher for
Hydrogel 1, which has a lower amount of cross-linking. The solvent composition range, in which
cononsolvency was observed is hardly influenced by the degree of cross-linking. This corroborates
that cononsolvency is caused by the interactions between the hydrogel backbone polymer and the
solvent molecules. This is in line with the finding that the volume transition of hydrogels upon
temperature change also does not significantly depend on thedegree of cross-linking.21
The results of the swelling experiments of PNIPAAm hydrogels can be compared with the solu-
bility experiments of PNIPAAm polymers in water/methanol mixtures by Winnik et al.,17 where
cloud points were measured. The volume transition of hydrogels and the solubility of the backbone
polymer are closely related properties, as both depend on the interactions between the polymer and
the solvent. A direct quantitative comparison is, however,not straightforward, especially as the
volume transition of the hydrogel does not take place at a specific composition, but rather over a
composition range that may be wide. In the present work, an empirical approach was followed to
achieve a mapping. The crucial step in that approach is to determine a certain solvent composition
"at which the volume transition occurs" from the hydrogel swelling data. In reality, there is rather
8
a composition range, such that a specific methanol mole fraction has to be chosen suitably by a
well defined procedure which will, however, unavoidably be somewhat arbitrary.
For the definition of that "transition point", in the presentwork, the degree of swelling at that point
q∗ was specified and then the composition of the transition point xn,∗MeOH was determined from the
plot of q(xMeOH), cf. 1 and 2. For that definition ofq∗, the minimum ofq observed at 268.15 K
was selected (Hydrogel 1: 8.5 g·g−1, Hydrogel 2: 9.5 g·g−1). The temperature of 268.15 K is
close to the lowest temperature of the cloud point curve observed by Winnik et al.17 so that no full
collapse was observed. Note also thatq∗ for Hydrogel 1 corresponds to a transition temperature
T ∗ = 305 K in plots ofq(T ) for that hydrogel,21 which is in good agreement with other data that
is reported for that transition in the literature.25,26
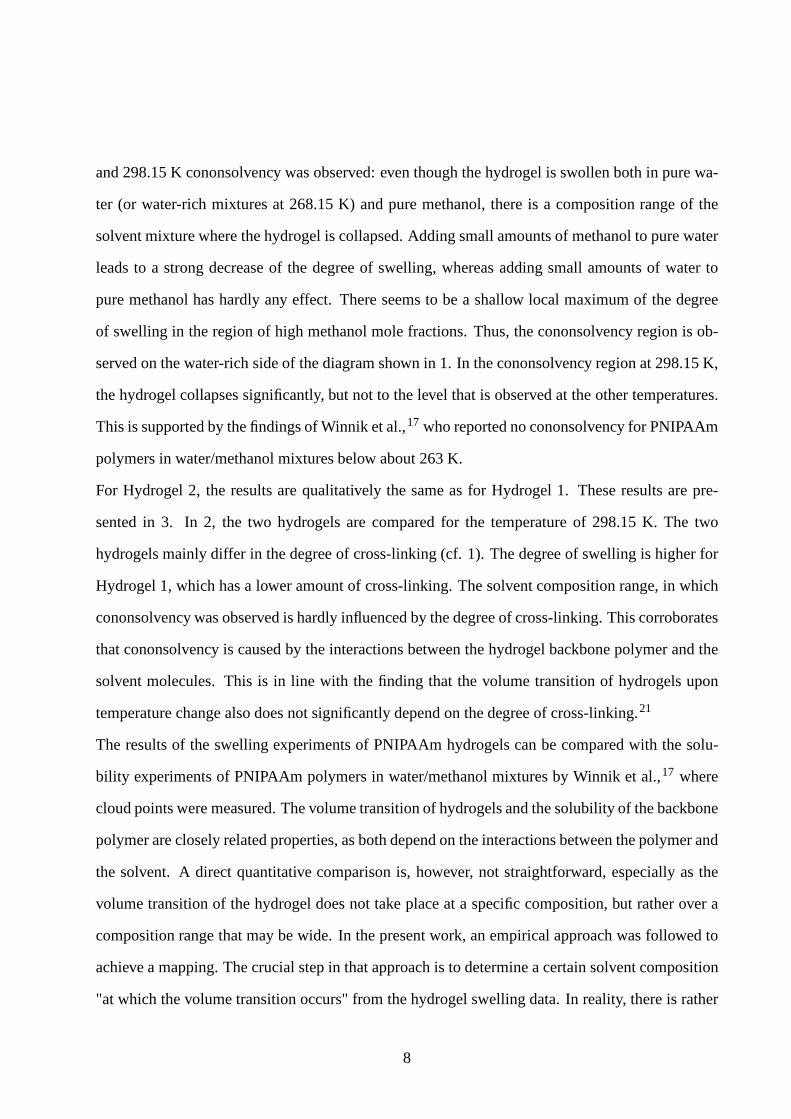
The results for the transition mole fractionsxn,∗MeOH for different temperatures are listed in 4 and
shown in 3, where they are compared with the experimental results of Winnik et al.17 In 3, the
cloud point curve of the polymer is compared to the data estimated from the hydrogel volume tran-
sition, showing the relation between the temperature and the solvent composition at the transition
points.
The comparison shows that the conditions for which the volume transition of the PNIPAAm hydro-
gel was observed and the cloud point of the PNIPAAm polymer are almost identical. Furthermore,
it was found that the effect does not significantly depend on the amount of cross-linker. Both find-
ings support the interpretation that the volume transitionof the hydrogel is an effect related to the
interactions between backbone polymer and solvent molecules.
Force fields
For the present molecular dynamics simulations of PNIPAAm in water/methanol mixtures, the
OPLS-AA (OPLS) force field22,23 was used to describe PNIPAAm. It was combined with the
SPC/E water model.24 In preceding studies,21 it was shown that this combination is suited for
predicting the conformation change of PNIPAAm in water as a function of the temperature. The
9
Lennard-Jones (LJ) and point charge parameters of the OPLS force field used for PNIPAAm are
given in 5.
For methanol the model of GROMOS96 with low point charges (G96-low)27 was used. The po-
tential and geometry parameters are listed in 6 and 7, respectively. Two other methanol models
(Schnabel et al.28 and GROMOS96 with high point charges27) were also tested in preliminary
studies, but were not found to yield cononsolvency. The results of these preliminary studies are
briefly presented in Appendix A in the Supporting Information.
For the unlike LJ pair interaction, a geometric mean mixing rule for bothσ andε was used, as
specified by the OPLS force field
σi j =√σi ·σ j,
εi j =√
εi · ε j.
(5)
For the intramolecular interactions, the method of the 1-4 interactions was employed.29 Thereby,
the interactions between a given atom and its first and secondneighbors were only modeled by
the bond and the angle term. Interactions between the atom and its third neighbor were calculated
by the dihedral, the Coulomb interaction and the LJ term. Thelast two terms were reduced by
a scaling factor of 0.5. All other intramolecular interactions were modeled with the unmodified
Coulomb interaction and LJ term.
Simulation methods
Molecular simulations of PNIPAAm single chains were carried out with version 4.0.5 of the GRO-
MACS simulation package,30,31 which was developed for the simulation of large molecules in
solutions.
Single PNIPAAm chains in water were simulated in the isothermal-isobaric ensemble. The pres-
sure was specified to be 1 bar and was controlled by the Berendsen barostat,32 the temperature was
10
controlled by the velocity-rescale thermostat33 and the timestep was 1 fs for all simulations. The
standard deviation of the temperature over time is about 1.3K.21 Newton’s equations of motion
were numerically solved with the leap-frog integrator.34 The cutoff radius wasrc = 1.5 nm for
all interactions. For the long-range electrostatic interactions, particle mesh Ewald35 with a grid
spacing of 0.12 nm and an interpolation order of four was used.
The simulations were carried out with PNIPAAm chains of 30 monomers as in.21 For setting up
the starting conformation, the procedure suggested in21 was adopted. A stretched configuration
derived from a simulation of the polymer chain in pure water in equilibrium at 280 K was used.
Prior to the simulations, the solvent mixtures were equilibrated using about 3500 solvent molecules
over 2·106 time steps monitoring the density. The equilibrated solvent was then used to solvate
the PNIPAAm chain. The simulation volume was about 14×6×6 nm and contained in addition to
the single PNIPAAm chain about 14000 solvent molecules. After solvent equilibration over 1 to
5 ·106 timesteps with a fixed polymer configuration, production runs over 2 to 8·107 time steps
(20 to 80 ns) were carried out.
In order to analyze the results, the radius of gyrationRg was calculated
Rg =
(
Σi||r i||2mi
Σimi
)1/2
, (6)
which characterizes the degree of stretching of the chain, wheremi is the mass of sitei and||r i||
is the norm of the vector from sitei to the center of mass of the chain. The radius of gyration in
equilibrium was calculated as the arithmetic mean over the last 107 time steps of the run (1000
samples) together with its standard deviation.
In order to investigate the structure of the solvent speciesaround the PNIPAAm chain, the average
number of H-bonds between the polar amide group of the chain and the solvent molecules was
measured. For identifying H-bonds, a geometric criterion was employed which is based on the
distance between acceptor and donor and the angle acceptor-donor-hydrogen. A H-bond was as-
sumed to be present, if the distance is below 0.3 nm and the angle smaller than 30◦.36,37
11
For further information about the structure of the solvent around the PNIPAAm chains, in some
simulations, the backbone of the single chain was visualized together with the solvent molecules
of the hydration shell using VMD38 and MegaMol.39,40
The simulations were performed on the high performance computer HP XC 4000 at the Stein-
buch Centre for Computing in Karlsruhe (Germany), which is equipped with Opteron 2.6 GHz
Dual Core processors. In typical runs, 128 cores were used. Preliminary studies of strong scaling
of GROMACS on that hardware show that the program can be used efficiently up to about that
number of processors.41 Typical runs consumed about 18000 CPU h.
Simulation results
Simulations of PNIPAAm chains of 30 monomers in water/methanol mixtures of different compo-
sitions were carried out at 268, 298 and 330 K to determine theradius of gyration of the polymer
in equilibrium. The simulation results are summarized in 8 and presented graphically in 4 which
shows the radius of gyration in equilibrium as a function of the mole fraction of methanol.
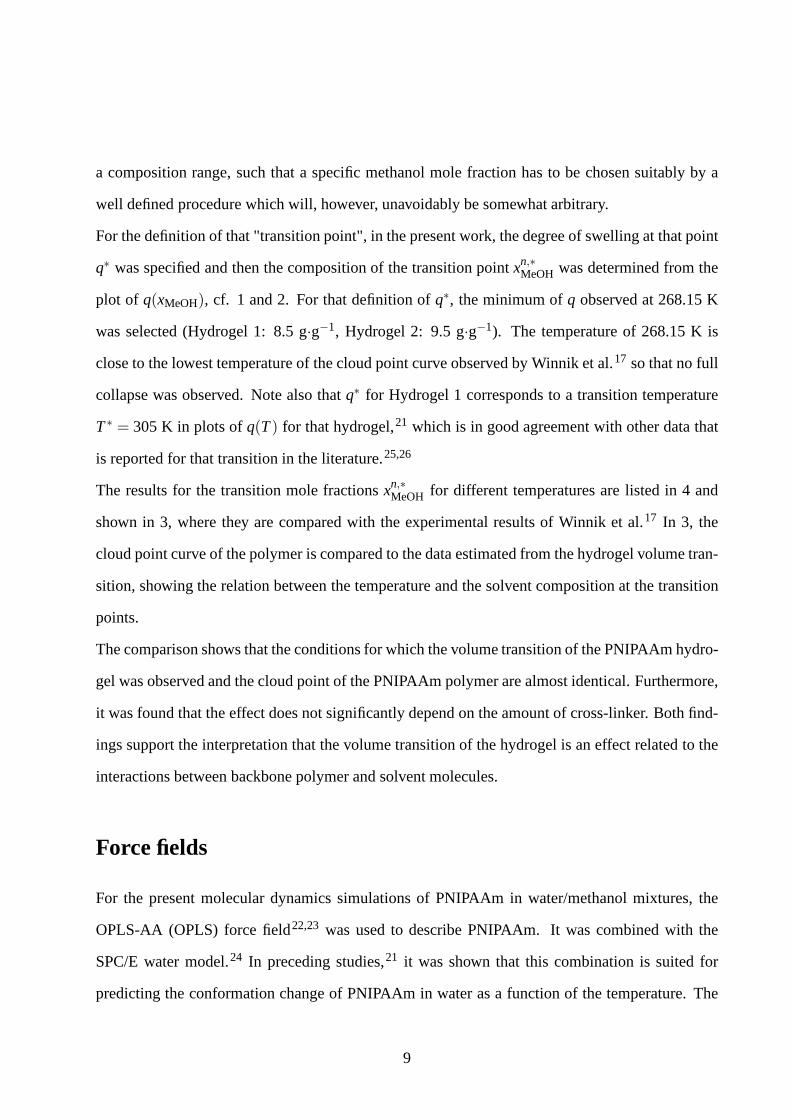
The results at 268 K are presented in the top panel of 4. In puremethanol and in water-rich
mixtures, the single chain is stretched. There is no data forpure water because it is solid at this
temperature. The results show a small region of cononsolvency at methanol mole fractions of
about 0.6 mol·mol−1. The observation of cononsolvency at this temperature is inagreement with
the experimental data, even though the composition range inwhich cononsolvency occurs is not
correctly predicted. The experiments from the present workon PNIPAAm hydrogels as well as the
experimental results on PNIPAAm polymers of Winnik et al.17 indicate that cononsolvency does
not exist at temperatures substantially below 268 K. The simulation result with the small conon-
solvency region at 268 K is in line with these observations.
The central panel of 4 shows the results at 298 K. Again, in both pure solvents, the single chain is
stretched, for intermediate methanol mole fractions between 0.1 and 0.2 mol·mol−1 it is collapsed.
The region of cononsolvency is predicted to be much larger than at 268 K and is now in the com-
12
position range in which it was also observed experimentally, cf. 1.
The results at 330 K are presented in the bottom panel of 4. In pure water, the single chain is
collapsed, in pure methanol, it is stretched. In the mixture, at methanol mole fractions above about
0.6 mol·mol−1, the chain is stretched. This is in fair agreement with the results obtained with
the present experiments at the highest studied temperatureof 313 K, cf. 1. These temperatures are
compared with each other because they are both somewhat above the transition temperature in pure
water, which is about 305 K determined by experiment and about 320 K determined by molecular
simulation.21
These results show that it is possible to qualitatively predict the volume transition of hydrogels
by molecular simulation if suitable force fields are chosen.This is encouraging as the underlying
force fields were developed using only information which is unrelated to the phenomenon studied
here and no further adjustments were made.
However, molecular simulation offers more than just the possibility to predict the volume tran-
sition. The extremely highly resolved information provided by such simulations allows gaining
insight into the reasons of cononsolvency. For that purpose, the structure of the solvent around the
PNIPAAm chain was studied both by H-bond statistics and visualization.
The number of H-bonds between the two solvent species and theamide groups of the PNIPAAm
chain was determined for the equilibrated chain. The H-bonds form between the oxygen atom of
the amide group and the hydrogen atoms of the solvents as wellas between the hydrogen atom of
the amide group and oxygen atom of the solvents (cf. AppendixB in the Supporting Information).
In principle, also the nitrogen atom of the amide group of PNIPAAm may act as H-bond acceptor.
The results obtained in the present study show that the number of H-bonds that involve this nitro-
gen atom is so small that it can be neglected. They also show that the amount of intramolecular
H-bonding of the PNIPAAm chain is small compared to the number of intermolecular H-bonds
between the chain and the solvent molecules. Thus intramolecular H-bonding is neglected in the
following. The low number of intramolecular H-bonds may be due to the chain length chosen in
the present study, but the same results were also found for longer chains and three dimensional
13
networks that were also simulated here.
5 shows the average number of H-bonds between a monomer unit of the PNIPAAm chain and
water or methanol, respectively, as a function of the methanol mole fraction at 298 K. For compar-
ison, the radius of gyration of the single chain is plotted aswell. Furthermore, 5 contains linear
interpolations between the number of H-bonds in the two puresolvents and zero for the case in
which the solvent is not present. It can be seen that less H-bonds are present in pure methanol than
in pure water, which is related to the stronger stretching ofthe chain in water than in methanol.
But despite this, in mixtures of these solvents, the PNIPAAmchain has a stronger preference for
forming H-bonds with methanol than with water. Consideringthe entire composition range from
pure water to pure methanol, the number of H-bonds with methanol increases more than linearly
while the number of H-bonds with water decreases more than linearly. Thus, the number of H-
bonds of the PNIPAAm chain with methanol exceeds the number of H-bonds with water already
at methanol mole fractions of about 0.15 mol·mol−1. The occurrence of cononsolvency upon in-
creasing the methanol mole fraction goes along with a strongdecrease of the number of H-bonds
between water and the PNIPAAm chain and a strong increase of the corresponding H-bonds with
methanol.
These results confirm that methanol is a better solvent for PNIPAAm than water. The PNIPAAm
chain is collapsed in the region where the methanol concentration around PNIPAAm strongly dif-
fers from that in the bulk solvent. This indicates that the collapse of the polymer or hydrogel is
related to interactions between the solvation shell aroundPNIPAAm and the rest of the solvent.
This finding is in agreement with the conclusions Schild et al.15 drew from their experimental
studies of PNIPAAm polymers and hydrogels.
In 9, the average number of H-bonds between the two solvent species and the oxygen and hydrogen
atom of the amide group of PNIPAAm are presented for a methanol mole fraction in the solvent of
0.1 mol·mol−1, which is inside the cononsolvency region. From these results, it can be seen that
water is preferably attached to the oxygen atom and methanolto the hydrogen atom of the amide
group. The hydrogen atom is further away from the backbone ofthe PNIPAAm chain than the
14
oxygen atom (cf. 6). Therefore, water within the solvation shell is preferably closer to the back-
bone, while methanol resides preferably in the outer regions of the solvation shell. Furthermore,
methanol is attached with its polar hydroxyl group to the amide group so that its non-polar methyl
group is oriented towards the bulk solvent. This is in good agreement with findings of Pang et al.20
who investigated the orientation of methanol and water at PNIPAAm monomers in water/methanol
mixtures with molecular dynamics simulation in detail.
For the following discussion, it is assumed that the PNIPAAmchain together with its solvation
shell can be considered as an entity, a standpoint which is supported by the strong H-bonding be-
tween the solvation shell and the chain and also by visualizations of the molecular trajectory. Due
to the effect described above, the PNIPAAm chain + solvationshell has a hydrophobic methyl-
rich surface. It is presumed that this leads to a solubility mismatch with water-rich bulk solvents
and consequently the collapse of the hydrogel or the precipitation of the polymer in the region
of cononsolvency. With increasing methanol mole fraction,the bulk solvent becomes more com-
patible with the hydrophobic PNIPAAm chain + solvation shell, leading to the disappearance of
cononsolvency.
More detailed information on H-bonding statistics is givenin Appendix B in the Supporting In-
formation. The Appendix also contains information on the visualization of the simulation results,
some of which are made available in the Supplementary Material of the present work.
Conclusion
The dependence of the volume transition of PNIPAAm hydrogels on the composition of the solvent
in water/methanol mixtures was studied both experimentally and by molecular simulation. Conon-
solvency was observed with both approaches. The region in which it occurs in the experimental
studies of hydrogels is almost independent of the amount of cross-linking, which indicates that the
effect is related to the interactions between the hydrogel backbone polymer and the solvent.
Therefore, single polymer chains in explicit solvents werestudied by molecular simulation. Force
15
fields from the literature for the polymer chain, water and methanol were selected that are capa-
ble to predict cononsolvency. The region, in which it occurs, is qualitatively and sometimes even
quantitatively predicted by the simulations without adjusting any parameters.
The simulation results indicate that the reason for cononsolvency is the strong H-bonding between
methanol and the PNIPAAm chain, which leads to a preferred molecular orientation of methanol,
where the methyl group points towards the bulk solvent. The PNIPAAm chain + solvation shell
entity therefore has a hydrophobic methyl-rich surface. This leads to mismatch with water-rich
bulk solvents and consequently to the collapse of the hydrogel or the precipitation of the polymer
in the region of cononsolvency.
Acknowledgement
We gratefully thank the German Research Foundation (DFG) for funding support within the Col-
laborative Research Centre 716. The computer simulations were performed on the high perfor-
mance computer HP XC 4000 of the Steinbuch Centre for Computing in Karlsruhe (Germany)
under the project LAMO. We also thank Thomaß Bertram, Sebastian Grottel and Guido Reina
from the Institute for Visualization and Interactive Systems at the University of Stuttgart (Ger-
many) for their support with respect to visualization. The work was carried out under the auspices
of the Boltzman-Zuse Society for Computational Molecular Engineering.
Supporting Information Available
In the Supplementary Material visualizations of the solvent structure around the PNIPAAm chains
are contained (cf. Appendix C in the Supporting Information). Three visualizations show the
structure and H-bonds of the solvents at different solvent compositions. The fourth visualization
shows the local concentration of the solvents around the PNIPAAm chain in the cononsolvency
region and the collapse of the chain. This material is available free of charge via the Internet at
http://pubs.acs.org.
16
References
(1) El-Rehim, H. A. A.Radiat. Phys. Chem. 2005, 74, 111–117.
(2) Pavlyuchenko, V. N.; Sorochinskaya, O. V.; Ivanchev, S.S.; Khaikin, S. Y.; Trounov, V. A.;
Lebedev, V. T.; Sosnov, E. A.; Gofman, I. V.Polym. Adv. Technol. 2009, 20, 367–377.
(3) Peppas, N.; Bures, P.; Leobandung, W.; Ichikawa, H.Eur. J. Pharm. Biopharm. 2000, 50,
27–46.
(4) Slaughter, B. V.; Khurshid, S. S.; Fisher, O. Z.; Khademhosseini, A.; Peppas, N. A.Adv.
Mater. 2009, 21, 3307–3329.
(5) van der Linden, H.; Olthuis, W.; Bergveld, P.Lab Chip 2004, 4, 619–624.
(6) Fujimoto, K. L.; Ma, Z.; Nelson, D. M.; Hashizume, R.; Guan, J.; Tobita, K.; Wagner, W. R.
Biomaterials 2009, 30, 4357–4368.
(7) Rzaev, Z. M. O.; Dinçer, S.; Piskin, E.Prog. Polym. Sci. 2007, 32, 534–595.
(8) Hüther, A.; Schäfer, B.; Xu, X.; Maurer, G.Phys. Chem. Chem. Phys. 2002, 4, 835–844.
(9) Hüther, A.; Maurer, G.Fluid Phase Equilib. 2004, 226, 321–332.
(10) Hüther, A.; Xu, X.; Maurer, G.Fluid Phase Equilib. 2004, 219, 231–244.
(11) Amiya, T.; Hirokawa, Y.; Hirose, Y.; Li, Y.; Tanaka, T.J. Chem. Phys. 1987, 86, 2375–2379.
(12) Mukae, K.; Sakurai, M.; Sawamura, S.; Makino, K.; Kim, S. W.; Ueda, I.; Shirahama, K.J.
Phys. Chem. 1993, 97, 737–741.
(13) Crowther, H.; Vincent, B.Colloid Polym. Sci. 1998, 276, 46–51.
(14) Althans, D.; Langenbach, K.; Enders, S.Mol. Phys. 2012, in press, DOI:
10.1080/00268976.2012.655339.
17
(15) Schild, H. G.; Muthukumar, M.; Tirrell, D. A.Macromolecules 1991, 24, 948–952.
(16) Tanaka, F.; Koga, T.; Winnik, F. M.Phys. Rev. Lett. 2008, 101, 028302.
(17) Winnik, F. M.; Ringsdorf, H.; Venzmer, J.Macromolecules 1990, 23, 2415–2416.
(18) Tanaka, F.; Koga, T.; Kojima, H.; Winnik, F. M.Macromolecules 2009, 42, 1321–1330.
(19) Cheng, H.; Shen, L.; Wu, C.Macromolecules 2006, 39, 2325–2329.
(20) Pang, J.; Yang, H.; Ma, J.; Cheng, R.J. Phys. Chem. B 2010, 114, 8652–8658.
(21) Walter, J.; Ermatchkov, V.; Vrabec, J.; Hasse, H.Fluid Phase Equilib. 2010, 296, 164–172.
(22) Jorgensen, W. L.; Tirado-Rives, J.J. Am. Chem. Soc. 1988, 110, 1657–1666.
(23) Jorgensen, W. L.; Maxwell, D. S.; Tirado-Rives, J.J. Am. Chem. Soc. 1996, 118, 11225–
11236.
(24) Berendsen, H. J. C.; Grigera, J. R.; Straatsma, T. P.J. Phys. Chem. 1987, 91, 6269–6271.
(25) Çaykara, T.; Kiper, S.; Demirel, G.Journal of Applied Polymer Science 2006, 101, 1756–
1762.
(26) Heskins, M.; Guillet, J. E.J. Macromol. Sci., Part A: Pure Appl. Chem. 1968, 8, 1441–1455.
(27) van Gunsteren, W. F.; Billeter, S.; Eising, A.; Hünenberger, P.; Krüger, P.; Mark, A.; Scott, W.;
Tironi, I. Biomolecular Simulation: The Gromos 96 Manual and User Guide; vdf Hochschul-
verlag an der ETH Zürich: Zürich, Switzerland, 1996.
(28) Schnabel, T.; Srivastava, A.; Vrabec, J.; Hasse, H.J. Phys. Chem. B 2007, 111, 9871–9878.
(29) van der Spoel, D.; Lindahl, E.; Hess, B.; van Buuren, A. R.; Apol, E.; Meulenhoff, P. J.;
Tieleman, D. P.; Sijbers, A. L. T. M.; Feenstra, K. A.; van Drunen, R.; Berendsen, H. J. C.
Gromacs User Manual version 3.3. 2005.
18
(30) van der Spoel, D.; Lindahl, E.; Hess, B.; Groenhof, G.; Mark, A. E.; Berendsen, H. J. C.J.
Comput. Chem. 2005, 26, 1701–1718.
(31) Hess, B.; Kutzner, C.; van der Spoel, D.; Lindahl, E.J. Chem. Theory Comput. 2008, 4,
435–447.
(32) Berendsen, H. J. C.; Postma, J. P. M.; van Gunsteren, W. F.; DiNola, A.; Haak, J. R.J. Chem.
Phys. 1984, 81, 3684–3690.
(33) Bussi, G.; Donadio, D.; Parrinello, M.J. Chem. Phys. 2007, 126, 014101.
(34) Hockney, R. W.; Goel, S. P.; Eastwood, J. W.J. Comput. Phys. 1974, 14, 148–158.
(35) Essmann, U.; Perera, L.; Berkowitz, M. L.; Darden, T.; Lee, H.; Pedersen, L. G.J. Chem.
Phys. 1995, 103, 8577–8592.
(36) Haughney, M.; Ferrario, M.; McDonald, I. R.J. Phys. Chem. 1987, 91, 4934–4940.
(37) Schnabel, T. Molecular modeling and simulation of hydrogen bonding pure fluids and mix-
tures. Ph.D. thesis, Institut für Technische Thermodynamik und Thermische Verfahrenstech-
nik, Universität Stuttgart, 2008.
(38) Humphrey, W.; Dalke, A.; Schulten, K.J. Mol. Graph. 1996, 14, 33–38.
(39) Grottel, S.; Reina, G.; Dachsbacher, C.; Ertl, T.Comput. Graph. Forum 2010, 29, 953–962.
(40) Thomaß, B.; Walter, J.; Krone, M.; Hasse, H.; Ertl, T. Interactive Exploration of Polymer-
Solvent Interactions. 2011.
(41) Walter, J.; Deublein, S.; Vrabec, J.; Hasse, H. InHigh Performance Computing in Science
and Engineering ’09; Nagel, W. E., Kröner, D. B., Resch, M. M., Eds.; Springer, Berlin,
2010; Chapter Chemistry, Development of Models for Large Molecules and Electrolytes in
Solution for Process Engineering, pp 165–176.
19
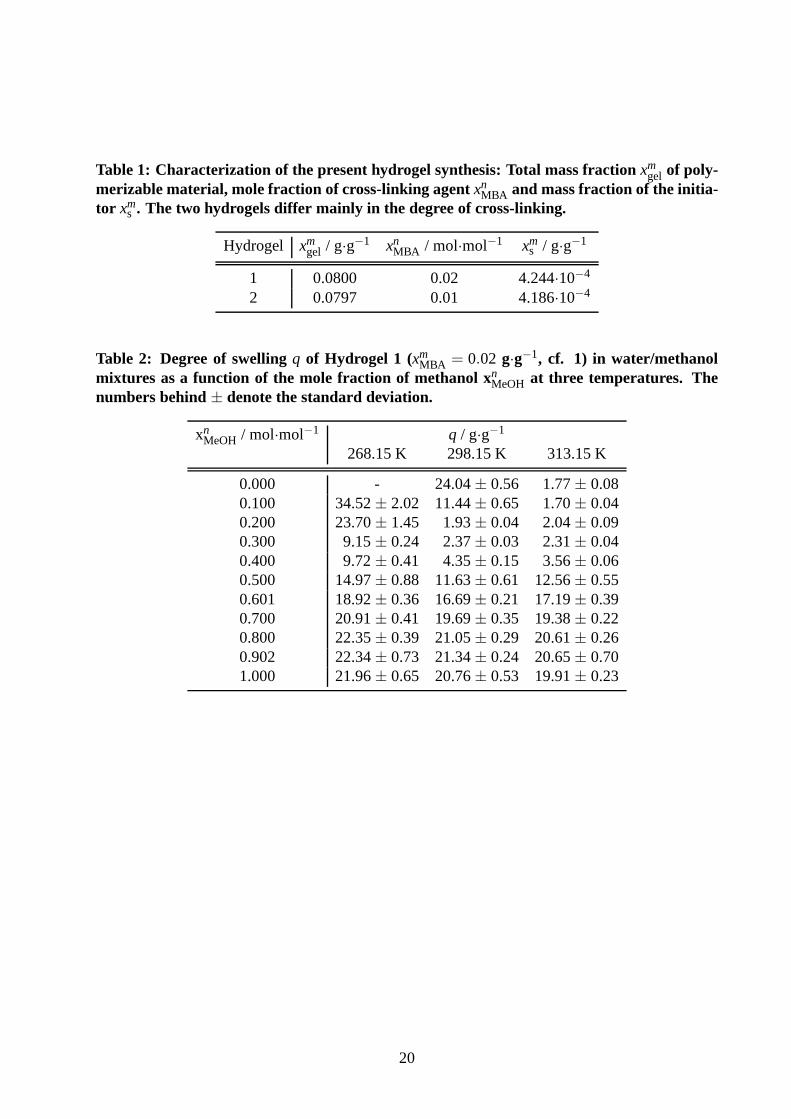
Table 1: Characterization of the present hydrogel synthesis: Total mass fractionxmgel of poly-
merizable material, mole fraction of cross-linking agentxnMBA and mass fraction of the initia-
tor xms . The two hydrogels differ mainly in the degree of cross-linking.
Hydrogel xmgel / g·g−1 xn
MBA / mol·mol−1 xms / g·g−1
1 0.0800 0.02 4.244·10−4
2 0.0797 0.01 4.186·10−4
Table 2: Degree of swellingq of Hydrogel 1 (xmMBA = 0.02 g·g−1, cf. 1) in water/methanol
mixtures as a function of the mole fraction of methanol xnMeOH at three temperatures. Thenumbers behind± denote the standard deviation.
xnMeOH / mol·mol−1 q / g·g−1
268.15 K 298.15 K 313.15 K
0.000 - 24.04± 0.56 1.77± 0.080.100 34.52± 2.02 11.44± 0.65 1.70± 0.040.200 23.70± 1.45 1.93± 0.04 2.04± 0.090.300 9.15± 0.24 2.37± 0.03 2.31± 0.040.400 9.72± 0.41 4.35± 0.15 3.56± 0.060.500 14.97± 0.88 11.63± 0.61 12.56± 0.550.601 18.92± 0.36 16.69± 0.21 17.19± 0.390.700 20.91± 0.41 19.69± 0.35 19.38± 0.220.800 22.35± 0.39 21.05± 0.29 20.61± 0.260.902 22.34± 0.73 21.34± 0.24 20.65± 0.701.000 21.96± 0.65 20.76± 0.53 19.91± 0.23
20
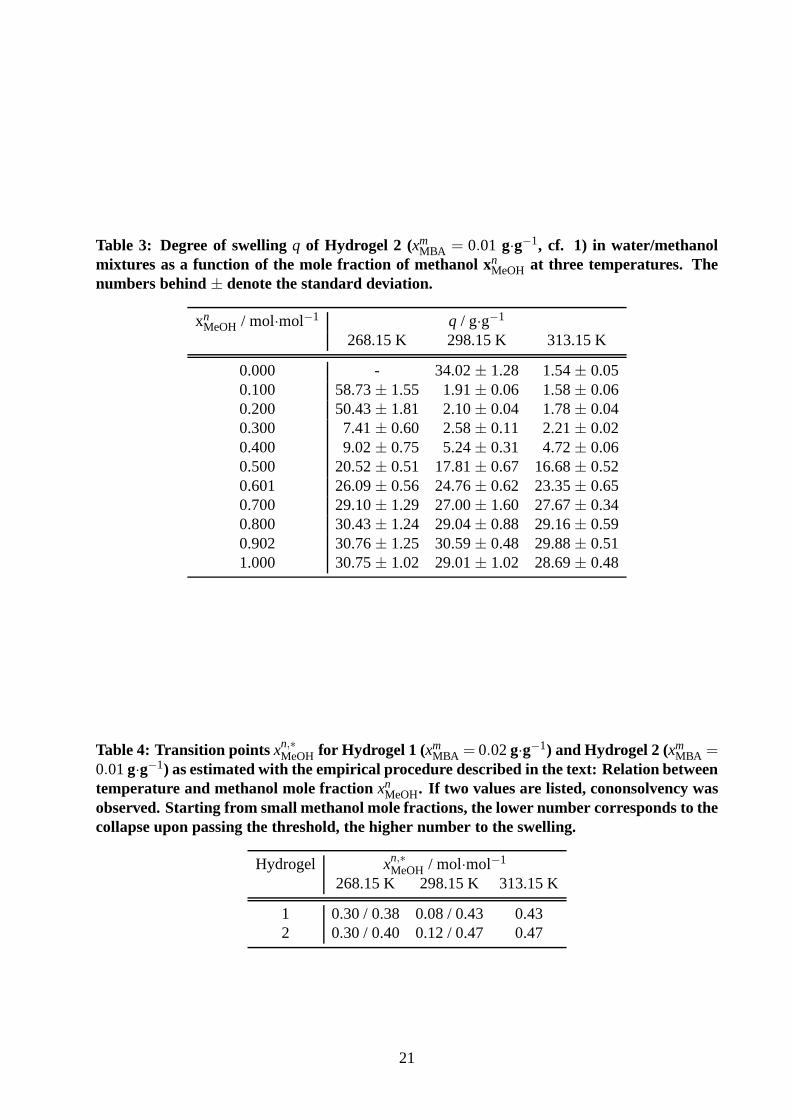
Table 3: Degree of swellingq of Hydrogel 2 (xmMBA = 0.01 g·g−1, cf. 1) in water/methanol
mixtures as a function of the mole fraction of methanol xnMeOH at three temperatures. Thenumbers behind± denote the standard deviation.
xnMeOH / mol·mol−1 q / g·g−1
268.15 K 298.15 K 313.15 K
0.000 - 34.02± 1.28 1.54± 0.050.100 58.73± 1.55 1.91± 0.06 1.58± 0.060.200 50.43± 1.81 2.10± 0.04 1.78± 0.040.300 7.41± 0.60 2.58± 0.11 2.21± 0.020.400 9.02± 0.75 5.24± 0.31 4.72± 0.060.500 20.52± 0.51 17.81± 0.67 16.68± 0.520.601 26.09± 0.56 24.76± 0.62 23.35± 0.650.700 29.10± 1.29 27.00± 1.60 27.67± 0.340.800 30.43± 1.24 29.04± 0.88 29.16± 0.590.902 30.76± 1.25 30.59± 0.48 29.88± 0.511.000 30.75± 1.02 29.01± 1.02 28.69± 0.48
Table 4: Transition points xn,∗MeOH for Hydrogel 1 (xm
MBA = 0.02g·g−1) and Hydrogel 2 (xmMBA =
0.01g·g−1) as estimated with the empirical procedure described in thetext: Relation betweentemperature and methanol mole fractionxn
MeOH. If two values are listed, cononsolvency wasobserved. Starting from small methanol mole fractions, thelower number corresponds to thecollapse upon passing the threshold, the higher number to the swelling.
Hydrogel xn,∗MeOH / mol·mol−1
268.15 K 298.15 K 313.15 K
1 0.30 / 0.38 0.08 / 0.43 0.432 0.30 / 0.40 0.12 / 0.47 0.47
21
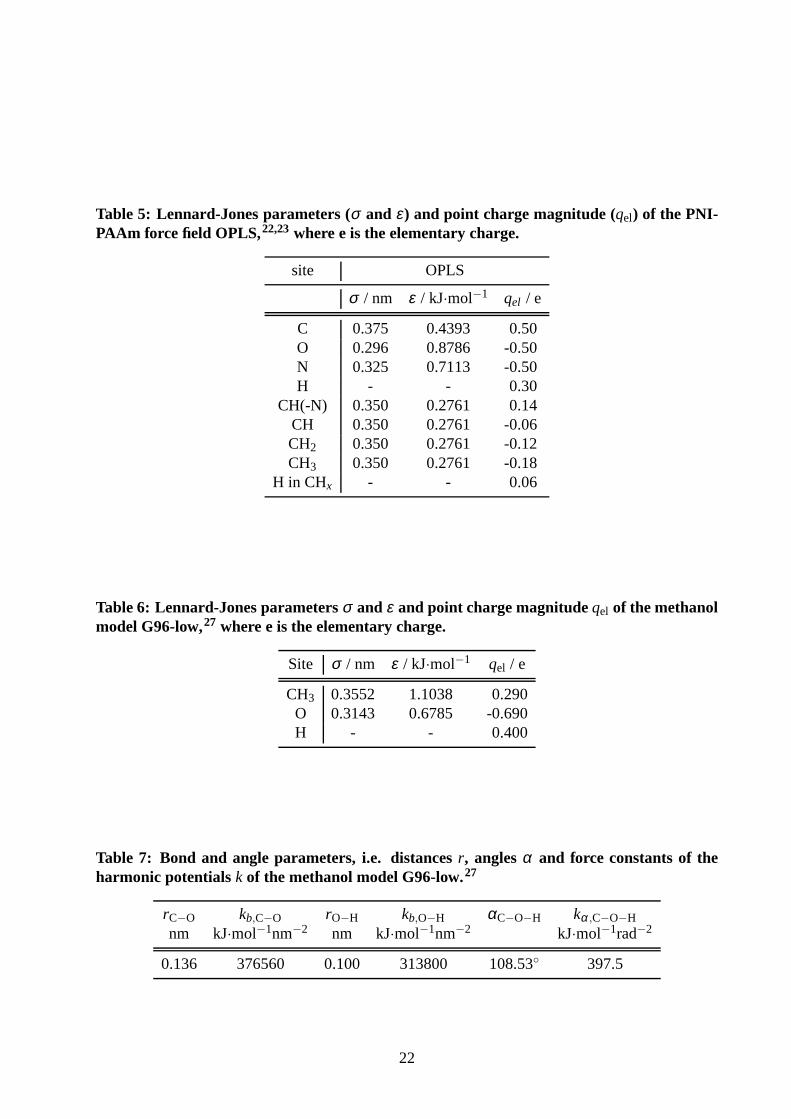
Table 5: Lennard-Jones parameters (σ and ε) and point charge magnitude (qel) of the PNI-PAAm force field OPLS,22,23where e is the elementary charge.
site OPLS
σ / nm ε / kJ·mol−1 qel / e
C 0.375 0.4393 0.50O 0.296 0.8786 -0.50N 0.325 0.7113 -0.50H - - 0.30
CH(-N) 0.350 0.2761 0.14CH 0.350 0.2761 -0.06CH2 0.350 0.2761 -0.12CH3 0.350 0.2761 -0.18
H in CHx - - 0.06
Table 6: Lennard-Jones parametersσ and ε and point charge magnitudeqel of the methanolmodel G96-low,27 where e is the elementary charge.
Site σ / nm ε / kJ·mol−1 qel / e
CH3 0.3552 1.1038 0.290O 0.3143 0.6785 -0.690H - - 0.400
Table 7: Bond and angle parameters, i.e. distancesr, anglesα and force constants of theharmonic potentials k of the methanol model G96-low.27
rC−O kb,C−O rO−H kb,O−H αC−O−H kα,C−O−H
nm kJ·mol−1nm−2 nm kJ·mol−1nm−2 kJ·mol−1rad−2
0.136 376560 0.100 313800 108.53◦ 397.5
22
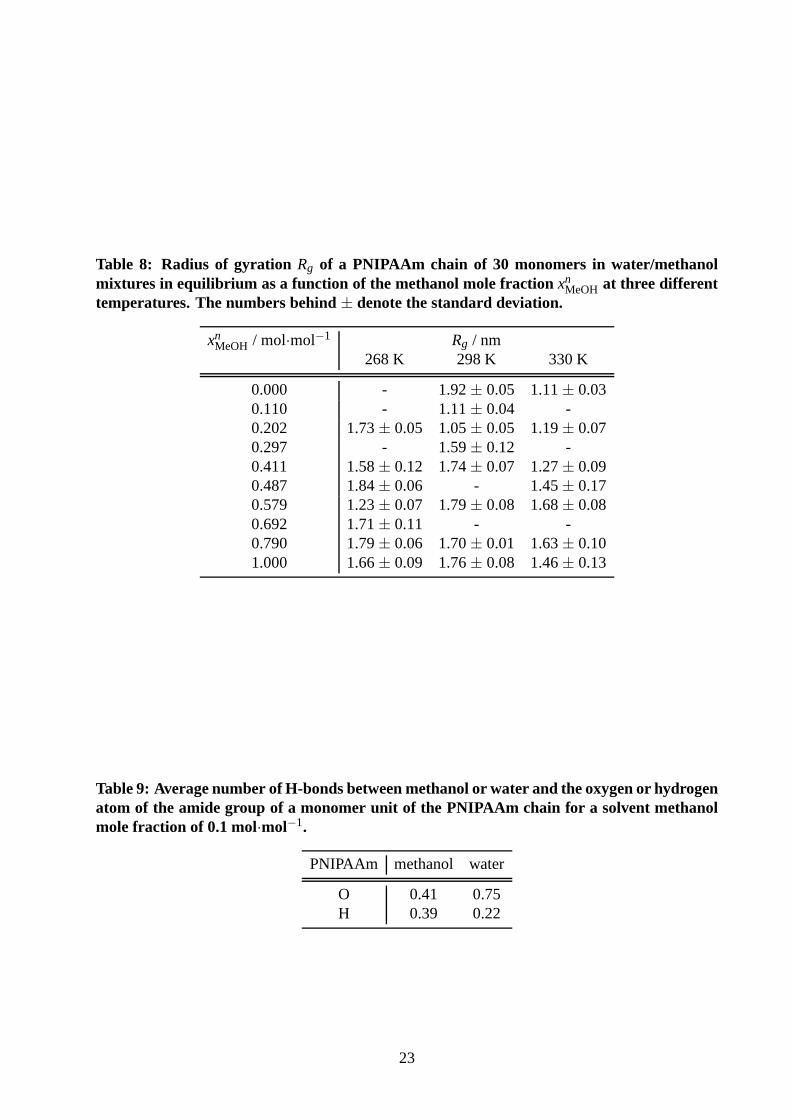
Table 8: Radius of gyration Rg of a PNIPAAm chain of 30 monomers in water/methanolmixtures in equilibrium as a function of the methanol mole fraction xn
MeOH at three differenttemperatures. The numbers behind± denote the standard deviation.
xnMeOH / mol·mol−1 Rg / nm
268 K 298 K 330 K
0.000 - 1.92± 0.05 1.11± 0.030.110 - 1.11± 0.04 -0.202 1.73± 0.05 1.05± 0.05 1.19± 0.070.297 - 1.59± 0.12 -0.411 1.58± 0.12 1.74± 0.07 1.27± 0.090.487 1.84± 0.06 - 1.45± 0.170.579 1.23± 0.07 1.79± 0.08 1.68± 0.080.692 1.71± 0.11 - -0.790 1.79± 0.06 1.70± 0.01 1.63± 0.101.000 1.66± 0.09 1.76± 0.08 1.46± 0.13
Table 9: Average number of H-bonds between methanol or waterand the oxygen or hydrogenatom of the amide group of a monomer unit of the PNIPAAm chain for a solvent methanolmole fraction of 0.1 mol·mol−1.
PNIPAAm methanol water
O 0.41 0.75H 0.39 0.22
23
Figure 1: Degree of swellingq of the PNIPAAm Hydrogel 1 (xmMBA = 0.02 mol·mol−1) in wa-
ter/methanol mixtures at 268.15 K (◦), 298.15 K (▽), and 313.15 K (�) as a function of the mole
fraction of methanolxnMeOH. Symbols: experimental data from this work, lines: guide for the eye.
The error bars denote the standard deviation.
Figure 2: Degree of swellingq of the PNIPAAm Hydrogel 1 (xmMBA = 0.02 mol·mol−1) (◦), and
Hydrogel 2 (xmMBA = 0.01 mol·mol−1) (▽) in water/methanol mixtures as a function of the mole
fraction of methanolxnMeOH at 298.15 K. Symbols: experimental data from this work, lines: guide
for the eye. The error bars denote the standard deviation.
Figure 3: Comparison of transition points of PNIPAAm in water/methanol mixtures determined
in different ways: Estimates from the present experimentalresults for PNIPAAm Hydrogel 1
(xmMBA = 0.02 g·g−1) (�) and Hydrogel 2 (xm
MBA = 0.01 g·g−1) (▽) and experimental cloud point
data for PNIPAAm polymers by Winnik et al.17 (•).
Figure 4: Radius of gyrationRg of a PNIPAAm chain of 30 monomers in water/methanol mix-
tures in equilibrium as a function of the methanol mole fraction xnMeOH at 268, 298 and 330 K. The
error bars indicate the standard deviation. There are no results for pure water at 268 K, because it
is solid at this temperature.
Figure 5: Average number of H-bonds between methanol (▽) and water (�) and a monomer unit
of the PNIPAAm chain as a function of the methanol mole fraction xnMeOH at 298 K and 1 bar.
Additionally, the radius of gyrationRg (–) is shown as well as linear interpolations between the
number of H-bonds for the pure solvents methanol (– –) and water (· · · ) and zero where the solvent
is not present in the mixture.
Figure 6: Snapshot of a PNIPAAm monomer from simulation. Thecolors indicate atom types:
24
carbon (black), hydrogen (white), oxygen (red) and nitrogen (blue). The upper two carbon atoms
are part of the polymer backbone, denoted by the black tubes.The lower three carbon atoms are
the non-polar end of the side group. In between these two sites are the four atoms of the polar
amide group, which forms H-bonds with the solvent molecules.
25
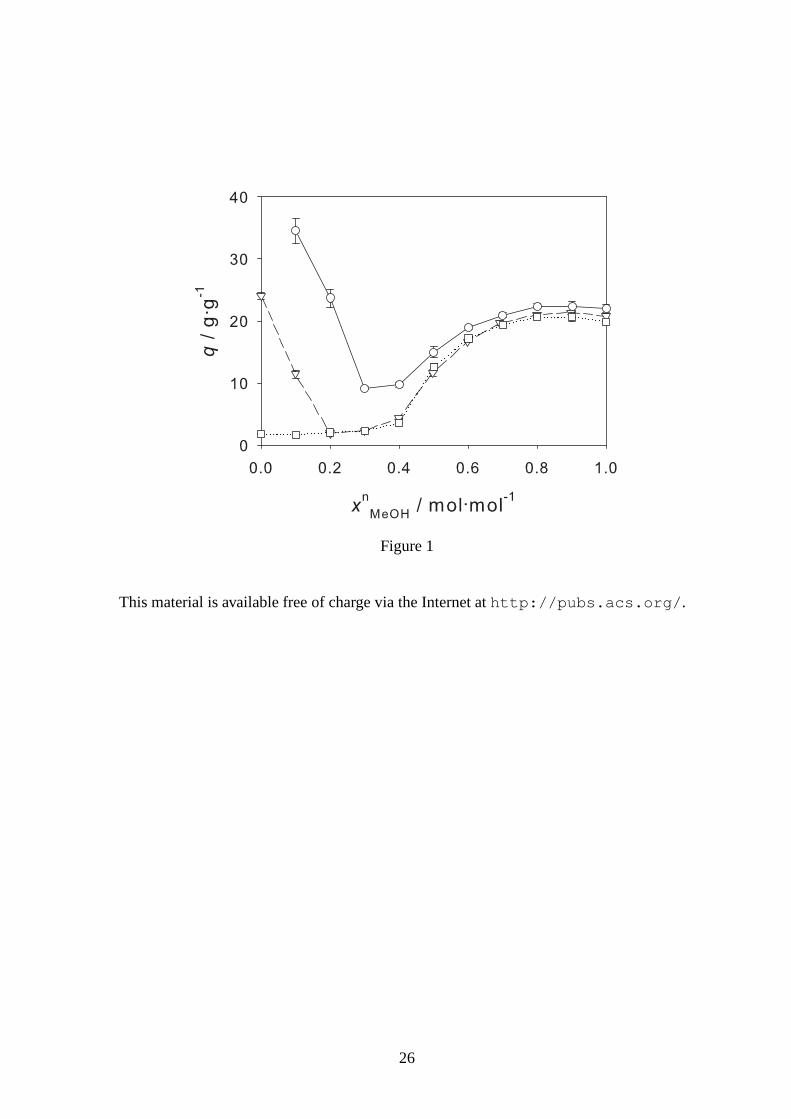
Figure 1
This material is available free of charge via the Internet athttp://pubs.acs.org/.
26
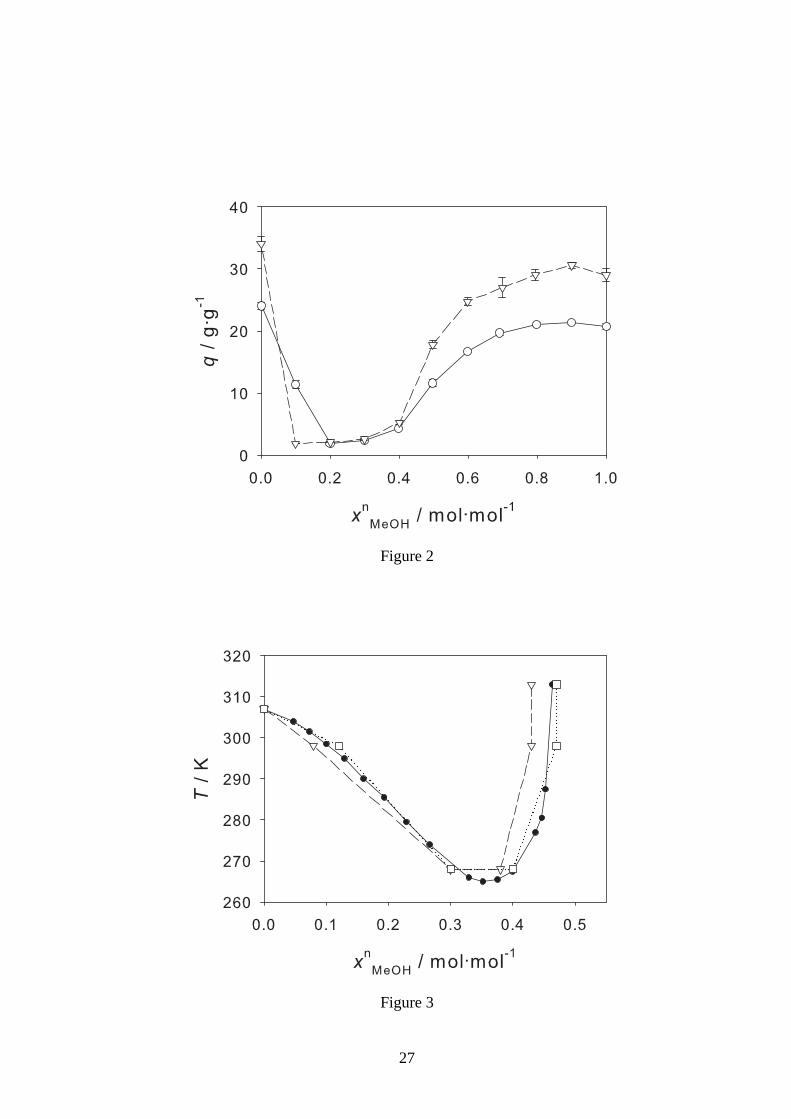
Figure 2
Figure 3
27
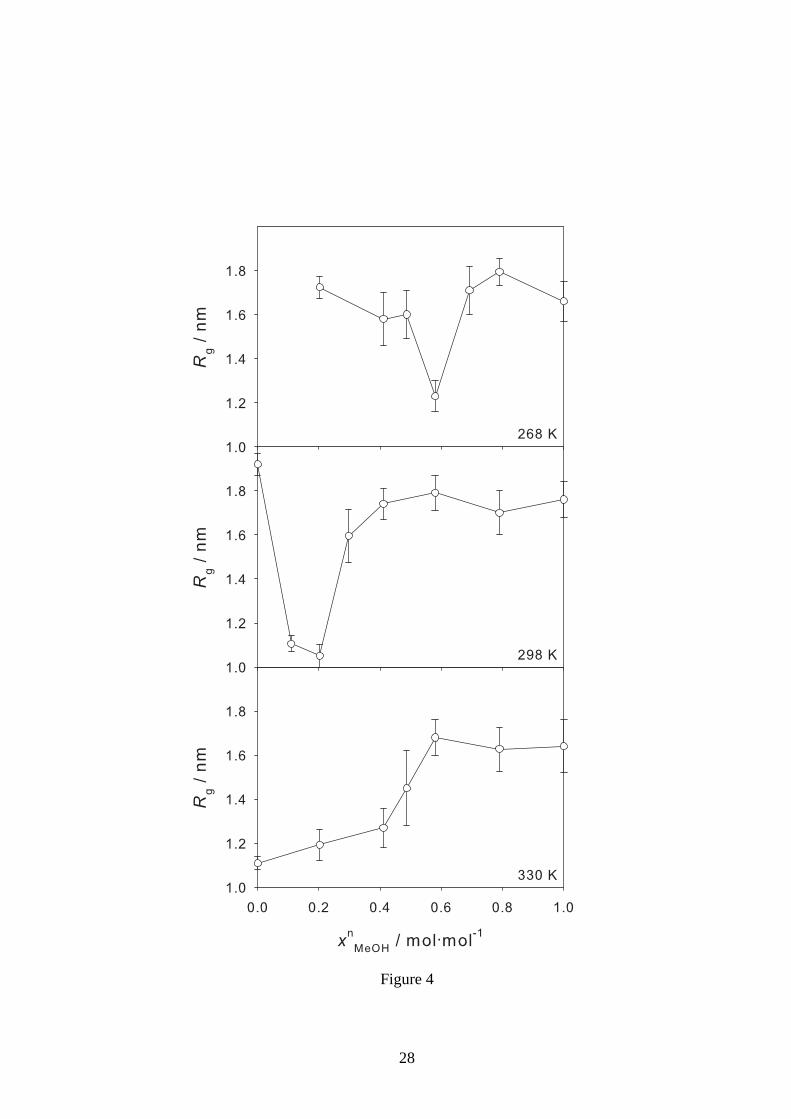
Figure 4
28
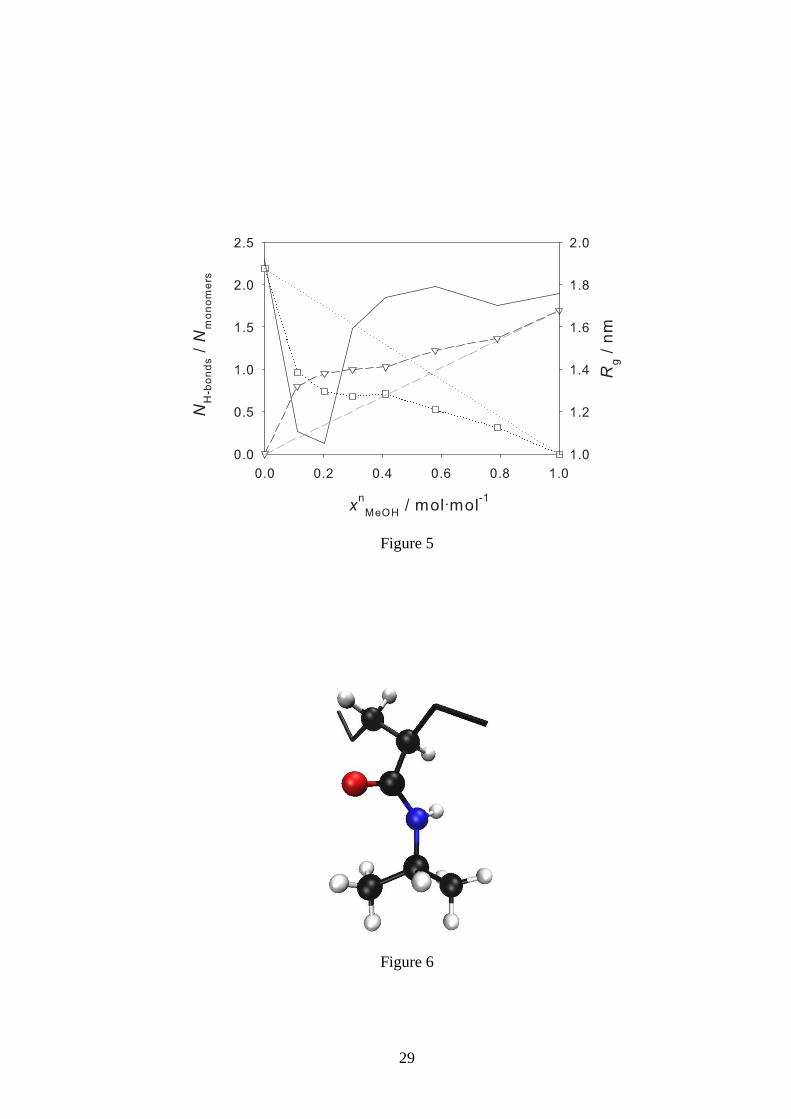
Figure 5
Figure 6
29
Molecular Dynamics and Experimental Study of
Conformation Change of
Poly(N-isopropylacrylamide)-hydrogels in Mixtures
of Water and Methanol
Jonathan Walter,† Jan Sehrt,† Jadran Vrabec,‡ and Hans Hasse∗,†
Laboratory of Engineering Thermodynamics, University of Kaiserslautern, Kaiserslautern,
Germany, and Thermodynamics and Energy Technology, University of Paderborn, Paderborn,
Germany
E-mail: [email protected]
Appendix A: Applicability of different methanol models
In order to find a suitable methanol model for the simulations of PNIPAAm in water/methanol
mixtures, in a preliminary study three methanol models from the literature were tested: Schnabel
et al. (Schnabel),1 GROMOS96 with high (G96-high) and with low (G96-low) point charges.2
The Schnabel model is a rigid body, the two G96 models consider the internal degrees of freedom.
In all three models, CH3 is described by one united-atom site.
The methanol model Schnabel was developed using the Lorentz-Berthelot mixing rule,3,4 i.e. the
†University of Kaiserslautern‡University of Paderborn
S1
Jonathan Walter et al. PNIPAAm-hydrogels in Water/Methanol Mixtures
arithmetic mean for σ and the geometric mean for ε . The OPLS force field was developed using
the geometric mean both for σ and ε .5,6
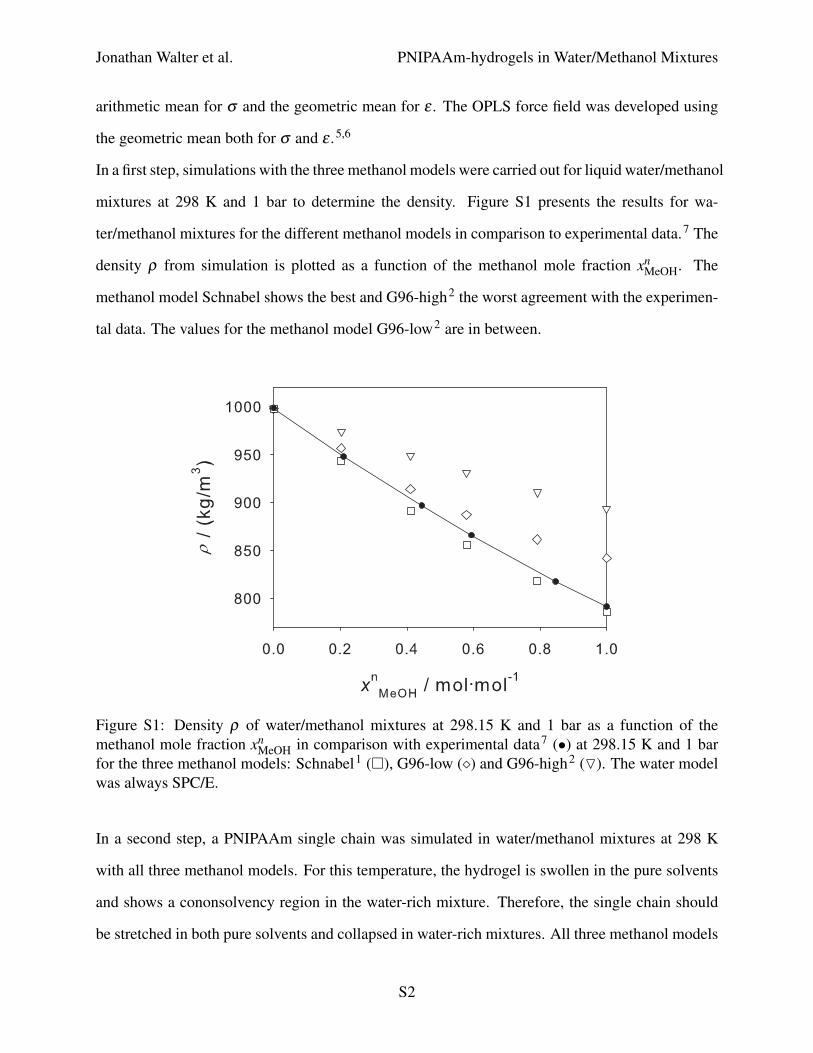
In a first step, simulations with the three methanol models were carried out for liquid water/methanol
mixtures at 298 K and 1 bar to determine the density. Figure S1 presents the results for wa-
ter/methanol mixtures for the different methanol models in comparison to experimental data.7 The
density ρ from simulation is plotted as a function of the methanol mole fraction xnMeOH. The
methanol model Schnabel shows the best and G96-high2 the worst agreement with the experimen-
tal data. The values for the methanol model G96-low2 are in between.
Figure S1: Density ρ of water/methanol mixtures at 298.15 K and 1 bar as a function of themethanol mole fraction xn
MeOH in comparison with experimental data7 (•) at 298.15 K and 1 barfor the three methanol models: Schnabel1 (�), G96-low (�) and G96-high2 (O). The water modelwas always SPC/E.
In a second step, a PNIPAAm single chain was simulated in water/methanol mixtures at 298 K
with all three methanol models. For this temperature, the hydrogel is swollen in the pure solvents
and shows a cononsolvency region in the water-rich mixture. Therefore, the single chain should
be stretched in both pure solvents and collapsed in water-rich mixtures. All three methanol models
S2
Jonathan Walter et al. PNIPAAm-hydrogels in Water/Methanol Mixtures
yielded the stretched conformation in the pure solvents. However, only the G96-low model was
able to predict cononsolvency of the PNIPAAm chain. Therefore, this model was used for all fur-
ther investigations of the swelling behavior of PNIPAAm chains in water/methanol mixtures.
The methanol model Schnabel1 is clearly the best for predicting the density of the liquid mixture.
The fact that it is not suited for predicting cononsolvency of PNIPAAm in water/methanol mixtures
may be due to incompatible mixing rules for the OPLS force field and for that model.
Appendix B: H-bond statistics
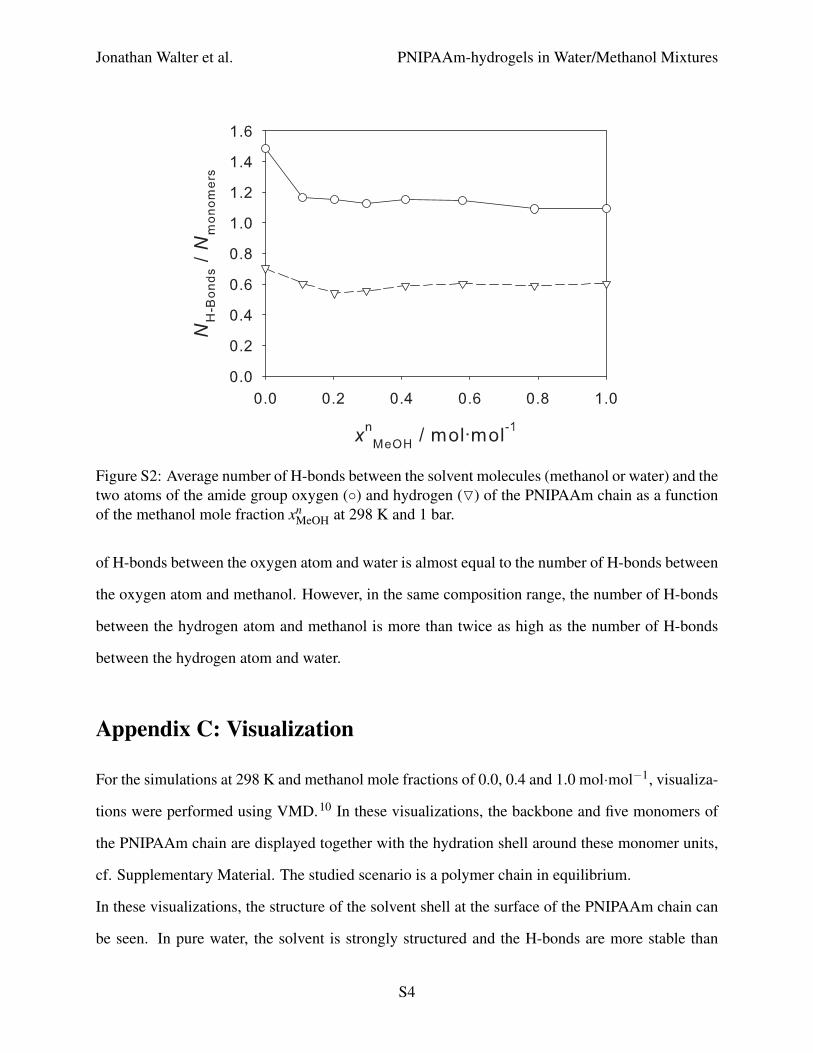
Figure S2 shows the average number of H-bonds between the solvent molecules (methanol or
water) and the two atoms of the amide group (oxygen and hydrogen) of the PNIPAAm chain as a
function of the methanol mole fraction at 298 K. In pure water, more H-bonds are present between
the solvent and the two PNIPAAm atoms than in pure methanol. Except for the water-rich region
of water/methanol mixtures, the number of H-bonds is almost constant and the same as in pure
methanol. The ratio of H-bonds formed by the oxygen atom and those formed by the hydrogen
atom of PNIPAAm is around two for all solvent compositions. For pure water, Tanaka et al.8
measured two H-bonds between water and the oxygen atom of PNIPAAm and one H-bond with
the hydrogen atom leading to the same ratio as seen in the present simulations.
Furthermore, it can be seen that the number of H-bonds between the solvent and PNIPAAm is
not decreasing in the cononsolvency region. This leads to the conclusion that PNIPAAm is not
dehydrated in the collapsed conformation, which supports the findings of Cheng et al.9
The average number of H-bonds between methanol and the two atoms of the amide group (oxygen
and hydrogen) as well as water and the two atoms (oxygen and hydrogen) of the PNIPAAm chain
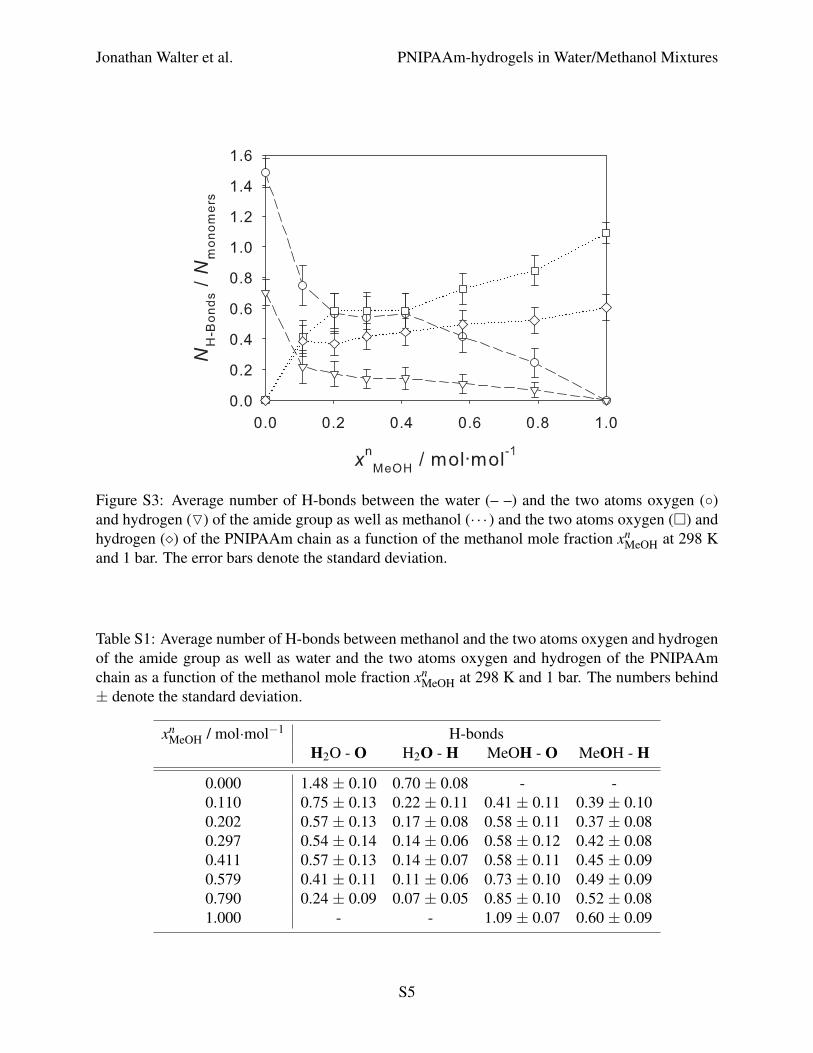
as a function of the methanol mole fraction at 298 K and 1 bar is presented in Figure S3 and
Table S1. In addition to the conclusions from Figure 5 in the main manuscript and Figure S2,
the preference of water for the oxygen atom and of methanol for the hydrogen atom of the amide
group can be seen here. At methanol mole fractions between 0.2 and 0.4 mol·mol−1, the number
S3
Jonathan Walter et al. PNIPAAm-hydrogels in Water/Methanol Mixtures
Figure S2: Average number of H-bonds between the solvent molecules (methanol or water) and thetwo atoms of the amide group oxygen (◦) and hydrogen (O) of the PNIPAAm chain as a functionof the methanol mole fraction xn
MeOH at 298 K and 1 bar.
of H-bonds between the oxygen atom and water is almost equal to the number of H-bonds between
the oxygen atom and methanol. However, in the same composition range, the number of H-bonds
between the hydrogen atom and methanol is more than twice as high as the number of H-bonds
between the hydrogen atom and water.
Appendix C: Visualization
For the simulations at 298 K and methanol mole fractions of 0.0, 0.4 and 1.0 mol·mol−1, visualiza-
tions were performed using VMD.10 In these visualizations, the backbone and five monomers of
the PNIPAAm chain are displayed together with the hydration shell around these monomer units,
cf. Supplementary Material. The studied scenario is a polymer chain in equilibrium.
In these visualizations, the structure of the solvent shell at the surface of the PNIPAAm chain can
be seen. In pure water, the solvent is strongly structured and the H-bonds are more stable than
S4
Jonathan Walter et al. PNIPAAm-hydrogels in Water/Methanol Mixtures
Figure S3: Average number of H-bonds between the water (– –) and the two atoms oxygen (◦)and hydrogen (O) of the amide group as well as methanol (· · · ) and the two atoms oxygen (�) andhydrogen (�) of the PNIPAAm chain as a function of the methanol mole fraction xn
MeOH at 298 Kand 1 bar. The error bars denote the standard deviation.
Table S1: Average number of H-bonds between methanol and the two atoms oxygen and hydrogenof the amide group as well as water and the two atoms oxygen and hydrogen of the PNIPAAmchain as a function of the methanol mole fraction xn
MeOH at 298 K and 1 bar. The numbers behind± denote the standard deviation.
xnMeOH / mol·mol−1 H-bonds
H2O - O H2O - H MeOH - O MeOH - H
0.000 1.48 ± 0.10 0.70 ± 0.08 - -0.110 0.75 ± 0.13 0.22 ± 0.11 0.41 ± 0.11 0.39 ± 0.100.202 0.57 ± 0.13 0.17 ± 0.08 0.58 ± 0.11 0.37 ± 0.080.297 0.54 ± 0.14 0.14 ± 0.06 0.58 ± 0.12 0.42 ± 0.080.411 0.57 ± 0.13 0.14 ± 0.07 0.58 ± 0.11 0.45 ± 0.090.579 0.41 ± 0.11 0.11 ± 0.06 0.73 ± 0.10 0.49 ± 0.090.790 0.24 ± 0.09 0.07 ± 0.05 0.85 ± 0.10 0.52 ± 0.081.000 - - 1.09 ± 0.07 0.60 ± 0.09
S5
Jonathan Walter et al. PNIPAAm-hydrogels in Water/Methanol Mixtures
in pure methanol. This is in agreement with the findings of Winnik et al.11 In the visualization
for the methanol concentration of 0.4 mol·mol−1, it can be seen that the water molecules in the
solvent shell are typically closer to the PNIPAAm backbone than the methanol molecules. It can
also be seen that the methanol molecules in the solvent shell are oriented such that their non-polar
methyl-group is directed to the surrounding bulk solvent, thereby shielding the polar sites of the
PNIPAAm chain.
In other simulations, also instationary processes were studied and visualized. These visualizations
were performed with MegaMol.12 The amount of methanol in the hydration shell of the polymer
was displayed in a dynamical way. For details of these visualizations see Thomaß et al.13 The sim-
ulation starts with a methanol mole fraction in the whole simulation volume of 0.1 mol·mol−1 at
298 K, which is in the cononsolvency region. In this simulation, methanol is very quickly enriched
in the solvent shell. This leads to a methanol mole faction of about 0.44 mol·mol−1 in the solva-
tion shell. Upon increase of the methanol concentration in the solvent shell, the polymer starts to
collapse. This visualization is also included in the Supplementary Material.
References
(1) Schnabel, T.; Srivastava, A.; Vrabec, J.; Hasse, H. J. Phys. Chem. B 2007, 111, 9871–9878.
(2) van Gunsteren, W. F.; Billeter, S.; Eising, A.; Hünenberger, P.; Krüger, P.; Mark, A.; Scott, W.;
Tironi, I. Biomolecular Simulation: The Gromos 96 Manual and User Guide; vdf Hochschul-
verlag an der ETH Zürich: Zürich, Switzerland, 1996.
(3) Lorentz, H. A. Ann. Phys. 1881, 12, 127–136.
(4) Berthelot, D. C. R. Acad. Sci. 1898, 126, 1703–1706.
(5) Jorgensen, W. L.; Tirado-Rives, J. J. Am. Chem. Soc. 1988, 110, 1657–1666.
(6) Jorgensen, W. L.; Maxwell, D. S.; Tirado-Rives, J. J. Am. Chem. Soc. 1996, 118, 11225–
11236.
S6
Jonathan Walter et al. PNIPAAm-hydrogels in Water/Methanol Mixtures
(7) Zarei, H. A.; Jalili, F.; Assadi, S. J. Chem. Eng. Data 2007, 52, 2517–2526.
(8) Tanaka, F.; Koga, T.; Kojima, H.; Winnik, F. M. Macromolecules 2009, 42, 1321–1330.
(9) Cheng, H.; Shen, L.; Wu, C. Macromolecules 2006, 39, 2325–2329.
(10) Humphrey, W.; Dalke, A.; Schulten, K. J. Mol. Graph. 1996, 14, 33–38.
(11) Winnik, F. M.; Ringsdorf, H.; Venzmer, J. Macromolecules 1990, 23, 2415–2416.
(12) Grottel, S.; Reina, G.; Dachsbacher, C.; Ertl, T. Comput. Graph. Forum 2010, 29, 953–962.
(13) Thomaß, B.; Walter, J.; Krone, M.; Hasse, H.; Ertl, T. Interactive Exploration of Polymer-
Solvent Interactions. Proc. Vision, Modeling and Visualization ’11, 2011; pp 301–308.
S7