Embed Size (px)
Citation preview

1
MASTERARBEIT
Titel der Masterarbeit
Molecular characterization of lipid droplet associated proteins in the chicken yolk sac
Verfasser
Thomas Finkes BSc
angestrebter akademischer Grad
Master of Science (MSc)
Wien, 2012
Studienkennzahl lt. Studienblatt: A 066 834
Studienrichtung lt. Studienblatt: Masterstudium Molekulare Biologie
Betreuerin / Betreuer: O. Univ. Prof. DI. Dr. Wolfgang J. Schneider

2
Directory
1. INTRODUCTION.................................................................................................. 4
1.1 The chicken (Gallus gallus domesticus) as a model organism ............................................ 4
1.2 Chicken yolk sac (YS) ............................................................................................................... 5
1.3 Lipid droplets (LDs) ................................................................................................................... 7
1.4 PERILIPINS ............................................................................................................................... 10 1.4.1 PLIN1 ................................................................................................................................. 11 1.4.2 PLIN2 ................................................................................................................................. 13 1.4.3 PLIN3 ................................................................................................................................. 16 1.4.4 PLIN4 ................................................................................................................................. 17 1.4.5 PLIN5 ................................................................................................................................. 17
1.5 Lipases ..................................................................................................................................... 19 1.5.1 ATGL (Adipose triglyceride lipase) ........................................................................................ 19 1.5.2 PNPLA3 (Patatin-like phospholipase domain-containing protein) ......................................... 20 1.5.3 LAL (Lysosomal acid lipase) .................................................................................................. 21 1.5.4 HTGL (Hepatic triglyceride lipase) ......................................................................................... 22 1.5.5 LPL (Lipoprotein lipase) ......................................................................................................... 22
2. MATERIALS AND METHODS .......................................................................... 24
2.1 Chemicals and Enzymes ......................................................................................................... 24
2.2 Bacterial strains and vector systems .................................................................................... 24
2.3 Oligonucleotide primers ......................................................................................................... 26
2.4 Animals ..................................................................................................................................... 26
2.5 Dissection of chicken yolk sac layers ................................................................................... 26
2.6 Molecular biological methods: RNA ...................................................................................... 27 2.6.1 Total RNA extraction from chicken yolk sac tissue ............................................................... 27 2.6.2 Reverse Transcription of isolated RNA ................................................................................. 28
2.7 Molecular Biological Methods: DNA ...................................................................................... 28 2.7.1 Reverse transcriptase polymerase chain reaction (RT-PCR) ............................................... 28 2.7.2 Agarose gel-electrophoresis ................................................................................................. 29 2.7.3 Agarose gel extraction ........................................................................................................... 30 2.7.4 DNA ligation ........................................................................................................................... 31 2.7.5 Production of chemical competent E. coli TOP10 ................................................................. 31 2.7.6 Transformation of chemical competent E. coli ...................................................................... 32 2.7.7 Mini preparation of Plasmid DNA .......................................................................................... 32 2.7.8 Midi preparation of Plasmid DNA .......................................................................................... 33 2.7.9 Restriction enzyme (RE) digestion ........................................................................................ 34 2.7.10 QPCR (Quantitative real time polymerase chain reaction) ................................................... 34
2.8 Molecular Biological Methods: Protein ................................................................................. 35

3
2.8.1 Protein Extraction: Whole TRITON X-100 tissue-extract preparation ................................... 35 2.8.2 Preparation of Triton X-100 membrane-protein extracts ....................................................... 36 2.8.3 Protein concentration measurement ..................................................................................... 36 2.8.4 Western blot analysis ............................................................................................................ 38 2.8.5 Protein isolation from cellular lipid fractions by subcellular fractionation .............................. 39 2.8.6 Subcellular fractionation method 2 ........................................................................................ 39 2.8.7 Processing of the cytosolic protein fraction ........................................................................... 40
2.9 Cultivation of EECs of the area vitellina ............................................................................... 41
2.10 Immunofluorescence experiments ........................................................................................ 41
2.11 Utilized antibodies and antisera in Western blotting ........................................................... 42
2.12 Utilized antibodies, antisera, and preimmune sera (PI) in immunofluorescence experiments .............................................................................................................................. 42
3. RESULTS .......................................................................................................... 43
3.1 Investigation of PLIN gene expression in chicken tissues ................................................. 43
3.2 Investigation of PLIN2 protein levels in the yolk sac. ......................................................... 48
3.3 Immunofluorescence: PLIN2 antibody staining in area vitellina EECs ............................. 51
3.4 Immunofluorecence: PI staining in area vitellina EECs ...................................................... 54
3.5 Lipases involved in the mobilization of TGs in the chicken yolk sac ................................ 57
3.6 Investigation of lipase protein levels in the yolk sac........................................................... 61
4. DISCUSSION ..................................................................................................... 63
5. REFERENCES .................................................................................................. 67
6. LIST OF ABBREVIATIONS ............................................................................... 75
ABSTRACT .............................................................................................................. 81
ZUSAMMENFASSUNG ........................................................................................... 83
ACKNOWLEDGEMENTS ........................................................................................ 85
CURRICULUM VITAE .............................................................................................. 86

4
1. Introduction
1.1 The chicken (Gallus gallus domesticus) as a model organism
The domestic chicken (Gallus gallus domesticus), termed as domestic fowl is a descendent
of the red jungle fowl. It was domesticated from the red jungle fowl approximately 6000
before Christ in the area of today’s Vietnam and Thailand and was widespread from there
over the globe (Komiyama et al., 2004). The domesticated chicken was used for many
centuries simply as food resource before it was discovered to be an excellent model
organism. As the domestic chicken is oviparous, the eased access to the embryo can be
used for early vertebrate developmental studies (Stern, 2005). Many famous scientists have
selected the domestic chicken for their works. Already in the third century Before Christ (BC)
the philosophe Aristotle utilized Gallus gallus domesticus for first embryological studies. In
the late 19th century Charles Darwin studied the breeding behaviour of domestic chickens
(Darwin, C. 1868, The Variation of Plants and Animals under Domestication John Murray,
London UK). Later in that century the chemist Louis Pasteur executed infection studies with
chickens to find a vaccine against fowl cholera (Pasteur, The Attenuation of the Causal
Agent of Fowl Cholera 1880). In other fields like immunology and medicine the model
organism chicken pioneered with the discovery of B-cells and the isolation of the first
oncogene (Brown, et al., 2003).
The chicken genome has a size of 1.1x10⁹ base pairs (bp). The genome is divided on 39
chromosomes, 30 microchromosomes and 9 pairs of macrochromosomes (Ladjali-
Mohammedi et al., 1999). Birds follow a ZW sex-determination system compared to the XY
system in mammals and the XO system in many insects. Males are homogametic (ZZ), while
females are heterogametic (ZW). The Z chromosome is, compared to the mammalian X
chromosome far bigger than the W chromosome. The chicken genome consists of
remarkably low amounts of repetitive sequences, only 11% compared to approximately 50%
in mammals which makes it a favorable model for genomic studies.
Nowadays two different breeds of domestic chicken are available. The first one, called meat-
breed grows fast and reaches a weight of 2.3kg at an age of 6 weeks. If not food restricted it
gets obese at maturity. The second one, the laying breed grows slower and reaches a weight
of 2.3kg at maturity. Hence the nonexistent weight problem the laying breed is favored for
scientific use. The most common used laying breeds originate from the white Leghorn strain.
Generally the white Leghorn reaches maturity at 5 month and achieves the highest laying
rates in the first year (Bahr, Sourcebook of Models for Biomedical Research, edited by Conn,
2008).

5
1.2 Chicken yolk sac (YS)
Figure 1. 5 day (d) chicken embryo with YS (yellow asterisk) and allantois (red asterisk). The
completely un-vascularized EECs of the area vitellina are indicated with the blue arrow. The
egg was incubated for 5d post laying at 37°C in an incubator. Picture was kindly provided by
Raimund Bauer.
The chicken YS is an extra embryonic membranous sac attached to the embryo. It encloses
the eggs’ yolk and mediates the transfer of nutrients from the yolk to the embryo. Yolk
remnants that are not used by the embryo before hatching are drawn into the abdomen at
embryonic day 19 providing nourishment for the first 2-3 days.
The YS consists of all three germ layers. The outer part of the YS, most distal to the yolk, is
the ectoderm. It is exposed to the egg albumen and is continuous with the embryo’s
ectoderm (Nakazawa, et al., 2011). The YS mesoderm lies beneath the ectoderm. It is made
up by vascular endothelial cells, blood cells and smooth muscle cells. It is the place of early
YS erythropoiesis (Sheng, 2010). The innermost part of the YS is represented by the
endodermal layer. It builds up an epithelial sheet; hence cells of the endoderm are called
endodermal epithelial cells (EECs). EECs lie at the apical site of the YS, in direct contact to
the yolk. These EECs indirectly supply nutrients from the yolk for the embryo (Mobbs and
McMillan, 1981; Speake et al., 1998). The yolk generally is composed of approximately 50%
water, 15% protein, 33% fat, and 1% carbohydrates. Dependent on egg weight, strain and
hen age the division of components can vary (Shenstone, 1968; O’Sullivan et al., 1991;
Vieira and Moran, 1998).
In the early stages (earlier than 10d post laying) the YS can be clearly divided into two
distinct differentiated regions called area vasculosa and area vitellina (Fig. 1). Both areas are

6
composed of EECs. In contrast to the area vasculosa, the area vitellina is not overgrown with
a blood vessel layer of mesodermal origin. With ongoing growth, development, and
differentiation of the YS the area vitellina gradually “transforms” into the area vasculosa, as
the mesodermal blood vessel layer overgrows the area vitellina.
The molecular mechanism that underlies the uptake of nutrients from the yolk is not
completely understood but it is thought that the EECs of the chicken YS work as a kind of
digestive system. Nutrients from the yolk are taken up, broken down and rebuilt before the
release to the mesodermal blood vessels (Fig. 3). In particular the fatty compounds are taken
up by non-specific phagocytosis at the apical surface of the EECs of the YS membrane
(Speake et al., 1998). In figure 3 (Nakazawa, et al., 2011), a schematic view is given of how
EECs of the area vasculosa of early embryonic stages function and interact with the
mesodermal blood vessels. From the apical side of the EECs proteins, lipoproteins and lipids
are taken up from the yolk. When the nutrients are taken up in coated vesicles they are
transferred to the apical vacuole where likely their breakdown occurs. In the next step, in a
bigger compartment, the yolk droplet, further breakdown and subsequent resynthesis of
nutrients takes place. In the last step lipoproteins, cardiovascular regulators and other serum
proteins are delivered to the vascular lumen of the mesodermal blood vessel cells. As
described in more detail in the Results section, I found EECs of the area vitellina of the
chicken YS containing large amounts of lipid droplets (LDs) (Fig. 2).
Figure 2. EECs of the area vitellina in the 5d chicken YS. The cells are filled with LDs (as
shown by green BODIPY 493/503 fluorescence). Nuclei (DAPI staining) are shown in blue.
Scale bar; 50 µm.

7
Figure 3. Scheme of yolk nutrient uptake by EECs of the embryonic chicken YS to the
mesodermal blood vessel layer. Abbreviations: av: apical vacuole; cp: coated pit; cv: coated
vesicle; EC: endothelial cell; Endo: YS endoderm; SMC: smooth muscle; N: nucleus; yd: yolk
drop; yg: yolk granule; The figure was taken from Nakazawa, et al., 2011.
1.3 Lipid droplets (LDs)
Figure 4. This figure shows the schematic structure of a LD. A phospholipid monolayer
surrounds the neutral lipid core that comprises sterol ester and triacylglycerol. The figure was
taken from Guo et al., 2009.

8
Lipid droplets are the major fat depots of cells. They have a globular shape and are bounded
by a phospholipid monolayer (Fig. 4). The most abundant phospholipid in the membrane of
LDs is phosphatidyl choline (Tauchi-Sato, et al., 2002). Depending on the cell type they vary
in size from 0.1µm to 2µm in most mammalian cells and occupy approximately 3% of the
cytosol. In adipocytes LDs can reach a diameter of 150µm and can occupy up to 90% of the
cytosol (Pilch et al., 2007). Their main purpose is to store excess fatty acids like TGs and
sterols in form of neutral lipids (esters) in a hydrophobic core. Storage of excess free fatty
acids (FFAs) is of great importance especially in non-adipose tissue. If the storage is
impaired a phenomenon called lipotoxicity can occur. In many studies it was shown that
accumulation of excess FFAs in liver, kidney, heart, and skeletal muscle can cause heart
failure, diabetes typ II, atherosclerosis, and obesity (Schaffer, 2003).
Large amounts of neutral lipids stored in LDs of adipocytes are mostly utilized for skeletal
muscles, which by themselves are able to store remarkable amounts of neutral lipids in form
of LDs. In steroidogenic cells like testes and ovaries the stored sterols are used for steroid
hormone synthesis. Other tissues like liver, intestine, kidney, and heart also contain small
intracellular LDs (Hammersen, F. (1985) Histology: Color Atlas of Microscopic Anatomy, 2nd
Ed., Urban & Schwartzenberg, Baltimore). Stored CEs in these tissues provide a source for
membrane synthesis.
Before LDs can form, the neutral core lipids have to be gathered. In a first step FFAs have to
be released from their extracellular transporters, the lipoproteins. Lipoprotein lipase (LPL),
which acts on the surface of capillary endothelial cells, selectively cleaves off FFAs from
bound TG-rich lipoprotein particles. Then the FFAs enter the cells via passive diffusion
accelerated by e. g. fatty acid translocase (Ehehalt et al., 2006). Additionally, FFAs can also
be synthesized in cells from carbohydrates. Subsequently, FFAs conjugate with Coenzyme A
(CoA) to form fatty acyl-CoA. Those fatty acyl CoA molecules are then converted to
diacylglycerides by glycerol-3-phosphate acyltransferase and sn-1-acylglycerol-3-phosphate
acyltransferase in the ER. There, TGs are produced by diacylglycerol acyltransferases of the
DGAT enzyme family (reviewed in Guo, et al., 2009). Sterols in contrast to TGs are
transported into the cells via endocytosis and lysosomal degradation of lipoproteins. Like
TGs, sterols can also be synthesized de novo in most cells (Guo et al., 2009).
Many different models exist concerning the actual formation of LDs. However, the actual LD
biogenesis starts at the ER. The most accepted model suggests that neutral lipids
accumulate between the membrane bilayer of the ER and form a “lens” that buds off
eventually (Fig. 5, left panel, reviewed in Martin, et al., 2006). Another model, the so-called
bicelle-model (Ploegh, 2007), claims that the neutral lipids between the ER membrane
leaflets are excised from the membrane bilayer (Fig. 5, middle panel). The evolving LD

9
consists of cytosolic and luminal membrane parts of the ER phospholipid bilayer. A third
model, the vesicular budding model, (Walther and Farese, 2008) starts with small bilayer
vesicles that are bound to the ER membrane. Newly synthesized neutral lipids get pumped
into the phospholipid bilayer of the vesicle filling up the space between the leaflets.
Subsequently, the vesicle gets engulfed and forms an inclusion in the growing LD (Fig. 5,
right panel).
LDs are complex and dynamic intracellular organelles. They communicate with other cellular
organelles which is called heterotypic interaction. Those organelles that are involved in lipid
metabolism were found to be in close apposition to LDs, like mitochondria (Sturmey, et al.,
2006), ER (Turró, et al., 2006), and endosomes (Liu, et al., 2007). Furthermore, LDs can
adapt to metabolic changes. In case of starvation, neutral lipids can be degraded by lipolysis
and the FFAs processed by β-oxidation serve as energy source for the production of
adenosine tri-phosphate (ATP). In contrast, if neutral lipids like TGs are in excess, additional
storage space is required. As a result LDs have to grow. This issue has brought up some
models that try to explain size increase of LDs.
In the first model it was shown by the authors of one study that an enzyme involved in long
chain fatty acid synthesis, long-chain acyl-conenzyme A synthetase 3 (ACSL3), was
abundantly associated with LDs in human hepatic carcinoma cell line (HuH7) (Fujimoto, et
al., 2004). In the following study by this group this particular enzyme, ACSL3 was shown to
contribute to local lipid synthesis at LDs by converting FFAs into free fatty acyl-CoA
(Fujimoto, et al., 2007).
When the neutral core increases, the phospholipid monolayer has to grow too. This was
shown to be accomplished by the enzyme CTP:phosphocholine cytidylyltransferase (CCT)
which was recruited to the LD surface in studies with Drosophila melanogaster (Guo, et al.,
2008). Another model claims LD growth to be independent from TG biosynthesis by LD
fusion. In this process LDs move along microtubules by means of the motor protein dynein
(Boström, et al., 2005). Thereby the problem of utilizing or synthesizing additional
phospholipids would not be required. In more detail, the fusion is dependent on a protein
family called Soluble NSF Attachment Protein receptor (SNARE), responsible for vesicle
fusion. Members of this family were found attached to LDs and knock out of certain SNAREs
resulted in impaired droplet fusion (Boström, et al., 2007).
A variety of other proteins cover the LD surface permanently or temporally. They are either
embedded in the membrane or attached to the monolayer by electrostatic or hydrophobic
interactions. All of them contribute to the function of LDs. About 15% of them are members of
the PAT protein family (Londos, et al., 1999) or lipid enzymes involved in lipid metabolism
(Brasaemle, et al., 2004). In further studies in adipocytes it was shown that proteins from the

10
PAT family seem to be associated with LDs from the small emerging droplets at the ER until
the mature LDs situated in the perinuclear area (Wolins et al., 2005).
Figure 5. The process of LD evolvement is depicted in this figure. Three different models
were suggested. They are explained in detail in the text. The figure was taken from Guo et
al., 2009.
1.4 PERILIPINS
PAT is the hypernym of a protein family also known as perilipins (PLINs). The name PAT
stands for Perilipin (PLIN1), Adipose differentiation related protein (ADRP, ADFP,
adipophilin, PLIN2), and Tail interacting protein47 (TIP47, PLIN3). This protein family was
extended with two more recently found members called S3-12 (PLIN4), and OXPAT (LSDP5,
PLIN5). For clarity throughout this thesis I will stick to the PLIN nomenclature as described
above.
Despite the fact that it is not much known about PLIN proteins in the model organism
chicken, the 5 members can be found in mammals as well as in evolutionary distant
organisms like insects, slime molds, and fungi (Bickel, et al., 2009). All PLINs show distinct
sequence similarities. An approximately 100 amino acid long stretch at the N-terminus,
named PAT-domain, exists in all PLINs (except PLIN4) (Fig. 6). Additionally, an 11-mer
region C-terminal to the PAT-domain was found in all mammalian PLINs. The similarity of
PAT proteins in the 11-mer stretch does not concern the primary protein structure, indeed it
was predicted that the secondary and tertiary structures do (reviewed in Bickel, et al., 2009).

11
Concerning the whole amino acid sequence, PLIN2 and PLIN3 share the highest sequence
identity (43%). All PLINs have in common to be LD binding proteins, although a common
binding domain for all PLINs has not been found to date. The 11-mer repeat was proposed to
be a major factor for binding as it folds into α-helices with hydrophobic clefts being able to
bind lipids in the cytosolic environment (reviewed in Bickel, et al., 2009). The PLIN proteins
differ in tissue distribution, state of LD-binding, affinity to LDs, abundance when bound to
LDs or in cytoplasm, and stability. One important feature that was suggested for all PLINs
when bound to the LD membrane was to control access to the LD surface for other proteins
(Wolins et al., 2003).
Figure 6. The figure shows sequence comparisons between PAT proteins. The first seven
proteins are members of the mammalian PLINs. The last three (LSD-1, LSD-2, and MLP1)
perform orthologous functions in flies and fungi. At the N-terminus all PAT proteins (except
S3-12) show a high sequence similarity of about 100 amino acids, called PAT-domain.
Additionally, the 11-mer repeats can be found in all mammalian PATs. The figure was taken
from Bickel, et al., 2009.
1.4.1 PLIN1
In mice and humans PLIN1 is the most abundant PAT protein on adipocyte LDs of white and
brown adipose tissue. Additionally, PLIN1 can be found at lower levels in steroidogenic cells.

12
The PLIN1 mRNA is spliced alternatively and gives rise to three isoforms. The PLIN1-A
isoform is the most prominent one, found in adipocytes. PLIN1-B also exists in adipocytes
but to a minor abundance. The third isoform, PLIN1-C is the least abundant and exists
predominantly in steroidogenic cells (Servetnick et al., 1995). The vast majority of studies on
PLIN1 focus on the isoform A. The PLIN1-A isoform has a size of approximately 60kDa in its
non-modified state (Greenberg, et al., 1993).
As already mentioned, PLIN1 inhabits a PAT domain and an 11-mer repeat, both at the N-
terminal part of the sequence (Fig. 6). A distinct feature of PLIN1 has been found in
mutagenesis studies. Three hydrophobic sequence stretches in the central region of the
PLIN1 amino acid sequence are required for LD targeting and the insertion of the emerging
protein into the LD membrane (Subramanian, et al., 2004, Garcia, et al., 2003). PLIN1 is a
constitutive LD-bound PAT protein also called CPAT (Bickel et al., 2009). It has a half-life of
over 40h if associated with LDs (Brasaemle, 1997). It was found out that if PLIN1 detaches
from the LD surface it gets quickly degraded by the proteasomal pathway (Xu, et al., 2006).
A second feature distinct to all other PAT family members is the presence of 6 (mouse)
protein kinase A (PKA) phosphorylation sites of serine residues. This kinase is cyclic
adenosine monophosphate (cAMP) dependent (reviewed in Bickel, et al., 2009).
The PLIN1 protein functions and its activation of lipolysis in mammals are regulated as
follows:
Under basal conditions (at non-lipolytic state) the LD bound PLIN1 hinders lipolytic enzymes
to attach to the LD and thereby protects LDs from increased lipolysis. Additionally PLIN1
interacts with a protein called comparative gene identification 58 (CGI-58) that is recruited to
LDs (Yamaguchi, et al., 2004). CGI-58, an α/β-hydrolase, in unbound state facilitates
hydrolysis of cellular TG content (Brown, et al., 2007). A study by Martinez-Botas supports
that assumption as follows. PLIN1 -/- mice can consume more food compared to normal
mice and still keep the same body weight. They are leaner and more muscular. Activity of an
enzyme responsible for hydrolysis of stored neutral lipids, hormone sensitive lipase (HSL),
was found to be highly increased compared to wild type mice. The adipocytes in white
adipose tissue are about 62% smaller in size than in control organisms (Martinez-Botas et
al., 2000).
PLIN1 gene expression is controlled by peroxisome proliferator-activated receptor gamma
(PPARγ) in adipocytes, which is induced hormonally by catecholamines like dopamine and
norepinephrine (Fig. 7) (Arimura et al., 2004). The activation of this receptor has a strong
effect on cAMP levels as signaling through G-proteins activates adenylyl cyclase. The
cyclase then increases cAMP levels. The increased cAMP levels in turn activate cAMP
dependent protein kinase A (PKA). The kinase poly-phosphorylates PLIN1 and HSL. PLIN1

13
detaches from the LD and HSL is thereby able to encounter the LD membrane (reviewed in
Bickel, et al., 2009).
In the lipolytic status, when PLIN1 is phosphorylated, CGI-58 dissociates from PLIN1 and
facilitates the LD binding of a second lipase called adipocyte triglyceride lipase (ATGL).
ATGL mediates the first step of lipolysis from TGs to diglycerides (DGs). HSL cleaves off the
second fatty acid to form monoacylglyceride. The final step performs a soluble
monoglyceride lipase. Under basal conditions, ATGL and HSL are not able to encounter the
LD properly and thereby no increased lipolysis occurs (reviewed in Bickel, et al., 2009).
A second receptor which activates PLIN1 expression was found to be the estrogen receptor-
related receptor alpha (ERRα). The PPARγ coactivator-1 alpha (PGC-1 α) itself activates
ERRα (Akter et al., 2008).
Major properties of PLIN1 are summarized in table 1.
Figure 7. A model of the regulation of PLIN1 activity. Hormones like catecholamine activate
β-adrenergic receptors and thereby increase cAMP levels. Then PKA is activated and
phosphorylates PLIN1 which subsequently leads to the access of lipases like HSL and ATGL
to the LD. The figure was taken from Bickel et al., 2009.
1.4.2 PLIN2
PLIN2 is a LD associated protein, which was first discovered by its high mRNA expression
during adipocyte differentiation in the mouse (Jiang, et al., 1992). The sequence similarity to

14
the previously discovered PLIN1 led to further investigations and showed that PLIN2 coats
small nascent LDs in various cell types (Brasaemle, et al., 1997). The human PLIN2 protein
has a size of 50kDa and is constitutively bound to LDs (CPAT). PLIN2 proteins not
associated with LDs get degraded by the ubiquitin/proteasome pathway (Xu, et al., 2005). A
further modification of PLIN2 by phosphorylation may be possible as human phosphorylated
PLIN2 (Serine 291) was detected via mass-spectrometry in HeLa cells (Bartz, et al., 2007).
To date, no kinase has been discovered to phosphorylate PLIN2. A study by Nakamura and
Fujimoto tried to find the LD-targeting domain of PLIN2. Many mutant fusion constructs of
PLIN2 and enhanced green fluorescent protein (EGFP) with various truncations at the C- or
the N-terminus were analyzed. Thereby it turned out that two non-overlapping sequences at
both termini (aa 1–181 at the N-terminus, and aa 277–426 at the C-terminus) were sufficient
for LD binding in mouse NIH3T3 fibroblasts. Additionally it was shown that both protein parts,
fused to EGFP, were able to induce LD de-novo formation in rat PtK2 cells which have
scarce endogenous LDs (Nakamura and Fujimoto, 2003).
PLIN2 expression is regulated by receptors of the PPAR-family. For example, PPAR-α
activates PLIN2 in hepatocytes (Edvardsson, et al., 2006) and PPAR-β/δ in keratinocytes
(Schmuth, et al., 2004). It was proven that PLIN2 expression, activated by PPARs, was
stimulated by long-chain fatty acids in adipocyte precursor cells (Gao, et al., 2000).
In PLIN1 adipocyte knock out cells, PLIN2 coats LDs. However it cannot compensate
functionally for PLIN1, as PLIN1 knock out leads to enhanced basal lipolysis (mentioned
already in PLIN1 part). PLIN2 is abundantly expressed in almost all tissues except mature
adipocytes, whereas PLIN1 seems to outcompete PLIN2 concerning LD binding. In non-
adipocytes PLIN2 levels correspond with intracellular neutral lipids. Additionally, it was
shown that LD formation increases concurrent with PLIN2 protein levels as new LD surface
originates (reviewed in Bickel, et al., 2009).
PLIN2 was also found in in-vivo studies in mice to be involved in promotion of
atherosclerosis. PLIN2 facilitated foam cell formation of macrophages induced by modified
lipoproteins. Apolipoprotein E (apoE) knockout mice (apoE-/-) have a high susceptibility to
develop severe atherosclerosis (Paul, et Al., 2008). Deficiency of PLIN2 expression in the
apoE-/- background reduced the number of LDs in foam cells. An association between
reduced numbers of atherosclerotic lesions and PLIN2 deficiency, and subsequent protection
of these mice from atherosclerosis was additionally claimed by the authors (Paul, et Al.,
2008).

15
A recent study by Chang et al., 2010, observed the changes in lipid metabolism on mRNA,
protein, and lipid substrate levels between PLIN2-deficient obese mice and obese mice with
intact PLIN2 expression. To accomplish this study, an obese mouse model of type-2
diabetes and non-alcoholic fatty liver disease (NAFLD) was used. Obesity was induced by
gene knock out of the leptin gene (Lepob/ob), which causes the loss of feeling of satiety and
thereby hyperphagia. Normally, leptin acts as a protein hormone secreted from the adipose
tissue that regulates energy intake, energy expenditure, and appetite (reviewed in Chang et
al., 2010).
PLIN2 deficient obese mice (Lepob/ob / PLIN2-/-) compared to control mice (Lepob/ob / PLIN2+/+)
showed decreased plasma glucose levels after 4h fasting even though obesity was not
ameliorated. Hepatocytes of Lepob/ob / PLIN2+/+ mice showed a high amount of LDs filling up
the whole cytoplasm, whereas in 50% of Lepob/ob / PLIN2-/- hepatocytes, LDs were bigger in
size but more scarce in their number compared to control mice. The rest contained even
fewer and smaller LDs. Total TG content in the liver was found to be approximately 25%
reduced in PLIN2 deficient mice compared to control mice (Chang, et al., 2010).
Furthermore it was shown that PLIN2 is also involved in the regulation of very-low density
lipoprotein (VLDL) secretion from hepatocytes. VLDL functions as the transporter of TGs and
CEs in the blood. In Lepob/ob / PLIN2-/- mice, VLDL-mediated TG secretion was significantly
increased. Additionally, the expression of microsomal triglyceride transfer protein (MTTP),
responsible for VLDL assembly and secretion, was strikingly increased (Chang, et al., 2010).
Additionally, a study by Chang, et al., 2006 showed that PLIN2 deficient mice had a markedly
reduced TG mass in their livers by 60% and also increased MTTP protein levels.
Similar results were found in a rat hepatoma cell line as PLIN2 overexpression increased TG
accumulation and likewise decreased VLDL secretion (Magnusson, et al., 2006). Moreover,
knockdown of PLIN2 by short interfering RNAs (siRNAs) reduced the storage of neutral lipids
in LDs by 1/3, increased apolipoprotein B-48 (apoB)-48 expression 3.1-fold and induced β-
oxidation (Magnusson, et al., 2006).
The findings of all those studies showed that PLIN2 has a strong ability to retain lipolysis. It
promotes neutral lipid storage, LD formation, and regulation of LD size.
Major properties of PLIN2 are summarized in table 1.

16
1.4.3 PLIN3
PLIN3 is the third member of the PAT protein family. The protein gained its original name,
TIP47, as it was found to bind to a phenyalanine/tryptophane motif in the “tail” of cytoplasmic
cation-dependent mannose 6-phosphate receptor (MPR). TIP47 mediates the recycling of
MPR from endosomal compartments to the trans-Golgi network (Díaz, et al., 1998). It is a
47kDa polypeptide whose relation to the PAT protein family was discovered due to its
sequence similarities at its N-terminus, the PAT domain. Like PLIN1 and PLIN2, PLIN3 also
contains an 11-mer repeat at its N-terminus.
PLIN3, like PLIN2 is expressed in almost all tissues and shares a high sequence similarity
with it. Unlike PLIN2, PLIN3 is stable in the cytosol (about 6h) and is not rapidly degraded
(Wolins, et al., 2001). The ability to bind LDs was first discovered in microscopy experiments
in HeLa cells (immortalized human cervical cancer cell line). Addition of oleic acid to the cell
culture medium strongly increased the LD association of PLIN3. In mouse MA10 Leydig cell
homogenates, PLIN3 was mainly represented in the cytosolic fraction under lipid poor
conditions. After lipid loading, PLIN3 was clearly redistributed from the cytosolic fraction to
the lipid fraction (Wolins, et al., 2001). However, other studies could not confirm PLIN3 to be
a lipid droplet associated protein (Barbero et al., 2001). More studies have to be done on
PLIN3 to accurately tell its involvement in lipid metabolism.
The elucidation of the PLIN3 crystal structure revealed a four-helix bundle domain and an α/β
domain with a hydrophobic cleft between them. The hydrophobic cleft was assumed to form
a binding pocket (Hickenbottom, et al., 2004). Additionally it was discovered that apoE
harbors a very similar four-helix bundle motif. The C-terminal part of apoE was predicted to
create the driving force for protein:lipid binding (Saito, et al., 2001). The four helices of apoE
were shown to bundle together in solution providing stability. As apoE is important in TG
catabolism and therefore interacts with lipids, the same properties were assumed for PLIN3.
Furthermore in a different study this hydrophobic cleft was predicted to be of great
importance for recruitment of PLIN3 to the LDs (Ohsaki, et al., 2006).
A PLIN3 study showed that it can compensate for PLIN2 in mouse embryonic fibroblasts
(MEFs) when PLIN2 is knocked out (Sztalryd, et al., 2006). After oleic acid administration,
LDs formation was unaffected, and no differences were observed by means of lipid storage
and lipolysis. Furthermore, PLIN3 mRNA knockdown with specific short interfering RNAs
(siRNAs) resulted in decreased LD formation compared to the control group. Instead of TGs,
phospholipids were the predominant stored neutral lipid species. Thereby they showed that
the exchangeable LD binding protein (EPAT) PLIN3 is able to maintain normal LD formation
and lipolysis in non-adipocytes.

17
Major properties of PLIN3 are summarized in table 1.
1.4.4 PLIN4
PLIN4 is a PAT protein which has been discovered much more recently than the first three
ones. It was discovered in an antibody based screen for cell surface associated proteins
involved in 3T3-L1 adipocyte differentiation (Scherer, et al., 1998). The PLIN4 gene
expression is like PLIN1, and PLIN2 regulated by the hormonally stimulated PPARγ receptor
(Dalen, et al., 2004). It is the only PAT protein that inhabits no PAT domain. Nevertheless at
the N-terminus of the 160kDa protein an extended 11-mer repeat has been detected which
engages almost two thirds of the whole protein (Bussel et al., 2003).
PLIN4 was found to be involved mostly in fat storage activities. PLIN4 is predominantly
expressed in white adipose tissue and to a lesser extent in skeletal muscle (Wolins, et al.,
2003).
Furthermore it was shown that PLIN4 is stable in the cytosol under low lipid abundance and
is therefore termed as EPAT, a not permanently LD-bound protein. After lipid loading, PLIN4
moves to the surface of LDs (Wolins et al., 2003). Additionally it was proposed that PLIN4
associates with growing LDs and thereby participates in LD biogenesis. In this particular
study, the authors claim the finding that PLIN4 associates with small nascent LDs in the cell
periphery after oleate supplementation in 3T3-L1 adipocytes. In lipid poor medium no PLIN4-
coated LDs were detected. After lipid loading, next to the bigger perinuclear PLIN1-coated
LDs, a small PLIN4-coated subpopulation of LDs was discovered (Wolins et al., 2003).
However, more studies have to be done to elucidate all functions of PLIN4 and its relation to
lipid metabolism.
Major properties of PLIN4 are summarized in table 1.
1.4.5 PLIN5
PLIN5 is one of the most recently discovered PAT proteins. Like PLIN3 and PLIN4, this
protein is an EPAT, an exchangeable LD-binding protein. Its gene is situated on mouse
chromosome 17 and human chromosome 19, in close proximity to the PLIN4 gene (Dalen et
al., 2007). Although the PLIN5 gene is situated close to the PLIN4 gene, the proteins exhibit
completely contrary functions. The PLIN5 gene is transcriptionally regulated by a member of
the PPAR receptor family, PPARα (Wolins, et al., 2006). PLIN5 is mainly expressed in heart,
liver, brown adipose tissue, and skeletal muscle. Expression in those kinds of tissues points

18
out a specific function towards regulating the mobilization of energy depots, most likely in
form of fat oxidation. PLIN5 mRNA translation gives rise to a protein of a size of
approximately 54 kDa (Dalen, et al., 2007).
In microscopy studies a fusion construct with PLIN5 and a fluorescent tag was transfected
into CHO-K1 cells. Under basal conditions (w/o oleate administration) the construct was
visible throughout the cell. After the addition of oleate, LDs were formed and PLIN5 proteins
were visible around those droplets. In human tissues it was shown that PLIN5 expression
was induced after 12h of fasting conditions, especially in the liver (Dalen et al 2007).
Concerning the liver, it was shown that PLIN5 expression was PPARα dependent, whereas
under fasting conditions PPARα was not necessary for expression. Finally the investigations
showed that PLIN5 exhibited protective functions against lipolysis under basal conditions
compared to control cells (not expressing PLIN5) (Dalen et al., 2007).
A different study using Chinese hamster ovary cells (CHO) showed that PLIN5 is directly
interacting with ATGL and thereby reducing lipolysis (Wang, et al., 2011). Mouse ATGL was
tagged with a fluorescent protein and transfected into the cells. Interestingly, no direct
interaction between PLIN1 and ATGL was found due to lacking presence of the co-factor
CGI-58. No lipolysis by ATGL was observed in those cells when PLIN5 coated the LDs
compared to control cells (no PLIN5). PLIN5 is thought to be of great importance concerning
LD protection (anti-lipolytic) (Wang, et al., 2011).
Major properties of PLIN5 are summarized in table 1.
PAT
protein
Regulated by
phosphorylation
Promotes
lipid
storage
Recruits
lipases or
co-
lipases
Role in
intracellular
trafficking
EPAT
versus
CPAT
PAT
domains
PLIN1 Yes (PKA) Yes Yes Yes
(droplets)
CPAT Yes
PLIN2 Unknown Yes Unknown Yes
(droplets)
CPAT Yes
PLIN3 Unknown Yes Unknown Yes
(droplets)
EPAT Yes
PLIN4 Unknown Unknown Unknown Unknown EPAT No
PLIN5 Unknown Yes Yes Unknown EPAT Yes
Table 1. Features of the 5 members of the PAT protein family in mammals. Table adapted
from Bickel et al., 2009.

19
1.5 Lipases
The second aim of my master thesis was to identify enzymes, which could be responsible for
the mobilization of the large TG depots in the YS. This process is called lipolysis and
requires the action of lipid hydrolases, also called lipases. A necessary prerequisite for these
enzymes is the affinity for TG substrates. TGs are the starting point for lipid degradation, as
TGs (and CEs) are the predominant stored form of neutral lipids.
1.5.1 ATGL (Adipose triglyceride lipase)
This protein belongs to the Patatin like phospholipase (PNPLA) family. This investigated
enzyme was named PNPLA2, ATGL, or desnutrin. It was first discovered in 2004, able to
hydrolyze TGs to DGs and FFA but showed no affinity to other lipid substrates like CEs
(Villena, et al., 2004). Hence, the enzyme was named adipose triglyceride lipase. The protein
was shown to be most abundant during adipocyte differentiation. ATGL, like other members
of this lipase family, contains a conserved patatin-like domain, common for plant acyl-
hydrolases (Zimmermann, et al., 2004).
An interesting feature of ATGL is the response to feeding levels by increased/decreased
mRNA expression. After fasting, ATGL expression was found to be highly increased.
Additionally the mRNA expression is induced by glucocorticoids (Villena, et al., 2004). Insulin
had the opposite effect as it decreased ATGL levels (Kershaw, et al., 2005).
A different study showed that beside adipose tissue, ATGL was found to be expressed in
monkey kidney derived fibroblast cell lines (COS-7), and human cervical cancer cell lines
(HeLa). In HeLa and Cos-7 cells, ATGL was found to localize to the LD surface after loading
of oleic acid. Additionally it was discovered that ATGL is a main regulator of LD turnover
(Smirnova, et al., 2006). Overexpression of ATGL resulted in a drastic decrease in LD size
(1/50 compared to controls). Importantly, a mutation in the core of the catalytic domain of
ATGL eradicated the LD-shrinkage phenotype. Thereby it was confirmed that ATGL is
responsible for hydrolysis of TG depots stored in LDs (Smirnova, et al., 2006). ATGL has a
co-factor that is important for its enzymatic function named CGI-58. In mouse studies the
interaction between ATGL and CGI-58 showed a 20-fold increase in ATGL activity compared
to the non-activated status. Furthermore, when CGI-58-gene carries point-mutations, the
CGI-58 protein fails to activate ATGL. Mutant CGI-58 was found to be involved in Chanarin-
Dorfman Syndrome (CDS), a disease caused by FFA-accumulation in the cytosol of many
different tissues (Lass, et al., 2006).

20
1.5.2 PNPLA3 (Patatin-like phospholipase domain-containing protein)
A second member of the phospholipase family is PNPLA3, or adiponutrin. It was first found
as a transmembrane protein whose mRNA was highly expressed during adipocyte
differentiation (Baulande, et al., 2001). The PNPLA protein family descends from the patatin
protein in potato tubers. Like mentioned for ATGL, PNPLA3 also inhabits a conserved N-
terminal patatin-like domain which is mainly responsible for TG hydrolysis. Its catalytic center
inhabits a serine-aspartate dyad (Rydel, et al., 2003; Jenkins, et al., 2004). In the study by
Baulande, et al., 3 trans-membrane spans at the N-terminus were predicted by means of
multiple sequence alignments (Baulande, et al., 2001).
A general model for PNPLA3 function was proposed by Pirazzi et al. FFAs are taken up into
cells and esterified to neutral lipids (TGs) in the ER wherefrom they are stored in newly
evolving LDs. PNPLA3 may encounter LDs to hydrolyze stored lipids and thereby produce
again FFAs. Those FFAs then are redirected back to the ER and the Golgi where they are
re-esterified into TGs. TGs then are transferred to apoB to assemble in nascent VLDL
particles which then consequently are secreted (Fig. 8) (Pirazzi, et al., 2012).
Other important findings about PNPLA3 show a regulation of expression by feeding. A study
with human cells (Huh-7) revealed that PNPLA3 expression is activated by the transcription
factor sterol regulatory-element binding protein 1c (SREBP-1c). Additionally, SREBP-1c
stimulated the transcription of genes involved in fatty acid biosynthesis. The accumulation of
fatty acids increased the half-life of PNPLA3 in the cytosol and thereby promoted its stability
(Huang, et al., 2010).
In the study by Kershaw, et al., which showed that ATGL expression levels were increased
following starvation and decreased by re-feeding, PNPLA3 showed a complete opposite
expression pattern. PNPLA3 mRNA was drastically decreased by starvation and showed
elevated expression levels following re-feeding. Additionally, PNPLA3 showed an induction
of gene expression by insulin, which again works the complete opposite to compared to
ATGL (Kershaw, et al., 2005).

21
Figure 8. Proposed mode of action of PNPLA3. The figure was taken from Pirazzi, et al.,
2012.
1.5.3 LAL (Lysosomal acid lipase)
Lysosomal acid lipase is an enzyme that is situated in intracellular compartments called
lysosomes. It functions as a TG and CE lipase by breaking down CEs and TGs (Du, et al.,
2008). LAL tissue distribution was tested in mice where it was shown to be expressed in
almost all tissues. Highest expression levels were found in liver, adrenal gland, kidney,
pancreas, and in the small intestine (Du, et al., 1996).
The exogenous neutral lipids are delivered into the cell and to the lysosomes via LDL. LDL
binds to the cell-surface LDL receptor and enters the cell via endocytosis. Within the
endosome, the lipid-laden LDL is transported to the lysosome where LDL and its lipid cargo
get degraded. The released cholesterol is then further used in cellular membranes where it is
re-esterified to CE by acyl-CoA:cholesterol acyltransferase. By the release of new cholesterol
from previously hydrolyzed LDL particles within lysosomes, cell-own production of
cholesterol is retained. When the LAL gene is mutated the lipid-laden LDL cannot be
degraded (reviewed in Goldstein, et al., 1975).
In humans, mutations in the LAL gene were found to be responsible for at least two different
phenotypes: The more severe form manifests in the Wolman disease (WD). WD has an
early-onset phenotype which is normally lethal within the first few years of life. Affected
patients suffer from massive storage of CEs and TGs in liver and small intestine. The less
severe phenotype is called cholesterol ester storage disease (CESD). A strong increase in
CE deposits in the intestines and hepatomegaly are the main phenotypic manifestations.
PNPLA3

22
CESD affected people survive longer due to a residual activity of LAL (Aslanidis, et al.,
1996). In a human LAL study it was discovered that one specific splice junction mutation at
Exon 8 causes the CESD outcome and not WD. All other mutations detected could be found
in both diseases (Anderson, et al., 1999). In a study by Goldstein, et al., 1975, in human
fibroblasts from CESD patients it was shown that mainly the non-hydrolyzed exogenously
derived neutral lipids in LDL were accumulated in the cytoplasm. Lipolysis of endogenously
derived/produced lipids was not affected.
The severity of the WD and CESD was shown by Du, et al., 2001, where LAL knockout in
mice caused TG and CE accumulation in spleen, liver and small intestine and subsequent
swelling of liver and spleen (hepatosplenomegaly). Furthermore, the lack of hydrolysis of
exogenously derived lipids caused a depletion of white adipose tissue (WAT) and brown
adipose tissue (BAT) (Du, et al., 2001).
1.5.4 HTGL (Hepatic triglyceride lipase)
Hepatic triglyceride lipase is a TG lipase expressed mainly in the liver and is a member of the
same superfamily of lipases like lipoprotein lipase (LPL) (Hide, et al., 1992). Unlike in mice,
the synthesized protein in humans is bound to the hepatic endothelium after secretion. The
human protein has a size of 64 to 69 kDa, which differs due to its glycosylation state (Datta,
et al., 1988). The protein inhabits highly hydrophobic sequences for lipid and heparin binding
at the C-terminus. The catalytic site resides at the N-terminus and is covered by a “lid”
domain that is responsible for correct substrate binding. In the case of HTGL a higher affinity
to phospholipids than to TGs was discovered (Dugi, et al., 1995). HTGL hydrolyses TGs in
chylomicron (CM) remnants, intermediate density lipoprotein (IDL), and high density
lipoprotein (HDL). It additionally hydrolyses phospholipids in HDL (reviewed in Santamarina-
Fojo and Haudenschild, 2000).
1.5.5 LPL (Lipoprotein lipase)
LPL belongs to the same lipase superfamily as HTGL (Hide, et al., 1992). It is a TG lipase
expressed in parenchymal cells of adipose tissue and muscle. The site of action of the
membrane-bound glycosylated lipase is the vascular endothelium. The protein has a size of
55kDa and needs to dimerize for appropriate action. Folding into active homo-dimers is
triggered by calcium (Zhang, et al., 2005). Activation of LPL requires an apolipoprotein,
apoC-II (Kinnunen, et al., 1977). Like in HTGL the catalytic domain resides at the N-terminus

23
and the LD binding domain at the C-terminus. The “lid”-domain again covers the catalytic
domain and ensures appropriate susbstrate binding (Dugi, et al., 1995).
In chicken studies it was shown that LPL is the rate-limiting enzyme in lipoprotein metabolism
in adipose tissue. The enzyme hydrolyses TGs in lipoproteins like CMs and VLDL as
absence of LPL caused triglyceridemia and reduced fat storage. Infusion of anti-LPL
antibodies in broiler chicken resulted in a great reduction of abdominal fat storage (reviewed
in Bensadoun, 1991; Sato, et al., 1999).
24
2. Materials and methods
2.1 Chemicals and Enzymes
Chemicals for buffers, solutions and media were used from Calbiochem, PeqLab, Roth,
Sigma-Aldrich, Gibco, Applichem, Merck, USB, VWR-Prolabo, FLuka, Thermo Scientific,
Iwaki, Biorad, Difco, Qiagen, MRC, and Promega.
Polymerases: High Fidelity PCR Enzyme Mix (5units/µl) by Fermentas;
Super Script II Reverse Transcriptase by Invitrogen;
T4 DNA Ligase (5units/µl) by Fermentas;
Restriction enzymes: EcoRI (10units/µl) by Fermentas.
2.2 Bacterial strains and vector systems
For the transformation of cloning vector with insert, following bacterial strain were used:
Strain One Shot TOP10 Chemically Competent E. coli
Genotype F-mcrAD(mrr-hsdRMSmcrBC)f80lacZDM15DlacX74DeoRrecA1 araD139D(araleu)7697galUgalKrpsL(StrR)endA1nupG
Reference/ Source
Invitrogen
Table 2. Bacterial strain used for transformations.

25
For the amplification of inserts, following cloning vector was used:
Table 3. Genotype of pCR 2.1-TOPO cloning vector
Figure 9. Genetic map of pCR 2.1-TOPO cloning vector
Vector
pCR®2.1-TOPO®
Size 3,931 basepairs Genotype LacZα fragment, M13 reverse priming site,
MCS, T7 promoter/priming site, M13 forward priming site, f1 origin, kanamycin resistance, ampicillin resistance, pUC origin
Reference/Source Invitrogen, TA cloning kit

26
2.3 Oligonucleotide primers
Name Sequence
PLIN1q-FWD 5’-GAGCCCCAGTTCTCAATGGC-3’
PLIN1q-REV 5’-GTCTCCACGGTGCTCTTGGT-3’
PLIN2q-FWD 5’-CCCACTGACAAGGTTGTTGCC-3’
PLIN2q-REV 5’-GCACCACACGACTTCCCAAG-3’
PLIN3q-FWD 5’-AGGCCCTTGGACAGCTTCAC-3’
PLIN3q-REV 5’-CAGGGACTCCATCTCCTCTGG-3’
PNPLA3q-FWD 5’-TGGCCAAAGAAGCTAGAAAGCG-3’
PNPLA3q-REV 5’-AAGCCTAGGAGGTAGACTCTC-3’
ATGLq-FWD 5’-AGCATCCAATTCAACCTTCG-3’
ATGLq-REV 5’-GAGAGGACCAGCAGGAC-3’
LALq-FWD 5’-AGCCCTCTGACAAAGCTGGG-3’
LALq-REV 5’-ACACGTCCACACGGCTCATA-3’
HTGLq-FWD 5’-GTGATCATTGCAGATTGGCTTAC-3’
HTGLq-REV 5’-TTTGTACCGCTGATGTAACTACC-3’
LPLq-FWD 5’-CCATGGGTGGACGGTGACAG-3’
LPLq-REV 5’-GCAGCATGAGCACCCAGACT-3’
Table 4. Specific primers used for qPCR analysis
2.4 Animals
Mature Derco brown (TETRA-SL) laying hens were purchased from Diglas Co.
(Feuersbrunn, Austria). Animals were kept cage free with free access to food and water.
Light was provided for 14h per day. Fertilized eggs were provided by in-house chickens or
from Schropper GmbH, Schottwien, Austria. Eggs were sampled at embryonic day 0 and
further incubated at 37°C for normal embryonic development. Chicken YSs were obtained
from eggs 5days (d) post fertilisation.
2.5 Dissection of chicken yolk sac layers
First the egg was opened carefully with a scalpel. Then the whole egg-content was poured
into a big petri dish. To start with the separation the embryo was cut off the YS and the yolk.

27
An important step was to completely remove the adhering yolk form the YS tissue. In the
following step, the whole YS was transferred to a new petri dish filled with 1xPBS for
washing. This step was repeated once. Now the different layers of the YS could be carefully
separated. In the 5d embryo there was still a clear distinction between the vascularized (area
vasculosa) and the non-vascularized tissue (area vitellina) of the YS. The white area vitellina
at the periphery of the YS could be easily cut off from the vascularized layer with a scalpel.
The vascularized tissue could be further separated into the blood vessel-containing layer
(mesoderm and ectoderm) and the area beneath, the EECs from the area vasculosa. Finally,
the different separated tissues could be weighed and aliquoted for further usage for RNA or
protein-extractions.
2.6 Molecular biological methods: RNA
2.6.1 Total RNA extraction from chicken yolk sac tissue
Total RNA was isolated from tissue samples using TRIZOL reagent from MRC.
Approximately 100mg of frozen tissue was weighed out into sterile microfuge tubes and
placed on ice. 1ml of TRIZOL reagent was immediately added and vortexed shortly. The
tissue in TRIZOL was transferred to a Potter homogenizer and homogenized, followed by 5
min incubation on ice. 0.2ml chloroform was added and the tube shaken vigorously for 15
sec. The tube was incubated on ice for 3 min, followed by a 15 min centrifugation step at 4°C
at 12000xg. The aqueous phase containing the RNAs was taken off and transferred to a new
tube. The RNA-phase was mixed with 0.5ml isopropanol and incubated at RT for 10 min. The
sample was centrifuged at 12000xg for 10 min at 4°C. The supernatant was discarded and
the whitish pellet was washed with 1ml 75% ethanol by centrifugation at 7500xg for 5 min at
4°C. The supernatant was discarded and the pellet dried for ca. 10 min at RT. It was of
importance that the residual ethanol could evaporate but concurrently without drying the
pellet completely which would have a negative effect on RNA concentration. According to the
size of the pellet ddH2O was added and the pellet dissolved at 60°C on a shaker. The
dissolved RNA was frozen and stored at -80°C.

28
2.6.2 Reverse Transcription of isolated RNA
Reverse transcription of isolated RNA was performed with the Superscript II Reverse
Transcriptase kit by Invitrogen. The RNA concentration measurement was done with a
Nanodrop 2000c. Following components were mixed in a sterile microcentrifuge vial.
The mixture was incubated at 65°C for 5 min and then immediately chilled on ice.
The content of the tube was collected by brief centrifugation and following components were
added to each reaction:
After incubation of the reaction mixtures for 2 min at 42°C, 1µl (200units) of Super Script II
Reverse Transcriptase was added and the content mixed gently. The sample was incubated
for 50 min at 42 °C. To inactivate the reaction samples were heated at 70°C for 15 min.
Samples were centrifuged briefly and subsequently stored at -20°C or immediately used for
amplification.
2.7 Molecular Biological Methods: DNA
2.7.1 Reverse transcriptase polymerase chain reaction (RT-PCR)
Polymerase chain reaction was used to amplify DNA sequences from previously synthesized
cDNA. A thermocycler T3000 from Biometra was used. The total reaction volume of PCR
experiments was 50µl. The polymerase used is listed in 2.1.
Oligo(dt)12-18
(500µg/ml)
1µl
Total RNA 1µg of total RNA
dNTP Mix (10mM) 1µl
ddH2O up to 12µl
Total 12µl
5x First Strand
Buffer
4µl
0,1M DTT 2µl
Total 6µl

29
The following components were mixed in a nuclease-free microcentrifuge tube:
1µl cDNA
5µl 10x buffer (polymerase specific)
1µl forward primer (25pM/µl)
1µl reverse primer (25pM/µl)
1µl dNTP mix (10mM)
0.5µl polymerase
39.5µl ultrapure H2O
Following PCR settings were used for primer pairs further used in real-time quantitative PCR
(length up to 300bp; primer pairs are listed in table 4):
Procedure Settings
Initial denaturation 94°C for 5 min
Denaturation 94°C for 30 sec
Annealing 55°C for 30 sec
Elongation 72°C for 30 sec
Final elongation 72°C for 10 min
The obtained PCR products were analysed by agarose gel electrophoresis.
2.7.2 Agarose gel-electrophoresis
The separation of DNA fragments was performed at a constant voltage of 100V for 30 min.
Depending on the length of the fragment 1%, 1.5%, or 2% (w/v) agarose gels were used.
The DNA samples were mixed with 5x DNA loading dye which contained Bromophenol blue
or Xylene Cyanol FF used as front marker. Glycerol had a density increasing effect on the
sample to ensure evenly loading into the sample well. To determine the size of the separated
fragments the GeneRuler DNA ladder mix from Fermentas was used. To visualize the DNA
bands under ultraviolet light (366nm) the fluorescent DNA-intercalating dye ethidium bromide
was used.
50x TAE, pH 8.0
2 M Tris/HCl
1 M acetic acid
0.1 M EDTA
40x

30
5x DNA loading buffer
50 % Glycerol
0.1M EDTA, 50x TAE Bromophenol blue or Xylen Cyanol FF
Ethidium bromide stock solution
10 mg/ml in ddH2O
peqGOLD Universal Agarose by peqlab
Figure 10. DNA Gene Ruler taken from http://www.fermentas.com
2.7.3 Agarose gel extraction
The gel extraction kit was provided by QIAgen. This protocol was used to extract and purify
DNA of 70bp to 10kb from standard or low-melt agarose gels in TAE or TBE buffer. All
centrifugation steps were carried out in a tabletop centrifuge at the highest setting
(13.000rpm). The desired DNA-fragment was excised from the agarose-gel with a sterile
scalpel. 3 volumes of Buffer QG were added to the sample and incubated for 10 min at 50°C.
To dissolve the gel properly, every 2-3 min the sample was vortexed. One volume of
isopropanol was added and the sample transferred into a spin column (provided by
QIAGEN). A centrifugation step for 1 min followed. The flow through was discarded and an
additional centrifugation step was done with 0.5ml of buffer QG into the same collection tube.
To wash the sample, 0.75ml Washing Buffer PE was added and after 5 min incubation the
sample was centrifuged 1 min. The flow-through was discarded and another centrifugation
step for 1 min was performed to drive off residual buffer. The column was now put into a new

31
sterile microfuge tube and 30µl of ddH2O were added. After 1 min of incubation the purified
DNA was eluted by a 1 min centrifugation step.
2.7.4 DNA ligation
To ligate the desired DNA fragment and a vector, a pCR 2.1 vector with the Invitrogen TA
Cloning Kit was used. The DNA fragments were previously purified from an agarose gel like
mentioned in 2.7.3. The vector and the fragment were first cut with the appropriate restriction
enzyme. The ligation was carried out on ice and following components were mixed:
Gel-eluted PCR product 2µl
Ligation Buffer (10x) 1µl
pCR 2.1 vector 2µl
ddH2O 4µl
T4-DNA ligase 1µl
Total 10µl
The sample was mixed by vortexing and short centrifugation. The incubation step was
performed at 14°C overnight (O/N).
2.7.5 Production of chemical competent E. coli TOP10
Commercially bought TOP10 cells were inoculated in 5ml LB liquid medium and incubated
O/N at 37°C on a shaker. 1ml of that O/N culture was inoculated into 200ml LB medium and
shook at 37°C in 500ml flask to an OD of approximately 0,25 – 0,3. Then the culture was
chilled on ice for 15 min. The 200ml culture was distributed to 4 50ml falcon tubes and
centrifuged for 10 min at 3300xg at 4°C. The supernatant was discarded and the pellets
dissolved in 20ml 0.1M CaCl2 each. After 30 min incubation on ice the centrifugation (settings
as above) was repeated and the pellets resuspended in 12ml 0.1M CaCl2 solution + 15%
glycerol. The cells were distributed into fresh sterile eppendorf tubes and frozen in liquid
nitrogen. For long time storage they were transferred to a -80°C freezer.

32
2.7.6 Transformation of chemical competent E. coli
One aliquot (50µl) of chemical competent E. coli TOP10 cells were thawed on ice. Bacteria
and plasmids were shortly centrifuged and placed on ice. 2µl of the TOPO TA ligation
mixtures was added to one aliquot of competent cells. The cells in the vial were gently mixed
and placed on ice for 30 min. Then the cells were heat shocked for 30 sec at 42°C and
immediately returned on ice for 2 min. 250µl of room temperate (R/T) S.O.C. medium was
added to the cells and regenerated for 1h at 37°C by shaking. 200µl of transformed cells
were plated on LB-Amp (100µg/ml), LB-Kan (30µg/ml), or LB-Kan/X-Gal plates and
incubated O/N at 37°C. Generally white colonies were expected. In case of X-Gal plates,
white colonies indicated that the desired sequence was inserted into the X-Gal gene. The
insertion into the X-Gal gene prevented expression and subsequent cleavage-induced blue
staining. Liquid LB medium (with the suitable antibiotic) was inoculated with distinct white
colonies to amplify the plasmids. The liquid culture was incubated at 37°C O/N on a shaker.
To purify the plasmids from the bacterial culture a plasmid mini-preparation was performed.
2.7.7 Mini preparation of Plasmid DNA
Plasmid isolation was performed with the peqGOLD Plasmid Miniprep Kit I by PEQLAB. This
plasmid preparation kit uses an alkaline lysis to degrade bacterial compounds and works
completely without organic solvents. All centrifugation steps were performed in an Eppendorf
Centrifuge 5418.
1ml of E. coli O/N culture was transferred to a sterile tube and centrifuged for 1 min at
10000xg. The supernatant was discarded and the previous step repeated. The cell pellet was
dissolved in 250µl of solution I by vortexing. 250µl of solution II was added and mixed by
gentle inverting of the tube. 350µl of solution III were added and again mixed gently by
inverting the tube. The microfuge tube was centrifuged for 10 min at 10000xg. The liquid
phase was transferred to the provided spin column to bind the plasmids to the silica-
membrane without disturbing the white cell debris. The bound plasmids were washed with
500µl of PW plasmid buffer by 1 min centrifugation at 10000xg. 2 consecutive washing steps
with each 750µl of DNA-wash buffer and 1 min centrifugation at 10000xg followed. To get rid
of residual buffer and to dry the membrane, a 2 min centrifugation step at 10000xg was
done. To elute the plasmids from the membrane, 50µl of ddH2O were added, followed by a
centrifugation step at 5000xg for 1 min. The purified plasmids were stored at -20°C.

33
2.7.8 Midi preparation of Plasmid DNA
For plasmid midi preparation the Pure Yield Plasmid Midiprep System by Promega was
used. All centrifugation steps were performed in a Heraeus Sepatek Cryofuge 6000.
100ml of LB liquid medium containing the appropriate antibiotic was inoculated with 100µl of
plasmid mini prep and incubated O/N at 37°C on a shaker. On the next day the O/N-culture
was transferred to a falcon tube and centrifuged at 4000xg for 15 min. The supernatant was
discarded and the pellet resuspended in 3ml Cell Resuspension Solution. 3ml Cell Lysis
Solution was added and the lysate mixed by inverting the tube. The tube was incubated at
RT for 3 min followed by the transfer of the lysate to the Pure Yield Clearing Column placed
in a new, sterile falcon tube. The lysate was incubated at RT for 2 min and subsequently
centrifuged for 5 min at 1500xg. The flow through was added to the Pure Yield Binding
Column in a new, sterile falcon tube. A centrifugation step at 1500xg for 3 min followed. 5ml
of Endotoxin Removal Solution was added and the column in the tube centrifuged for 3 min
at 1500xg. Afterwards, 20ml of Column Wash Solution was added and centrifuged for 5 min
at 1500xg. To remove residual ethanol, another centrifugation step was carried out for 10
min at 1500xg. The column was transferred to a new falcon tube, subsequently 500µl of
ddH2O were added and the plasmids eluted by centrifugation at 2000xg for 5 min into a
sterile eppendorf tube. The purified plasmids were stored at -20°C.
Cell Resuspension Solution (CRA)
50mM Tris-HCl (pH 7.5)
10mM EDTA (pH 8.0)
100µg/ml RNase A
Cell Lysis Solution (CLA)
0.2M NaOH
1% SDS
Neutralization Solution (NSB)
4.09M guanidine
Hydrochloride (pH 4.2)
759mM potassium acetate
2.12M glacial acetic acid

34
Column Wash
162.8mM potassium acetate
22.6mM Tris-HCl (pH 7.5)
0.109mM EDTA (pH 8.0)
2.7.9 Restriction enzyme (RE) digestion
Following components were mixed and incubated for 90 min at 37°C:
10µl Mini/Midi prep
1µl appropriate RE
4µl appropriate restriction buffer
4µl ddH2O
To investigate the degree of DNA fragment digestion, an agarose gel electrophoresis was
performed. Positive Mini/Midi preps were sent for sequencing.
2.7.10 QPCR (Quantitative real time polymerase chain reaction)
QPCR (Quantitative Polymerase Chain Reaction) is an amplification method for nucleic acids
(like common PCR) with the additional feature to quantify the amplified DNA.
SYBR Green was used for quantification via fluorescence measurement. It intercalates
preferentially into double stranded DNA, and the resulting DNA-dye complex is able to
absorb/emit light at 497nm and 520nm, respectively. Therefore, the fluorescent signal
increases simultaneously with the amplified DNA. To ensure that only specific products of
double stranded DNA are measured, a melting curve analysis is performed after the actual
amplification program. Target double stranded DNA should melt at a specific temperature
and the decrease of released fluorescent dye is detected. The melting curve of target DNA is
different compared to unspecific by-products or primer dimers. This makes it possible to
check the efficiency of the used primer pair and the quality of the obtained PCR product.
Primer pairs which amplify additional unspecific products are not suitable for qPCR
experiments.

35
To prevent primer-dimer formation the primers are specifically designed to not be able to
bind each other.
qPCR Reaction Setup for Eppendorf Mastercycler:
PCR grade water: 8.2µl
KAPA SYBR Mastermix: 10µl
Forward primer (10µM): 0.4µl
Reverse primer (10µM): 0.4µl
Template DNA: 1µl
Total amount 20µl
Primers (100µM stock) and cDNAs were diluted 1:10 before used in the reaction setup.
Cycling Protocol:
Initial Denaturation / Enzyme activation: 3min 95°C
Denaturation 3sec 95°C
Annealing 20sec 60°C
Extension 8sec 72°C
For each qPCR run triplicates for each tissue specific cDNA sample were used. Additionally
a technical replicate of each of the triplicates was measured to recognize possible pipetting
mistakes. Expression levels were measured in arbitrary units (AU).
2.8 Molecular Biological Methods: Protein
2.8.1 Protein Extraction: Whole TRITON X-100 tissue-extract preparation
One gram (g) freshly isolated or frozen tissue was transferred to a 15ml Falcon tube and
placed on ice. 4ml of Homogenization Buffer was added and the tissue homogenized with an
Ultra Turrax T25 homogenizer (Aigner), 3 times each 20 sec. The homogenate was
centrifuged (SS34 rotor) at 620xg for 10 min at 4°C. The supernatant was transferred to an
ultracentrifugation tube, and the detergent Triton X-100 (20% stock solution in ddH2O) was
added to a final concentration of 1%. The homogenate was incubated on ice for 30 min while
40 x

36
it was vortexed repeatedly. After a centrifugation step at 50000xg for 1h at 4°C, the
supernatant was aliquoted and frozen at -80 °C.
Homogenization Buffer:
20 mM Hepes pH 7.4
300 mM Sucrose
150 mM NaCl
1x Proteinase inhibitor
2.8.2 Preparation of Triton X-100 membrane-protein extracts
All steps were performed on ice. One g of freshly obtained or frozen tissue was transferred to
15ml Falcon tube containing 5ml Buffer A. Proteinase inhibitor was added immediately to a
1x final concentration. The tissue was homogenized with an Ultra Turrax T25 homogenizer
(Aigner) for 3 times each 20 sec. The homogenate was centrifuged for 10 min. at 3000xg at
4°C. The supernatant was then transferred to an ultracentrifuge tube and centrifuged at 4°C
for 1h at 50000xg. The supernatant was discarded and the pellet resuspended in 1ml of
Buffer A. Afterwards, the pellet was dispersed and homogenized using an 18 gauge needle
and subsequently a 22 gauge needle. The homogenate was centrifuged for 1h at 4°C at
50000xg. The supernatant was discarded and the pellet diluted in Buffer B according to the
size of the pellet (big pellet 2ml Buffer B). Then NaCl (4M stock solution) to a final
concentration of 160mM was added. The homogenate was sonicated for 30 sec on ice. 26%
ddH2O of total volume was added followed by addition of 5% vol/vol TRITON X-100 to a final
concentration of 1%. The homogenate was centrifuged for 1 h at 4°C at 50000xg, and the
obtained supernatant was frozen at -80°C.
Buffer A: Buffer A: 20mM Tris/HCl, 1mM CaCl2, 150mM NaCl; pH=8
Buffer B: 250mM Tris/HCl, 2mM CaCl2; pH=6
2.8.3 Protein concentration measurement
For protein concentration measurement Bradford reagent by BioRad was used. First a
standard curve with Quick Start Bovine Serum Albumin (BSA) standard as internal standard
was established. 4 different concentrations were used: 4µg, 8µg, 16µg and 32µg BSA/ml
Bradford reagent (Quick Start 1x Dye Reagent). Then 1µl of protein extract was added to 1ml

37
of Bradford reagent and mixed. The concentration was then measured with the absorption at
595nm wavelength.
SDS-PAA gel:
Table 5. Electrophoresis procedure was performed in a BioRad Mini gel system in 1x SDS
Running Buffer.
The gels were prepared with a thickness of 1mm. First the resolving gel was prepared by
combining the components listed above in a 50ml Falcon tube. The mixture was transferred
into the assembled gel system, overlaid with 1ml of isopropanol, and allowed to polymerize
for ca. 20 min. After complete polymerization and the proper removal of isopropanol, the
stacking gel with comb was poured on top of the resolving gel. The protein samples were
mixed with 4xLaemmli buffer under reducing or non-reducing conditions. As a reducing
agent, DTT was used at a final concentration of 25mM. Additionally, the reducing samples
were boiled at 95°C for 5 min. The gel was run at 80 V until the Bromphenol Blue front
reached the resolving gel and then shifted to approximately 150V until the Bromphenol Blue
front ran completely out of the gel.
As a protein size marker, Unstained Precision Plus Protein Standard (Bio Rad) was used. On
each gel 8µl of marker was loaded.
30% Polyacrylamide
29.2% acrylamide
0.8% N,N´-methylenebisacrylamide
4x Laemmli buffer
8ml 78% glycerol
6ml 20% SDS
0.4ml 1M Tris-HCl pH 7.4
ddH2O to a final volume of 20ml
+25mM Dithiothreitol (DTT) for reducing conditions

38
1x Electrophoresis buffer
25 mM Tris
0.192 M Glycine
1% SDS
2.8.4 Western blot analysis
Semi Dry Blotting
Proteins separated on the SDS-PAA gel were transferred to a nitrocellulose membrane
(HybondTM-C Extra for optimized protein transfer, from Amersham Biosciences) by Western
blotting in a semi dry blotting unit. The blot was built up as followed: Three Whatman papers
soaked in 1x transfer buffer were superimposed on each other in the blotting unit, followed by
the nitrocellulose membrane. On top of the membrane the SDS-PAA gel was put and
overlaid with another three, 1x transfer buffer soaked Whatman papers. To remove air
bubbles caught in between the layers, which would drastically reduce the quality of protein
transfer, a test tube was rolled over the blot. The settings used for one gel were 200mA for
90 min. To visualize blotted proteins, the membrane was stained with Ponceau S staining
solution for 2 min on a shaker.
Detection:
The membrane was blocked in 5% blocking solution (5% non-fat dry milk or 5% BSA) in
1xTBST for 1h on a shaker at R/T. Subsequently, the blocking solution was replaced by the
primary antibody, which was diluted in blocking solution according to its affinity to the target
epitope. The membrane was incubated with primary antibody O/N at 4°C on a shaker. After 3
washing steps, 10 min each with 1xTBST, the membrane was incubated with the appropriate
secondary antibody (HRP-conjugated) diluted in blocking solution for at least 1h at RT on a
shaker. Following 3 additional washing steps, the membrane was incubated with ECL
solution I and II (ThermoScientific) mixed in a 1:1 ratio for 1min. Afterwards, the solution was
removed carefully with tissue paper and the membrane placed in a developing cassette.
After exposure times according to the signal intensity, films were developed in an Agfa Curix
60 developer.

39
2.8.5 Protein isolation from cellular lipid fractions by subcellular fractionation
Approximately 1-2g of area vitellina tissue was dissected from the chicken YS with a scalpel
and adhering yolk was removed completely by washing the tissue extensively in 1xPBS. The
tissue was centrifuged briefly to remove 1xPBS. Subsequently, the tissue then was mixed
with 1ml lysis buffer containing 2M Sucrose. For homogenization the cells were incubated for
10 min on ice and vortexed every 2 min for 30 sec. After the addition of 3ml of lysis buffer
and further incubation on ice for 10 min with periodical vortexing steps every 2 min, the now
slightly viscous suspension was further homogenized by passing it a couple of times through
a 27-gauge needle. To separate cell debris from cytosolic content 10 min centrifugation at
1500xg at 4°C followed. The supernatant was removed and transferred to a 12ml
ultracentrifugation tube and subsequently overlaid with 2ml 0.27M sucrose in lysis buffer, 2ml
0.135M sucrose in lysis buffer and filled up to the top with lysis buffer. The tubes were sealed
and centrifuged at 60000xg for 1h at 4°C. The lipid fraction floated up under the top of the
tube while the cytosolic fraction was pelleted at the bottom. While the cytosolic fraction could
be dissolved directly in 4xLaemmli buffer the lipid fraction was further processed by mixing
with 5ml ChCl3 : MeOH (2:1) and vortexing. The mixture was incubated on ice for 10 min
followed by centrifugation at 1500xg for 10 min at 4°C. The proteins were visible as a white
thin layer between the upper MeOH phase and the lower ChCl3 phase. These adjacent
phases were taken off with a syringe and a 27 gauge needle without disturbing the protein
layer. The protein-phase was then mixed with 5ml diethyl ether : EtOH (3:1) by vortexing and
incubated on ice for 10 min. Again, the samples were centrifuged at 1500xg for 10 min at
4°C. The precipitated proteins then were mixed with 5ml diethyl ether by vortexing. After 10
min incubation on ice and centrifugation performed as previously described, the white protein
pellet was air-dried and subsequently dissolved with 4xLaemmli buffer.
Lysis buffer: 10mM Tris; 1mM EDTA; 1x protease inhibitor; pH=7.4
2.8.6 Subcellular fractionation method 2
Procedure adapted from Liu, et al., 2008
Purification of adiposomes: Approximately 1-2g of freshly obtained Area Vitellina tissue was
placed into sterile 1.5ml eppendorf tubes. Excess liquid was removed from the tissue by
centrifugation for 5 min at 500xg. Cells were resuspended in 4ml Buffer A by vortexing,
followed by a 20 min incubation on ice. To homogenize the tissue, a Dounce-homogenizer
(7ml capacity) was used. The pistil was pulled quickly out of the tube to break cell-
40
membranes by producing a depression. The homogenized cell suspension was incubated on
ice for 15 min. To separate cell debris from cytosolic components, the samples were
centrifuged at 4°C for 15 min at 1000xg. The supernatant was transferred to an
ultracentrifuge tube with a 27 gauge needle. The tube with the cell lysate was overlaid and
filled up with Buffer B. The sample was centrifuged for 1h at 4°C at 50000rpm. The floating
lipid fraction was taken off with a pipette and transferred to a new eppendorf tube. The
intermediate cytosolic fraction was transferred to an eppendorf tube and stored at -80°C for
further processing. The pellet at the bottom of the tube which consisted of membrane debris
was discarded. Excess buffer in the lipid fraction was separated from floating lipids by
centrifugation at 4°C for 15 min at 10000rpm. Buffer was taken off with a tip, and care was
taken not to disturb the floating lipids. This centrifugation step was repeated until almost no
buffer was left. To remove membrane contaminations 1ml of Buffer B was added and
subsequently the sample was centrifuged at 50000rpm for 10 min at 4°C. Floating lipids were
transferred to a new eppendorf tube while residual buffer was discarded. The pellet at the
bottom was resuspended in 200µl Buffer B and discarded. Remaining lipids attached to the
tube were resuspended in 200µl Buffer B and pooled with the previously collected lipid
fraction. The tube was centrifuged at 10000xg for 5 min at 4°C and the remaining buffer was
taken off. Again the centrifugation step was repeated until no buffer was left. The lipid
fraction was dissolved in an appropriate amount of 4xLaemmli buffer and used for Western
blot analysis.
Buffer A: 20mM Tricine, 250mM Sucrose, pH=7.8
Buffer B: 20mM Hepes, 10mM KCl, 2mM MgCl2, pH=7.4
2.8.7 Processing of the cytosolic protein fraction
1 volume of 100% TCA (trichloroacetic acid) was added to 4 volumes of cytosolic fraction-
sample. The sample was mixed by vortexing and incubated on ice for 10 min. The sample
was then centrifuged for 5 min at 14000rpm with a tabletop centrifuge. The supernatant was
taken off very carefully without disturbing the protein pellet. 200µl ice cold acetone was used
to wash the pellet. Another centrifugation step at 14000rpm for 5 min was performed.
Acetone was added one more time followed by centrifugation with previous parameters. To
dry the protein pellet, the sample was placed into a heat block and heated for 10 min at 95°C
to evaporate residual acetone. Finally, the sample was mixed with the appropriate amount of
4x Laemmli buffer for further Western blot analysis.

41
2.9 Cultivation of EECs of the area vitellina
The freshly obtained area vitellina from 5d chicken YSs was collected and washed in 1xPBS
as described in 2.5. Then the tissue was cut with a sterile scalpel. The tissue was cut into
small pieces. These pieces were collected in a fresh Falcon tube and pelleted by
centrifugation to remove PBS. Tissue pieces were resuspended in Dulbecco’s Modified
Eagle Medium F-12 (DMEM-F12) containing penicillin and streptomycin, glutamine and 10%
fetal calf serum (FCS). The mixture was pipetted up and down to obtain a homogenous cell
suspension. The cells were plated on 4-well Lab-Tek Permanok chamber slides and grown
for at least 24h to confluence. Growth of cells was always monitored with a light microscope.
2.10 Immunofluorescence experiments
All fixations, incubations, washings and blocking steps were performed on a shaker. Washing
steps were done in 1xPBS. Additionally, all incubation steps with fluorescent dyes and
interspersed washing steps were performed in the dark.
Fixation of cells was performed in 4% paraformaldehyde in PBS for 20 min at R/T. Then,
cells were washed 4 times at R/T for 5 min each in 1xPBS. Subsequently, cells were
permeabilized and blocked for 45 min in 0.1% saponin, 3% BSA, and 0.2M glycine in 1xPBS
at R/T. The incubation with the primary rabbit anti-human PLIN2 antibody was done O/N at
4°C in 0.1% saponin, 3% bovine serum albumin (BSA) in 1xPBS. Different antibody dilutions,
from 1:100, 1:250, 1:500, to 1:1000 were tried to achieve the best epitope binding results.
The next day, cells were washed three times, 5 min each at R/T in 1xPBS. Afterwards the
cells were incubated with a Texas Red goat anti-rabbit secondary antibody for 1h diluted
1:500 in 1xPBS, followed by three washing steps, 5 min each at R/T. Nuclear staining was
performed with 4',6-diamidino-2-phenylindole (DAPI) and LD staining with 4,4-difluoro-4-
bora-3a,4a-diaza-s-indacene (BODIPY). Both fluorescent agents were diluted 1:500 in
1xPBS and incubated for 20 min. After the final staining the solutions were discarded and the
slides dipped in ddH2O. The slides were air dried in a light protected box and lastly covered
with a few drops of DAKU fluorescent mounting medium and covered with a cover glass. The
slides were then ready for microscopy or could be stored light protected at 4°C.

42
2.11 Utilized antibodies and antisera in Western blotting
Protein Specific antibody Dilution
huPLIN2 Rabbit anti-human PLIN2
antiserum
1:1000
Rabbit IgG Goat anti-rabbit IgG 1:50000
ggLPL Goat anti-chicken LPL
antiserum
1:10000
Goat IgG Rabbit anti goat-IgG 1:50000
ocGAPDH Mouse anti-rabbit GAPDH
antiserum
1:100000
Mouse IgG Rabbit anti-mouse IgG 1:4000
Table 6. Used antibodies. All antibodies diluted in 5% milk powder, or 5% BSA in 1xTBST.
2.12 Utilized antibodies, antisera, and preimmune sera (PI) in immunofluorescence experiments
Protein/Preimmune serum Specific antibody Dilution
huPLIN2 Rabbit anti-human PLIN2
antiserum
1:100, 1:250; 1:500
Rabbit IgG Goat anti-rabbit IgG 1:100, 1:250, 1:500
Rabbit preimmune serum Rabbit preimmune serum 1:100; 1:250, 1:500
Table 7. Used antibodies and preimmune sera. All antibodies and PI diluted in 5% milk
powder in TBST.

43
3. Results
The aim of my master thesis was to study and characterize LD associated proteins in the
chicken YS. In particular I analyzed in detail the expression patterns ot these special proteins
in the chicken YS. I used quantitative PCR to study the expression on mRNA level and
Western blotting and immunofluorescence to investigate protein abundace and intracellular
localization respectively. In more detail I focused on proteins of the perilipin family, which
have been shown to be LD associated. I could show that PLIN2 is the mainly expressed LD-
associated protein in the chicken YS. After dissection of the YS into its distinct layers I found
predominant expression of PLIN2 in the EECs of the area vitellina. As embryonic
development proceeds, this tissue layer gets overgrown by the mesodermal blood vessel
layer forming the fully differentiated area vasculosa. The area vitellina was formerly thought
to be not involved in the nourishing process of the embryo, as there are no blood vessels to
transport any components from those EECs. Instead, the area vitellina seems to be a “fat
storing tissue” as I found PLIN2 in close association with LDs of its EECs, which occupy
major parts of the cytoplasm (Fig. 2).
3.1 Investigation of PLIN gene expression in chicken tissues
Real time quantitative PCR was used to determine the relative expression levels of the
perilipin gene family in chicken tissues. I investigated the expression patterns of PLIN1,
PLIN2, and PLIN3. However, no chicken PLIN4 and PLIN5 sequences were found in NCBI
and/or Ensembl database. PLIN1, PLIN2, and PLIN3 showed quite diverse results in
expression levels and tissue distribution. In a first attempt I could show, as indicated in figure
11, that PLIN1 was highly expressed in adipose tissue (as expected and described in the
introduction part) of adult animals but not in the 5d YS or adult laying hen liver tissue. In
comparison, PLIN2 was expressed in all three tissues, the highest in liver tissue (Fig 12).
PLIN3 showed an almost even, but low expression in all three tissues (Fig. 13).

44
Figure 11. Levels of PLIN1 mRNA in YS, adipose tissue (AT), and liver (L). RNA was isolated
from 5d chicken YS, adult laying hen AT and adult laying hen L tissue. QPCR experiments
were performed after reverse transcription of total RNA as described in the Materials and
Methods section 2.6.2. Transcript levels are expressed as arbitrary units (AU) and represent
the average of at least triplicate measurements +/- standard error of the mean (S.E.M.).
Figure 12. Levels of PLIN2 mRNA in YS, AT, and L. RNA was isolated from 5d chicken YS,
adult laying hen AT and adult laying hen L tissue. QPCR experiments were performed after
reverse transcription of total RNA as described in the Materials and Methods section 2.6.2.
Transcript levels are expressed as arbitrary units (AU) and represent the average of at least
triplicate measurements +/- S.E.M.
0
200
400
600
800
1000
1200
1400
1600
1800
YS AT L
PLIN1 expression
PLIN1 expression
0
50
100
150
200
250
YS AT L
PLIN2 expression
PLIN2 expression

45
Figure 13. Levels of PLIN3 mRNA in YS, AT, and L. RNA was isolated from 5d chicken YS,
adult laying hen AT and adult laying hen L tissue. QPCR experiments were performed after
reverse transcription of total RNA as described in the Materials and Methods section 2.6.2.
Transcript levels are expressed as arbitrary units (AU) and represent the average of at least
triplicate measurements +/- S.E.M.
Next, I compared the expression levels of the three PLINs in the chicken YS 5d post
fertilization. Interestingly, only PLIN2 was expressed at significant amounts compared to
PLIN1 and PLIN3 (Fig. 14).
Figure 14. Levels of PLIN1, PLIN2, and PLIN3 mRNA in the chicken YS. RNA was isolated
from 5d chicken YS tissue. QPCR experiments were performed after reverse transcription of
total RNA as described in the Materials and Methods section 2.6.2. Transcript levels are
0
0,2
0,4
0,6
0,8
1
1,2
1,4
YS AT L
PLIN3 expression
PLIN3 expression
0
20
40
60
80
100
PLIN1 PLIN2 PLIN3
Expression of PLINs in the YS
Expression of PLINsin the YS

46
expressed as arbitrary units (AU) and represent the average of at least triplicate
measurements +/- S.E.M.
To confirm those findings I dissected the 5d chicken YS into its distinct layers. First I
performed qPCR with cDNAs, from EECs of the area vasculosa and from the mesodermal
blood vessel layer. Again the same results were obtained (Fig. 15 and Fig. 16), and directed
my focus towards the characterization of PLIN2 expression pattern and function in the
chicken YS.
Figure 15. Levels of PLIN1, PLIN2, and PLIN3 mRNA in the EECs of the chicken YS. RNA
was isolated from area vasculosa EECs of 5d chicken YS tissue. QPCR experiments were
performed after reverse transcription of total RNA as described in the Materials and Methods
section 2.6.2. Transcript levels are expressed as arbitrary units (AU) and represent the
average of at least triplicate measurements +/- S.E.M.
0
200
400
600
800
1000
PLIN1 PLIN2 PLIN3
Expression of PLINs in the Vasc EECs
Expression ofPLINs in the VascEECs
020406080
100120140160
PLIN1 PLIN2 PLIN3
Expression of PLINs in the mesoderm
Expression ofPLINs in themesoderm

47
Figure 16. Levels of PLIN1, PLIN2, and PLIN3 mRNA in the mesodermal cell layer of the
chicken YS. RNA was isolated from the mesodermal cell layer of 5d chicken YS tissue.
QPCR experiments were performed after reverse transcription of total RNA as described in
the Materials and Methods section 2.6.2. Transcript levels are expressed as arbitrary units
(AU) and represent the average of at least triplicate measurements +/- S.E.M.
Furthermore, I compared the expression levels of PLIN2 in the EECs of the area vasculosa
and in the blood vessel forming mesodermal cell layer (Fig. 17). PLIN2 expression in the
EECs of the area vasculosa was approximately 6-fold higher than in the cells of the
mesodermal layer.
Figure 17. Levels of PLIN2 mRNA in the area vasculosa EECs and the mesodermal cell
layer of the chicken YS. RNA was isolated from the area vasculosa EECs and mesodermal
cell layer of 5d chicken YS tissue. QPCR experiments were performed after reverse
transcription of total RNA as described in the Materials and Methods section 2.6.2. Transcript
levels are expressed as arbitrary units (AU) and represent the average of at least triplicate
measurements +/- S.E.M.
However, surprising results were obtained when qPCR experiments were done with all 3 cell
sheets and the whole chicken YS (Fig. 18). The unvascularized EECs of the area vitellina
showed a more than 100% higher PLIN2 expression than the area vasculosa EECs and the
mesodermal cells. Those findings were later also confirmed on protein level.
0
200
400
600
800
1000
Vasc Meso
PLIN2 expression
PLIN2 expression

48
Figure 18. Levels of PLIN2 mRNA in the total YS, area vasculosa EECs, area vitellina EECs,
and the mesodermal cell layer. RNA was isolated from 5d chicken YS tissue and its distinct
cell layers. QPCR experiments were performed after reverse transcription of total RNA as
described in the Materials and Methods section 2.6.2. Transcript levels are expressed as
arbitrary units (AU) and represent the average of at least triplicate measurements +/- S.E.M.
3.2 Investigation of PLIN2 protein levels in the yolk sac.
Western Blots were performed to detect PLIN2 protein expression in the different cell layers
of the chicken YS. It was of great interest if qPCR findings could be confirmed also on protein
levels. First, as no specific anti chicken PLIN2 antibody was available in our lab, I had to
search for commercially available antibodies with potential to crossreact with the chicken
PLIN2 protein. Fortunately I found a rabbit polyclonal antibody directed against an epitope of
human PLIN2, which shares great sequence homologies to the corresponding chicken PLIN2
peptide (provided by abcam) (Fig. 19).
gg Perilipin-2 MALAAIDPQQNIVSRVVNLPLVSSTYDMVSTAYITTKDNHPYLKSVCEIAEKGVKTITSV 60
hs Perilipin-2 MASVAVDPQPSVVTRVVNLPLVSSTYDLMSSAYLSTKDQYPYLKSVCEMAENGVKTITSV 60
gg Perilipin-2 AMTSAMPIIQKLEPQIVVANNYACIGLDKIEERLPILNQPTDKVVANAKGVVVGAREAVT 120
hs Perilipin-2 AMTSALPIIQKLEPQIAVANTYACKGLDRIEERLPILNQPSTQIVANAKGAVTGAKDAVT 120
0
200
400
600
800
1000
1200
YS Vasc Vit Meso
PLIN2 expression
PLIN2 expression

49
gg Perilipin-2 TTVSGAKETVAHKITGVVGKTKEAVQDSVEITKSVVNGGINTVLGSRVVQMMSSGMDSAL 180
hs Perilipin-2 TTVTGAKDSVASTITGVMDKTKGAVTGSVEKTKSVVSGSINTVLGSRMMQLVSSGVENAL 180
*****.*.********::*::***::.**
gg Perilipin-2 TKSETLVDQYLPLTEAELEREAAKVEGFEVGVQKPSYYVRLGSLSSKFRARAYQQALNKV 240
hs Perilipin-2 TKSELLVEQYLPLTEEELEKEAKKVEGFDL-VQKPSYYVRLGSLSTKLHSRAYQQALSRV 239
**** **:******* ***:** *****:: **************:*:::*******.:*
gg Perilipin-2 RDAKQKSQETISQLHNTVSLIEYARKNMNSANQKLLGAQEKLYQSWVEWKKNTGQNDGDE 300
hs Perilipin-2 KEAKQKSQQTISQLHSTVHLIEFARKNVYSANQKIQDAQDKLYLSWVEWKRSIGYDDTDE 299
::******:*
gg Perilipin-2 SHSAEHIESRTLAIAQSLTQQLQTTCLTLVTSIQGLPQSVQDQVYSVRSMAGDVYEIFRS 360
hs Perilipin-2 SHCAEHIESRTLAIARNLTQQLQTTCHTLLSNIQGVPQNIQDQAKHMGVMAGDIYSVFRN 359
gg Perilipin-2 ASSFQELSDSFLTTSKGQLKKMKESLDDVMDYLVNNTPLNWLVGPFYPQLPGTQHAENEG 420
hs Perilipin-2 AASFKEVSDSLLTSSKGQLQKMKESLDDVMDYLVNNTPLNWLVGPFYPQLTESQNAQDQG 419
gg Perilipin-2 EGEKNSSQEDK------- 431
hs Perilipin-2 AEMDKSSQETQRSEHKTH 437
Figure 19. Alignment of chicken and human PLIN2 protein sequences. In red, the binding
epitope of the rabbit anti-human PLIN2 antibody is indicated. Red asterisks indicate 100%
homology of the amino acid sequence between the two species. The lower picture shows the
position of the binding epitope of the PLIN2 antibody in the primary protein sequence,
indicated in red.
As shown in figure 20, results from qPCR experiments were confirmed by the specific
binding of rabbit anti-human PLIN2 antibody to a chicken protein with a molecular weight of
approximately 48kDa in a total protein extract of 5d chicken YS containing area vasculosa
and area vitellina tissue. No PLIN2 protein could be detected in the EECs of the area
vasculosa (Va) and the mesodermal, blood vessel – containing cell layer (Me). However, a
strong signal for PLIN2 was detected in the area vitellina (Vit), which perfectly matches the
N- -C

50
observations from qPCR experiments. As a loading control, a monoclonal mouse anti-rabbit
glyceraldehyde 3-phosphate dehydrogenase (GAPDH) antibody was used.
Figure 20. Top panel: Western blot under reducing conditions shows the presence of PLIN2
in total chicken YS and its individual cell sheets. 50µg of total protein extracts was loaded to
a 12 % SDS-PAA gel followed by transfer to a nitrocellulose membrane. Chicken PLIN2 was
detected with a crossreactive rabbit anti-human PLIN2 antibody. As secondary antibody,
HRP-conjugated goat anti-rabbit IgG by Sigma Aldrich was used. To visualize specifically
bound antibodies the enhanced chemiluminescent (ECL) system ECL was used. A molecular
weight standard was used to determine the size of detected proteins in kDa.
Bottom panel: Western blot under reducing conditions shows the presence of GAPDH in total
chicken YS and its individual layers. The antibody used was a mouse anti-rabbit GAPDH
monoclonal antibody. As secondary antibody, a HRP-conjugated rabbit anti-mouse
polyclonal antibody was used.
To determine the specific localization of PLIN2 in EECs of the area vitellina, I performed
subcellular fractionation experiments as described in the Materials and Methods section
(2.8.5, 2.8.6, and 2.8.7). Thereby I isolated the cell content from the cell membrane by using
a lysis buffer. The lipid fraction was then separated from the cytosolic fraction by
ultracentrifugation. Subsequently both fractions were processed separately to isolate the
proteins. Eventually Western blots were performed.
100
37
50
75
37
gg PLIN2
ggGAPDH
YS Va Vit Me
YS: total yolk sac
Va: area vasculosa EECs
Vit: area vitellina EECs
Me: mesodermal cell layer
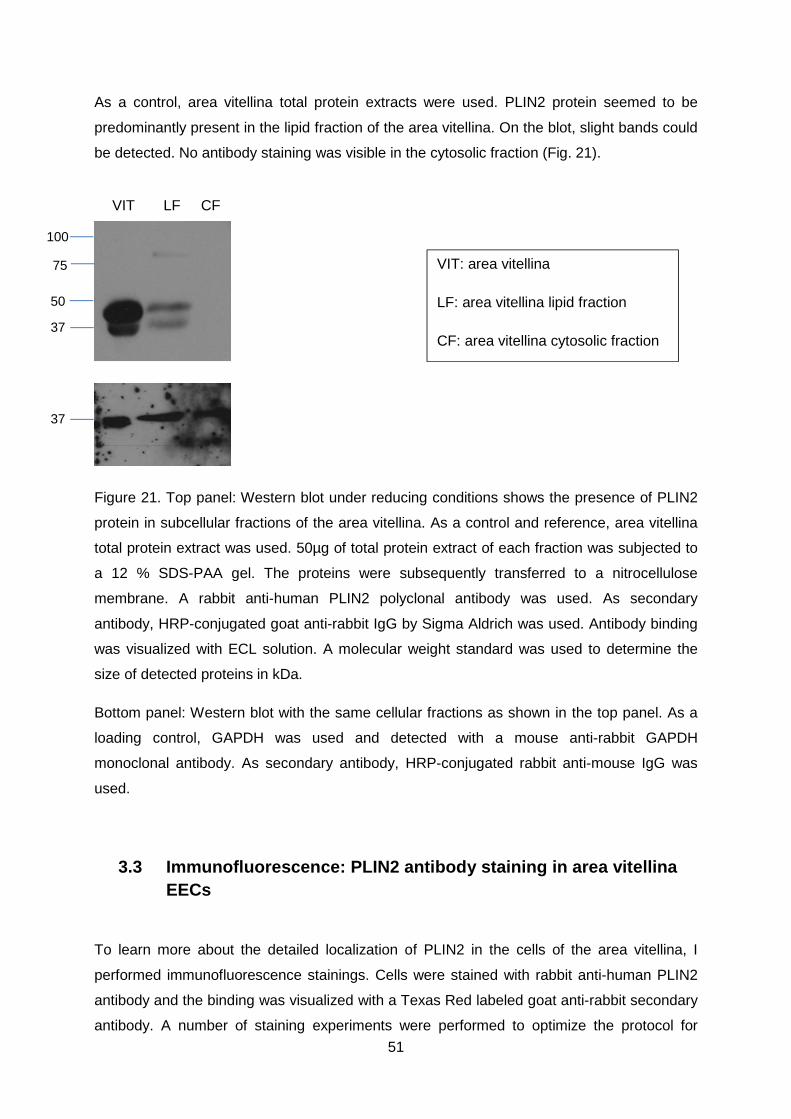
51
As a control, area vitellina total protein extracts were used. PLIN2 protein seemed to be
predominantly present in the lipid fraction of the area vitellina. On the blot, slight bands could
be detected. No antibody staining was visible in the cytosolic fraction (Fig. 21).
Figure 21. Top panel: Western blot under reducing conditions shows the presence of PLIN2
protein in subcellular fractions of the area vitellina. As a control and reference, area vitellina
total protein extract was used. 50µg of total protein extract of each fraction was subjected to
a 12 % SDS-PAA gel. The proteins were subsequently transferred to a nitrocellulose
membrane. A rabbit anti-human PLIN2 polyclonal antibody was used. As secondary
antibody, HRP-conjugated goat anti-rabbit IgG by Sigma Aldrich was used. Antibody binding
was visualized with ECL solution. A molecular weight standard was used to determine the
size of detected proteins in kDa.
Bottom panel: Western blot with the same cellular fractions as shown in the top panel. As a
loading control, GAPDH was used and detected with a mouse anti-rabbit GAPDH
monoclonal antibody. As secondary antibody, HRP-conjugated rabbit anti-mouse IgG was
used.
3.3 Immunofluorescence: PLIN2 antibody staining in area vitellina EECs
To learn more about the detailed localization of PLIN2 in the cells of the area vitellina, I
performed immunofluorescence stainings. Cells were stained with rabbit anti-human PLIN2
antibody and the binding was visualized with a Texas Red labeled goat anti-rabbit secondary
antibody. A number of staining experiments were performed to optimize the protocol for
VIT LF CF
VIT: area vitellina
LF: area vitellina lipid fraction
CF: area vitellina cytosolic fraction
37
100
75
50
37
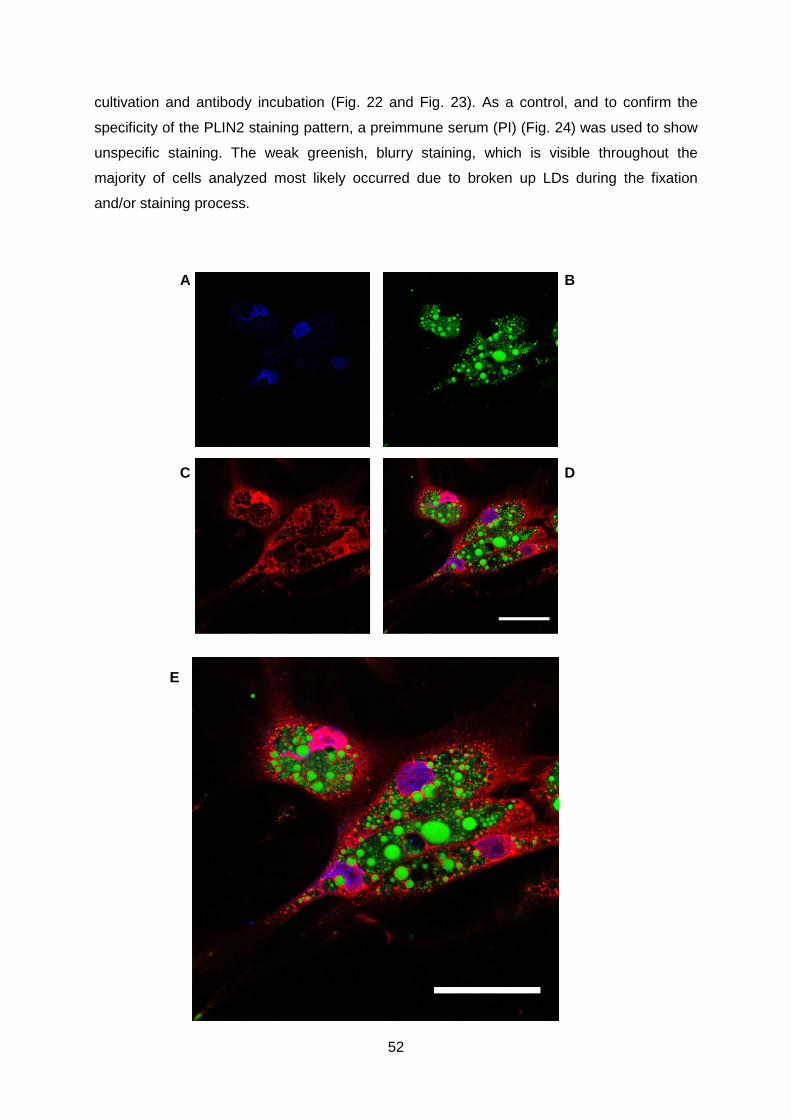
52
cultivation and antibody incubation (Fig. 22 and Fig. 23). As a control, and to confirm the
specificity of the PLIN2 staining pattern, a preimmune serum (PI) (Fig. 24) was used to show
unspecific staining. The weak greenish, blurry staining, which is visible throughout the
majority of cells analyzed most likely occurred due to broken up LDs during the fixation
and/or staining process.
A B
C D
E

53
Figure 22. PLIN2 immunofluorescence stainings of cultivated area vitellina EECs from 5d
chicken YS. Cells were grown for 48 h and subsequently fixed in 4% PFA and further
processed as mentioned in the Materials and Methods section (2.10). Picture A shows
nuclear staining with DAPI. Picture B shows LD staining with BODIPY, and in Picture C the
specific staining of PLIN2 proteins with Texas Red goat anti-rabbit secondary antibody is
depicted. Picture D and E show the merged picture. Images were taken with an LSM 510
confocal microscope using a 63x oil objective. Scale bar: 50µm.

54
Figure 23. PLIN2 immunofluorescence stainings of cultivated area vitellina EECs from 5d
chicken YS. Cells were grown for 48 h and subsequently fixed in 4% PFA and further
processed like mentioned in the Materials and Methods section (2.10). PLIN2 protein
localization was determined using a primary polyclonal rabbit anti-human PLIN2 antibody
and a secondary Texas Red goat anti-rabbit antibody for visualization. LD staining was done
with BODIPY (green). In blue the nuclear staining with DAPI is shown. Images on the left
side show merged pictures of DAPI and antibody staining. Figures on the right show the
merged picture of DAPI, antibody and BODIPY staining. The images were taken with a LSM
510 confocal microscope using a 63x oil objective. Scale bar: 50µm
3.4 Immunofluorecence: PI staining in area vitellina EECs
As control experiment, and to confirm specificity of the rabbit anti-human PLIN2 staining
pattern, I used a rabbit pre immune serum (PI). As depicted in figure 24, and 25, a general
unspecific background staining in red could be observed.
A B

55
Figure 24. Preimmune staining of cultivated area vitellina EECs from 5d chicken YS. Cells
were grown for 48 h and subsequently fixed in 4% PFA and further processed as mentioned
in the Materials and Methods section (2.10). Picture A shows nuclear staining with DAPI, LD
staining with BODIPY is depicted in picture B, and the PI staining visualized with a Texas
Red goat anti-rabbit secondary antibody is shown in picture C. Picture D and E show the
merged image. The images were taken with a LSM 510 confocal microscope, using a 63x oil
objective. Scale bar: 50µm.
C D
E

56
Figure 25. Preimmuno staining of cultivated area vitellina EECs from 5d chicken YS. Cells
were grown for 48 h and subsequently fixed in 4% PFA and further processed like mentioned
in the Materials and Methods section (2.10). A rabbit PI serum was used as unspecific

57
primary antibody. For visualization, again a Texas Red labeled goat anti-rabbit secondary
antibody was used. LD staining was performed with BODIPY (green). In blue, the nuclear
staining with DAPI is shown. Figures on the left side show merged pictures of DAPI and
Texas Red staining of the PI. Figures on the right show the merged picture of DAPI, PI and
BODIPY staining. The pictures were taken with a LSM 510 confocal microscope, using a 63x
oil objective. Scale bar: 50µm.
To sum up, the here presented findings indicate an involvement of PLIN2 in the fat-storing
regulation in the endodermal cells of the chicken YS. PLIN2 expression was clearly
detectable on mRNA level (Fig. 18) as well as on protein level (Fig. 20). Additionally, the
immunofluorescence investigations confirmed the results obtained by Western blotting by
showing the clear association of PLIN2 with the lipid fraction of the cells (Fig. 21). Even
though mRNA expression seems to be very weak for PLIN1 and PLIN3, further investigations
have to be done on protein level. Unfortunately, due to lacking chicken sequences of PLIN4
and PLIN5, a potential participation of these gene products and/or proteins could not be
investigated.
3.5 Lipases involved in the mobilization of TGs in the chicken yolk sac
The huge amounts of lipids stored in the EECs of the area vitellina eventually get involved in
metabolic processes as the differentiation to the area vasculosa proceeds. ApoB containing
TG-rich lipoproteins are assembled and secreted exclusively in the area vasculosa of the
chicken YS (Bauer, et al., 2012, unpublished data). As lipoproteins are responsible for the
transport of fats, TGs, stored in LDs, have to be mobilized from their compartments.
Therefore, we speculated that specific TG hydrolyzing enzymes must be involved in the
release of stored lipids during the transition from the area vitellina to the area vasculosa in
the chicken YS. I tested various TG lipases to find the potential rate determining enzymes.
I performed qPCR experiments to determine expression levels of well-known lipases,
generally involved in TG breakdown. First I tested ATGL, a rate determining enzyme
concerning TG hydrolysis and mobilization from adipocyte LDs. In qPCR analysis it was
shown that on the one hand ATGL mRNA was higher expressed in the area vasculosa
compared to the undifferentiated EECs of the area vitellina but it seemed that highest

58
expression occurred in the mesodermal blood vessel layer (Fig. 26). However, expression
levels were generally too low to be considered for further investigations.
The second lipase tested was PNPLA3. The membrane bound enzyme showed promising
results as its mRNA expression levels in the area vasculosa were at average almost 3-fold
higher than in the area vitellina and 4-fold higher than in the mesodermal blood vessel layer
(Fig. 27).
Subsequently the investigation of LPL expression was performed. Expression levels showed
very similar results in area vasculosa and vitellina tissue expression (Fig. 28), levels in the
mesodermal cell layer turned out to be the lowest.
The next lipase to be tested was LAL. As shown in figure 29, it did not show the desired
results as the lowest expression was measured in the area vasculosa and the highest in the
mesodermal blood vessel layer.
The last lipase to be tested was HTGL. The obtained results were promising at a first sight as
area vasculosa expression turned out to exceed the other measured tissues. Unfortunately
the general expression levels were too low to draw any concrete conclusions (Fig. 30).
Figure 26. Levels of ATGL mRNA in total chicken YS, area vasculosa, area vitellina, and
mesodermal blood vessel layer. QPCR experiments were performed after reverse
transcription of total RNA from dissected 5d chicken YS tissue layers as described in the
Materials and Methods section 2.6.2. Transcript levels are expressed as arbitrary units (AU)
and represent the average of at least triplicate measurements +/- S.E.M.
0
0,5
1
1,5
2
2,5
3
YS Vasc Vit Meso
ATGL
ATGL

59
Figure 27. Levels of PNPLA3 mRNA in total chicken YS, area vasculosa, area vitellina, and
mesodermal blood vessel layer. QPCR experiments were performed after reverse
transcription of total RNA from dissected 5d chicken YS tissue layers as described in the
Materials and Methods section 2.6.2. Transcript levels are expressed as arbitrary units (AU)
and represent the average of at least triplicate measurements +/- S.E.M.
Figure 28. Levels of LPL mRNA in total chicken YS, area vasculosa, area vitellina, and
mesodermal blood vessel layer. QPCR experiments were performed after reverse
transcription of total RNA from dissected 5d chicken YS tissue layers as described in the
Materials and Methods section 2.6.2. Transcript levels are expressed as arbitrary units (AU)
and represent the average of at least triplicate measurements +/- S.E.M.
0
20
40
60
80
100
120
140
160
180
YS Vasc Vit Meso
PNPLA3 expression
PNPLA3 expression
0
100
200
300
400
500
600
700
YS Vasc Vit Meso
LPL expression
LPL expression

60
Figure 29. Levels of LAL mRNA in total chicken YS, area vasculosa, area vitellina, and
mesodermal blood vessel layer. QPCR experiments were performed after reverse
transcription of total RNA from dissected 5d chicken YS tissue layers as described in the
Materials and Methods section 2.6.2. Transcript levels are expressed as arbitrary units (AU)
and represent the average of at least triplicate measurements +/- S.E.M.
Figure 30. Levels of HTGL mRNA in total chicken YS area vasculosa, area vitellina, and
mesodermal blood vessel layer. QPCR experiments were performed after reverse
transcription of total RNA from dissected 5d chicken YS tissue layers as described in the
Materials and Methods section 2.6.2. Transcript levels are expressed as arbitrary units (AU)
and represent the average of at least triplicate measurements +/- S.E.M.
0
50
100
150
200
250
YS Vasc Vit Meso
LAL expression
LAL expression
00,5
11,5
22,5
33,5
44,5
5
YS Vasc Vit Meso
HTGL expression
HTGL expression

61
Finally, I compared expression levels of all investigated lipases to restrict the number of
lipases possibly responsible for lipolysis of LDs in the area vasculosa. As indicated in figures
26 and 30, ATGL and HTGL were expressed only at very low level. LPL generally had the
highest expression levels of all lipases but expression in the area vasculosa was lower than
in the area vitellina (Fig. 28, and fig. 31). LAL showed the same trend between those two
tissues like LPL (Fig. 29). PNPLA3 had in comparison to all observed tissues the highest
mRNA levels in area vasculosa tissue samples (Fig 27). A specific antibody has to be
created for future studies to confirm those findings also on protein level.
Figure 31. MRNA levels of all 5 investigated lipases indicated in distinct colors. Levels were
measured in 5d chicken total YS, area vasculosa EECs, area vitellina EECs and mesodermal
blood vessel layer. QPCR experiments were performed after reverse transcription of total
RNA from dissected 5d chicken YS tissue layers as described in the Materials and Methods
section (2.6.2). Transcript levels are expressed as arbitrary units (AU) and represent the
average of at least triplicate measurements +/- S.E.M.
3.6 Investigation of lipase protein levels in the yolk sac
Due to a lack of time and consequent unavailability of specific antibodies I could only
investigate the protein expression of one lipase. Our goat anti-chicken LPL antibody
specifically detected a protein of approximately 55kDa, which is in good correlation with the
predicted size of LPL protein found in literature, exclusively in the mesodermal blood vessel
layer. These results contrast my experimental findings on RNA level, where I found LPL
expression predominantly in area vasculosa and area vitellina tissue. However, the presence
0
100
200
300
400
500
600
700
YS Vasc Vit Meso
ATGL
PNPLA3
LPL
HTGL
LAL

62
of LPL protein in the mesodermal blood vessel layer supports the fact that LPL acts inside
the capillary lumen therefore being not considerable as a TG-degrading lipase in the area
vasculosa EECs (Fig. 32).
Figure 32. Western blot analysis under reducing conditions of total protein extracts shows the
presence of LPL protein in the mesodermal cell layer. 50µg of total protein extracts from
chicken YS, area vasculosa, area vitellina, and mesodermal blood vessel layer were
subjected to a 12% SDS-PAA gel and blotted to nitrocellulose membrane. As primary
antibody, a goat anti-chicken LPL antibody was used. As secondary antibody, HRP-
conjugated rabbit anti-goat IgG was used. To visualize antibody binding ECL solution was
applied.
In conclusion, only PNPLA3 mRNA levels showed a pattern suitable to be responsible for LD
degradation in the area vasculosa (Fig. 27 and Fig. 31). As I could only investigate protein
levels of LPL, the confirmation of found mRNA expression levels has to be postponed on
future studies.
YS Va Vit Me
100
75
50
37
gg LPL
YS: total yolk sac
Va: area vasculosa EECs
Vit: area vitellina EECs
Me: mesodermal cell layer

63
4. Discussion
The protein family of perilipins has gained increasing importance in lipid metabolism over the
last decades. The number of family members steadily increased, and proteins with
orthologous functions have been found in many different species and organisms. They were
investigated in e.g. mammals, insects, slime molds, and fungi (Bickel, et al., 2009).
Nevertheless there is not much known about PLINs in birds, let alone in the subspecies G. g.
domesticus.
In this thesis I explored the involvement of PLINs in lipid storage and metabolism in the YS,
an extraembryonic tissue involved in nutrient supply for the growing chick (Mobbs and
McMillan, 1981; Speake et al., 1998).
Especially analyses of the EECs of the chicken YS 5d post-fertilization brought interesting
new findings. PLIN1 did not show high expression levels in any part of the YS. Expression in
the liver was also very low. As expected, PLIN1 expression in chicken adipose tissue was
found to be high, as the values exceeded those in liver and YS by more than a hundredfold
(Fig. 11). These results are in perfect agreement with findings of many previous studies on
PLIN1, which showed that the expression is restricted to adipose tissue and steroidogenic
cells (Servetnick et al., 1991; Blanchette-Mackie et al., 1995).
Completely different and surprising results showed PLIN2 investigations at the mRNA level.
PLIN2 was the only gene of the investigated PLINs which showed detectable expression in
the YS. Despite the fact that compared to liver and adipose tissue, PLIN2 expression was
lowest in the YS (Fig. 12), PLIN2 mRNA levels were hundredfold increased compared to
PLIN1 and PLIN3 (Fig. 13). Dissection of the YS into its distinct cell layers revealed that, in
contrast to many other yet identified genes (Nakazawa et al., 2011) PLIN2 mRNA levels
were highest in the area vitellina of the developing YS. Furthermore, I investigated PLIN2
protein levels in the YS. To do so, I used an anti-human PLIN2 polyclonal antibody directed
against a human PLIN2 epitope with over 75% identity to the chicken PLIN2 sequence. In
agreement with the findings at the mRNA level, I found PLIN2 protein only present in the
area vitellina of the YS.
The area vitellina of the early developing chicken YS consists of an ectodermal cell layer and
the underlying EECs, which are in direct contact with the yolk compartment. The main
difference compared to the area vasculosa is that the area vitellina lacks the mesodermal
blood vessel layer that overgrows the EECs with proceeding development. The leading edge
of the area vasculosa is defined by the sinus terminalis, which clearly separates the area

64
vasculosa from the area vitellina (Fig. 1). The area vasculosa was described by many
previously published reports (Refs) as the functional unit of the YS, being able to take up and
ultimately provide the growing embryo with nutrients from the yolk. This transport of nutrients
can only be accomplished with a well-established circulation from the YS to the embryo,
which is absent in the area vitellina. Additionally, the secretion of TG-rich apoB containing
lipoproteins was detected in EECs of the area vasculosa, but was completely absent in the
area vitellina (R. Bauer, unpublished data). Nascent lipoproteins are assembled by utilizing
TGs and phospholipids from LDs, which eventually are secreted and serve as energy supply
for the growing embryo. However, besides the fact that area vitellina EECs exhibit extensive
lipid storing in LDs which occupy major parts of the cytosol (Fig. 2), VLDL secretion seems to
be somehow blocked.
PLIN2 is a LD associated protein and it seems to be the only PLIN expressed in the area
vitellina EECs (the non-investigated PLIN4 and PLIN5 excluded). Importantly,
immunofluorescence experiments with cultivated EECs derived from the area vitellina indeed
confirmed an association of PLIN2 with the LD surface (Fig. 23). The connection between
lipid storage in the area vitellina and VLDL-mediated secretion of stored lipids in the area
vasculosa could partially be explained by findings in previous mouse and rat studies (Chang,
et al., 2010; Magnusson, et al., 2006). In a mouse obesity model, assembly and secretion of
VLDL was upregulated when PLIN2 expression was knocked out, resulting in an
improvement of the fatty liver. Additionally the expression of MTTP, the crucial VLDL
assembly factor, was highly increased. The authors suggested that in absence of PLIN2,
MTTP-triggered VLDL assembly and increased TG secretion was facilitated (Chang, et al.,
2010). On the other hand, PLIN2 overexpression caused a decrease in VLDL secretion of
incorporated TGs (magnussen et al., 2006).
In the developing chicken YS, the presence or absence of PLIN2 also seems to have a
profound impact on VLDL secretion rates. PLIN2 covers the LD surface in EECs of the area
vitellina, where no VLDL secretion can be observed. However, during the transition from the
area vitellina to the area vasculosa, PLIN2 expression disappears, and LDs are no longer
covered by PLIN2. Therefore, I assume that in the PLIN2-deficient EECs of the area
vasculosa, LDs serve as TG store for VLDL synthesis and secretion. Possibly, removal of
PLIN2 from the LDs somehow alters the accessibility of the LD surface in a way that the
stored TGs within can be utilized for VLDL assembly. Further studies are required to
elucidate the molecular mechanisms regulating this important metabolic switch in terms of
embryo nourishment. Additionally it might be of interest and great importance to test MTTP
gene expression and protein levels in EECs of the area vasculosa and the area vitellina to
get a better understanding of the regulation of VLDL secretion in the chicken YS.

65
PLIN3 was found to be expressed in almost all tissues. It showed very similar but low
expression levels in adipose tissue, liver, and YS. The expression values led to the
conclusion that PLIN3 likely does not play a significant role in controlling lipid metabolism in
the early chicken YS.
Due to lack of chicken PLIN4 and PLIN5 coding sequences, I could not perform any
investigations on these genes and their products. In other species, PLIN4 and PLIN5 are, like
PLIN1, predominantly expressed in adipose tissue. PLIN4 is predominantly involved in long-
time storage of lipids in white adipose tissue (Wolins et al., 2003). As it was also found
associated with small evolving LDs, it might also work in concert together with PLIN2 by
means of building up LDs and maintaining constant lipid storage. PLIN5 was shown to be
expressed predominantly in adipocytes of brown adipose tissue, which has a high rate of β-
oxidation and is required for quick energy access. (Dalen, et al., 2006). Hopefully, avian
PLIN4 and PLIN5 genes, if indeed existing, will be discovered and/or sequenced soon, so
their possible role(s) in lipid storage in the YS can be solved.
The transition from area vitellina to area vasculosa is accompanied by increased metabolism
via lipoprotein secretion, mainly in the form of apoB-containing TG-rich lipoproteins (Bauer et
al., 2012, unpublished data). Additionally, the presence of large cytosolic LDs in the EECs
raised the question whether YS-specific lipid hydrolases/lipases are involved in the
mobilization process of TG-stores in the area vasculosa for subsequent re-esterification and
utilization in VLDL assembly. Therefore, I tested for the presence of a number of TG lipases
that could mediate the rate-determining step of lipolysis. According to findings in literature all
investigated lipases perform TG hydrolyzing actions. LAL, a lipid hydrolyzing enzyme located
in the cell’s lysosomes is able to perform this rate determining step. My investigations at the
mRNA level with qPCR showed the lowest expression values in the area vasculosa tissue.
LAL levels in the area vitellina were more than 4 times higher and levels in the mesodermal
blood vessel layer were 6 times higher. Therefore, LAL is unlikely to be involved in the
mobilization of TG stores for VLDL assembly in the area vasculosa of the chicken YS.
A lipase that has great impact on metabolism of VLDL and chylomicrons in adipose tissue is
LPL. Even though LPL is attached to endothelial membranes I found LPL to be expressed to
the highest extent in the EECs of the area vasculosa and area vitellina. In contrast, protein
levels detected by Western blot confirmed published data, since LPL was only found in
samples of the mesodermal blood vessel layer, thus also excluding LPL as a candidate
lipase.

66
A lipase related to LPL is HTGL (Hide, et al., 1992). It has a great impact on lipoprotein
turnover. However, the expression levels were generally very low. Therefore, this lipase also
is rather unlikely to represent a proper candidate enzyme for this metabolic challenge.
ATGL was found to be one of the rate-determining enzymes in TG breakdown in adipose
tissue (reviewed in Smirnova, et al., 2006). This fact seemed to fit to the results of my
investigation. Expression levels indicated that ATGL may not be the predominant lipase in
the EECs of the area vasculosa. The values in the mesodermal blood vessel layer turned out
to exceed the expression in the EECs. Additionally, the general expression levels were like
the ones for HTGL too low to be distinguished from background signal (Fig. 26). Therefore its
functions also were not considered as crucial for TG hydrolysis in the chicken YS.
PNPLA3, a TG-lipase is, like its protein family member ATGL, highly expressed during
adipocyte differentiation (Baulande, et al., 2001). Nevertheless, it was shown that PNPLA3 is
regulated by complete opposite feeding statuses. Fasting decreased mRNA levels in rats,
whereas ATGL on the other hand was upregulated (Oliver, et al., 2012). The same outcome
was observed in laying hens as mRNA expression of PNPLA3 in the liver was diminished by
fasting and highly increased after refeeding (Riegler, et al., 2011).
PNPLA3 expression levels in this study showed highest values in area vasculosa (Fig. 27).
Only PNPLA3 would be a favorable candidate for further studies on the protein. I assume
that PNPLA3 possibly could play a crucial role in the TG turnover in LDs of the area
vasculosa. As PLIN2 seems to be involved in LD protecting functions in the area vitellina, its
total absence in the area vasculosa could have effects promoting TG-hydrolysis mediated by
PNPLA3. Secretion of TG-rich, apoB-containing VLDL particles (Bauer, et al., 2012,
unpublished data) was recently detected in the EECs of the area vasculosa of the chicken
YS, but not in the area vitellina. PNPLA3 again is supposed to hydrolyze TGs from LDs
which then are re-esterified in the ER and Golgi. These newly synthesized TGs can then be
transferred to apoB during the VLDL maturation process in the secretory pathway (Pirazzi, et
al., 2012). Clearly, more detailed research on PNPLA3 at the protein level has to be done to
reveal its involvement in lipid metabolism. All of the other investigated lipases seem to play
either a minor role concerning lipolysis, mainly based on their low expression levels, or they
are expressed in the metabolically less active area vitellina. Further candidates, probably
involved in TG hydrolysis in the EECs of the chicken YS, may emerge in future studies.

67
5. References
Akter M. H., Y. T. (2008). Perilipin, a critical regulator of fat storage and breakdown, is a
target gene of estrogen receptor-related receptor alpha. Biochem Biophys Res
Commun.368(3):563-568.
Anderson R. A., B. G. (1999). Lysosomal acid lipase mutations that determine phenotype in
Wolman and cholesterol ester storage disease. Mol Genet Metab.68(3):333-345.
Arimura N., H. T. (2004). The peroxisome proliferator-activated receptor gamma regulates
expression of the perilipin gene in adipocytes. J Biol Chem.279(11):10070-10076.
Aslanidis C., R. S. (1996). Genetic and biochemical evidence that CESD and Wolman
disease are distinguished by residual lysosomal acid lipase activity.
Genomics.33(1):85-93.
Bahr, J. M. (2008). The Chicken as a Model Organism from Sourcebook of Models for
Biomedical Research edited by Conn, M., P. Totowa NJ: Humana Press.
Barbero P., B. E. (2001). TIP47 is not a component of lipid droplets. J Biol
Chem.276(26):24348-24351.
Bartz R., Z. J. (2007). Dynamic activity of lipid droplets: protein phosphorylation and GTP-
mediated protein translocation. J Proteome Res.6(8):3256-3265.
Baulande S., L. F. (2001). Adiponutrin, a transmembrane protein corresponding to a novel
dietary- and obesity-linked mRNA specifically expressed in the adipose lineage. J Biol
Chem.276(36):33336-33344.
Bensadoun B. (1999). Lipoprotein lipase. Annu Rev Nutr.:217-237.
Bickel P. E., T. J. (2009). PAT proteins, an ancient family of lipid droplet proteins that
regulate cellular lipid stores. Biochim Biophys Acta.1791(6):419-440.
Blanchette-Mackie E. J., D. N. (1995). Perilipin is located on the surface layer of intracellular
lipid droplets in adipocytes. J Lipid Res.36(6):1211-1226.
Boström P., A. L.-R. (2007). SNARE proteins mediate fusion between cytosolic lipid droplets
and are implicated in insulin sensitivity. Nat Cell Biol.9(11):1286-1293.
68
Boström P., R. M. (2005). Cytosolic lipid droplets increase in size by microtubule-dependent
complex formation. Arterioscler Thromb Vasc Biol.25(9):1945-1951.
Brasaemle D. L., B. T. (1997). Post-translational regulation of perilipin expression.
Stabilization by stored intracellular neutral lipids. J Biol Chem.272(14):9378-9387.
Brasaemle D. L., B. T.-M. (1997). Adipose differentiation-related protein is an ubiquitously
expressed lipid storage droplet-associated protein. J Lipid Res.38(11):2249-2263.
Brasaemle D. L., D. G. (2004). Proteomic analysis of proteins associated with lipid droplets
of basal and lipolytically stimulated 3T3-L1 adipocytes. J Biol Chem.279(45):46835-
46842.
Brown J. M., C. S. (2007). CGI-58 facilitates the mobilization of cytoplasmic triglyceride for
lipoprotein secretion in hepatoma cells. J Lipid Res.48(10):2295-2305.
Brown W. R., H. J. (2003). The chicken as a model for large-scale analysis of vertebrate. Nat
Rev Genet.4(2):87-98.
Bussell R. Jr., E. D. (2003). A structural and functional role for 11-mer repeats in alpha-
synuclein and other exchangeable lipid binding proteins. J Mol Biol.329(4):763-778.
Chang B. H., L. L. (2010). Absence of adipose differentiation related protein upregulates
hepatic VLDL secretion, relieves hepatosteatosis, and improves whole body insulin
resistance in leptin-deficient mice. J Lipid Res.51(8):2132-2142.
Dalen K. T., D. T. (2007). LSDP5 is a PAT protein specifically expressed in fatty acid
oxidizing tissues. Biochim Biophys Acta.1771(2):210-227.
Dalen K. T., S. ..-F. (2004). Adipose tissue expression of the lipid droplet-associating
proteins S3-12 and perilipin is controlled by peroxisome proliferator-activated
receptor-gamma. Diabetes.53(5):1243-1252.
Datta S, L. C. (1988). Human hepatic lipase. Cloned cDNA sequence, restriction fragment
length polymorphisms, chromosomal localization, and evolutionary relationships with
lipoprotein lipase and pancreatic lipase. J Biol Chem.263(3):1107-1110.
Díaz E., P. S. (1998). TIP47: a cargo selection device for mannose 6-phosphate receptor
trafficking. Cell.93(3):433-443.
Du H., C. T. (2008). Wolman disease/cholesteryl ester storage disease: efficacy of plant-
produced human lysosomal acid lipase in mice. J Lipid Res.9(8):1646-1657.

69
Du H., H. M. (2001). Lysosomal acid lipase-deficient mice: depletion of white and brown fat,
severe hepatosplenomegaly, and shortened life span. J Lipid Res.42(4):489-500.
Du H., W. D. (1996). Tissue and cellular specific expression of murine lysosomal acid lipase
mRNA and protein. J Lipid Res.37(5):937-949.
Dugi K. A., D. H.-F. (1995). Human hepatic and lipoprotein lipase: the loop covering the
catalytic site mediates lipase substrate specificity. J Biol Chem.270(43):25396-25401.
Edvardsson U., L. A.-O.-S. (2006). PPARalpha activation increases triglyceride mass and
adipose differentiation-related protein in hepatocytes. J Lipid Res.47(2):329-340.
Ehehalt R., F. J. (2006). Translocation of long chain fatty acids across the plasma
membrane--lipid rafts and fatty acid transport proteins. Mol Cell Biochem.284(1-
2):135-140.
Fujimoto Y., I. H. (2004). Identification of major proteins in the lipid droplet-enriched fraction
isolated from the human hepatocyte cell line HuH7. Biochim Biophys
Acta.1644(1):47-59.
Fujimoto Y., I. H. (2007). Involvement of ACSL in local synthesis of neutral lipids in
cytoplasmic lipid droplets in human hepatocyte HuH7. J Lipid Res.48(6):1280-1292.
Gao J., Y. H. (2000). Stimulation of adipose differentiation related protein (ADRP) expression
in adipocyte precursors by long-chain fatty acids. J Cell Physiol.182(2):297-302.
Garcia A., S. A. (2003). The central domain is required to target and anchor perilipin A to lipid
droplets. J Biol Chem.278(1):625-35.
Goldstein J. L., D. S. (1975). Role of lysosomal acid lipase in the metabolism of plasma low
density lipoprotein. Observations in cultured fibroblasts from a patient with cholesteryl
ester storage disease. J Biol Chem.250(21):8487-8495.
Greenberg A. S., E. J. (1993). Isolation of cDNAs for perilipins A and B: sequence and
expression of lipid droplet-associated proteins of adipocytes. Proc Natl Acad Sci U S
A.;90(24):12035-12039.
Greenberg A. S., E. J.-M. (1991). Perilipin, a major hormonally regulated adipocyte-specific
phosphoprotein associated with the periphery of lipid storage droplets. J Biol
Chem.266(17):11341-11346.
Guo Y., C. K. (2009). Lipid droplets at a glance. J Cell Sci.122(Pt 6):749-752.

70
Guo Y., W. T. (2008). Functional genomic screen reveals genes involved in lipid-droplet
formation and utilization. Nature.453(7195):657-661.
Hammersen F., H. F. (1985). Histology, color atlas of microscopic anatomy. Urban &
Schwartzenberg, Baltimore 2nd ed.
Hickenbottom S. J., K. A. (2004). Structure of a lipid droplet protein; the PAT family member
TIP47. Structure.12(7):1199-1207.
Hide W. A., C. L. (1992). Structure and evolution of the lipase superfamily. J Lipid
Res.33(2):167-178.
Huang Y., H. S. (2010). A feed-forward loop amplifies nutritional regulation of PNPLA3. Proc
Natl Acad Sci U S A.107(17):7892-7897.
Jenkins C. M., M. D. (2004). Identification, cloning, expression, and purification of three novel
human calcium-independent phospholipase A2 family members possessing
triacylglycerol lipase and acylglycerol transacylase activities. J Biol
Chem.279(47):48968-48975.
Jiang H. P., S. G. (1992). Isolation and characterization of a full-length cDNA coding for an
adipose differentiation-related protein. Proc Natl Acad Sci U S A.89(17):7856-7860.
Kershaw E. E., H. J. (2006). Adipose triglyceride lipase: function, regulation by insulin, and
comparison with adiponutrin. Diabetes.55(1):148-157.
Kinnunen P. K., J. R. (1977). Activation of lipoprotein lipase by native and synthetic
fragments of human plasma apolipoprotein C-II. Proc Natl Acad Sci U S
A.74(11):4848-4851.
Komiyama T., K. I. (2004). Japanese domesticated chickens have been derived from Shamo
traditional fighting cocks. Mol Phylogenet Evol.33(1):16-21.
Ladjali-Mohammedi K, B. J.-B. (1999). International system for standardized avian
karyotypes (ISSAK): standardized banded karyotypes of the domestic fowl (Gallus
domesticus). Cytogenet Cell Genet.86(3-4):271-276.
Lass A., Z. R. (2006). Adipose triglyceride lipase-mediated lipolysis of cellular fat stores is
activated by CGI-58 and defective in Chanarin-Dorfman Syndrome. Cell
Metab.3(5):309-319.
Liu P., B. R. (2007). Rab-regulated interaction of early endosomes with lipid droplets.
Biochim Biophys Acta.1773(6):784-793.

71
Liu P., B. R. (2008). Rab-regulated membrane traffic between adiposomes and multiple
endomembrane systems. Methods Enzymol.439:327-337.
Londos C., B. D. (1999). Perilipins, ADRP, and other proteins that associate with intracellular
neutral lipid droplets in animal cells. Semin Cell Dev Biol.10(1):51-58.
Magnusson B., A. L.-B. (2006). Adipocyte differentiation-related protein promotes fatty acid
storage in cytosolic triglycerides and inhibits secretion of very low-density
lipoproteins. Arterioscler Thromb Vasc Biol.26(7):1566-1571.
Martin S., P. R. (2006). Lipid droplets: a unified view of a dynamic organelle. Nat Rev Mol
Cell Biol.7(5):373-378.
Martinez-Botas J, A. J. (2000). Absence of perilipin results in leanness and reverses obesity
in Lepr(db/db) mice. Nat Genet.26(4):474-479.
Mobbs I. G., M. D. (1981). Transport across endodermal cells of the chick yolk sac during
early stages of development. Am J Anat.;160(3):285-308.
Nakamura N., F. T. (2003). Adipose differentiation-related protein has two independent
domains for targeting to lipid droplets. Biochem Biophys Res Commun.;306(2):333-
338.
Nakazawa F., C. A. (2011). Yolk Sac Endoderm Is the Major Source of Serum Proteins and
Lipids and Is Involved in the Regulation of Vascular Integrity in Early Chick
Development. Dev Dyn.240(8):2002-2010.
Ohsaki Y., M. T.-S. (2006). Recruitment of TIP47 to lipid droplets is controlled by the putative
hydrophobic cleft. Biochem Biophys Res Commun.347(1):279-287.
Oliver P., C. A.-R. (2012). Diet-induced obesity affects expression of adiponutrin/PNPLA3
and adipose triglyceride lipase, two members of the same family. Int J Obes
(Lond).36(2):225-232.
O'Sullivan N. P., D. E. (1991). Relationships among age of dam, egg components, embryo
lipid transfer, and hatchability of broiler breeder eggs. Poult. Sci.70.:2180–2185.
Pasteur, L. (1880). The attenuation of the causal agent of fowl cholera. Les Comptes Rendus
de l'Académie des sciences; Vol. 91:637-680.
Paul A., C. B. (2008). Deficiency of adipose differentiation-related protein impairs foam cell
formation and protects against atherosclerosis. Circ Res.102(12):1492-1501.

72
Pilch P. F., S. R. (2007). Cellular spelunking: exploring adipocyte caveolae. J Lipid
Res.(10):2103-2111.
Pirazzi C., A. M.-M. (2012). Patatin-like phospholipase domain-containing 3 (PNPLA3) I148M
(rs738409) affects hepatic VLDL secretion in humans and in vitro. J Hepatol. pii:
S0168-8278(12)00606-X. doi: 10.1016/j.jhep.2012.07.030.
Ploegh, H. (2007). A lipid-based model for the creation of an escape hatch from the
endoplasmic reticulum. Nature.448(7152):435-438.
Riegler B., B. C. (2011). Enzymes involved in hepatic acylglycerol metabolism in the chicken.
Biochem Biophys Res Commun.406(2):257-261.
Rydel T. J., W. J. (2003). The crystal structure, mutagenesis, and activity studies reveal that
patatin is a lipid acyl hydrolase with a Ser-Asp catalytic dyad.
Biochemistry.42(22):6696-6708.
Saito H., D. P.-K. (2001). Lipid binding-induced conformational change in human
apolipoprotein E. Evidence for two lipid-bound states on spherical particles. J Biol
Chem.;276(44):40949-40954.
Santamarina-Fojo S., H. C. (2000). Role of hepatic and lipoprotein lipase in lipoprotein
metabolism and atherosclerosis: studies in transgenic and knockout animal models
and somatic gene transfer. Int J Tissue React.22(2-3):39-47.
Sato K., A. Y. (1999). Lipoprotein hydrolysis and fat accumulation in chicken adipose tissues
are reduced by chronic administration of lipoprotein lipase monoclonal antibodies.
Poult Sci.78(9):1286-1291.
Schaffer, J. (2003). Lipotoxicity: when tissues overeat. Curr Opin Lipidol.14(3):281-287.
Scherer P. E., B. P. (1998). Cloning of cell-specific secreted and surface proteins by
subtractive antibody screening. Nat Biotechnol.16(6):581-586.
Schmuth M., H. C.-Q. (2004). Peroxisome proliferator-activated receptor (PPAR)-beta/delta
stimulates differentiation and lipid accumulation in keratinocytes. J Invest
Dermatol.122(4):971-983.
Servetnick D. A., B. D.-G. (1995). Perilipins are associated with cholesteryl ester droplets in
steroidogenic adrenal cortical and Leydig cells. J Biol Chem.270(28):16970-16973.
Sheng G. (2010). Primitive and definitive erythropoiesis in the yolk sac: a bird’s eye view. Int.
J. Dev. Biol. 54:1033-1043.

73
Smirnova E., G. E. (2006). ATGL has a key role in lipid droplet/adiposome degradation in
mammalian cells. EMBO Rep.7(1):106-113.
Speake B. K., M. A. (1998). Transport and transformations of yolk lipids during development
of the avian embryo. Prog Lipid Res 37:1-32.
Stern C. D. (2005). The chick: A great model system becomes even greater. Dev Cell.8(1):9-
17.
Sturmey R. G., O. P. (2006). Fluorescence resonance energy transfer analysis of
mitochondrial:lipid association in the porcine oocyte. Reproduction.132(6):829-837.
Subramanian V., G. A. (2004). Hydrophobic sequences target and anchor perilipin A to lipid
droplets. J Lipid Res.45(11):1983-1991.
Sztalryd C., B. M. (2006). Functional compensation for adipose differentiation-related protein
(ADFP) by Tip47 in an ADFP null embryonic cell line. J Biol Chem.281(45):34341-
34348.
Tauchi-Sato K., O. S. (2002). The surface of lipid droplets is a phospholipid monolayer with a
unique Fatty Acid composition. J Biol Chem.277(46):44507-44512.
Turró S., I.-T. M. (2006). Identification and characterization of associated with lipid droplet
protein 1: A novel membrane-associated protein that resides on hepatic lipid droplets.
Traffic.7(9):1254-1269.
Vieira S. L., a. E. (1998). Broiler Yields Using Chicks from Egg Weight Extremes and Diverse
Strains. J. Appl. Poult. Res.7:372–376.
Villena J. A., R. S.-N. (2004). Desnutrin, an adipocyte gene encoding a novel patatin domain-
containing protein, is induced by fasting and glucocorticoids: ectopic expression of
desnutrin increases triglyceride hydrolysis. J Biol Chem.279(45):47066-47075.
Walther T. C., F. R. (2008). The life of lipid droplets. Biochim Biophys Acta.1791(6):459-466.
Wang H., B. M. (2011). Unique regulation of adipose triglyceride lipase (ATGL) by perilipin 5,
a lipid droplet-associated protein. J Biol Chem.286(18):15707-15715.
Wolins N. E., Q. B. (2005). S3-12, Adipophilin, and TIP47 package lipid in adipocytes. J Biol
Chem.280(19):19146-19155.
Wolins N. E., Q. B.-B. (2006). OXPAT/PAT-1 is a PPAR-induced lipid droplet protein that
promotes fatty acid utilization. Diabetes.55(12):3418-3428.

74
Wolins N. E., R. B. (2001). TIP47 associates with lipid droplets. J Biol Chem.276(7):5101-
5108.
Wolins N. E., S. J. (2003). Adipocyte protein S3-12 coats nascent lipid droplets. J Biol
Chem.278(39), S. 37713-37721.
Xu G., S. C. (2005). Post-translational regulation of adipose differentiation-related protein by
the ubiquitin/proteasome pathway. J Biol Chem.280(52):42841-42847.
Xu G., S. C. (2006). Degradation of perilipin is mediated through ubiquitination-proteasome
pathway. Biochim Biophys Acta.;1761(1):83-90.
Yamaguchi T., O. N. (2004). CGI-58 interacts with perilipin and is localized to lipid droplets.
Possible involvement of CGI-58 mislocalization in Chanarin-Dorfman syndrome. J
Biol Chem.279(29):30490-30497.
Zhang L., L. A. (2005). Calcium triggers folding of lipoprotein lipase into active dimers. J Biol
Chem.280(52):42580-42591.
Zimmermann R., S. J.-G. (2004). Fat mobilization in adipose tissue is promoted by adipose
triglyceride lipase. Science.306(5700):1383-1386.

75
6. List of abbreviations
A
α alpha, anti
APS ammonium persulfate
AMP ampicillin
ATGL adipose triglyceride lipase
ATP adenosine tri-phosphate
apoE apolipoprotein E
apoB apolipoprotein B
au arbitrary units
B
bp basepairs
BODIPY boron-dipyrromethene
BAT brown adipose tissue
BSA bovine serume albumine
C
CE cholesteryl ester
CM chylomicrons
CaCl2 calcium chloride
C-terminus carboxy-terminus
CCT cytidylyltransferase
cAMP cyclic adenosine mono-phosphate
CGI-58 Comparative Gene Identification-58

76
CDS Chanarin Dorfman Syndrome
CESD cholesterol ester storage disease
ChCl3 chloroform
CoA Coenzyme A
D
DNA deoxyribonucleic acid
DTT dithiotreitol
DAPI 4',6-diamidino-2-phenylindole
DGAT diacyglycerol acyltransferase
dNTP deoxyribonucleotide triphosphates
ddH2O double deionized water
E
ECL enhanced chemiluminescence
ER endoplasmatic reticulum
EEC endodermal epithelial cell
ERRα estrogen receptor-related receptor alpha
E.coli Escherichia coli
EDTA ethylenediaminetetraacetic acid
EGFP enhanced green fluorescent protein
EtOH ethanol
F
FFA free fatty acid
G
gg gallus gallus

77
g gram
GAPDH glyceraldehyde 3-phosphate dehydrogenase
xg gravity
H
HDL high density lipoprotein
HRP horseradish peroxidase
h hour
HTGL hepatic triglyceride lipase
HCL hydrogen chloride
I
IgG immuneglobuline G
K
kDa kilo Dalton
kg kilo gram
KCl potassium chloride
Kan Kanamycin
L
LDL low density lipoprotein
LDLR low density lipoprotein receptor
LPL lipoprotein lipase
LAL lysosomal acid lipase
LH laying hen
LD lipid droplet

78
M
µ micro
mM millimolar
mA milliampere
mRNA messenger ribonucleic acid
MTTP microsomal triglyceride transfer protein
M6P mannose 6-phosphate receptor
MeOH methanol
MgCl2 magnesium chloride
N
nm nanometer
N-terminus amino terminus
NAFL non-alcoholic fatty liver disease
NaCl sodium cloride
O
O/N overnight
OD optical density
P
RT-PCR reverse transcriptase polymerase chain reaction
qPCR quantitative real time PCR
PBS phosphate-buffered saline
PAA polyacrylamide
PAGE polyacrylamide gel electrophoresis
PPAR peroxisome proliferator-activated receptor

79
PNPLA3 patatin-like phospholipase domain-containing protein
PKA protein kinase A
PAT Perilipin, ADRP, TIP47
R
R/T room temperature
rpm revolutions per minute
RNA ribonucleic acid
S
SDS sodium dodecyl sulphate
SNARE soluble NSF attachment protein receptor
siRNA small interfering ribonucleic acid
S.E.M. standard error of the mean
T
TG triglyceride
TEMED Tetramethylethylenediamine
TBS tris buffered saline
TAE tris, acetic acid and EDTA
U
UV ultraviolet
V
VLDL very-low density lipoprotein
W

80
WD Wolman’s disease
WAT white adipose tissue
w/v weight per volume
X
X-Gal 5-bromo-4-chloro-indolyl-β-D-galactopyranoside
Y
YS yolk sac

81
Abstract
The chicken is a very important model organism. It belongs, like all other birds, reptiles, and
amphibians to the group of oviparous animals that lay eggs, resulting in an almost completely
separated embryonic development outside the mother’s body. Therefore, especially the
chicken embryo is very suitable for developmental and nutritional studies. The chicken yolk
sac (YS) of the developing embryo plays a crucial role in nutrient transfer processes. It
functions as a kind of digestive system to provide the embryo with nutrients taken up from
the YS-enclosed yolk. It is built up by 2 different cell types. The bottom layer, which is in
direct contact to the yolk, consists of an epithelium of endodermal cells which take up
essential components provided by the yolk. On top of these endodermal epithelial cells
(EECs) lies a mesodermal layer, comprising a blood vessel layer endothelium that transports
mobilized nutrients to the developing embryo. With ongoing development, the mesodermal
blood vessel layer overgrows and covers the entire EEC layer, in this state named area
vasculosa. However, in the first few days after egg deposition the YS contains a significant
part of uncovered EECs, which is called area vitellina.
In this study I found that the EECs of the area vitellina are of great importance for
intracellular lipid storage in cellular organelles called lipid droplets (LDs). The large amounts
of lipids, retained for later mobilization to the embryo, are packaged in phospholipid
monolayer-enclosed spherical LDs. They consist of neutral lipids, such as triglycerides (TGs)
and cholesteryl esters (CEs).
The mRNA level, measured by qPCR, of PLIN2 (also called ADRP), a member of a family of
LD-associated proteins (the PLINs), was found to be particularly high in the chicken YS.
Interestingly, I observed high levels in the unvascularized EECs of the area vitellina, but not
in the developmentally advanced vascularized area (the area vasculosa). In many
mammalian species PLIN2, not yet demonstrated in the chicken, was found to be associated
with nascent LDs and involved in lipid storage. Expression of other PLINs could not be
detected in this study.
Using Western blotting technique, the protein levels of PLIN2 were determined. The results
also point to an important role in the storage of the huge amounts of LDs in the EECs of the
area vitellina. The direct association of PLIN2 to the LDs of the EECs of the area vitellina
could be visualized by anti-PLIN2 immuno-staining of the area vitellina EECs and
subsequent confocal microscopy.
82
After detecting PLIN2, a very potent protein concerning the intracellular storage of neutral
lipids, I attempted to reveal how these lipids could be utilized for embryonic nutrition. I
searched for (a) lipid hydrolyzing enzyme(s) with specificity for TG hydrolysis, as this is the
starting point for degradation of stored lipids. I investigated various TG hydrolyzing enzymes
at the mRNA level with qPCR, and could indeed detect one. The candidate is a membrane
bound enzyme called Patatin-like phospholipase domain-containing protein (PNPLA3).
Indeed, evidence for a role in TG hydrolysis in the YS for PNPLA3 is provided by showing
increased expression rates in the area vasculosa, i.e., the metabolically more active tissue.
The area vasculosa is very likely also the region from which the nutrients are delivered via
the mesodermal blood vessels to the embryo.

83
Zusammenfassung
Das Haushuhn ist ein sehr wichtiger Modellorganismus. Es gehört, wie alle Vogelarten,
Amphibien und Reptilien zu der Gruppe von oviparen Tieren, die Eier legen und bei denen
somit beinahe die gesamte Embryonalentwicklung außerhalb des Muttertiers stattfindet.
Daher ist besonders das Haushuhn im embryonalen Status für entwicklungsbiologische
Studien geeignet. Der Dottersack des sich entwickelnden Embryos spielt dabei in
Nahrungstransportprozessen eine tragende Rolle. Der Dottersack arbeitet als eine Form von
Verdauungssystem, das Nährstoffe aus dem vom Dottersack umschlossenen Dotter
aufnimmt. Der Dottersack ist aus 2 unterschiedlichen Zelltypen aufgebaut. Die untere, dem
Dotter zugewandte Schicht, besteht aus einem Epithel aus endodermalen Zellen. Diese
nehmen für den Embryo essentielle Nährstoffe aus dem Dotter auf. Direkt den endodermalen
Epithelzellen aufsitzend befindet sich die zweite Zellschicht, die mesodermale Schicht aus
einem Blutgefäß-Endothel, das Nährstoffe zum Embryo hin transportiert. Mit fortschreitender
Entwicklung wird durch das Überwachsen der endodermalen Epithelschicht von dem
mesodermalen Endothel die sogenannte area vasculosa gebildet. Jedoch enthält der
Dottersack in den ersten Tagen nach der Eiablage große Bereiche von endodermalen
Epithelzellen, die nicht von dem mesodermalen Endothel überzogen sind, welche als area
vitellina bezeichnet werden.
In dieser Studie fand ich heraus, dass die endodermalen Epithelzellen der area vitellina
einen großen Einfluss auf die intrazelluläre Fettspeicherung in sogenannten lipid droplets
(LDs) haben. Diese Organellen, für die Versorgung des Embryos bereitgestellt, beinhalten
zum Großteil neutrale Fette, wie Triglyzeride und Cholesterinester, und sind von einer
Phospholipid Monoschicht begrenzt.
Ich entdeckte mit Hilfe von qPCR, dass der mRNS Spiegel von PLIN2, einem Mitglied einer
LD-assoziierten Protein Familie, der perilipins (PLINs), im Dottersack stark erhöht war.
Interessanterweise wiesen die nicht-vaskularisierten endodermalen Epithelzellen der area
vitellina, und nicht die vaskularisierten Zellen der area vasculosa, erhöhte Expressionswerte
auf. Bisher wurden im Modellorganismus Haushuhn die genauen Funktionen von PLIN2
noch nicht beschrieben. In Säugetieren hingegen wurde herausgefunden, dass PLIN2 an
wachsende LDs bindet und von großer Wichtigkeit in der Fettspeicherung ist. Andere PLINs
konnten in meinen Untersuchungen nicht detektiert werden.
Mit Hilfe der Western blot Technik konnte ich PLIN2 auch auf Proteinebene in der area
vitellina nachweisen. Dies lässt auf eine wichtige Funktion von PLIN2 in der Fettspeicherung

84
schließen. Die direkte Assoziation von PLIN2 mit LDs konnte ich in der area vitellina mit
einem α-PLIN2 Antikörper mittels Immunofärbung und Konfokalmikroskopie nachweisen.
Nachdem ich das Protein, welches mit großer Wahrscheinlichkeit für die Fettspeicherung im
Dottersack verantwortlich ist, gefunden hatte, wollte ich herausfinden, wie die Lipide für
Verwertung durch den Embryo mobilisiert werden können. Ich suchte nach einem Lipid-
hydrolysierendem Enzym, das eine Spezifität für Triglyzerid-Spaltung hat, da dies der
Ausgangspunkt für den Abbau von gespeicherten Fetten ist. Ich untersuchte die mRNS von
mehreren Triglyzeridspaltenden Enzymen, und konnte tatsächlich eines, mit der
Bezeichnung Patatin-like phospholipase domain-containing protein (PNPLA3), entdecken.
Die höchsten PNPLA3 mRNS Spiegel wurden in den metabolisch aktiven Zellen der area
vasculosa gemessen, also genau dort, von wo aus mit Hilfe der mesodermalen Blutgefäße
Nährstoffe zum Embryo transportiert werden.

85
Acknowledgements
Jetzt, da meine Studienzeit zu Ende geht, muss ich unweigerlich einen Blick zurück auf das
bisher erlebte und geleistete werfen. Noch sehr nahe scheint der Tag, an dem ich mich
entschieden habe Biologie zu studieren und bis heute kann ich mit Gewissheit sagen, dass
es die richtige Entscheidung war. Nachdem die anfängliche positive Nervosität, die „das
Neue“ meist mit sich bringt verflogen war, hieß es sich auf den anspruchsvollen Studienalltag
einzustellen. Doch auch dieser erwies sich stets als sehr abwechslungsreich und interessant
für mich, nicht zuletzt auch wegen der vielen netten und guten Bekanntschaften die ich in
den letzten Jahren gemacht habe.
Lange Rede kurzer Sinn: Ich habe die Studienzeit sehr genossen und würde im Nachhinein
nichts ändern, auch wenn man nachher immer etwas schlauer ist und man hier und da
vielleicht noch etwas mehr hätte lernen können. ;)
Doch all die wunderbaren Erfahrungen wären nicht möglich gewesen, wenn ich nicht die
volle Unterstützung meiner Eltern gehabt hätte und damit meine ich nicht nur die
Unterstützung mit der Bewältigung der nicht unerheblichen Unkosten eines Studiums.
Besonders das Gefühl, in einem zu Hause zu leben, in dem man immer willkommen ist,
bedeutet mir sehr viel. Hierbei möchte ich auch meine Schwester erwähnen, die mich immer
durch ihre fröhliche und warmherzige Natur beeindruckt hat und mir so manches Mal mit
guten Gesprächen weitergeholfen hat.
Verbunden mit dieser Master-Arbeit, möchte ich meinem offiziellen Betreuer Prof. Dr.
Wolfgang J. Schneider danken, der mir die Möglichkeit gegeben hat, in so einem
interessanten Forschungsgebiet Erfahrungen zu sammeln. Nie hätte ich mir vor dieser
Laborarbeit gedacht, dass ich je einmal an G. gallus domesticus forschen würde. Um jedoch
überhaupt präsentierbare Ergebnissen hervorzubringen, war im Labor besonders mein
direkter Ansprechpartner Raimund von unschätzbarem Wert. Als hätte er nicht schon selbst
genug mit seiner Doktorarbeit zu tun, war er immer voller neuer Ideen und hatte stets ein
offenes Ohr für etwaige Anliegen und neue Vorschläge. Zusätzlich möchte ich noch kurz alle
anderen lieben Leute aus dem Nimpf, Schneider und Hermann Labor nennen, die ebenfalls
dazu beigetragen haben, dass die Laborarbeit stets positiv in Erinnerung bleiben wird.
Nicht zuletzt möchte ich auch meine Freundin Ines erwähnen, die mir immer wieder, in
teilweise stressvollen Situationen zur Seite steht und mit der ich auch sonst immer schöne
Zeiten verbringe.

86
Curriculum Vitae
Thomas Finkes
Personal Data
Name Thomas Finkes
Address Hauptstrasse 43a, 3422 Altenberg, Niederösterreich
Date of Birth April 3rd, 1986
Place of Birth Vienna, Austria
Nationality Austria
Education
10/2011 – 06/2012 Medical University of Vienna/MFPL/University of Vienna
Master thesis Department of Medical Biochemistry, Division of Molecular Genetics,
Lab of o. Univ. Prof. Dr. Wolfgang J. Schneider
Title: “Molecular characterization of lipid droplet associated proteins in
the chicken yolk sac”
03/2010 – University of Vienna
Master of Science in Molecular Biology, Faculty of Life Sciences with
main focus on Molecular Medicine
10/2006 – 02/2010 University of Vienna
Bachelor of Science in Microbiology and Genetics, Faculty of Life
Sciences
09/1997 – 05/2005 Bundesgymnasium/Bundesrealgymnasium Klosterneuburg
Main focus on Natural Sciences

87
Additional skills
Languages German: Native language
English: Proficient
Spanish: Basic knowledge
Computer skills Windows XP and 7: MS Office
Online biological databases (PubMed, Ensembl, EMBOSS, Ebi)
Basic skills with Adobe Photoshop
Employments University of Vienna, Department of Chromosome Biology, Lab of
Univ.-Prof. Dr. Franz Klein; Laboratory technician, 10/2008-10/2011
Poster Raimund Bauer, Thomas Finkes, and Wolfgang J. Schneider.
Lipoprotein Transport in the yolk sac. 19th annual meeting of the
Austrian Atherosclerosis Society; St. Gilgen 2012.


![Identification of a New Class of Lipid Droplet-Associated et al. PP201… · Identification of a New Class of Lipid Droplet-Associated Proteins in Plants1[C][W] ... studies of lipid](https://img.pdfslide.us/doc/110x75/60629f17cf403418bc3e8b96/identiication-of-a-new-class-of-lipid-droplet-associated-et-al-pp201-identiication.jpg)