Embed Size (px)
Citation preview

MOLECULAR CHARACTERIZATION OF EST
MICROSATELLITES AND ANALYSIS OF POPULATION
GENETIC STRUCTURE IN STRIPED SNAKEHEAD FISH,
CHANNA STRIATA
SARA TAKALLOO
DISSERTATION SUBMITTED IN FULFILLMENT OF
THE REQUIREMENTS FOR THE DEGREE OF
MASTER OF BIOTECHNOLOGY
INSTITUTE OF BIOLOGICAL SCIENCES
FACULTY OF SCIENCE
UNIVERSITY OF MALAYA
KUALA LUMPUR
2014
ii
UNIVERSITI MALAYA
ORIGINAL LITERARY WORK DECLARATION
Name of Candidate: SARA TAKALLO I/C/Passport No: L18556081
Regisration/Matric No.: SGF110020
Name of Degree: MASTER OF BIOTECHNOLOGY
Title of Project Paper/Research Report/Dissertation/Thesis (“this Work”):
“MOLECULAR CHARACTERIZATION OF EST MICROSATELLITE AND ANALYSIS
OF POPULATION GENETIC STRUCTURE IN STRIPED SNAKEHEAD FISH, CHANNA
STRIATA”
Field of Study: BIOTECHNOLOGY
I do solemnly and sincerely declare that:
(1) I am the sole author/writer of this Work,
(2) This Work is original,
(3) Any use of any work in which copyright exists was done by way of fair dealing and for permitted
purposes and any excerpt or extract from, or reference to or reproduction of any copyright work
has been disclosed expressly and sufficiently and the title of the Work and its authorship have
been acknowledged in this Work,
(4) I do not have any actual knowledge nor do I ought reasonably to know that the making of this
work constitutes an infringement of any copyright work,
(5) I hereby assign all and every rights in the copyright to this Work to the University of Malaya
(“UM”), who henceforth shall be owner of the copyright in this Work and that any reproduction
or use in any form or by any means whatsoever is prohibited without the written consent of UM
having been first had and obtained,
(6) I am fully aware that if in the course of making this Work I have infringed any copyright whether
intentionally or otherwise, I may be subject to legal action or any other action as may be
determined by UM.
(Candidate Signature) Date:
Subscribed and solemnly declared before,
Witness’s Signature Date:
Name ASSOC. PROF. DR SUBHA BHASSU
Designation

iii
ABSTRACT
The Striped snakehead fish, Channa striata is a freshwater air breathing fish species
indigenous to Malaysia. It is locally known in Malaysia as Haruan. Channa striata is
economically playing a major role in the aquaculture and fisheries industries. Channa striata
is important especially as a food source in South East Asia. It has been broadly used for
medical and pharmaceutical purposes due to its therapeutic and recuperative qualities.
Among the many DNA marker systems available, EST microsatellites have a number of
advantages due to its high level of transferability, high reproducibility, codominant
inheritance and low cost for development compared to other molecular markers.
The present study employed 20 EST microsatellites designed from RNA transcriptome
sequencing. Out of the 15 loci which were able to be amplified, four loci were found to be
polymorphic. The polymorphic EST-SSR loci were applied to investigate the level of genetic
variation and differentiation of four geographical populations of C.striata. The populations
involved in this study included Johor, Kedah, Pahang and Sarawak.
The number of alleles per locus ranged from one to five. The highest value of heterozygosity
was observed in Pahang population, while the lowest value corresponded to Kedah. No
evidence of significant deviation from Hardy Weinberg Equilibrium was detected in all
populations. There was no pattern on linkage among specific pairs of loci at all sites
indicating no physical linkage is likely to be present among the loci analyzed. The value of
population pair-wise Fst in this study indicates significant differentiation among populations.
Kedah and Pahang are the most similar populations whereas Sarawak and Johor are the most
different populations among them.

iv
Cross-species amplifications of C.striata primers were conducted on 10 species including
Amblyrhynchicthy truncates, Barbichthys laevis, Barbonymus chwanenfeldii, Cirrhinus
caudimaculatus, Hypsibarbus wetmorei, Osteochilus hasselti, Thynnichthys thynnoides,
Pangasius nasutus, Hampala macrolepidota and Channa micropeltes. Out of the 10 species
employed in cross-species amplification, Channa micropeltes was the only species in which
the primers could work well. Among the 15 primers amplified in Channa striata, only 11
primers produced distinct and clear bands in Channa micropeltes. Seven out of these 11
primers could detect the same repeats indicating these primers were conserved in C.striata
and C.micropeltes, which belong to the same family. This conservation of microsatellites can
save time and cost in other Channidae family members since it is not necessary to develop
microsatellite markers for each species.

v
ABSTRAK
Ikan ‘Striped snakehead’, Channa striata ialah sejenis ikan air tawar penghirup udara yang
merupakan spesies asli di Malaysia. Ia juga dikenali oleh penduduk tempatan di Malaysia
sebagai ‘Haruan’. Dari segi ekonomi, Channa striata memainkan peranan utama dalam
akuakultur dan industri perikanan. Channa striata adalah penting terutamanya sebagai
sumber makanan di Asia Tenggara. Ia telah digunakan secara meluas untuk tujuan perubatan
dan farmaseutikal disebabkan kualiti terapeutik dan penyembuhan yang dimilikinya. Di
antara kebanyakan sistem penanda (marker) DNA yang wujud, mikrosatelit EST mempunyai
beberapa kelebihan kerana tahap pemindahannya yang tinggi, kebolehulangan yang tinggi,
kodominan serta kos pembangunan yang rendah berbanding dengan penanda molekular yang
lain.
Kajian ini menggunakan 20 mikrosatelit EST yang direka dari jujukan transkriptom RNA.
Daripada 15 lokus yang dapat diamplifikasikan, 4 lokus didapati polimorfik. Lokus EST-
SSR polimorfik ini telah dimanfaatkan untuk mengkaji tahap variasi dan pembezaan gen
dalam populasi C.striata. Antara populasi yang terlibat dalam kajian ini termasuklah dari
Johor, Kedah, Pahang dan Sarawak.
Bilangan alel per lokus adalah dari 1 hingga 5. Nilai tertinggi heterozigositi dapat dilihat
dalam populasi Pahang manakala nilai terendah dalam populasi Kedah. Tiada bukti yang
menunjukkan keseimbangan Hardy Weinberg dikesan dalam semua populasi. Tidak ada
corak pada hubungan antara pasangan lokus tertentu di semua tapak menunjukkan bahawa
tiada hubungan fizikal yang mungkin hadir antara lokus yang dianalisis. Nilai Fst secara
berpasangan di kalangan populasi dalam kajian ini menunjukkan perbezaan yang signifikan

vi
di kalangan populasi. Populasi Kedah dan Pahang adalah yang paling serupa manakala
populasi Sarawak dan Kedah adalah yang paling berbeza di antara semua.
Amplifikasi spesies-silang primer C. striata telah dijalankan pada 10 spesies termasuk
Amblyrhynchicthy truncates, Barbichthys laevis, Barbonymus chwanenfeldii, Cirrhinus
caudimaculatus, Hypsibarbus wetmorei, Osteochilus hasselti, Thynnichthys thynnoides,
Pangasius nasutus, Hampala macrolepidota dan Channa micropeltes. Daripada 10 spesies
tersebut yang digunakan dalam amplifikasi spesies-silang, Channa micropeltes merupakan
satu-satunya spesies yang primernya boleh berfungsi dengan baik. Antara 15 primer yang
diamplifikasikan dalam Channa striata, hanya 11 primer menghasilkan jalur yang berbeza
dan jelas dalam Channa micropeltes. Tujuh daripada 11 ini primer dapat mengesan jujukan
berulang yang sama, menunjukkan bahawa primer ini telah dipulihara dengan tingginya
dalam C.striata dan C.micropeltes yang tergolong dalam keluarga yang sama. Pemuliharaan
mikrosatelit ini boleh menjimatkan masa dan kos dalam keluarga channidae yang lain kerana
tidak perlu lagi untuk membangunkan mikrosatelit untuk setiap spesies.

vii
ACKNOWLEDGEMENTS
The success and final outcome of this project required a lot of guidance and assistance from
many people and I am extremely fortunate to have got this all along the completion of my
project work. Whatever I have done is only due to such guidance and assistance and I would
not forget to thank them.
First and for most, I owe particular thanks to my supervisor Dr. Subha Bhassu for the valuable
guidance and advise. She inspired me greatly to work in my project. Her willingness to
motivate us contributed tremendously to our project.
Besides, I would like to thank the authority of University of Malaya (UM) for providing us
with a good environment and facilities. Also, I would like to take this opportunity to thank
my lab mates, Saras, Shaun, Ila, Mahtab, Fatin, Rama, Ayu, Farhana and Suma for providing
me with valuable information as the guidance of my practical work and project.
I would like to sincerely acknowledge, respect and thank Dr. Nazia for her constant
encouragement, support and guidance.I am also grateful to Farhat Avin who ably assisted me
in every aspect of my project. I would also like to heartfelt thanks to my best friends Nazanin
and Mahshid for their valuable moral support.
Finally, an honorable mention goes to my parents and my brother for their understanding and
supports in completing this project.

viii
TABLE OF CONTENTS
ABSTRACT ............................................................................................................. iiii
ABSTRAK ................................................................................................................. v
ACKNOWLEDGEMENTS ..................................................................................... vii
TABLE OF CONTENTS ........................................................................................ viii
LIST OF FIGURES .................................................................................................. xi
LIST OF TABLES ................................................................................................... xii
LIST OF SYMBOLS AND ABBREVIATION ...................................................... xiii
CHAPTER1: INTRODUCTION ......................................................................................... 1
CHAPTER2: LITERATURE REVIEW............................................................................... 3
2.1. Snakehead ........................................................................................................... 4
2.2. Channa striata (C.striata) ................................................................................... 7
2.3. Channa micropeltes .......................................................................................... 10
2.4. Aquaculture ....................................................................................................... 12
2.5. Molecular markers in aquaculture ..................................................................... 13
2.6. Types of molecular marker in aquaculture........................................................ 15
2.7. Microsatellites ................................................................................................... 18
2.8. EST-SSR ........................................................................................................... 22
2.9. Cross species amplification ............................................................................... 24

ix
CHAPTER3: METHODOLOGY ....................................................................................... 26
3.1. Sample collection .............................................................................................. 26
3.2. Primer Design ................................................................................................... 27
3.3. Cross species amplifications ............................................................................. 29
3.4. Preparation of genomic DNA ........................................................................... 29
3.4.1. Genomic DNA isolation ..................................................................... 29
3.4.2. DNA qualification .............................................................................. 30
3.5. PCR optimization .............................................................................................. 31
3.6. Gel electrophoresis ............................................................................................ 32
3.7. Gel excision and purification ............................................................................ 33
3.8. Testing DNA purification ................................................................................. 34
3.9. DNA Sequencing .............................................................................................. 34
3.10. Check for Polymorphism ................................................................................ 35
3.11. Analysis of Microsatellite DNA using Genetic Analyser (Fragment Analysis)
.................................................................................................................................. 35
3.12. Data Analysis .................................................................................................. 36
CHAPTER4: RESULTS .................................................................................................... 37
4.1. DNA extraction ................................................................................................. 38
4.2. Population study of Channa striata .................................................................. 39
4.3. Screening of EST microsatellite primer pairs ................................................... 39
4.4. Check for the polymorphism ............................................................................. 40
x
4.5. Microchecker Analysis ..................................................................................... 45
4.6. Level of heterozygosity ..................................................................................... 45
4.7. Hardy-Weinberg Equilibrium ........................................................................... 48
4.8. Linkage disequilibrium ..................................................................................... 48
4.9. Population structure .......................................................................................... 50
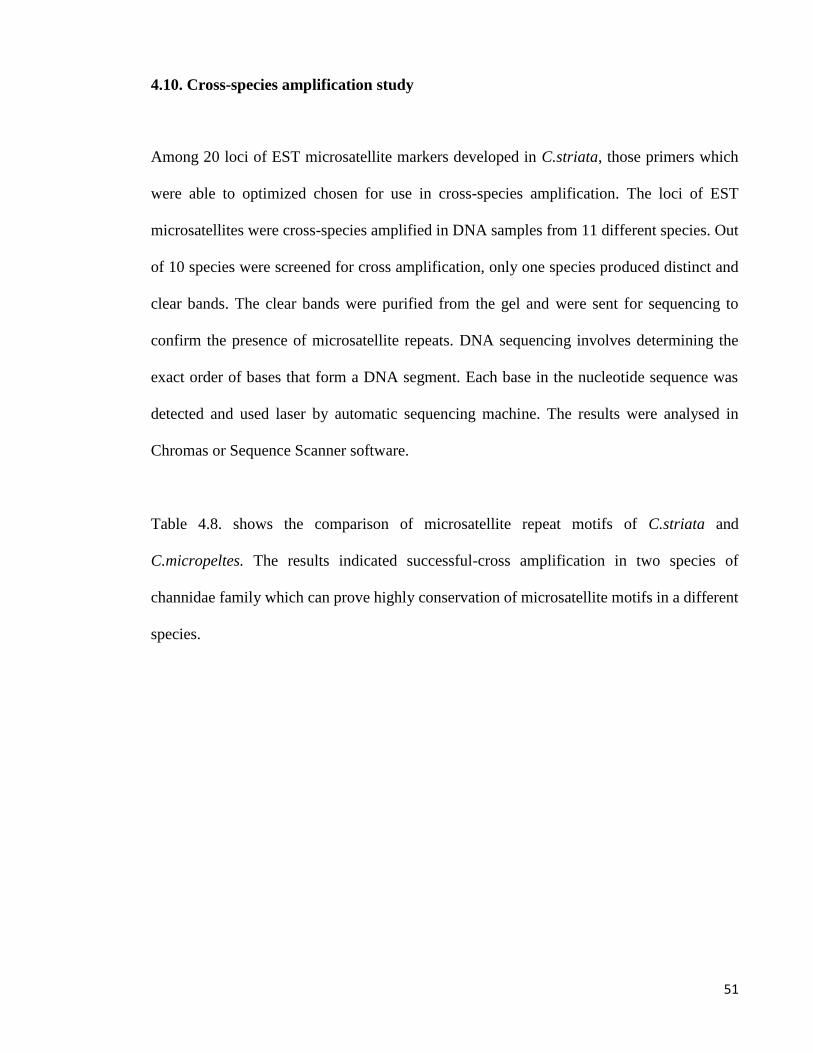
4.10. Cross-species amplification study ................................................................... 51
CHAPTER5: DISCUSSION .............................................................................................. 54
5.1. Level of heterozygosity ..................................................................................... 54
5.2. Hardy-Weinberg Equilibrium (HWE) .............................................................. 56
5.3. Linkage Disequilibrium (LD) ........................................................................... 57
5.4. Genetic differentiation between populations (F-statistic) ................................. 58
5.5. Cross-species amplification of Channa striata EST microsatellite loci ........... 59
CHAPTER6: CONCLUSION ............................................................................................ 62
APPENDIX .......................................................................................................................... 64
REFERENCES ..................................................................................................................... 68
xi
LIST OF FIGURES
Figure 2-1: Native distribution of the family Channidae ....................................................... 5
Figure 2-2: Images of Channa striata .................................................................................... 7
Figure 2-3: Distribution of Channa striata ............................................................................ 9
Figure 2-4: Distribution of Channa micropeltes .................................................................. 11
Figure 2-5: Images of Channa micropeltes .......................................................................... 12
Figure 2-6: Global capture production for Channa striata 1950-2010 ................................ 13
Figure 2-7: Mutation by replication errors. .......................................................................... 20
Figure 2-8: Unusual crossing over. ...................................................................................... 21
Figure 3-1: Map of Malaysia showing the sampling locations ............................................ 26
Figure 4-1: DNA was extracted successfully by CTAB method. ........................................ 38
Figure 4-2: Optimization of primers EST-01F and 01R. ..................................................... 40
Figure 4-3: The PCR product of primers 6L and 6R on Metaphore Agarose gel. ............... 41
Figure 4-4: The PCR product of primers 1L and 1R on Metaphore Agarose gel. ............... 41
Figure 4-5: Fragment analysis peaks of primers 18L and 18R. ........................................... 42
Figure 4-6: The fragment analysis peaks of primers 8L and 8R. ........................................ 43
Figure 4-7: The fragment analysis peaks of primers 12L and 12R. ..................................... 43
Figure 4-8: The fragment analysis peaks of primers 1L and 1R. ......................................... 44
Figure 4-9: Microsatellite sequences. .................................................................................. 53

xii
LIST OF TABLES
Table 2-1: Comparison of different molecular markers ...................................................... 17
Table 2-2: Different combination of microsatellite repeats. ................................................ 18
Table 2-3: Microsatellite applications. ................................................................................. 22
Table 3-1: List of species are applied in cross species study. .............................................. 27
Table 3-2: EST Microsatellite primer pairs developed for C.striata. .................................. 28
Table 3-3: PCR Reaction Mixture........................................................................................ 31
Table 3-4: PCR Conditions. ................................................................................................. 32
Table 4-1: Statistic values of Sarawak population. .............................................................. 46
Table 4-2: Statistic values of Johor population. .................................................................. 46
Table 4-3: Statistic values of Kedah population. ................................................................. 47
Table 4-4: Statistic values of Pahang population. ................................................................ 47
Table 4-5: Hardy Weinberg Equilibrium. ............................................................................ 48
Table 4-6: Significance values of pair-wise tests for linkage for each population. ............. 49
Table 4-7: Results of pair-wise Fst analysis ........................................................................ 50
Table 4-8: Comparison of microsatellite motifs in C.striata and C.micropeltes. ................ 52
xiii
LIST OF SYMBOLS AND ABBREVIATION
µg microgram
µl microliter
ºC degree Celsius
10X ten times
1X one time
A adenosine
bp base pair
C cytosine
dATP deoxyadenosine triphosphate
dCTP deoxycytidine triphosphate
dGTP deoxyguanosine triphosphate
dNTP deoxyribonucleotide triphosphate
dTTP deoxythymidine triphosphate
ddH2O Double distilled water
DNA Deoxyribonucleic acid
EDTA ethylene diamine tetraacetic acid
Fst Fixation index
g gram
G guanosine
h hour
He Expected heterozygosity
Ho Observed heterozygosity
HWE Hardy Weinberg equilibrium
kb kilobase
kg kilogram
LD Linkage disequilibrium
M Molar
mg milligram
mg/ml milligram per milliliter
MgCl 2 Magnesium chloride
min minute

xiv
ml milliliter
PCR Polymerase Chain Reaction
PIC Polymorphism Information Content
RNA ribonucleotide acid
Rpm Rotations per minute
s second
SSR Simple sequence repeat
T thymine
Ta Annealing temperature
TBE tris-borate-EDTA buffer
U unit
UV ultraviolet
V Volt
VNTR Variable Number Tandem Repeats

1
CHAPTER1: INTRODUCTION
CHAPTER 1
INTRODUCTION
The snakehead, Channa striata is a freshwater air-breather fish species indigenous to
Malaysia (Mat Jais, 2007a). It can be found in a variety of habitats such as lakes, rivers, rice
fields, reservoirs, ponds, swamps and canals. C.striata is an economically important food
source in Malaysia and many countries of the Asia Pacific due to it contains high level of
protein (Lee and Ng, 1994; Hossain et al., 2008).
It is rich in essential amino acids and fatty acids as well as dietary minerals such as
magnesium, copper, calcium, manganese, zinc and iron. This fish has been extensively used
as remedy due to its medical and pharmaceutical properties and having anti-fungal, anti-
microbial and anti-inflammatory activities (Zuraini et al., 2006).
Aquaculture activity of C.striata is not significant in Malaysia due to its presumed affluence
in the nature. However, due to several anthropogenic factors, which cause a drastic damage
to its natural habitats, the wild populations of C.striata in Malaysia are on gradual decline
(Nagarajan et al., 2006; Hossain et al., 2008). Hence, providing vital information about
population genetics is essential, especially through evaluation of genetic diversity in order to
management and conservation of both wild and cultivated populations (Beaumont and Hoare,
2003).
Genetic diversity within population is required to maintain due to its necessity for evolution
and the correlation between heterozygosity and population compatibility (Li et al., 2007). In
2
this respect, genetic markers such as microsatellites are powerful tools to assess the genetic
diversity and population structure (Gupta and Varshney, 2000).
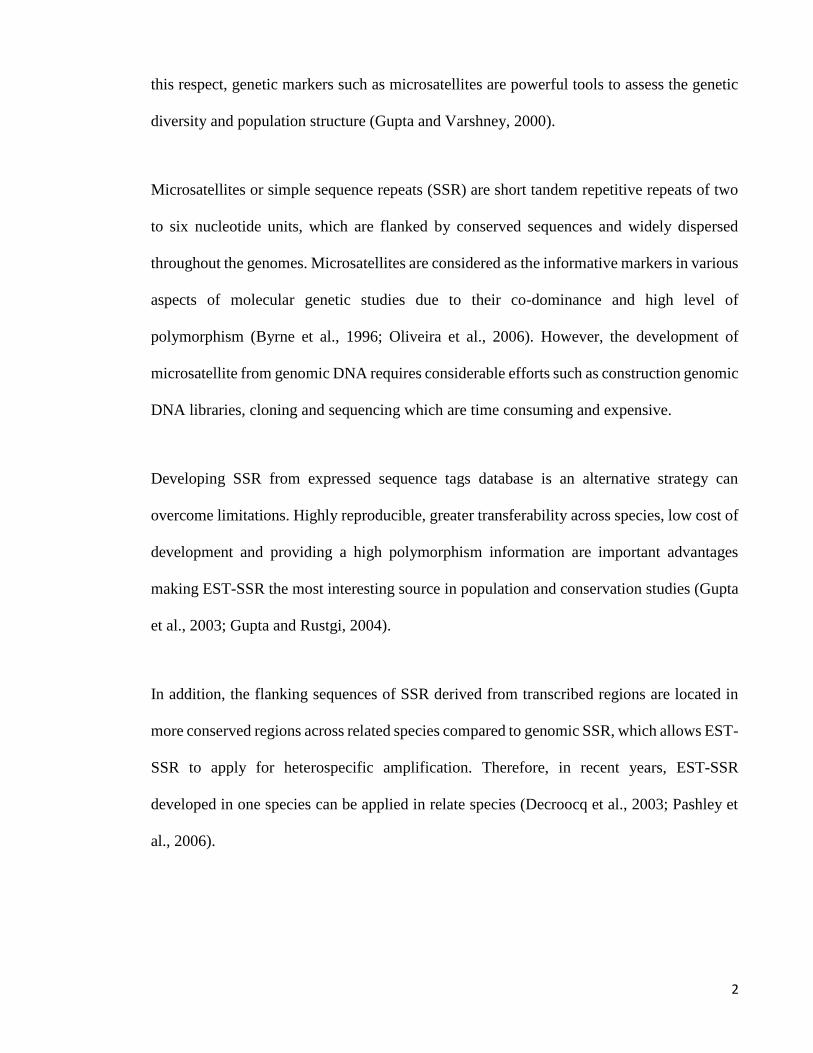
Microsatellites or simple sequence repeats (SSR) are short tandem repetitive repeats of two
to six nucleotide units, which are flanked by conserved sequences and widely dispersed
throughout the genomes. Microsatellites are considered as the informative markers in various
aspects of molecular genetic studies due to their co-dominance and high level of
polymorphism (Byrne et al., 1996; Oliveira et al., 2006). However, the development of
microsatellite from genomic DNA requires considerable efforts such as construction genomic
DNA libraries, cloning and sequencing which are time consuming and expensive.
Developing SSR from expressed sequence tags database is an alternative strategy can
overcome limitations. Highly reproducible, greater transferability across species, low cost of
development and providing a high polymorphism information are important advantages
making EST-SSR the most interesting source in population and conservation studies (Gupta
et al., 2003; Gupta and Rustgi, 2004).
In addition, the flanking sequences of SSR derived from transcribed regions are located in
more conserved regions across related species compared to genomic SSR, which allows EST-
SSR to apply for heterospecific amplification. Therefore, in recent years, EST-SSR
developed in one species can be applied in relate species (Decroocq et al., 2003; Pashley et
al., 2006).

3
The objectives of this study were
To develop EST-SSR markers for Channa striata and apply them to compare the genetic
diversity of populations of Channa striata using EST-SSR markers, and also using EST
microsatellite markers developed in C.striata for cross amplification to investigate their
conservation among other species.
CHAPTER2: LITERATURE REVIEW

4
CHAPTER 2
LITERATURE REVIEW
2.1. Snakehead
Snakeheads belong to the family Channidae are air breathing freshwater fishes distributed in
Africa and Asia continent including two genera. The Asian genus, Channa comprises of 26
species and the African genus, Parachanna comprises of only three species (Musikasinthorn,
2003; Li et al., 2006).
According to Kottelat et al. (1993), Lee and Ng (1994), Mohsin and Ambak (1992),
snakeheads are classified into
Kingdom : Animalia
Phylum : Chordata
Subphylum : Vertebrata
Class : Actinopterygii
Order : Perciformes
Suborder : Channoidei
Family : Channidae
Species of the genus Channa has a wide distribution, extending from southeastern Iran and
eastern Afghanistan eastward through Pakistan, India, southern Nepal, Bangladesh,
Myanmar, Thailand, Laos, Malaysia, Sumatra, Indonesia, Vietnam, Korea, and China
northward into Siberia (Li et al., 2006; Vishwanath and Geetakumari, 2009). The three
species of the genus Parachanna are only confined to the Central West Africa (Li et al.,
2006).

5
Figure 2.1. Native distribution of the family Channidae (USGS, 2004).
The genus Channa is one of the most common food fish sources in Thailand, Vietnam and
other East Asian countries, where they are extensively cultured. In addition, of their
importance as a food fish, they are used as a therapeutic to help wound healing and have
efficacy on immune system (Adamson, 2010). These fishes are economically important
species with great potential for aquaculture and fisheries throughout southern and
southeastern Asia (Vishwanath and Geetakumari, 2009).
Snakeheads cannot tolerate seawater. Their habitats vary by species. Most of the species of
snakehead live in streams and rivers, they are also found in swamps, rice paddies, ponds and
ditches (Ng and Lim, 1990; Lee and Ng, 1991).
6
Snakehead are distinguished by some distinct morphological characteristics such as
elongated and cylindrical body, broad flattened head, which is similar to snake with large
eyes situated in the frontal part of the head, large mouth with well developed teeth on both
upper and lower strong jaws, fin rays in all fins, rounded caudal fin, long dorsal and anal fins
and an accessory respiratory organ known as the suprabranchial chamber developing in a
labyrinth form located behind the gills in the head region enabling them to breathe
atmosphere air (Berra, 2001; Musikasinthorn, 2003).
Different development of the accessory respiratory organ in parachanna and channa result
in differentiate these two genera by the morphology of air breathing apparatus, which is less
developed in the genus Parachanna with the simple structure compared to the genus Channa
with the chambers which are bordered by two plates, one from the epibranchial of the first
gill arch and the other as an expansion of the hyomandibular unlike the simple cavity of the
Parachanna not involving processes from the first epibranchial or hyomandibular. These
chambers are not labyrinthic (Berg, 1947; Courtenay and Williams, 2004).
Identifying different species of snakehead fish is not feasible by only relying on
morphological and meristic features. Genetic methods have great potential in order to
distinguish distinct populations or stocks of fish (Cadrin et al., 2005).
The taxonomy and phylogeny of genus channa have not completed. According to the
phylogenetic study, which has been performed in 2010 by Adamson and colleagues, there is
a probability of entity of more unidentified species of channa in South East Asia. Among
these species, channa striata (haruan), channa micropeltes (toman), Channa marulioides

7
(toman bunga), channa lucius (bujak), channa gachua, channa melasoma and channa
bankanensis are discovered in Malaysia (Ambok et al., 2007; Rahim et al., 2009).
2.2. Channa striata (C.striata)
The snakehead murrel, Channa striata (common snakehead, chevron snakehead, and striped
snakehead) locally known as "Haruan" in Malaysia, is a native tropical freshwater fish
species belongs to the Channidae family
Kingdom : Animalia
Phylum : Chordata
Class : Actinopterygii
Order : Perciformes
Family : Channidae
Genus : Channa
Species : C.stiata
Figure 2.2. Images of Channa striata adapted from (DOF, 2011).

8
Channa striata has the ability to adapt rapidly to various environments and withstand the
harsh environmental condition. Its habitats preference, are freshwater ponds and streams.
Nevertheless, several reports indicate the existence of this species in rivers, swamps, canals,
drains, rice fields and mining pools in Malaysia (Lee and Ng, 1991; Ambok et al., 2007).
C.striata is a carnivorous fish that feeds on snakes, frogs, snails, insects, prawns, worms and
fishes (Lee and Ng, 1994). It is categorized as a large fish, attaining up to 100 cm in length
however, this size is rarely found in nature due to fishing threat.
Channa striata is important especially as food source in South East Asia (Froese and Pauly,
2008). It has been broadly used in medical and pharmaceutical due to its therapeutic and
recuperative qualities especially for internal and external wound healing as a result of high
content of arachidonic acid (Michelle et al., 2004; Yaakob and Ali, 1992; Zakaria et al.,
2004). It also has effect in suppressing inflammation of arthritic joint result in applied as a
complementary remedy in osteoarthritis and joint disorder (Ng et al., 2004). It can also
facilitate the recuperation of many skin-related problems due to its great nutraceutical
components. An essential fatty acid, Docosahexaenoic acid (DHA) found in C.striata, can
act as an inhibitor factor on dermal complications (Mat Jais, 2007b).
9
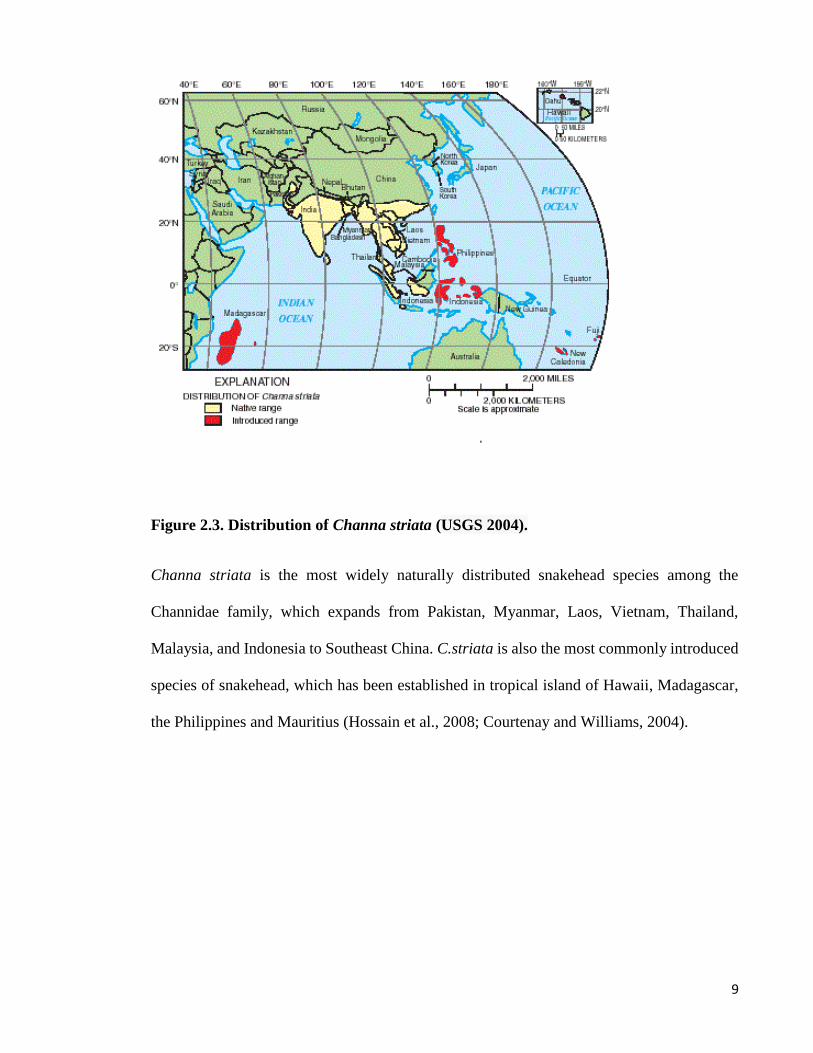
Figure 2.3. Distribution of Channa striata (USGS 2004).
Channa striata is the most widely naturally distributed snakehead species among the
Channidae family, which expands from Pakistan, Myanmar, Laos, Vietnam, Thailand,
Malaysia, and Indonesia to Southeast China. C.striata is also the most commonly introduced
species of snakehead, which has been established in tropical island of Hawaii, Madagascar,
the Philippines and Mauritius (Hossain et al., 2008; Courtenay and Williams, 2004).
10
2.3. Channa micropeltes
Giant snakehead, Channa micropeltes, which better known to locals as "toman", belongs to
the family Channidae. The red snakehead is commonly used for juveniles of this species its
color before getting mature.
Kingdom : Animalia
Phylum : Chordata
Class : Actinopterygii
Order : Perciformes
Family : Channidae
Genus : Channa
Species : C.micropeltes
C.micropeltes has been considered as the largest and fastest growing species among other
species of Channidae family due to its extended body, which can go over 1 meter in length
and 20 kg in weight (Lee and Ng, 1991; Talwar and Jhingran, 1992).
C.microplete lives mainly in the lakes, rivers, canals, large streams and reservoirs (Lee and
Ng, 1991). It can also found in muddy and swampy areas due to its ability to crawl in such
area, and able to breathe atmosphere air which is prepared by accessory respiratory organ.

11
Figure 2.4. Distribution of Channa micropeltes (USGS, 2004).
C.micropeltes has a disjunctive distribution. It is distributed both, in Southeast Asia and
Southwest India, which are far apart (Talwar and Jhingran, 1992). It is assume that the
population, which inhabit in India is not included of a native range. The introduced range is
not only limited to southwest of India, there are some population live in US states such as
Wisconsin, Maryland, Virginia and Massachusetts.
This fish has elongated body with dark longitudinal stripes. Its head is pointed and flattened.
It has a large mouth with two strong jaws. The lower jaw is covered by enlarged and cutting
teeth. It has a long dorsal fin and a rounded caudal fin. The pectoral fin is about two times
larger than pelvic fin.

12
Figure 2.5. Images of Channa micropeltes adapted from (USGS, 2004).
2.4. Aquaculture
Aquaculture is the fastest growing food production system in the world. Most aquaculture
production is carried out using wild stock recently captured from natural environments
(Lymbery, 2000). Many populations of wild fish have been reduced over last century. There
are several factors for this decline such as over-fishing, rapid increase in pesticide usage,
destruction of habitat, migratory routs barriers and so on. Since genetic variation enhances
adaptation to changing environment conditions, its assessment can provide valuable
information in understanding and managing populations and also it applies as an efficient
approach for conservation of species (Franklin, 1980).

13
Aquaculture of freshwater fish in Malaysia plays an important role in protein food supply.
C.striata is one the most common freshwater species that is harvested as food source across
its native range. The unique specifications of this species enable it to be cultured in wild rang.
Moreover, the therapeutic properties of wild C.striata remain on the cultured fishes (Mat
Jais, 2007b). In recent years, anthropogenic factors such as environmental pollution, loss of
habitat, over fishing, which result in degradation in harvest of wild C.striata along with fast
growth rate, high tolerance to adverse condition and therapeutic properties have led to
progress in culture of the fish.
(a) (b)
Figure 2.6. (a) Global capture production for Channa striata 1950-2010. (b) Global
aquaculture production for Channa striata 1950-2010 (FAO Fishery Statistic, 2011).
2.5. Molecular markers in aquaculture
Development of molecular markers has played a pivotal role in genetic detection of
individuals, population or species. DNA molecular marker technologies have provided many
14
advances in various aspects of aquaculture genetics research (Liu and Cordes, 2004; Lakra,
2001).
Molecular markers have revolutionized the genetic diversity investigations. This resulted in
obtaining valuable information, which can be applied in research on evolution, conservation,
management of genetic resources. Various important scientific information in aquaculture
practices such as species identification, population structure study, wild and hatchery
populations comparison and genetic variation have been provided by utilizing molecular
markers (Chaunhan and Rajiv, 2010).
Genetic methods play an important role to distinguish fish species when the stocks have not
been identified by morphological and meristic characters (Cadrin et al., 2005). Molecular
markers are practical genetic tools in an increasing necessity which can be used to distinguish
species during breeding and improvement (Qiu et al., 2010).
Molecular markers have become useful and robust tools in almost all aspects of genetic
analysis. Correct identification of species, accurate recognition of genetic relationship and
diversity, efficient classification, mapping of desirable genes are the important issues in
genetic studies require molecular markers (Wang et al., 2011). Molecular markers have been
effectively used to access of significant amounts of data in genetic diversity and population
structure, which are important in applying, assessing and conserving genetic resources of
species. Polymorphic, reproducible, co-dominant, fast and inexpensive detection are the
characteristic of molecular marker lead them to become robust and beneficial molecular tools
(Bai, 2011).
15
2.6. Types of molecular marker in aquaculture
The first generation of genetic marker, represented by protein coding loci, could be applied
to the management program of fish stocks. Development of allozyme analysis resulted in the
first application of genetic markers in aquaculture studies. Although allozyme assay
remained one of the most common technique for several fisheries and aquaculture
applications due to its simplicity and general applicability, it cannot be assumed to be
selectively neutral (Karl and Avise, 1992). On the other hand, some changes in DNA
sequence are concealed at protein level and lead to reduction in detectable variations.
In addition to low level of polymorphism revealed in many allozyme studies of fish
population (Crawford et al., 1990), sensitivity of the amount and quality of samples required,
has limited application of allozyme in aquaculture genetics. Hence, further investigations
need to be done in order to achieve a better genetic marker, which can overcome the
deficiencies (Ferguson, 1994).
Direct examination of DNA molecule via development of DNA amplification using PCR
(Polymerase Chain Reaction) technique, which has led to progressive rise to genetic marker
technology have revolutionized aquaculture genetics research.
Initial molecular genetics analysis of fish mitochondrial DNA (mtDNA) and nuclear DNA
(nDNA) provide several advantages over protein markers. Analysis of mtDNA in being
progressively applied in phylogeny, evolution and population structure of fishes (Meyer,
1993). Since mtDNA is inherited maternally, phylogenies and population structure derived
from mtDNA data may not reflect those of nuclear genome. Furthermore, mtDNA molecule
16
should be considered a single locus in genetic analysis due to its non-Mendelian mode of
inheritance (Liu and Cordes, 2004).
The advantages of nuclear DNA markers assemble in their abundance in the genome, high
level of polymorphism and mendelian inheritance. Most of nDNA markers contain non
coding regions of nuclear genome which evolve more rapidly than coding regions. This
allows these sequences more appropriate to serve in genetic structure studies at species level.
Nuclear genetic marker is a fragment of genomic DNA with the known location, which has
been applied to identify species and individuals. A variety of molecular marker, including
restriction fragment length polymorphisms (RFLPs), amplified fragment length
polymorphism (AFLP), Random amplification of polymorphic DNA (RAPD), Variable
number tandem repeat (VNTR), Single nucleotide polymorphism(SNP), Short tandem repeat
(STR), Single feature polymorphism (SFP), Diversity Arrays Technology (DART) have been
developed for different application (Varshney and Graner, 2005).
Due to number of advantages of microsatellites over other molecular markers, it has replaced
allozymes and mtDNA (Luikart and England, 1999). Microsatellites are powerful marker
with great differentiating power and utilized extensively to provide a great wealth of
information on various aspects of aquaculture research such as species, strain identificatin,
genetic diversity and resource analysis of aquaculture stocks,
parentage assignments and reproductive contribution, mapping quantitative trait loci
(QTL) and marker-assisted selection (MAS) (Chistiakov et al., 2006).

17
Molecular makers are classified into two types due to their association with different regions
of genome including recognized genes (Type I) and unknown genomic regions (Type II)
(Chauhan and Rajiv, 2010).
Table 2.1 summarizes the basic properties of some of the markers that are currently being
used in fisheries. The choice marker to be used depends on what issues need to be assessed.
Table 2.1. Comparison of different molecular markers (Liu, 2004).
Marker
type
Mode of
inheritance
Type Likely
allele
number
Polymorphism Major
application
Allozyme Mendelian
codominant
Type I 2-6 Low Linkage mapping
population studies
mtDNA Maternal
inheritance
Multiple
haplotypes
Maternal lineage
RFLP Mendelian
codominant
Type I or
Type II
2 Low Linkage mapping
RAPD Mendelian
dominant
Type II 2 Intermediate Fingerprinting for
population
studies, hybrid
dentification
AFLP Mendelian
dominant
Type II 2 High Linkage mapping,
population studies
SSR Mendelian
codominant
Mostly
type II
Multiple High Linkage mapping
Population studies
paternity analysis
EST Mendelian
codominant
Type I 2 Low Linkage mapping
Physical mapping
comparative
mapping
SNP Mendelian
codominant
Type I or
Type II
2 High Linkage mapping
Population studies
18
2.7. Microsatellites
Microsatellites are short DNA segments consist of nucleotides that are repeated numerous
times in the genome. The number of repeats can vary between individuals of same species.
Simple sequence repeats (SSRs), short tandem repeats (STRs), variable number tandem
repeats (VNTRs), simple sequence length polymorphisms (SSLPs) are alternative terms that
represent microsatellites (Liu and Cordes, 2004).
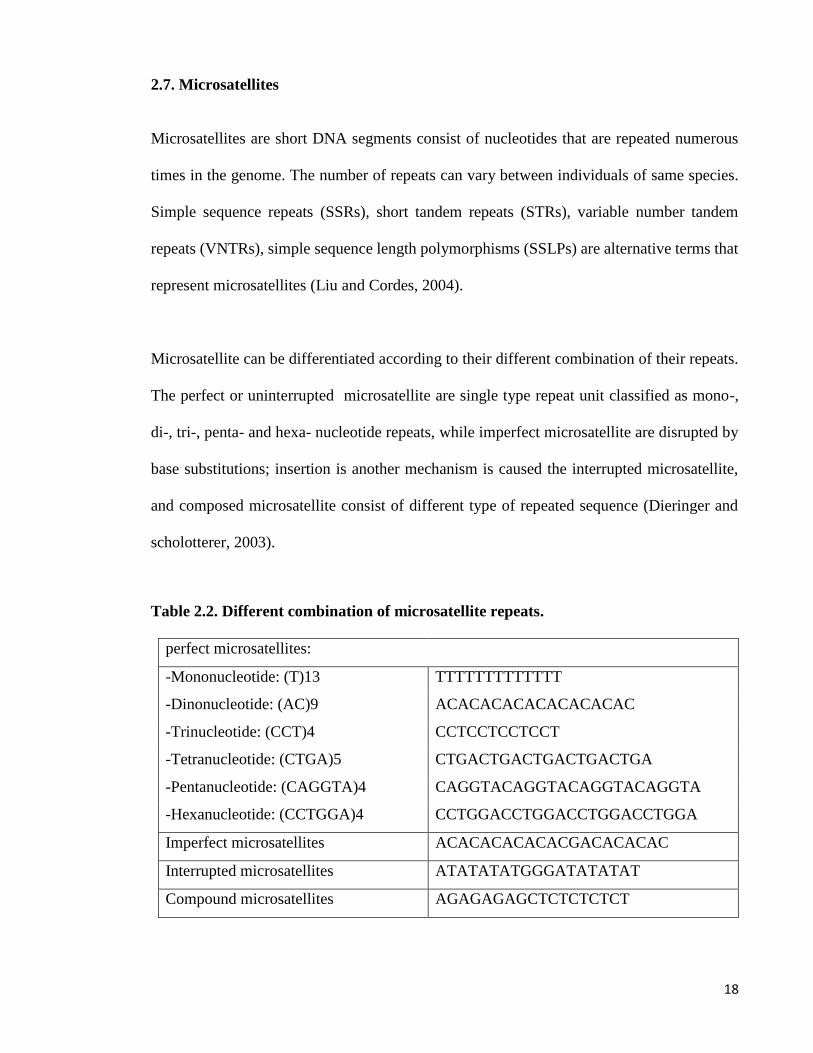
Microsatellite can be differentiated according to their different combination of their repeats.
The perfect or uninterrupted microsatellite are single type repeat unit classified as mono-,
di-, tri-, penta- and hexa- nucleotide repeats, while imperfect microsatellite are disrupted by
base substitutions; insertion is another mechanism is caused the interrupted microsatellite,
and composed microsatellite consist of different type of repeated sequence (Dieringer and
scholotterer, 2003).
Table 2.2. Different combination of microsatellite repeats.
perfect microsatellites:
-Mononucleotide: (T)13 TTTTTTTTTTTTT
-Dinonucleotide: (AC)9 ACACACACACACACACAC
-Trinucleotide: (CCT)4 CCTCCTCCTCCT
-Tetranucleotide: (CTGA)5 CTGACTGACTGACTGACTGA
-Pentanucleotide: (CAGGTA)4 CAGGTACAGGTACAGGTACAGGTA
-Hexanucleotide: (CCTGGA)4 CCTGGACCTGGACCTGGACCTGGA
Imperfect microsatellites ACACACACACACGACACACAC
Interrupted microsatellites ATATATATGGGATATATAT
Compound microsatellites AGAGAGAGCTCTCTCTCT

19
Microsatellites are DNA regions with variable number of short repeats flanked by a unique
sequence. They are typically co-dominant, high reproducible, highly polymorphic and
transferable across species (Qu et al., 2012).
Microsatellite do not usually code for protein, which means they do not influence the
characteristic of organisms. If microsatellite does not code for protein, a mutated allele is
more likely to be retain in population because it is not under selection pressure. Mutation on
genes that code for protein, are usually harmful and because of that individual selected
against the population and they typically do not survive to reproduce and pass their genetic
material on the next generation but if you have microsatellite mutation which does not
influence the fitness of individuals that mutation can stay in population because that
individual not being selected against. Microsatellite mutation can survive in population.
Alleles of microsatellite can be much more variable than alleles of genes. Polymorphism in
microsatellite has been attributed to different alleles contain variable number of repeats (Liu
and Cordes, 2004).
High degree of polymorphism in microsatellite is due to high mutation rates in repeated
sequence (Peakall et al 1998). High rates of mutation in microsatellite occur through two
possible mechanisms. The first mechanism, which is the most common one is slippage
replication affecting microsatellites by gain or contraction of one or more repeat units.

20
Figure 2.7. Mutation by replication errors. (a) Normal replication. (b) Backward
slippage, resulting in the insertion mutation. (c) Forward slippage, resulting in the
deletion mutation (Molecular Biology Web Book). In this figure, mispairing involves
only one repeat. In fact, the slippage could cause several repeats to become unpaired.

21
Figure 2.8. Unusual crossing over produces insertions and deletions. Mutation may also
happen by crossing over during meiosis. Crossing over is exchange of DNA fragment
between homologous chromosome. This process increases genetic variability and lead
to different number of repeats in microsatellite (Benjamin, 2010).
22
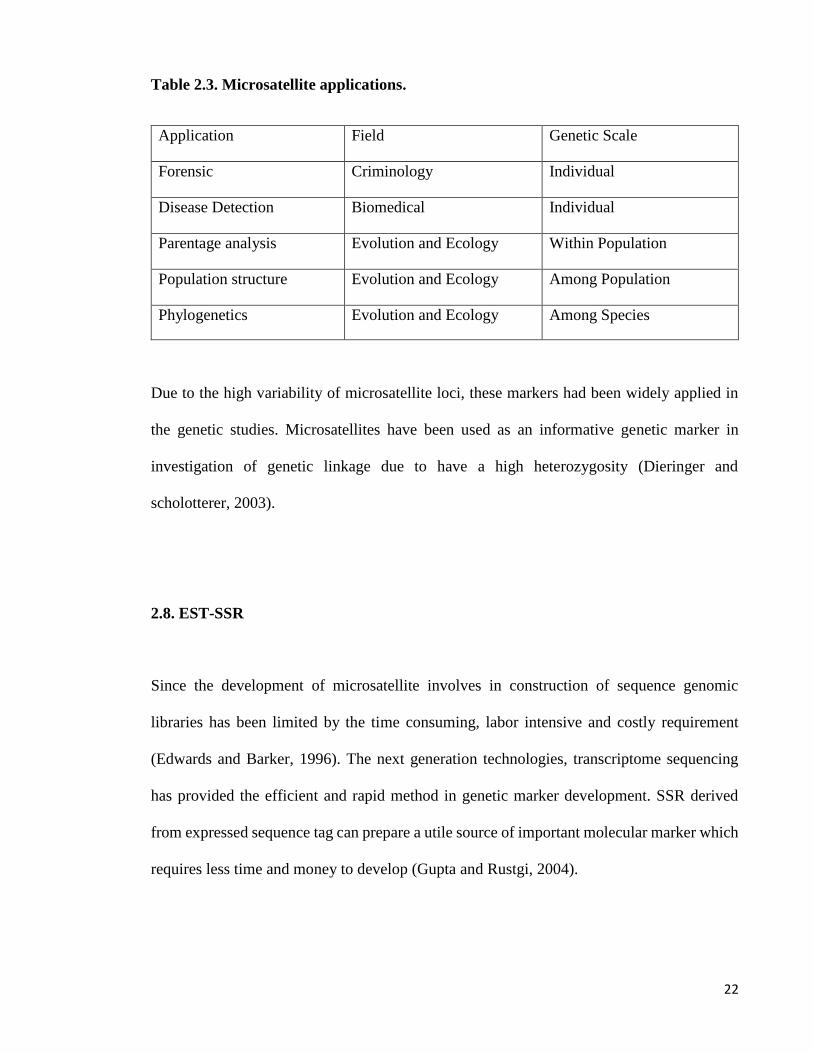
Table 2.3. Microsatellite applications.
Application Field Genetic Scale
Forensic Criminology Individual
Disease Detection Biomedical Individual
Parentage analysis Evolution and Ecology Within Population
Population structure Evolution and Ecology Among Population
Phylogenetics Evolution and Ecology Among Species
Due to the high variability of microsatellite loci, these markers had been widely applied in
the genetic studies. Microsatellites have been used as an informative genetic marker in
investigation of genetic linkage due to have a high heterozygosity (Dieringer and
scholotterer, 2003).
2.8. EST-SSR
Since the development of microsatellite involves in construction of sequence genomic
libraries has been limited by the time consuming, labor intensive and costly requirement
(Edwards and Barker, 1996). The next generation technologies, transcriptome sequencing
has provided the efficient and rapid method in genetic marker development. SSR derived
from expressed sequence tag can prepare a utile source of important molecular marker which
requires less time and money to develop (Gupta and Rustgi, 2004).
23
EST-SSRs have a number of advantages over SSR, which make it the better choice in genetic
map-based analyses and population genetic studies (Borrone et al., 2007). Locating in more
conserved coding region of genome lead to the higher level of transferability of EST-SSR
between species result in make it more informative and robust than SSR marker to detect
polymorphisms and genetic diversity studies (Scott et al., 2000, Decroocq et al., 2003).
EST-SSR has been employed in comparative genetic mapping and construction of genetic
linkage map and breeding applications due to its universality among species (Cordeiro et al.,
2001). EST-SSR are being increasingly widely applied as powerful genetic marker in many
aspects of genetic studies on numerous species due to their association to genes with known
function, high level of transferability, show high reproducibility, co dominant inheritance
and low cost for development compared to other molecular marker (Varshney et al., 2005).

24
2.9. Cross species amplification
Since the isolation and characterization of DNA markers for each species are time-consuming
and expensive due to necessity of several steps such as designing of primer, optimizing,
cloning and sequencing which are required for separate development for each species
(Barbara et al., 2007; Lin et al, 2008). There is an indirect way can facilitate development of
markers across species and overcome drawbacks to save time and efforts. This alternative
strategy, which is called cross-species amplification, is based on utilizing PCR primers
developed in one species to amplify same loci in other related species (Chang et al., 2008;
Gemmell et al., 1997; Holmen et al., 2009).
High level of transferability of microsatellite markers to closely related species makes them
possible to amplify same loci in different species (Pinheiro et al., 2009). Slower rate of
mutation in flanking regions of microsatellite than the microsatellite sequences, together with
the evolution conservation of flanking regions, allows them to serve as primer templates for
closely related species and apply for heterospecific amplification (Tong et al., 2002; Holmen
et al., 2005; Jarne and Lagoda., 1996).
The success of applying the marker developed for on species in different ones is highest in
species with short phylogenetic distance, hybrid or out crossing breeding system (Barbará et
al., 2007; Steinkellner et al.,1997).
Application of cross species amplification of microsatellites has been restricted due to several
limitations. (i) The success of SSR primer to amplify the same loci is obtained in species
belonging to same genus. (Scribner and Pearce 2000). (ii) Amplification of given
25
microsatellite may fail or may not be polymorphic (Morin et al., 1998). (iii) Microsatellite
loci developed from a given primer with same PCR product length may have different
sequences which is called size homoplasy which is arise from the mutation in the flanking
regions or discontinuity of repeats. (Anmarkrud et al., 2008; Hempel and Peakall, 2003).
Although the transferability of SSR markers is high across species belonging to same genus,
but the rate of transferability of SSR markers reduce across a broader taxonomic range. EST-
SSR are likely to be more conserved and have higher rates of transferability compared to
genomic SSR markers due. This is due to the fact that the EST-SSR are derived from
transcribed regions of the genome (Pashley et al., 2006; Scott et al., 2000).
26
CHAPTER3: METHODOLOGY
CHAPTER 3
METHODOLOGY
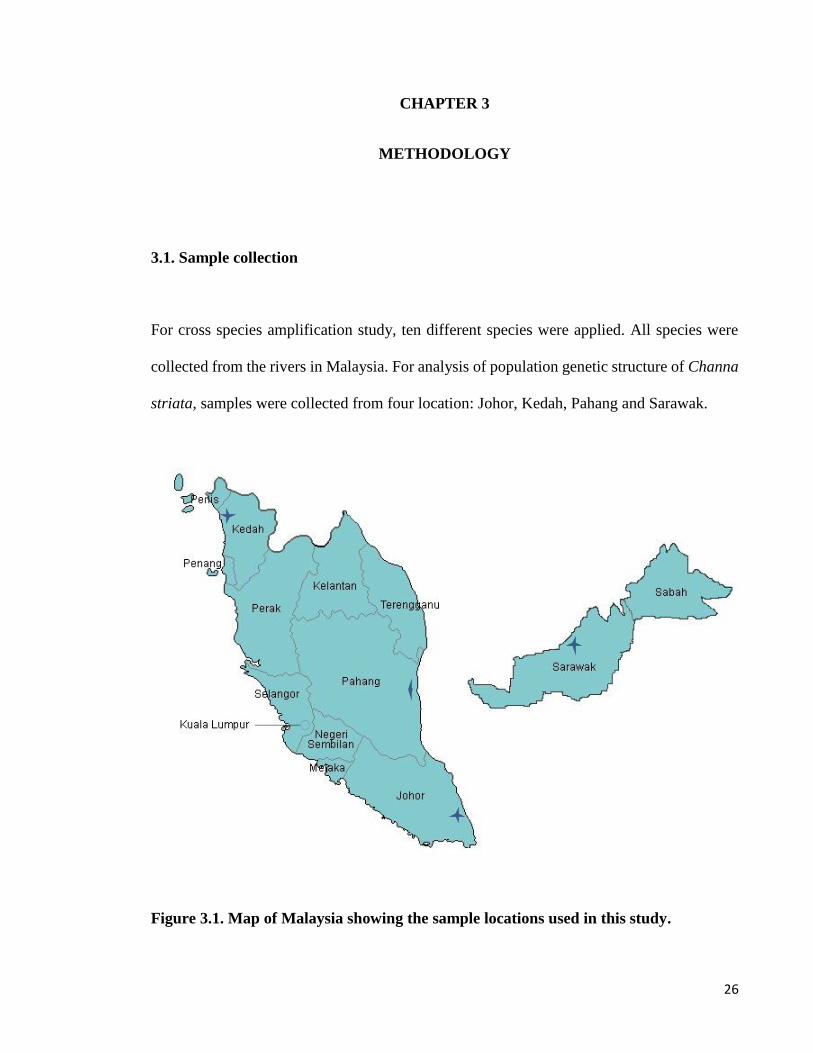
3.1. Sample collection
For cross species amplification study, ten different species were applied. All species were
collected from the rivers in Malaysia. For analysis of population genetic structure of Channa
striata, samples were collected from four location: Johor, Kedah, Pahang and Sarawak.
Figure 3.1. Map of Malaysia showing the sample locations used in this study.
27
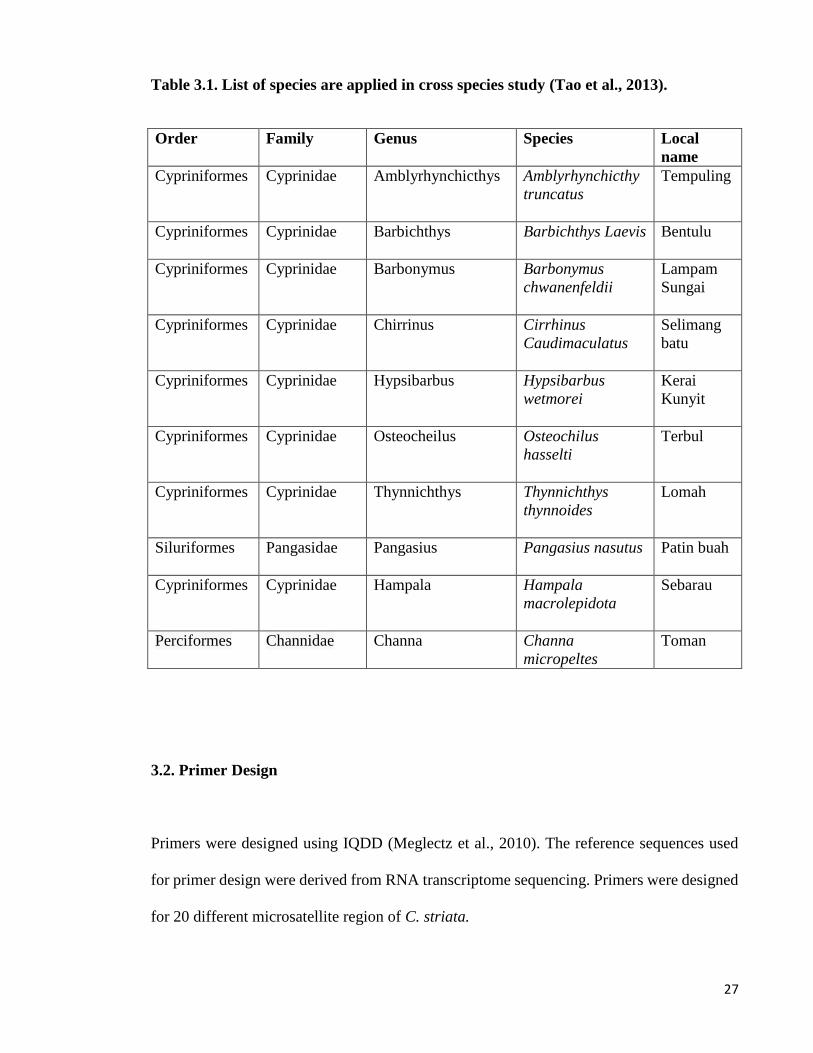
Table 3.1. List of species are applied in cross species study (Tao et al., 2013).
Order Family Genus Species Local
name
Cypriniformes
Cyprinidae
Amblyrhynchicthys
Amblyrhynchicthy
truncatus
Tempuling
Cypriniformes
Cyprinidae
Barbichthys Barbichthys Laevis
Bentulu
Cypriniformes
Cyprinidae
Barbonymus
Barbonymus
chwanenfeldii
Lampam
Sungai
Cypriniformes
Cyprinidae
Chirrinus
Cirrhinus
Caudimaculatus
Selimang
batu
Cypriniformes
Cyprinidae
Hypsibarbus
Hypsibarbus
wetmorei
Kerai
Kunyit
Cypriniformes
Cyprinidae
Osteocheilus
Osteochilus
hasselti
Terbul
Cypriniformes
Cyprinidae
Thynnichthys
Thynnichthys
thynnoides
Lomah
Siluriformes
Pangasidae
Pangasius
Pangasius nasutus
Patin buah
Cypriniformes Cyprinidae
Hampala
Hampala
macrolepidota
Sebarau
Perciformes Channidae
Channa Channa
micropeltes
Toman
3.2. Primer Design
Primers were designed using IQDD (Meglectz et al., 2010). The reference sequences used
for primer design were derived from RNA transcriptome sequencing. Primers were designed
for 20 different microsatellite region of C. striata.
28
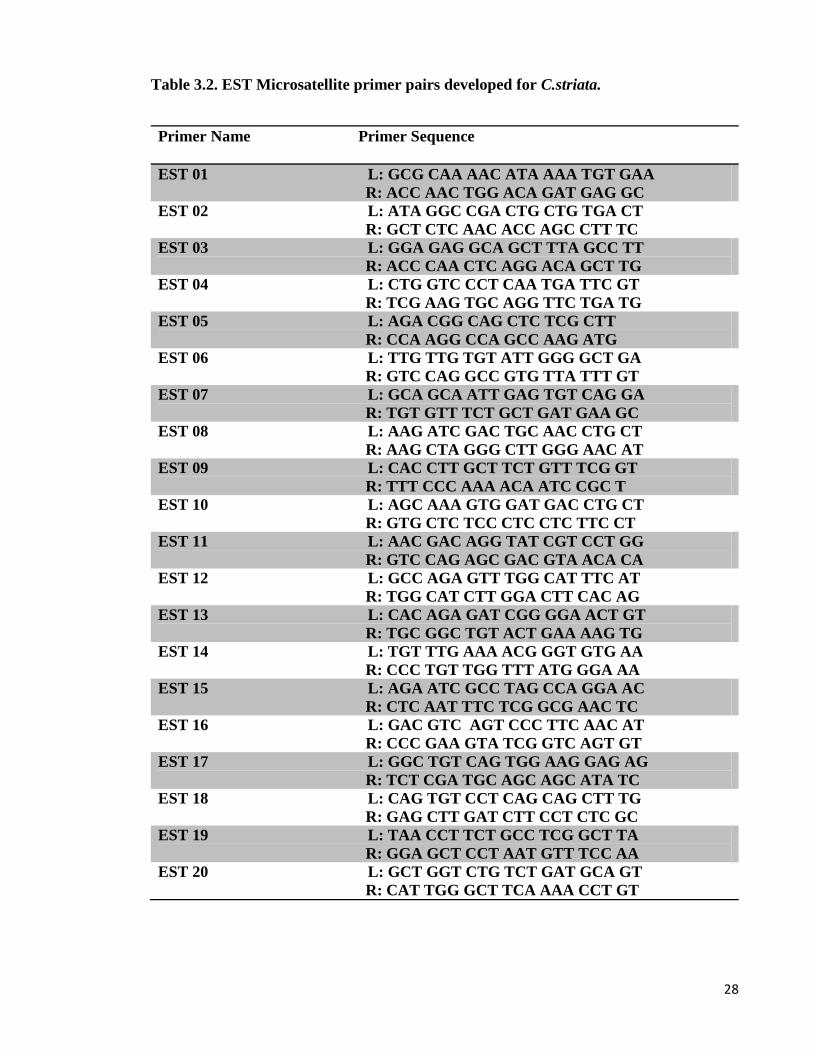
Table 3.2. EST Microsatellite primer pairs developed for C.striata.
Primer Name Primer Sequence
EST 01 L: GCG CAA AAC ATA AAA TGT GAA
R: ACC AAC TGG ACA GAT GAG GC
EST 02 L: ATA GGC CGA CTG CTG TGA CT
R: GCT CTC AAC ACC AGC CTT TC
EST 03 L: GGA GAG GCA GCT TTA GCC TT
R: ACC CAA CTC AGG ACA GCT TG
EST 04 L: CTG GTC CCT CAA TGA TTC GT
R: TCG AAG TGC AGG TTC TGA TG
EST 05 L: AGA CGG CAG CTC TCG CTT
R: CCA AGG CCA GCC AAG ATG
EST 06 L: TTG TTG TGT ATT GGG GCT GA
R: GTC CAG GCC GTG TTA TTT GT
EST 07 L: GCA GCA ATT GAG TGT CAG GA
R: TGT GTT TCT GCT GAT GAA GC
EST 08 L: AAG ATC GAC TGC AAC CTG CT
R: AAG CTA GGG CTT GGG AAC AT
EST 09 L: CAC CTT GCT TCT GTT TCG GT
R: TTT CCC AAA ACA ATC CGC T
EST 10 L: AGC AAA GTG GAT GAC CTG CT
R: GTG CTC TCC CTC CTC TTC CT
EST 11 L: AAC GAC AGG TAT CGT CCT GG
R: GTC CAG AGC GAC GTA ACA CA
EST 12 L: GCC AGA GTT TGG CAT TTC AT
R: TGG CAT CTT GGA CTT CAC AG
EST 13 L: CAC AGA GAT CGG GGA ACT GT
R: TGC GGC TGT ACT GAA AAG TG
EST 14 L: TGT TTG AAA ACG GGT GTG AA
R: CCC TGT TGG TTT ATG GGA AA
EST 15 L: AGA ATC GCC TAG CCA GGA AC
R: CTC AAT TTC TCG GCG AAC TC
EST 16 L: GAC GTC AGT CCC TTC AAC AT
R: CCC GAA GTA TCG GTC AGT GT
EST 17 L: GGC TGT CAG TGG AAG GAG AG
R: TCT CGA TGC AGC AGC ATA TC
EST 18 L: CAG TGT CCT CAG CAG CTT TG
R: GAG CTT GAT CTT CCT CTC GC
EST 19 L: TAA CCT TCT GCC TCG GCT TA
R: GGA GCT CCT AAT GTT TCC AA
EST 20 L: GCT GGT CTG TCT GAT GCA GT
R: CAT TGG GCT TCA AAA CCT GT
29
3.3. Cross species amplifications
20 EST microsatellites DNA marker developed for the Channa striata were tested for cross
amplification of microsatellite loci in ten different species and four populations of channa
striata.
3.4. Preparation of genomic DNA
3.4.1. Genomic DNA isolation
After dissection, piece of muscle tissue was removed and placed in to the tube and then they
have been kept in -80 ⁰C. Genomic DNA from muscle tissue was extracted using CTAB
method. 100 mg of tissue was cut and placed in to pre-chilled mortal. Tissue was ground to
a fine powder under liquid nitrogen by using pestle. The powder was carefully transferred to
a 2 ml tube, then 1000 µl of CTAB extraction buffer was added to the tube to continue
homogenizing the sample tissue. The mixture was treated by 20 µl RNAase and incubated at
60⁰C for 15 minutes. This is followed by the addition of 40 µl of proteinase K to the tube and
vortexing before being incubated at 65 ⁰C for 2 hours until the tissue was completely lysed.
The tube were vortexed during incubation. Following this step, the tube centrifuged at 13,000
rpm for 10 minutes, then 1000 µl of supernatant was carefully transferred in new tube. After
that the equal volume of isoamyle chloroform was added and mixture was mixed by
vortexing. The next step was transferring the top aqueous layer into a new tube without
disturbing the interphase after centrifugation at the speed of 8.000 rpm for 15 min. Two
volumes of 100% ethanol were added to precipitate DNA and sample were kept in -20 ⁰C for
20 min. After this sample was spun at the max speed (13,000 rpm) for 15 min to pellet the

30
DNA. The supernatant was again carefully discarded from the tube and the pellet was washed
with 1000 µl of 80% ethanol by inverting few times followed by centrifugation at 13,000
rpm for 5min. The supernatant was then removed intently by pipetting it out of the tube and
the DNA pellet was allowed to air dry at room temperature for 30 min. The last step of DNA
extraction was resuspending the DNA in 50 µl of TE buffer to dissolve the DNA pellet. The
extracted DNA was then stored at -20 ⁰C for the further investigation.
3.4.2. DNA qualification
The presence of DNA extracted was detected by using both gel electrophoresis and Nano
drop. Agarose gel electrophoresis confirmed the presence of DNA extracted from the scale
samples. For electrophoresis , 3µl of DNA was properly mixed with 2µl of loading dye and
the loaded into 1 % agarose gel. After gel electrophoresis and staining , the gel was viewed
by UV illumination for bands. The concentration of the DNA was determined by
measurement of UV absorbance using a ratio of the OD 260nm/280nm is an indicator of
DNA purity.
To check the quality and purity of extracted DNA, Nanodrop was applied. The absorbance
of DNA were measured at 260 nm and 280 nm wavelengths. The ratio of the reading at 260
nm and 280 nm reflected an estimate of purity of the nucleic acid. DNA with ratio between
1.8 and 2.0 is considered as pure.
Concentration was also measured by Nanodrop. Low concentration cause to fail the PCR due
to lack of template. Too much DNA itself would most likely inhibit the PCR amplification.
If the concentration of DNA is too high, the DNA should be diluted with deionized water.
31
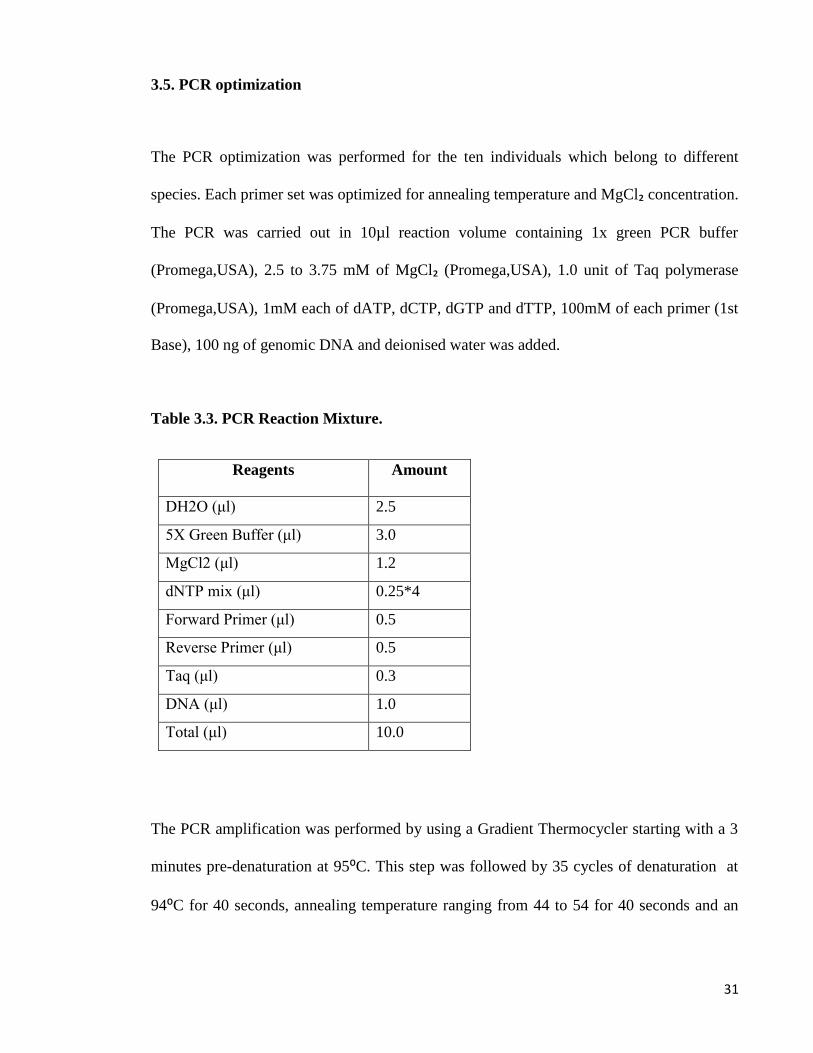
3.5. PCR optimization
The PCR optimization was performed for the ten individuals which belong to different
species. Each primer set was optimized for annealing temperature and MgCl₂ concentration.
The PCR was carried out in 10µl reaction volume containing 1x green PCR buffer
(Promega,USA), 2.5 to 3.75 mM of MgCl₂ (Promega,USA), 1.0 unit of Taq polymerase
(Promega,USA), 1mM each of dATP, dCTP, dGTP and dTTP, 100mM of each primer (1st
Base), 100 ng of genomic DNA and deionised water was added.
Table 3.3. PCR Reaction Mixture.
Reagents Amount
DH2O (μl) 2.5
5X Green Buffer (μl) 3.0
MgCl2 (μl) 1.2
dNTP mix (μl) 0.25*4
Forward Primer (μl) 0.5
Reverse Primer (μl) 0.5
Taq (μl) 0.3
DNA (μl) 1.0
Total (μl) 10.0
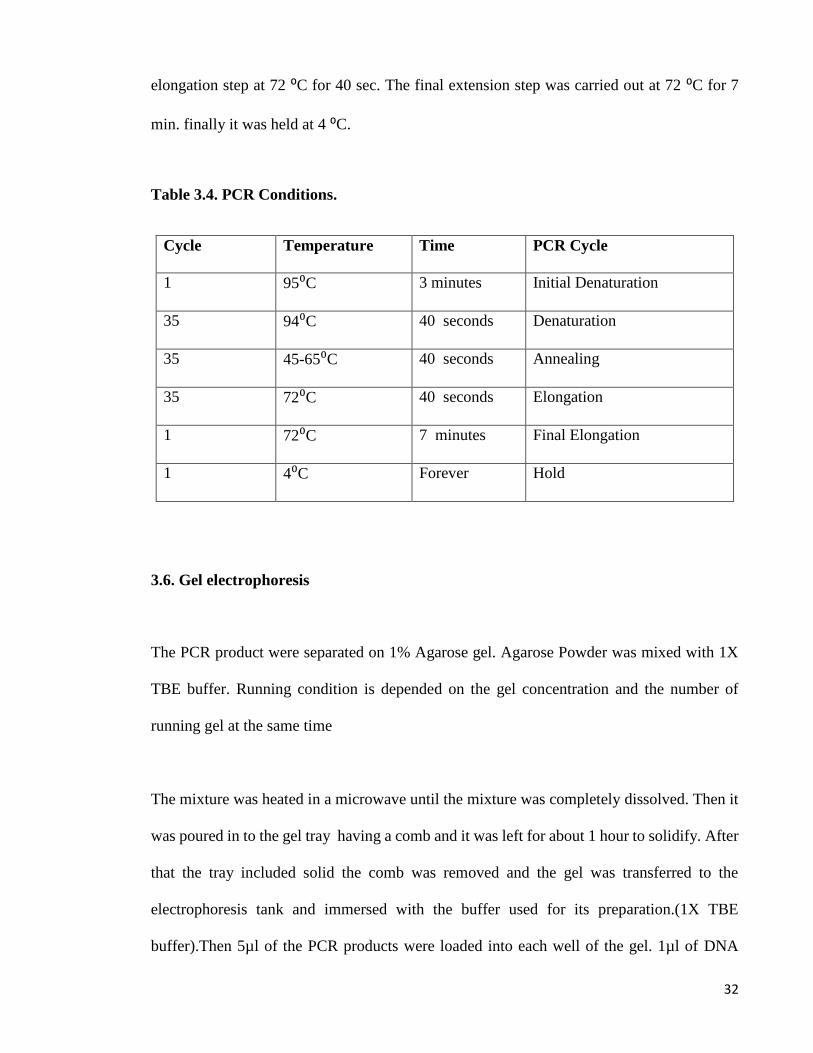
The PCR amplification was performed by using a Gradient Thermocycler starting with a 3
minutes pre-denaturation at 95⁰C. This step was followed by 35 cycles of denaturation at
94⁰C for 40 seconds, annealing temperature ranging from 44 to 54 for 40 seconds and an
32
elongation step at 72 ⁰C for 40 sec. The final extension step was carried out at 72 ⁰C for 7
min. finally it was held at 4 ⁰C.
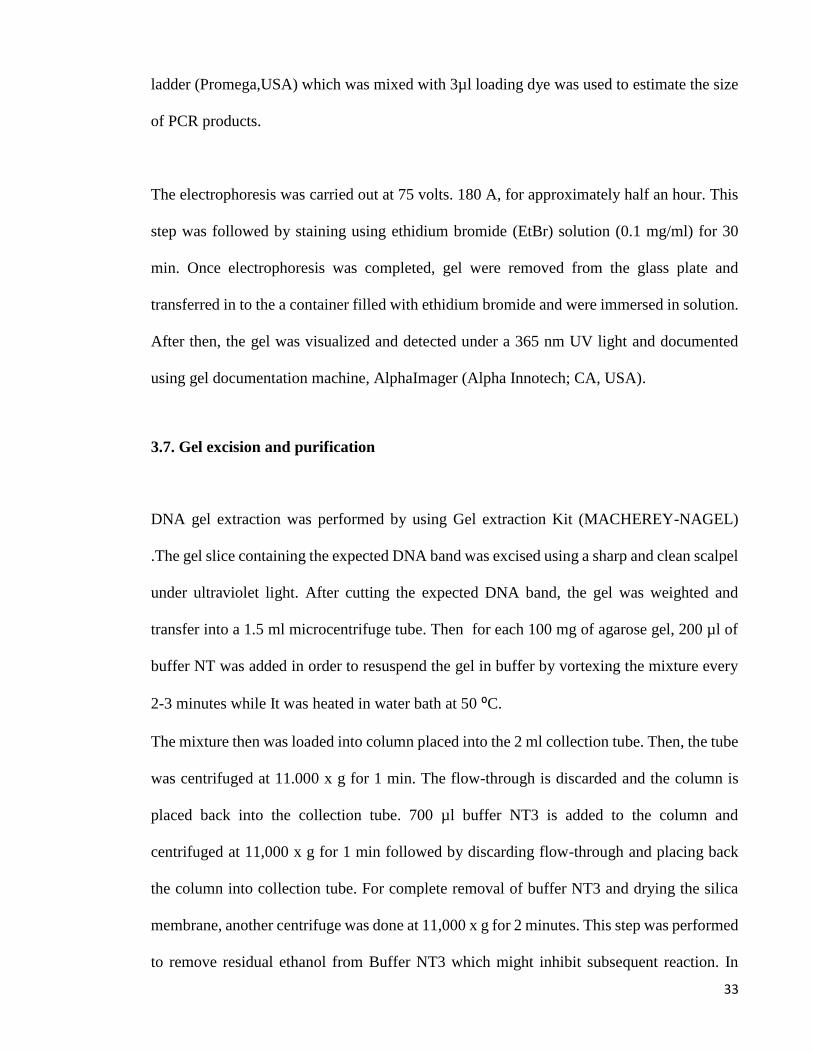
Table 3.4. PCR Conditions.
Cycle Temperature Time PCR Cycle
1 95⁰C 3 minutes Initial Denaturation
35 94⁰C 40 seconds Denaturation
35 45-65⁰C 40 seconds Annealing
35 72⁰C 40 seconds Elongation
1 72⁰C 7 minutes Final Elongation
1 4⁰C Forever Hold
3.6. Gel electrophoresis
The PCR product were separated on 1% Agarose gel. Agarose Powder was mixed with 1X
TBE buffer. Running condition is depended on the gel concentration and the number of
running gel at the same time
The mixture was heated in a microwave until the mixture was completely dissolved. Then it
was poured in to the gel tray having a comb and it was left for about 1 hour to solidify. After
that the tray included solid the comb was removed and the gel was transferred to the
electrophoresis tank and immersed with the buffer used for its preparation.(1X TBE
buffer).Then 5µl of the PCR products were loaded into each well of the gel. 1µl of DNA
33
ladder (Promega,USA) which was mixed with 3µl loading dye was used to estimate the size
of PCR products.
The electrophoresis was carried out at 75 volts. 180 A, for approximately half an hour. This
step was followed by staining using ethidium bromide (EtBr) solution (0.1 mg/ml) for 30
min. Once electrophoresis was completed, gel were removed from the glass plate and
transferred in to the a container filled with ethidium bromide and were immersed in solution.
After then, the gel was visualized and detected under a 365 nm UV light and documented
using gel documentation machine, AlphaImager (Alpha Innotech; CA, USA).
3.7. Gel excision and purification
DNA gel extraction was performed by using Gel extraction Kit (MACHEREY-NAGEL)
.The gel slice containing the expected DNA band was excised using a sharp and clean scalpel
under ultraviolet light. After cutting the expected DNA band, the gel was weighted and
transfer into a 1.5 ml microcentrifuge tube. Then for each 100 mg of agarose gel, 200 µl of
buffer NT was added in order to resuspend the gel in buffer by vortexing the mixture every
2-3 minutes while It was heated in water bath at 50 ⁰C.
The mixture then was loaded into column placed into the 2 ml collection tube. Then, the tube
was centrifuged at 11.000 x g for 1 min. The flow-through is discarded and the column is
placed back into the collection tube. 700 µl buffer NT3 is added to the column and
centrifuged at 11,000 x g for 1 min followed by discarding flow-through and placing back
the column into collection tube. For complete removal of buffer NT3 and drying the silica
membrane, another centrifuge was done at 11,000 x g for 2 minutes. This step was performed
to remove residual ethanol from Buffer NT3 which might inhibit subsequent reaction. In

34
addition to centrifugation, total removal was achieved by incubation at room temperature
over night.
Finally, the NucleoSpin Extract II Column in placed into clean 1.5 ml microcentrifuge tube
and 15-50 µl Buffer NE was added to elute DNA. The tube was incubated at room
temperature for 1 min to increase the yield of eluted DNA. After incubation, the tube was
centrifuged for 1 min at 11,000 x g.(pre heated)
3.8. Testing DNA purification
In order to confirm the occurrence of DNA in purified samples, the purified samples must be
test. Therefore, the gel was made by dissolving 0.4 mg of agarose powder into 40 ml of 1 X
TBE solution (Tris-borate-EDTA: 90mM Tris, 90mM borate and 1mM EDTA). After
making the gel, the gel was placed into the tank containing buffer medium (1 X TBE). Then,
3µl of purified sample was mixed with 3 µl of loading dye (bromophenol blue) and loaded
into the gel. As well as, 2.5 µl of 100bp was loaded into one well. Then , the gel was run by
voltage 80v and current 200 AMP for 40 min. Then, the gel was stained by ethidium bromide
(working concentration 0.5 µg/ml; 10 mg/ml stock) for 15 min and lastly , the picture of the
gel showed the occurrence of DNA in purified sample.
3.9. DNA Sequencing
After testing DNA purification, the purified DNA were sequenced in both forward and
reverse direction on an ABI 3730XL automated sequencer at first base laboratory.
35
3.10. Check for Polymorphism
The PCR products are checked for polymorphism on 4% metaphor Agarose gel at 75 volts
in 1x Tris borate-EDTA buffer for approximately two hours. Gels were stained and visualized
following the method described above. If the size polymorphisms were present, two distinct
bands were observed in heterozygous individuals.
3.11. Analysis of Microsatellite DNA using Genetic Analyser (Fragment Analysis)
If the locus was polymorphic, fragment analysis was performed using a Genetic Analyser
(Applied Biosystems, USA). The microsatellite forward primers were fluorescently labelled
using 5’ FAM dye and were used to amplify the same locus in the individuals of other
populations. As these primers are light sensitive, extra care was taken to protect them from
light.
After PCR using fluorescent primers, the amplified fragments were diluted 10 times in
ddH₂O which was achieved by adding 9 µl ddH₂O to 1µl of the PCR product. 1μl of the
diluted PCR product was transferred in a separate tube and 10μl of HiDi Formamide (Applied
Biosystems) and 0.2 μl of GeneScan™ 500 LIZ™ Size Standard (Applied Biosystems, USA)
were subsequently added. The tubes were vortexed for 2 mins and then centrifuged. They
were then heated at 95 °C for 5mins in an Eppendorf Thermal Cycler to denature double
stranded DNA and immediately kept in an icebox for 5 minutes and then transferred to a 96
well plate and covered. Care was taken that air bubbles were not be trapped inside the wells
of the plate. The plate was loaded into the ABI 3031xl Genetic Analyser. The analysis of full
96 wells took around six hours. The electropherograms were applied to analyze and score the
results using Peak Scanner.
36
Fragment analysis was performed to determine the variation of EST microsatellite allele in
size at each locus.
3.12. Data Analysis
The results from Genetic Analyser were retrieved and scored using the software peak scanner
v1.0 (ABI Applied Biosystems). This software allows visualisation of the chromatograph
result generated by the ABI sequencer, and shows the fragment analysis data in terms of
peaks. These peaks were observed and compared with the GeneScan™ 500 LIZ™ size
standard. The peaks correspond to the exact length in base pairs of the amplified fragment.
The scored microsatellite loci were collated in a Microsoft Excel before statistical analysis
was undertaken using various software packages. The software called MICROCHECKER
was used to check for the presence of stuttering, null alleles and long allele dropouts (van
Oosterhout, et. al., 2004). After that, the scored Excel file was converted to an
“.ARLEQUIN” file using the software called CONVERT (Glaubitz 2004).
Arlequin software was used to test for Hardy-Weinberg Equilibrium (Guo & Thompson,
1992), Linkage disequilibrium (Slatkin, 1994), and to calculate the number of alleles and the
allelic range. The HWE test compares allele and genotype frequencies with the expected
frequencies retrieve from the ideal population (random mating, no mutations, no
selection, no genetic drift, no gene flow and meiotic drive). The population in equilibrium,
the frequency of genotypes depends on the frequency of the genes and both are remain
constant over generations. Violation of one or more HWE assumptions result in deviation of
Hardy Weinberg Equilibrium in a given population. Arlequin was used to compute the
genetic distance, Hardy-Weinberg equilibrium, linkage disequilibrium and pairwise
37
differences which were achieved by calculation of the observed heterozygosity (Ho) and
expected heterozygosity (He) values per locus in each population.
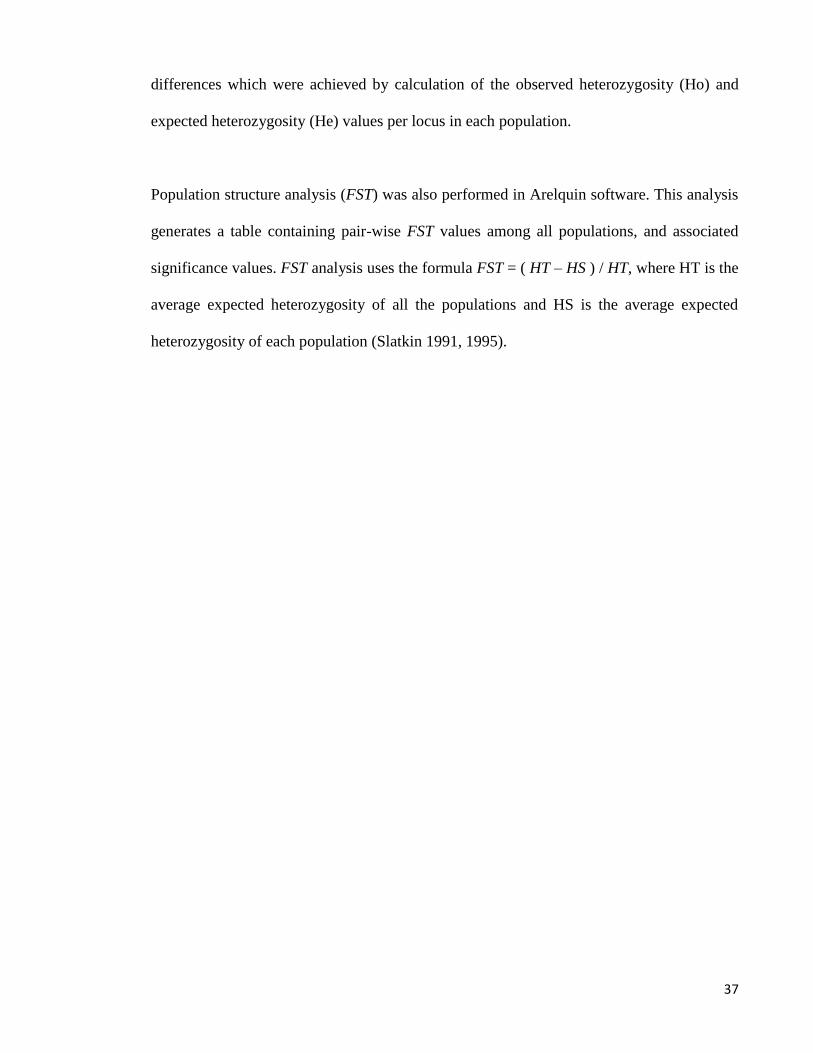
Population structure analysis (FST) was also performed in Arelquin software. This analysis
generates a table containing pair-wise FST values among all populations, and associated
significance values. FST analysis uses the formula FST = ( HT – HS ) / HT, where HT is the
average expected heterozygosity of all the populations and HS is the average expected
heterozygosity of each population (Slatkin 1991, 1995).
CHAPTER4: RESULTS
38
CHAPTER 4
RESULTS
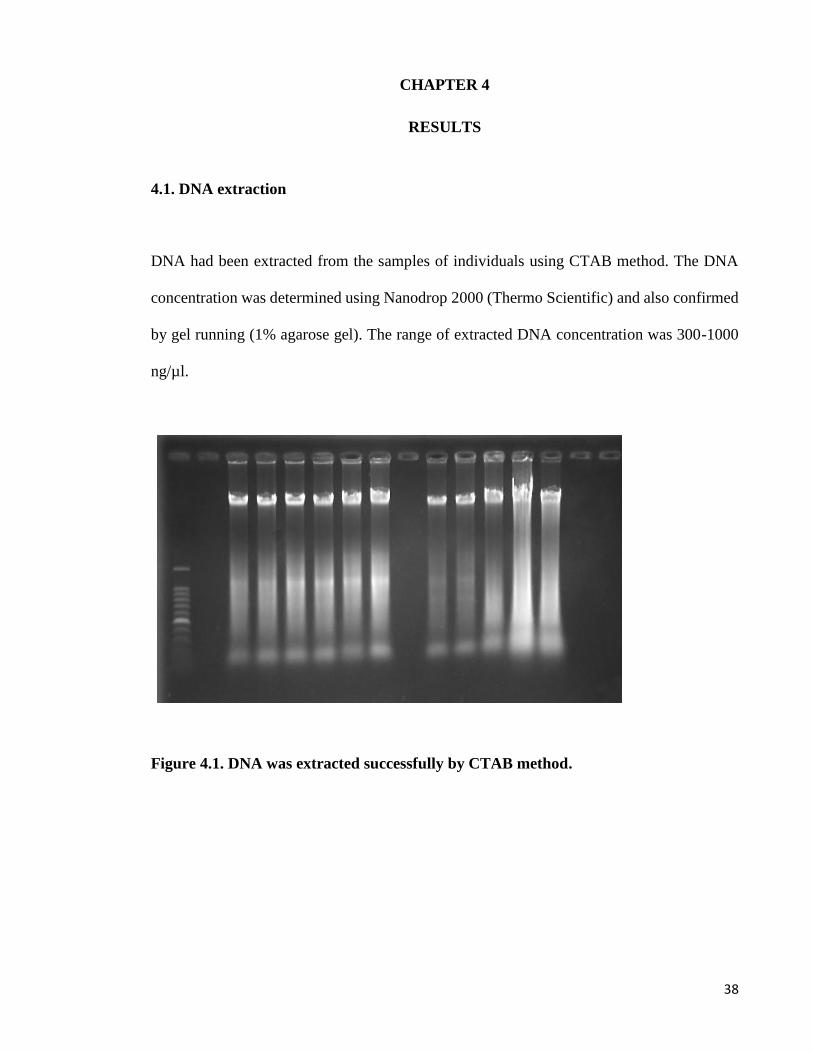
4.1. DNA extraction
DNA had been extracted from the samples of individuals using CTAB method. The DNA
concentration was determined using Nanodrop 2000 (Thermo Scientific) and also confirmed
by gel running (1% agarose gel). The range of extracted DNA concentration was 300-1000
ng/µl.
Figure 4.1. DNA was extracted successfully by CTAB method.
39
4.2. Population study of Channa striata
Microsatellite primer pairs designed from Channa striata RNA sequencing data were used
in the population study of C.striata. The primers were checked for amplification and
optimization before applying in population study.
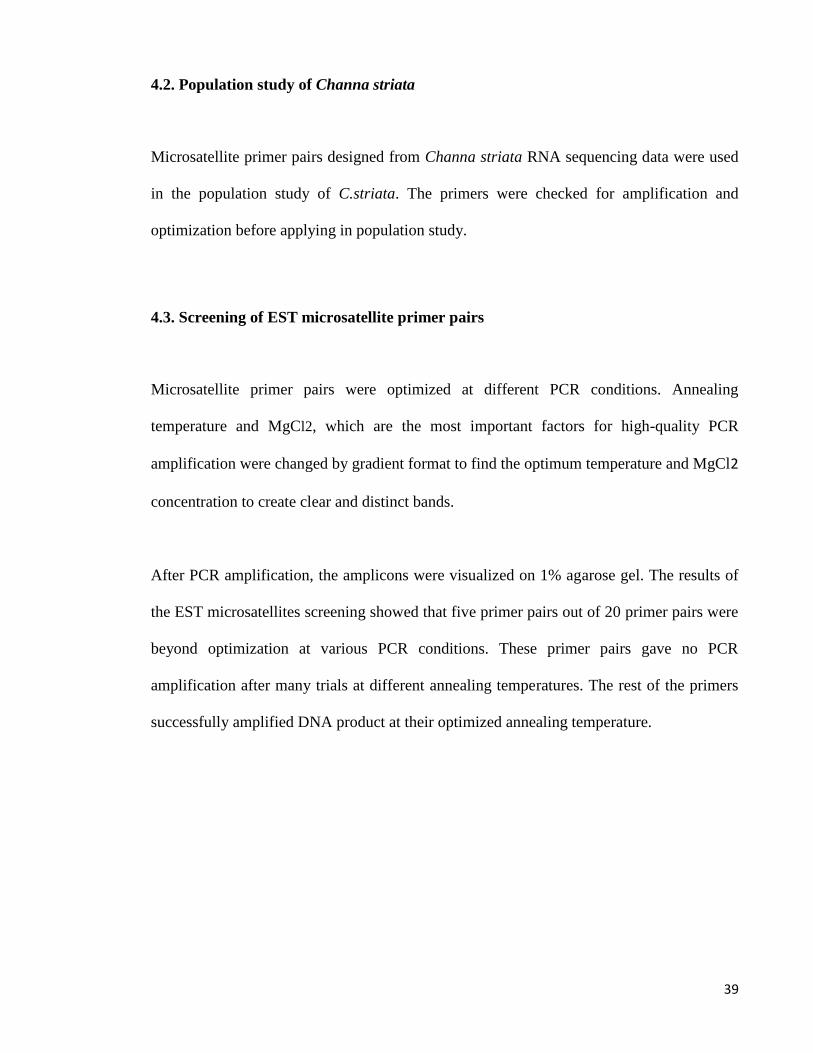
4.3. Screening of EST microsatellite primer pairs
Microsatellite primer pairs were optimized at different PCR conditions. Annealing
temperature and MgCl2, which are the most important factors for high-quality PCR
amplification were changed by gradient format to find the optimum temperature and MgCl2
concentration to create clear and distinct bands.
After PCR amplification, the amplicons were visualized on 1% agarose gel. The results of
the EST microsatellites screening showed that five primer pairs out of 20 primer pairs were
beyond optimization at various PCR conditions. These primer pairs gave no PCR
amplification after many trials at different annealing temperatures. The rest of the primers
successfully amplified DNA product at their optimized annealing temperature.
40
L100 1 2 3 4 5 6 7 8 9 10 11 12
Figure 4.2. Optimization of primer EST-01F and 01R. The gradient temperature
was 45 °C (lane 1) to 55 °C (lane 12).
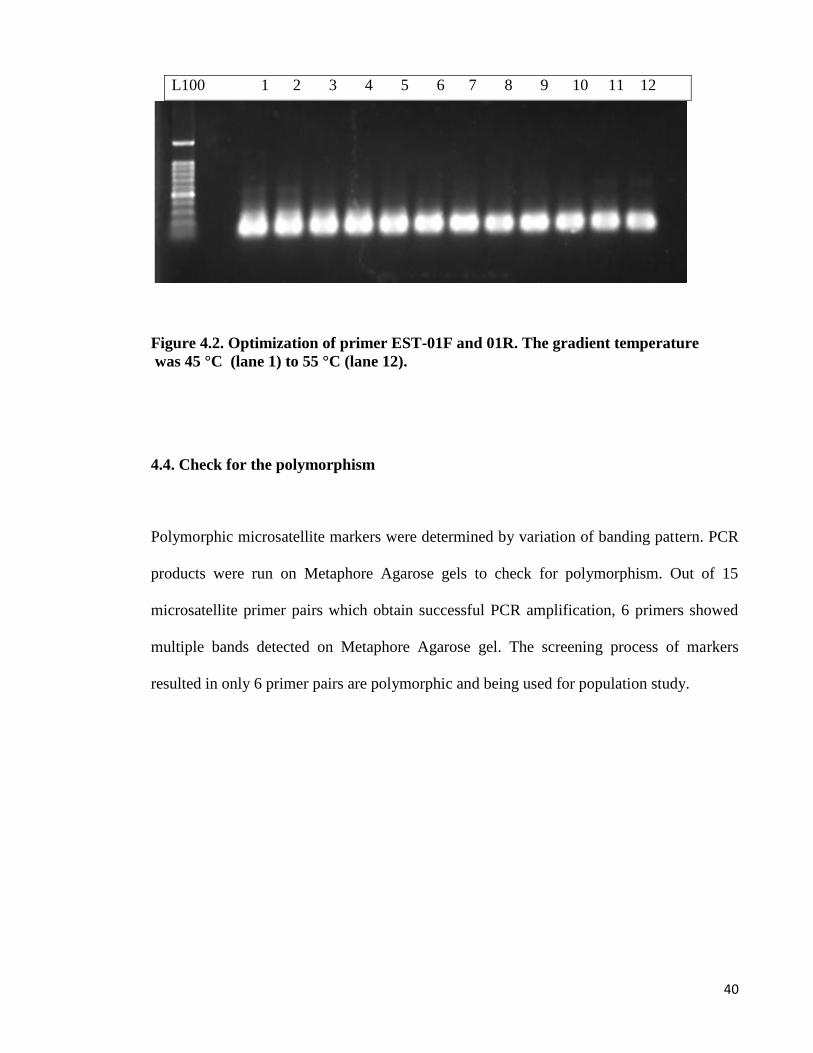
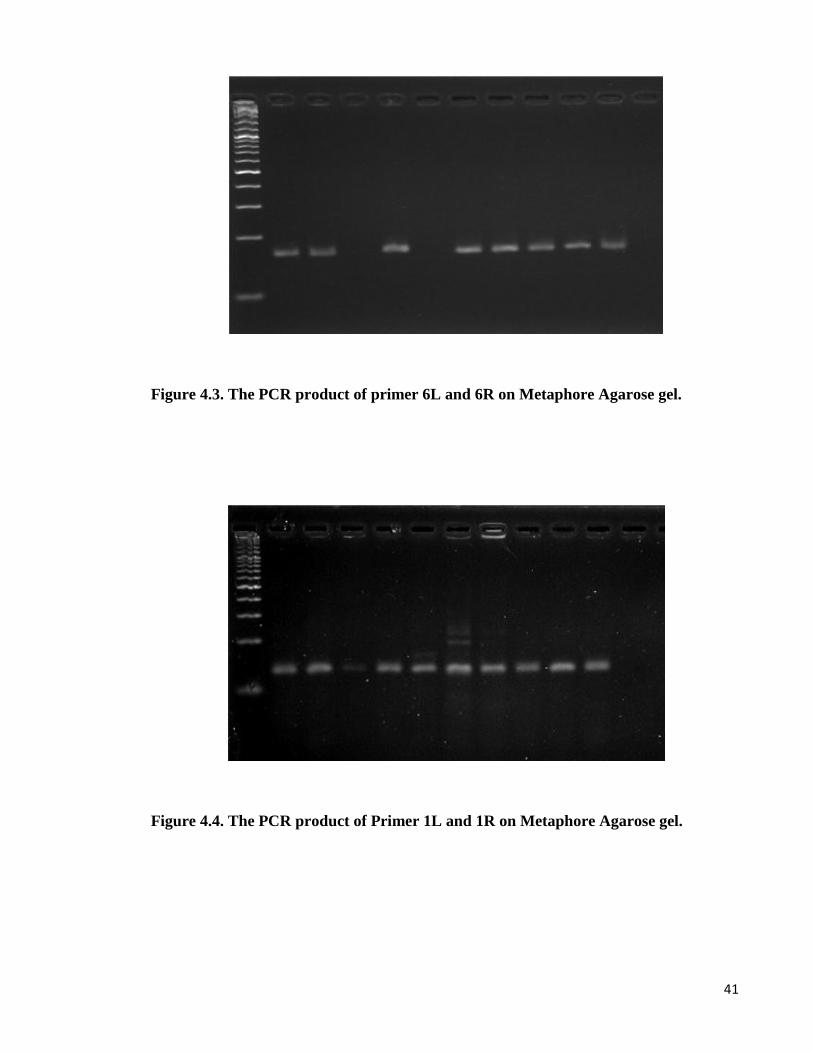
4.4. Check for the polymorphism
Polymorphic microsatellite markers were determined by variation of banding pattern. PCR
products were run on Metaphore Agarose gels to check for polymorphism. Out of 15
microsatellite primer pairs which obtain successful PCR amplification, 6 primers showed
multiple bands detected on Metaphore Agarose gel. The screening process of markers
resulted in only 6 primer pairs are polymorphic and being used for population study.
41
Figure 4.3. The PCR product of primer 6L and 6R on Metaphore Agarose gel.
Figure 4.4. The PCR product of Primer 1L and 1R on Metaphore Agarose gel.
42
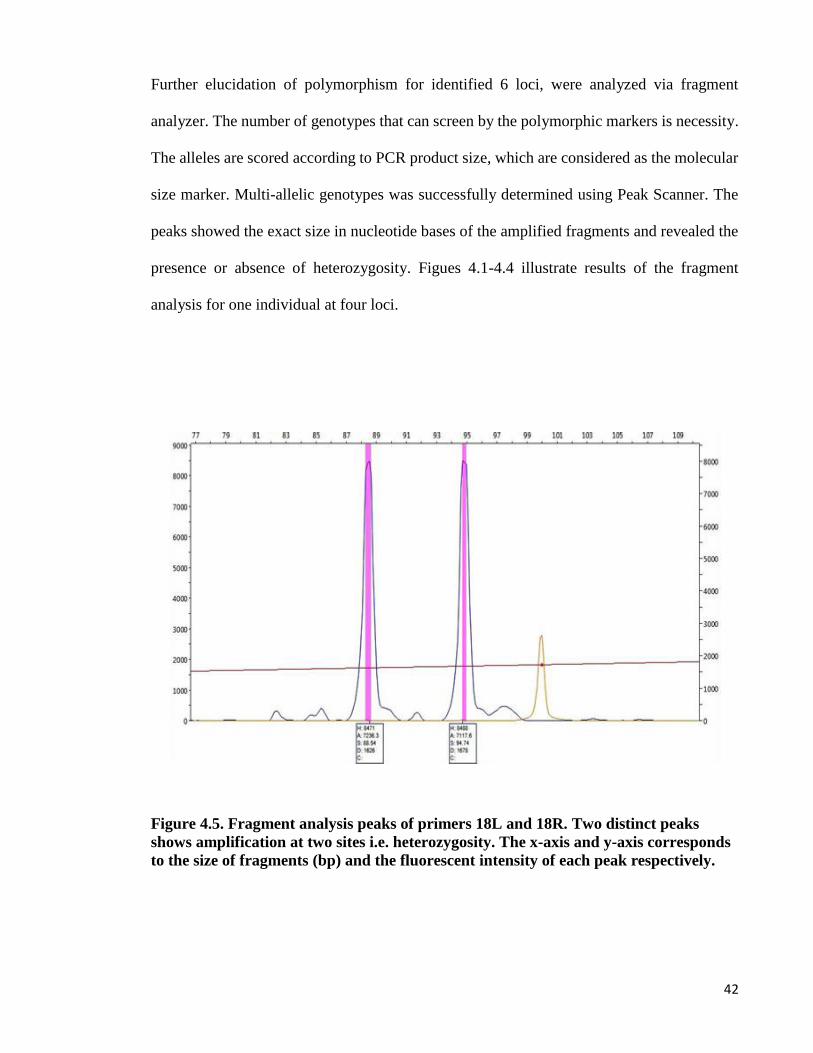
Further elucidation of polymorphism for identified 6 loci, were analyzed via fragment
analyzer. The number of genotypes that can screen by the polymorphic markers is necessity.
The alleles are scored according to PCR product size, which are considered as the molecular
size marker. Multi-allelic genotypes was successfully determined using Peak Scanner. The
peaks showed the exact size in nucleotide bases of the amplified fragments and revealed the
presence or absence of heterozygosity. Figues 4.1-4.4 illustrate results of the fragment
analysis for one individual at four loci.
Figure 4.5. Fragment analysis peaks of primers 18L and 18R. Two distinct peaks
shows amplification at two sites i.e. heterozygosity. The x-axis and y-axis corresponds
to the size of fragments (bp) and the fluorescent intensity of each peak respectively.
43
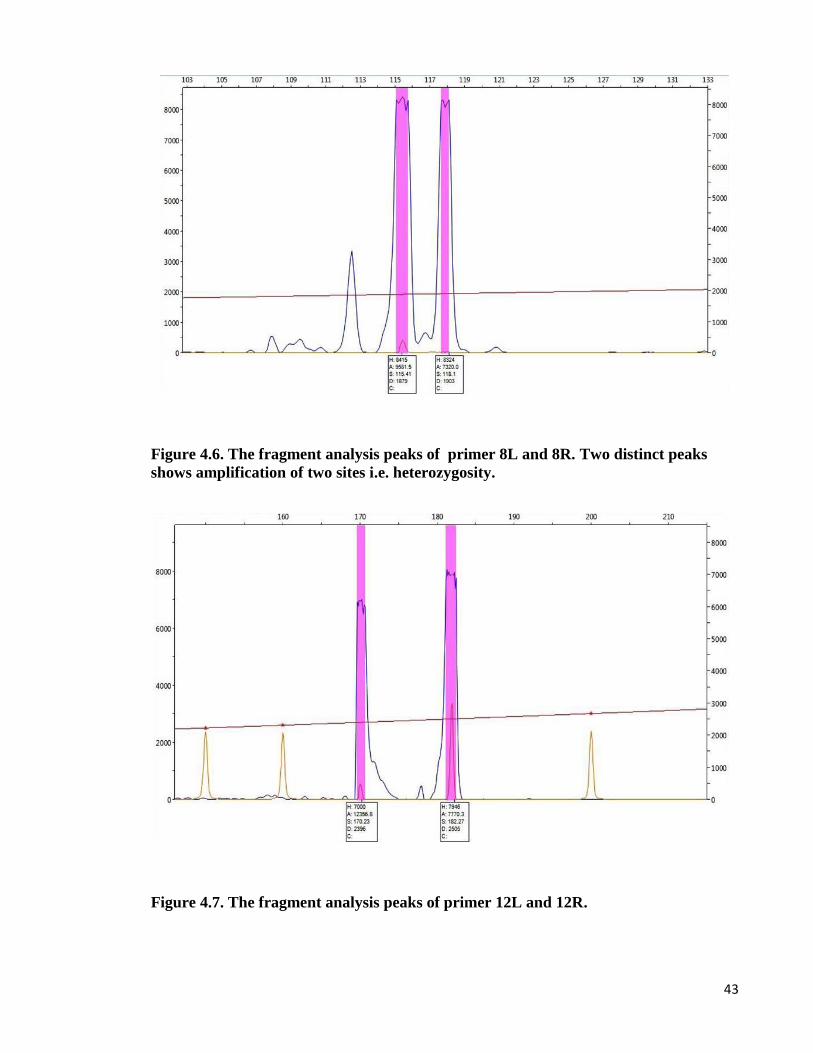
Figure 4.6. The fragment analysis peaks of primer 8L and 8R. Two distinct peaks
shows amplification of two sites i.e. heterozygosity.
Figure 4.7. The fragment analysis peaks of primer 12L and 12R.

44
Figure 4.8. The fragment analysis peaks of primer 1L and 1R. Only one clear shows
amplification at one site i.e. homozygosity.
45
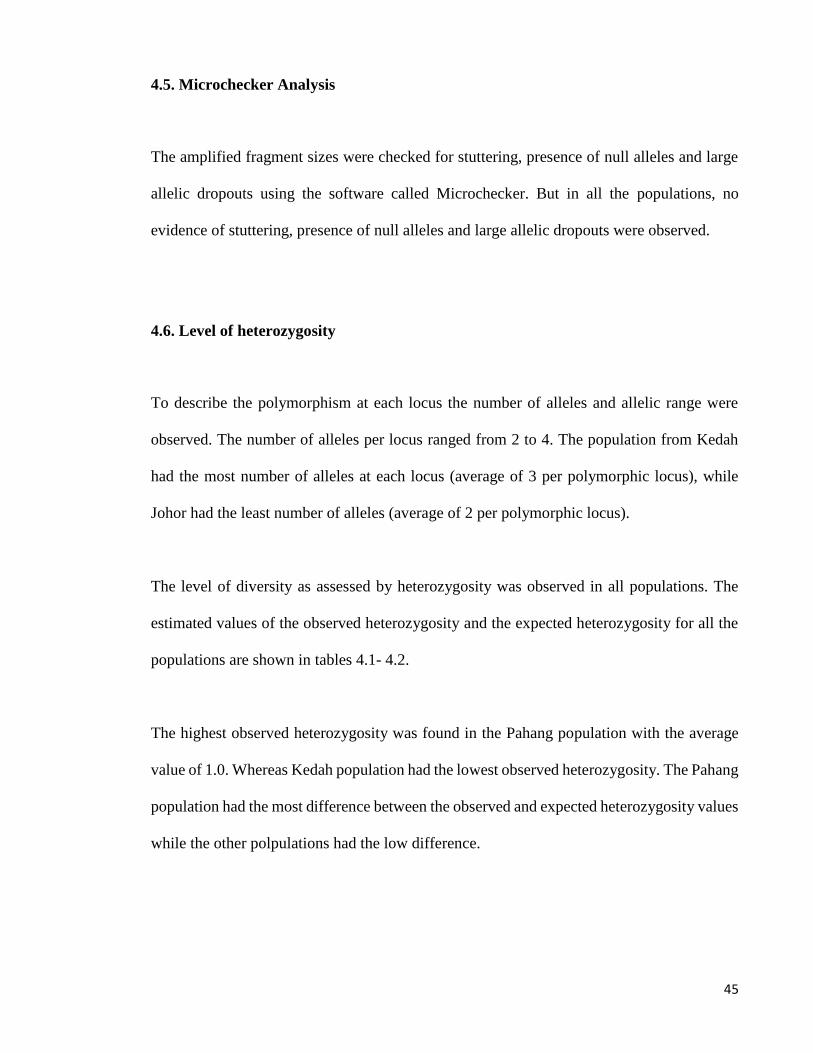
4.5. Microchecker Analysis
The amplified fragment sizes were checked for stuttering, presence of null alleles and large
allelic dropouts using the software called Microchecker. But in all the populations, no
evidence of stuttering, presence of null alleles and large allelic dropouts were observed.
4.6. Level of heterozygosity
To describe the polymorphism at each locus the number of alleles and allelic range were
observed. The number of alleles per locus ranged from 2 to 4. The population from Kedah
had the most number of alleles at each locus (average of 3 per polymorphic locus), while
Johor had the least number of alleles (average of 2 per polymorphic locus).
The level of diversity as assessed by heterozygosity was observed in all populations. The
estimated values of the observed heterozygosity and the expected heterozygosity for all the
populations are shown in tables 4.1- 4.2.
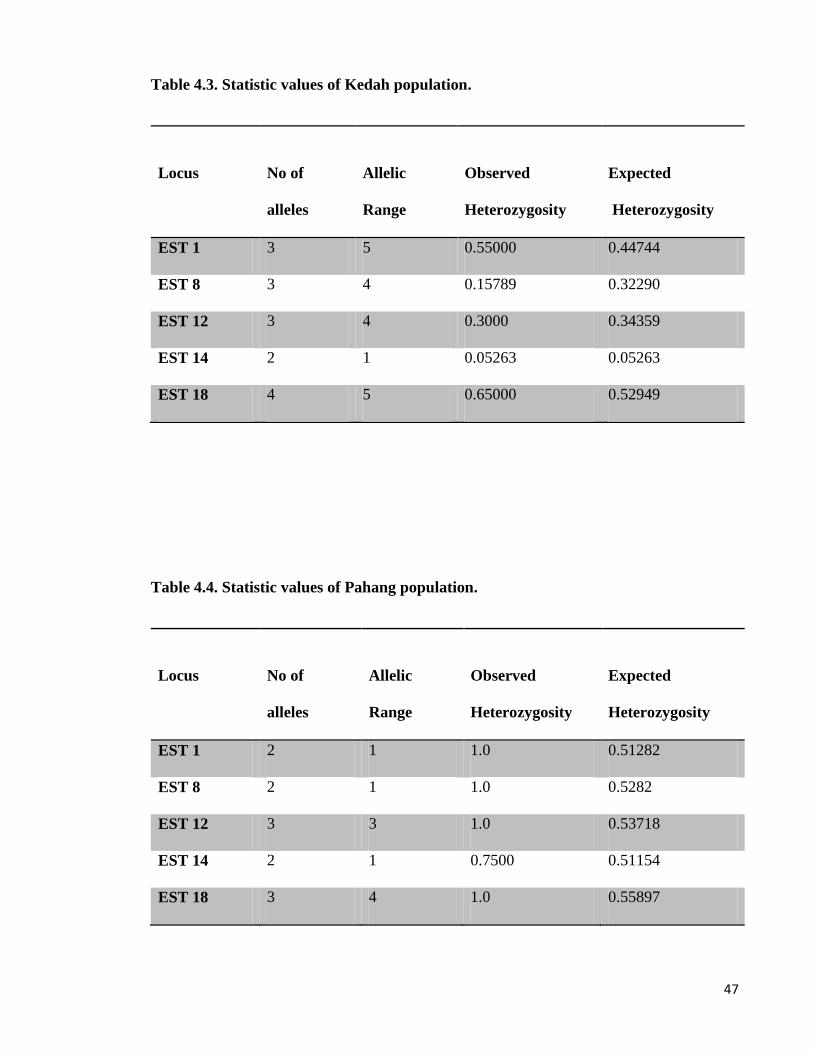
The highest observed heterozygosity was found in the Pahang population with the average
value of 1.0. Whereas Kedah population had the lowest observed heterozygosity. The Pahang
population had the most difference between the observed and expected heterozygosity values
while the other polpulations had the low difference.

46
Table 4.1. Statistic values of Sarawak population.
Locus
No of
alleles
Allelic
Range
Observed
Heterozygosity
Expected
Heterozygosity
EST 1 - - - -
EST 8 2 4 0.44444 0.36601
EST 12 3 2 0.40000 0.67895
EST 14 2 1 0.66667 0.47059
EST 18 - - - -
Table 4.2. Statistic values of Johor population.
Locus
No of
alleles
Allelic
Range
Observed
Heterozygosity
Expected
Heterozygosity
EST 1 2 1 0.05263 0.05263
EST 8 2 1 0.9000 0.50769
EST 12 2 1 0.25000 0.22436
EST 14 2 1 0.45000 0.45000
EST 18 2 1 0.00 0.09744
47
Table 4.3. Statistic values of Kedah population.
Locus
No of
alleles
Allelic
Range
Observed
Heterozygosity
Expected
Heterozygosity
EST 1 3 5 0.55000 0.44744
EST 8 3 4 0.15789 0.32290
EST 12 3 4 0.3000 0.34359
EST 14 2 1 0.05263 0.05263
EST 18 4 5 0.65000 0.52949
Table 4.4. Statistic values of Pahang population.
Locus
No of
alleles
Allelic
Range
Observed
Heterozygosity
Expected
Heterozygosity
EST 1 2 1 1.0 0.51282
EST 8 2 1 1.0 0.5282
EST 12 3 3 1.0 0.53718
EST 14 2 1 0.7500 0.51154
EST 18 3 4 1.0 0.55897
48
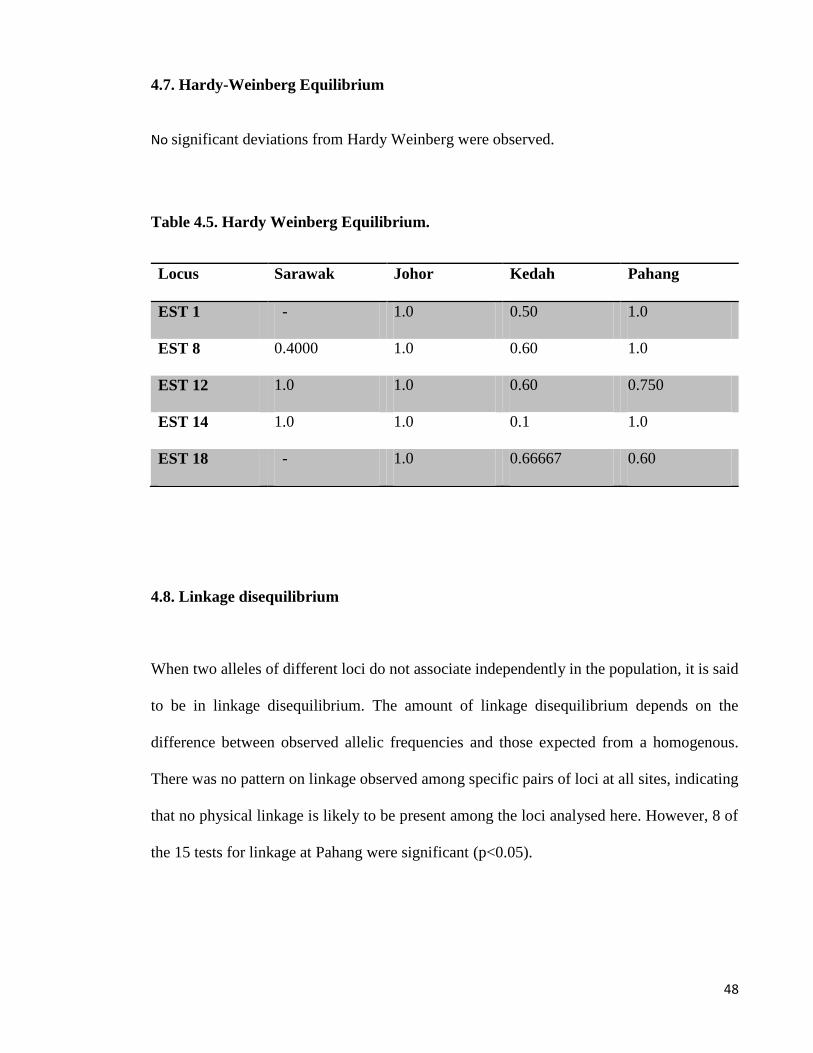
4.7. Hardy-Weinberg Equilibrium
No significant deviations from Hardy Weinberg were observed.
Table 4.5. Hardy Weinberg Equilibrium.
Locus Sarawak Johor Kedah Pahang
EST 1 - 1.0 0.50 1.0
EST 8 0.4000 1.0 0.60 1.0
EST 12 1.0 1.0 0.60 0.750
EST 14 1.0 1.0 0.1 1.0
EST 18 - 1.0 0.66667 0.60
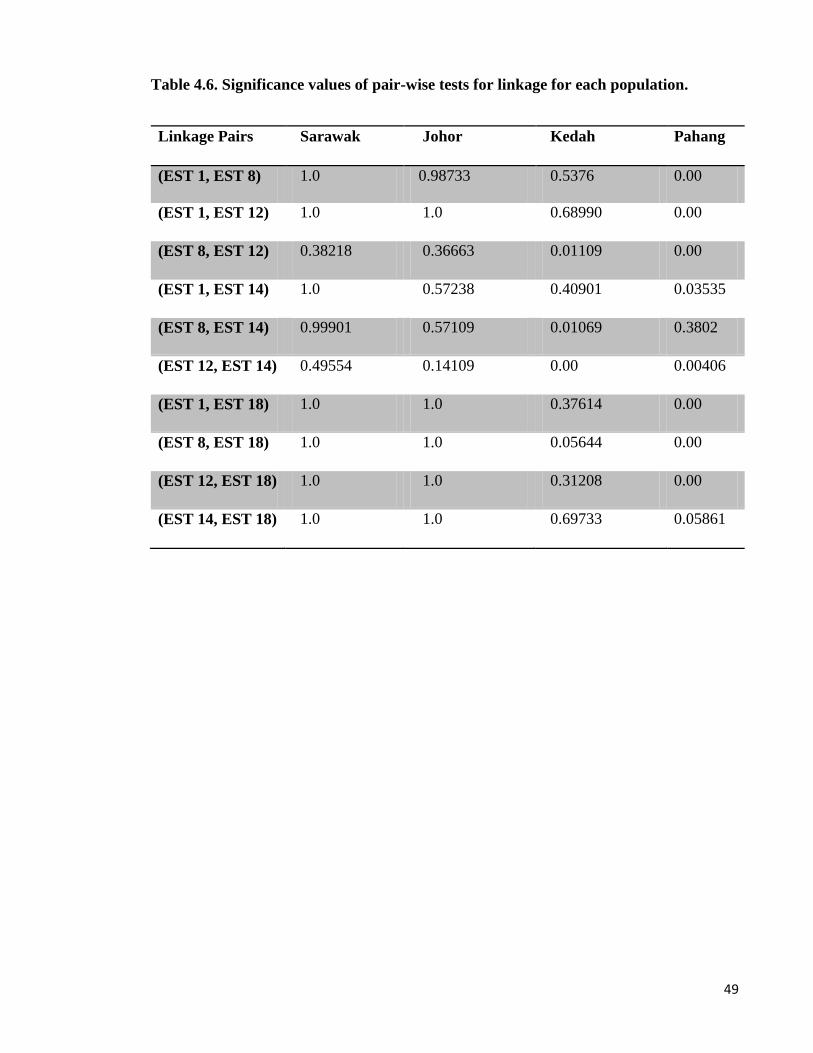
4.8. Linkage disequilibrium
When two alleles of different loci do not associate independently in the population, it is said
to be in linkage disequilibrium. The amount of linkage disequilibrium depends on the
difference between observed allelic frequencies and those expected from a homogenous.
There was no pattern on linkage observed among specific pairs of loci at all sites, indicating
that no physical linkage is likely to be present among the loci analysed here. However, 8 of
the 15 tests for linkage at Pahang were significant (p<0.05).
49
Table 4.6. Significance values of pair-wise tests for linkage for each population.
Linkage Pairs Sarawak Johor Kedah Pahang
(EST 1, EST 8) 1.0 0.98733 0.5376 0.00
(EST 1, EST 12) 1.0 1.0 0.68990 0.00
(EST 8, EST 12) 0.38218 0.36663 0.01109 0.00
(EST 1, EST 14) 1.0 0.57238 0.40901 0.03535
(EST 8, EST 14) 0.99901 0.57109 0.01069 0.3802
(EST 12, EST 14) 0.49554 0.14109 0.00 0.00406
(EST 1, EST 18) 1.0 1.0 0.37614 0.00
(EST 8, EST 18) 1.0 1.0 0.05644 0.00
(EST 12, EST 18) 1.0 1.0 0.31208 0.00
(EST 14, EST 18) 1.0 1.0 0.69733 0.05861
50
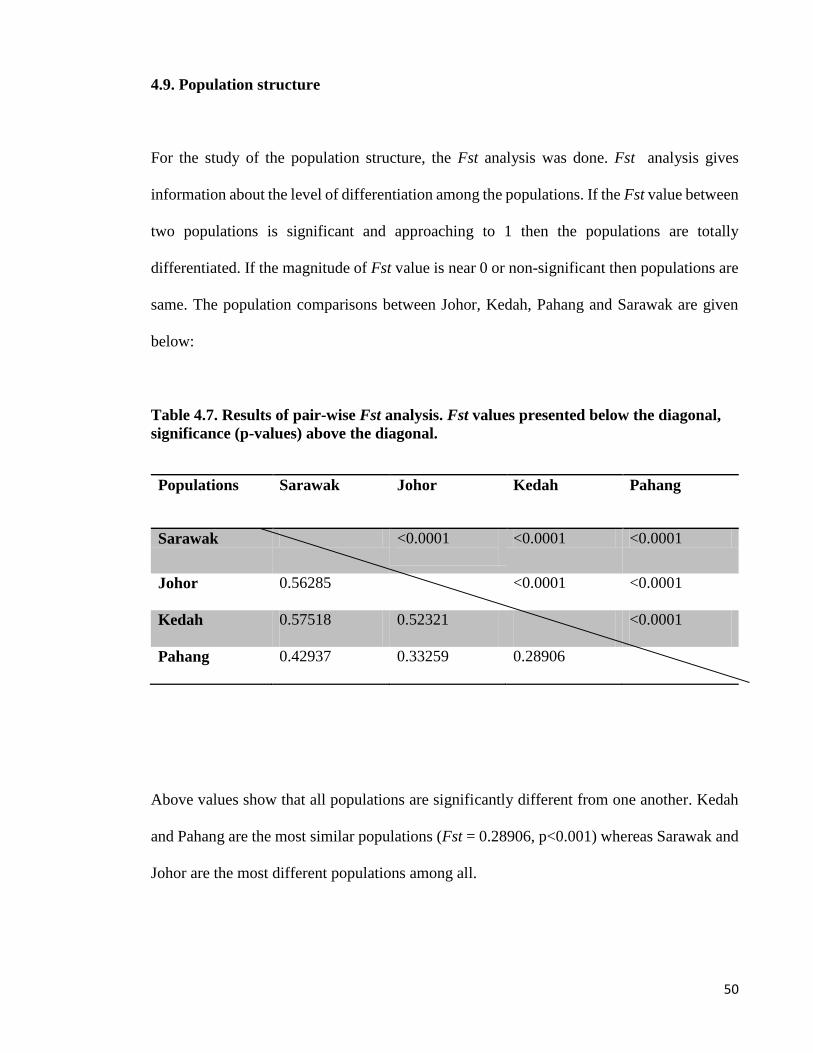
4.9. Population structure
For the study of the population structure, the Fst analysis was done. Fst analysis gives
information about the level of differentiation among the populations. If the Fst value between
two populations is significant and approaching to 1 then the populations are totally
differentiated. If the magnitude of Fst value is near 0 or non-significant then populations are
same. The population comparisons between Johor, Kedah, Pahang and Sarawak are given
below:
Table 4.7. Results of pair-wise Fst analysis. Fst values presented below the diagonal,
significance (p-values) above the diagonal.
Populations Sarawak Johor Kedah Pahang
Sarawak <0.0001
<0.0001 <0.0001
Johor 0.56285 <0.0001 <0.0001
Kedah 0.57518 0.52321 <0.0001
Pahang 0.42937 0.33259 0.28906
Above values show that all populations are significantly different from one another. Kedah
and Pahang are the most similar populations (Fst = 0.28906, p<0.001) whereas Sarawak and
Johor are the most different populations among all.
51
4.10. Cross-species amplification study
Among 20 loci of EST microsatellite markers developed in C.striata, those primers which
were able to optimized chosen for use in cross-species amplification. The loci of EST
microsatellites were cross-species amplified in DNA samples from 11 different species. Out
of 10 species were screened for cross amplification, only one species produced distinct and
clear bands. The clear bands were purified from the gel and were sent for sequencing to
confirm the presence of microsatellite repeats. DNA sequencing involves determining the
exact order of bases that form a DNA segment. Each base in the nucleotide sequence was
detected and used laser by automatic sequencing machine. The results were analysed in
Chromas or Sequence Scanner software.
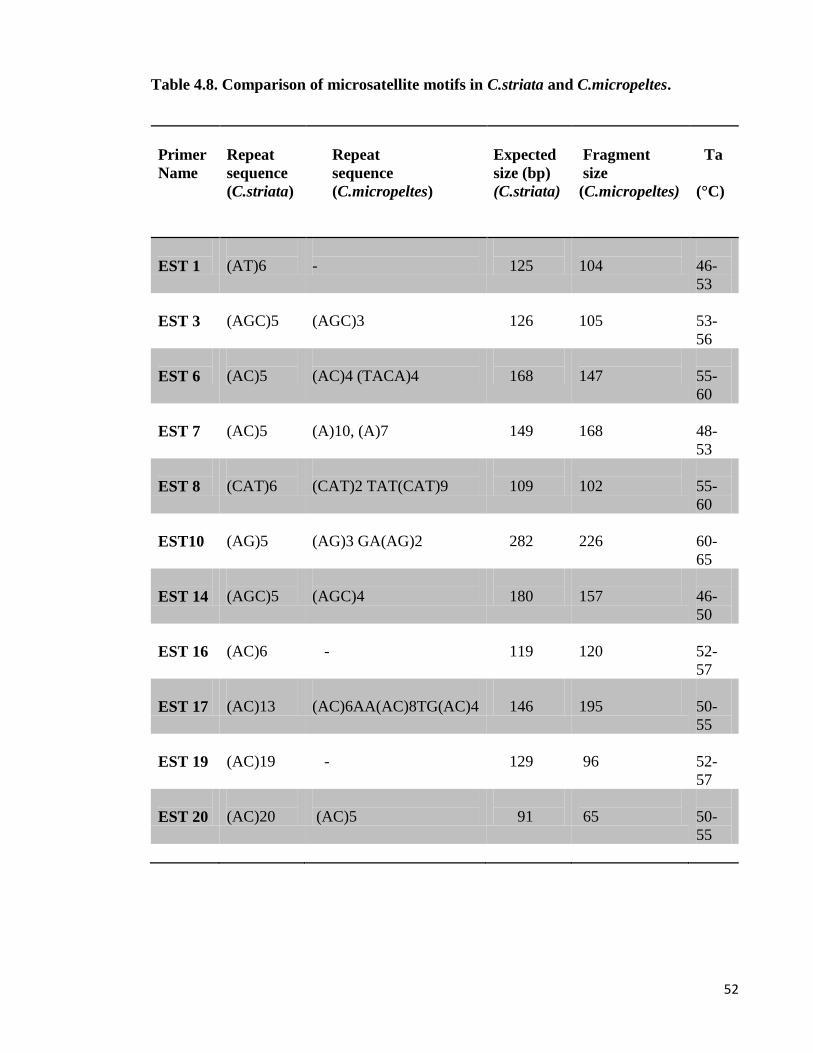
Table 4.8. shows the comparison of microsatellite repeat motifs of C.striata and
C.micropeltes. The results indicated successful-cross amplification in two species of
channidae family which can prove highly conservation of microsatellite motifs in a different
species.
52
Table 4.8. Comparison of microsatellite motifs in C.striata and C.micropeltes.
Primer
Name
Repeat
sequence
(C.striata)
Repeat
sequence
(C.micropeltes)
Expected
size (bp)
(C.striata)
Fragment
size
(C.micropeltes)
Ta
(°C)
EST 1
(AT)6
-
125
104
46-
53
EST 3
(AGC)5
(AGC)3
126
105
53-
56
EST 6
(AC)5
(AC)4 (TACA)4
168
147
55-
60
EST 7
(AC)5
(A)10, (A)7
149
168
48-
53
EST 8
(CAT)6
(CAT)2 TAT(CAT)9
109
102
55-
60
EST10
(AG)5
(AG)3 GA(AG)2
282
226
60-
65
EST 14
(AGC)5
(AGC)4
180
157
46-
50
EST 16
(AC)6
-
119
120
52-
57
EST 17
(AC)13
(AC)6AA(AC)8TG(AC)4
146
195
50-
55
EST 19
(AC)19
-
129
96
52-
57
EST 20
(AC)20
(AC)5
91
65
50-
55
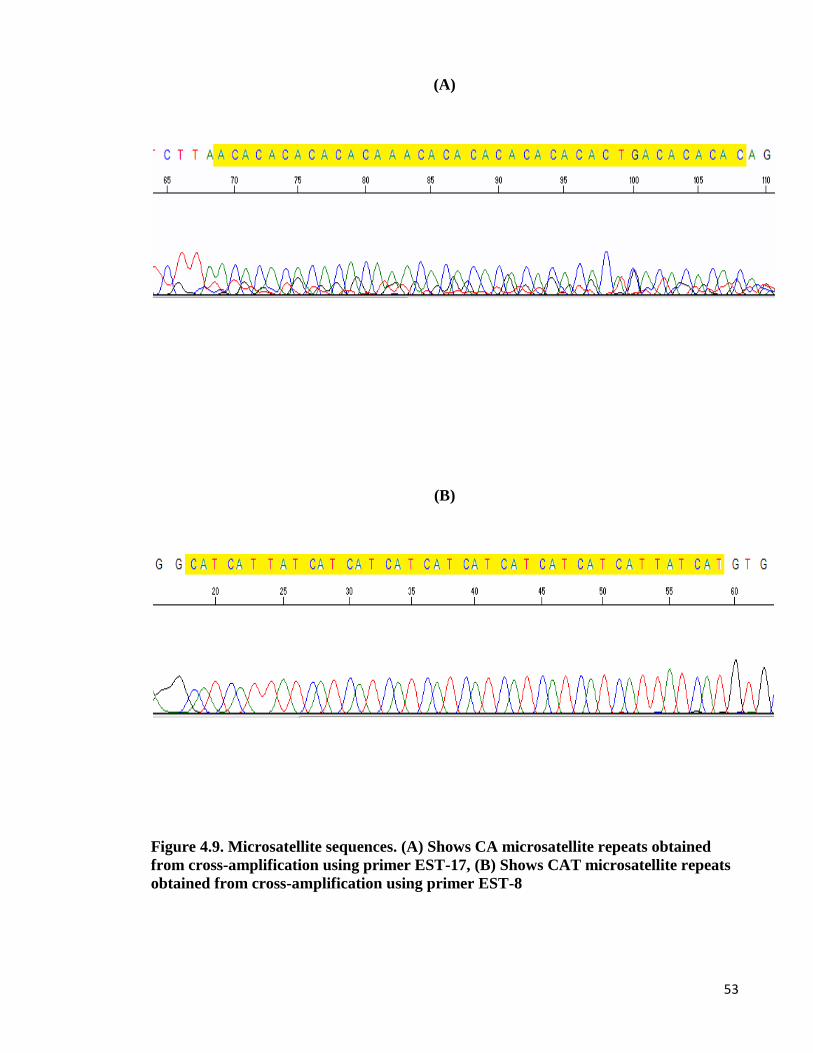
53
(A)
(B)
Figure 4.9. Microsatellite sequences. (A) Shows CA microsatellite repeats obtained
from cross-amplification using primer EST-17, (B) Shows CAT microsatellite repeats
obtained from cross-amplification using primer EST-8
54
CHAPTER5: SCUSSION
CHAPTER 5
DISCUSSION
In this study, EST-SSR markers developed for C.striata were applied to analysis the
population structure and screen for transferability across 10 species (Cross-species
amplification).
Despite the lower level of polymorphism found in EST derived SSR compared to genomic
SSRs, these markers have been investigated in recent years in many plant and animal species
due to several factors which enhance the value of EST-SSR including, detection of variation
in transcribed regions of the genome, higher transferability across closely related species and
fast and cost effective development.
Primer pairs were optimized first for polymerase chain reaction (PCR) especially by
changing annealing temperature. Of the 20 microsatellite primer pairs, 15 pairs were
amplified successfully and gave PCR products of expected size. Among these microsatellite
primers only 6 pairs were found to be polymorphic.
5.1. Level of heterozygosity
Since heterozygosity is associated with the amount of genetic variation, it is commonly
applied to measure genetic diversity (Slate and Pemberton, 2002). According to the
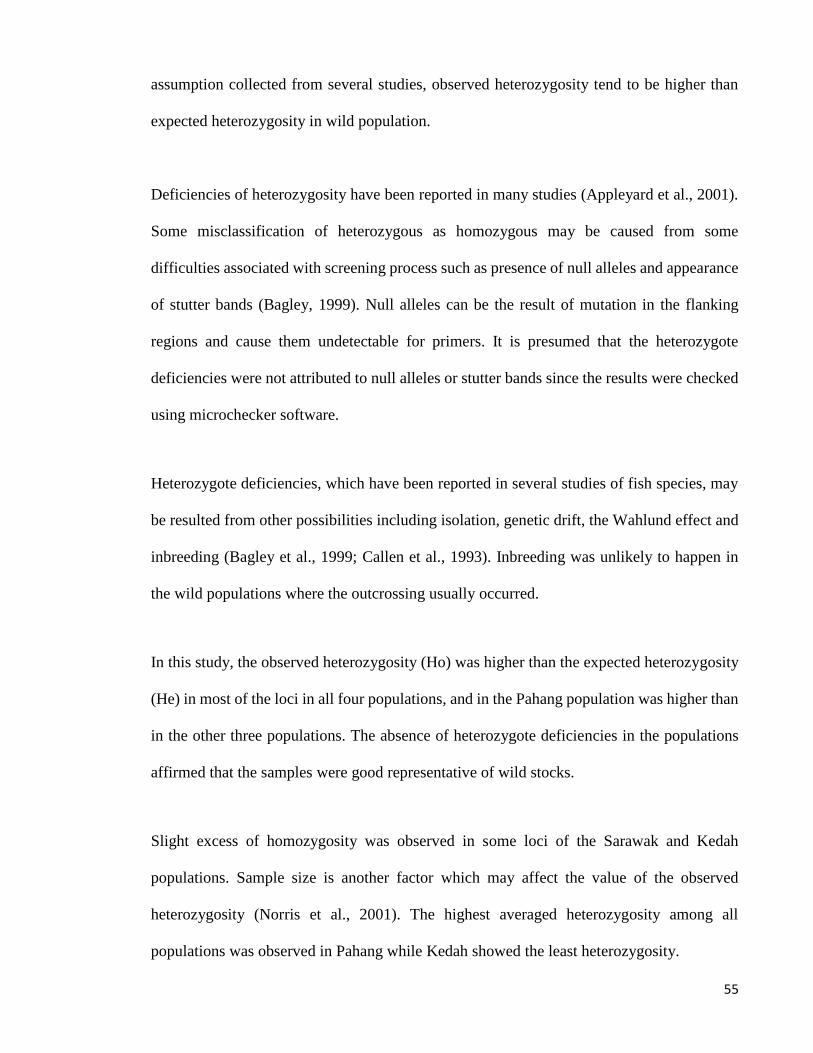
55
assumption collected from several studies, observed heterozygosity tend to be higher than
expected heterozygosity in wild population.
Deficiencies of heterozygosity have been reported in many studies (Appleyard et al., 2001).
Some misclassification of heterozygous as homozygous may be caused from some
difficulties associated with screening process such as presence of null alleles and appearance
of stutter bands (Bagley, 1999). Null alleles can be the result of mutation in the flanking
regions and cause them undetectable for primers. It is presumed that the heterozygote
deficiencies were not attributed to null alleles or stutter bands since the results were checked
using microchecker software.
Heterozygote deficiencies, which have been reported in several studies of fish species, may
be resulted from other possibilities including isolation, genetic drift, the Wahlund effect and
inbreeding (Bagley et al., 1999; Callen et al., 1993). Inbreeding was unlikely to happen in
the wild populations where the outcrossing usually occurred.
In this study, the observed heterozygosity (Ho) was higher than the expected heterozygosity
(He) in most of the loci in all four populations, and in the Pahang population was higher than
in the other three populations. The absence of heterozygote deficiencies in the populations
affirmed that the samples were good representative of wild stocks.
Slight excess of homozygosity was observed in some loci of the Sarawak and Kedah
populations. Sample size is another factor which may affect the value of the observed
heterozygosity (Norris et al., 2001). The highest averaged heterozygosity among all
populations was observed in Pahang while Kedah showed the least heterozygosity.
56
Number of alleles, heterozygosity and analysis of molecular variance can evaluate levels of
genetic diversity and population differentiation, which are critical for developing
management and conservation strategies. For this reason, many studies rely on
microsatellites to investigate the population structure due to their attractive features (Avise,
1996)
5.2. Hardy-Weinberg Equilibrium (HWE)
According to the results of microsatellite analysis, there was no evidence of significant
deviation from Hardy Weinberg Equilibrium (HWE) for any population (Sarawak, Johor,
Kedah and Pahang) at any locus.
The HWE test may be violated due to some perturbing factors such as small population, non-
random mating, mutation, inbreeding and selection (Wigginton et al., 2005). Wild
populations may be subjected to mutation, events involving genetic bottleneck, random
genetic drift or natural selection which cause the populations to exhibit departure from HWE.
Non-conformance to HWE is more likely to happen in cultured populations.
Most of the detected deviations from HWE were a result of heterozogout deficiencies. Excess
of homozygotes, which can lead to an imbalance in the proportion of heterozygotes and
homozygotes in a population may be caused by the presence of null alleles. Microchecker
analysis did not identify any large allelic dropouts and null alleles. Occurrence of null alleles
and small sample size contribute to heterozygote deficiencies which is the most common
reason for deviation from HWE. Probably for highly polymorphic loci, bigger sample sizes
are required to achieve HWE.

57
5.3. Linkage Disequilibrium (LD)
Linkage disequilibrium (LD) is a powerful tool for analysis population structure. Linkage
disequilibrium can be influenced by some factors including: genetic linkage, selection,
mutation, recombination, genetic drift in small population, non-random mating and
population structure.
Many studies on different populations indicated that LD decreased with the marker distance
only for closely linked loci. However, LD affected by only genetic linkage factor, would be
lost after some generations depending on the rate of recombination between loci (Bozkaya
and Kurar, 2005). A relatively small and constant population size and inbreeding are
suggested result in higher LD, presumably because of genetic drift.
The LD pattern for microsatellite is generally high due to its high rate of mutation and high
number of alleles per locus and able to reflect recent genetically important events, which
occurred in population (Chapman and Wijsman, 1998)
According to LD test conducted in Sarawak, Johor and Kedah, which result in no significant
linkage disequilibrium, it can be considered that the mentioned populations are in linkage
equilibrium. Therefore, these polymorphic loci can be useful markers for analysis of
population and genetic diversity. However, eight of 15 tests for linkage at Pahang population
were significant (p<0.05), suggesting possibly that this sample does not constitute a single
randomly breeding population, or that these loci may be under selection in the Pahang
population. Although this population did not deviate significantly from H-W at any locus, in
each case there was heterozygote excesses observed.

58
5.4. Genetic differentiation between populations (F-statistic)
Population structure study can be estimated from microsatellite allele frequencies. F statistics
is the most common and informative tools for investigation of population structure and
divergence between populations. To assess population differentiations, test of pair wise Fst
was conducted. It was calculated according to the variation of allele frequencies. Fst has been
applied in many studies to investigate the gene flow and linkage pattern among populations
(Wright, 1978). Genetic structure of populations is affected by environmental barriers,
climatic conditions, historical processes and life histories, which are contributed to shape the
divergence between populations (Ball et al., 2000).
It is useful to examine variation at microsatellite loci for determining the genetic structure of
populations (Scribner et al., 1996). Microsatellites are considered the most informative
genetic marker to reveal genetic heterogeneity among geographic samples (O’Connell et al.,
1998; Shaw et al., 1999). This is due to high allelic diversity of microsatellite, which results
in possess discriminating power in detecting subtle population differentiation (Ross et al.,
1999).
The interpretation of Fst values has suggested that the values near to zero indicate the lowest
level of differentiation, moderate and considerable differentiation ranged from 0.05 to 0.15
and 0.15 to 0.25 respectively and the Fst values above 0.25 is noticed as very great genetic
differentiation (Balloux and Lugon-Moulin, 2002).
In this study, pair-wise comparisons of Fst between populations revealed significant
differentiation. The values of Fst in this study lying within the range of 0.29-0.57 indicative
59
of completely differentiation among populations. According to the results, Kedah and
Sarawak were considered as the most different populations among all. This is mainly due to
the long geographical distance between them as Kedah and Sarawak are located in the
northwest of Peninsular Malaysia and the northwest of the island Borneo respectively. The
smallest differentiation belongs to the comparison of Kedah and Pahang which indicated
these two populations are the most similar populations between the others. However, the pair
wise estimators of Fst suggested noticeable genetic differentiation in these two populations
were considered as dissimilar genetic populations. This may be due to the geographical
barrier of Titiwangsa Mountain Range that separates the west coast of Peninsular Malaysia
from the east. Pahang is located on the east coast of Peninsular central while Kedah is situated
on the northwestern area of the west coast.
Isolation by distance can differentiate populations genetically. Populations over long
distances become more divergent than populations in close proximity. Genetic divergence is
directly related to geographical distance between population localities (Gold and Turner,
2002) Isolation by distance is a crucial factor which can differentiate populations genetically.
Gene flow was limited in these populations due to some physical and biological parameters.
Physical processes, natural selection, isolation by distance and stable migration routes are
factors that potentially could prevent gene flow (Gold and Turner, 2002).
5.5. Cross-species amplification of Channa striata EST microsatellite loci
Several studies have shown the sequence conservation of the microsatellites flanking regions
through evolution (Tong et al., 2002). According to this fact, the primers developed for one
60
species can be amplified in closely related species. The efficiency of cross-species
amplification is inversely related to the phylogenetic distance between two species
(Steinkellner et al., 1997).
The purpose of this study is to investigate if the primer pairs developed for Channa striata
could be applied to amplify microsatellite loci in ten other species including
Amblyrhynchicthy truncates, Barbichthys laevis, Barbonymus chwanenfeldii, Cirrhinus
caudimaculatus, Hypsibarbus wetmorei, Osteochilus hasselti, Thynnichthys thynnoides,
Pangasius nasutus, Hampala macrolepidota, which belong to different genus and also the
Channa micropeltes species, which belongs to the same genus for analysis of the effect of
evolutionary distance on cross-species amplification.
It has been assumed that microsatellite loci were more conserved for aquatic species due to
some investigations, which applied heterologous microsatellite markers in aquatic organisms
resulting in some evidence indicating the slower rate of mutation in aquatic species compared
to terrestrial species (Moore et al., 1991; FitzSimmons et al., 1995).
According to the results, low level of transferability of microsatellite loci developed for
Channa striata was found among the nine species. The failed amplification of microsatellite
loci developed for C.striata in other species indicated lack of conserved flanking region in
these species resulting in low transferability which can be attributed to phylogenetic distance
and great diversity of source species. Channa micropeltes was the only species for which the
primers gave very strong banding profile. The sequencing analysis results showed that out of
11 primers amplified in this species, 7 primers could detect the same microsatellite repeats.
This similarity indicated the high conservation of microsatellites across species.

61
The use of heterologous markers on related species is a useful strategy for studies of species
which lack sequence information available and facilities to isolate new microsatellite loci for
particular species. Cross-species amplification can also save time and costs, which are needed
for initial identification of markers. heterologous microsatellite markers have been applied
in phylogenetic and population genetic studies, population divergence, paternity and kinship
analysis. It can also be applied in species or hybrid identification studies. Application of
cross-species amplification can be efficient in construction of genetic linkage map through
hybridization of defined species with other closely related species due to high level of
conservation of microsatellite loci, which is required for comparative genetic mapping.

62
NCLUSION CHAPTER 6
CONCLUSION
This study was conducted to assess the genetic variation among four populations of C.striata
in Malaysia using EST-SSR markers. Among the 20 microsatellites, which were developed
for C.striata, five microsatellite DNA markers were found to be polymorphic. These
polymorphic DNA markers were employed for investigating the population genetic structure.
Data analysis of microsatellite markers revealed that the Pahang population has the highest
heterozygosity among all populations, while the lowest heterozygosity was observed in the
Kedah population. All the populations represented conformance to HWE. Further
investigation detected significant differentiation between populations. According to pair-
wise comparison of Fst, Kedah and Sarawak were the most differentiated due to the
geographical distance whereas the Kedah and Pahang are the most similar populations among
all.
EST-SSR markers, which were designed for C.striata were applied for cross-species
amplification in other species. Failed amplification in most species indicated low
transferability between selected species except from one species, which belongs to the same
family of C.striata.
Presence of the same Among all, 11 primer pairs in Channa micropletes produced distinct
and clear bands. microsatellite repeats were confirmed through sequencing results in seven
loci.

63
Successful cross-amplification indicated the highly conservation of microsatellite across
these two species and it showed the slower evolution of microsatellite regions in species of
the same family. Application of heterelogous microsatellite markers is an effective approach
which can save considerable amounts of time and cost for developing new markers.
For future studies, comparison of variation levels between wild and cultured stocks can be
conducted by applying these microsatellite markers on cultured population of Channa striata
in Malaysia to investigate whether it is possible to maintain the genetic variation of the wild
source within the cultured stocks. It will be useful to monitor the alteration of genetic
diversity which is happening of every generation in order to get better efficiency in
management and conservation approaches and also in developing microsatellite markers in
the aquaculture industry.

64
APPENDIX
Microsatellite allele size of C.striata loci across ten individuals of Sarawak population
Population Allele
A
Allele
B
Allele
A
Allele
B
Allele
A
Allele
B
Allele
A
Allele
B
Allele
A
Allele
B
Allele
A
Allele
B
Sarawak EST1 EST8 EST11 EST12 EST14 EST18
1 125 125 121 133 308 308 186 186 182 182 94 94
2 125 125 121 133 308 308 182 182 * * 94 94
3 125 125 133 133 308 308 182 182 179 182 94 94
4 125 125 133 133 308 308 178 182 182 182 94 94
5 125 125 121 133 308 308 182 182 179 182 94 94
6 125 125 133 133 308 308 178 178 182 182 94 94
7 125 125 121 133 308 308 182 186 179 182 94 94
8 125 125 133 133 308 308 178 186 179 182 94 94
9 125 125 * * 308 308 182 186 179 182 94 94
10 125 125 133 133 308 308 178 178 179 182 94 94
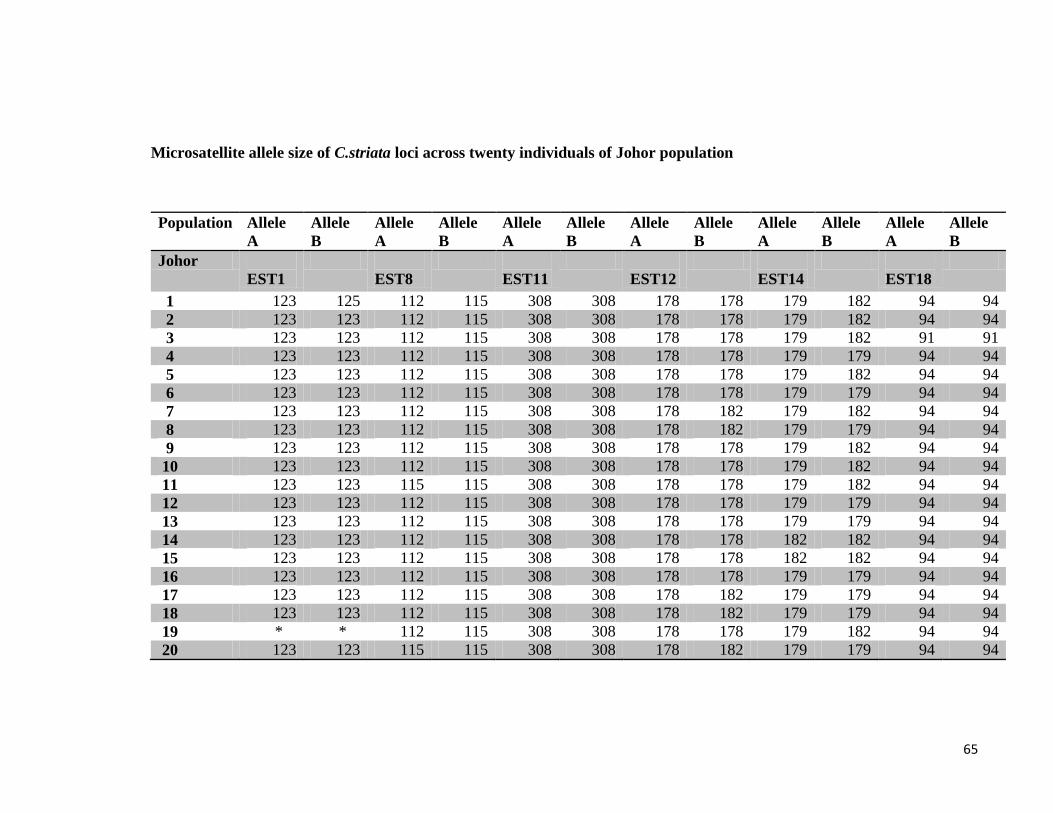
65
Microsatellite allele size of C.striata loci across twenty individuals of Johor population
Population Allele
A
Allele
B
Allele
A
Allele
B
Allele
A
Allele
B
Allele
A
Allele
B
Allele
A
Allele
B
Allele
A
Allele
B
Johor
EST1
EST8
EST11
EST12
EST14
EST18
1 123 125 112 115 308 308 178 178 179 182 94 94
2 123 123 112 115 308 308 178 178 179 182 94 94
3 123 123 112 115 308 308 178 178 179 182 91 91
4 123 123 112 115 308 308 178 178 179 179 94 94
5 123 123 112 115 308 308 178 178 179 182 94 94
6 123 123 112 115 308 308 178 178 179 179 94 94
7 123 123 112 115 308 308 178 182 179 182 94 94
8 123 123 112 115 308 308 178 182 179 179 94 94
9 123 123 112 115 308 308 178 178 179 182 94 94
10 123 123 112 115 308 308 178 178 179 182 94 94
11 123 123 115 115 308 308 178 178 179 182 94 94
12 123 123 112 115 308 308 178 178 179 179 94 94
13 123 123 112 115 308 308 178 178 179 179 94 94
14 123 123 112 115 308 308 178 178 182 182 94 94
15 123 123 112 115 308 308 178 178 182 182 94 94
16 123 123 112 115 308 308 178 178 179 179 94 94
17 123 123 112 115 308 308 178 182 179 179 94 94
18 123 123 112 115 308 308 178 182 179 179 94 94
19 * * 112 115 308 308 178 178 179 182 94 94
20 123 123 115 115 308 308 178 182 179 179 94 94

66
Microsatellite allele size of C.striata loci across twenty individuals of Kedah population
Population Allele
A
Allele
B
Allele
A
Allele
B
Allele
A
Allele
B
Allele
A
Allele
B
Allele
A
Allele
B
Allele
A
Allele
B
Kedah
EST1
EST8
EST11
EST12
EST14
EST18
1 123 123 118 118 308 308 182 182 179 179 88 88
2 123 123 118 118 308 308 182 182 179 179 88 94
3 123 125 115 118 308 308 182 182 179 179 88 94
4 123 123 118 118 308 308 182 182 179 179 82 88
5 115 123 118 118 308 308 170 182 179 179 88 94
6 123 125 118 118 308 308 182 182 179 179 82 88
7 123 123 118 118 308 308 182 182 179 179 88 88
8 115 123 118 118 308 308 182 182 179 179 88 88
9 123 125 118 118 308 308 182 182 179 179 88 88
10 115 123 118 118 308 308 182 182 179 179 88 94
11 115 123 118 118 308 308 182 182 179 179 88 94
12 115 123 118 127 308 308 170 182 179 182 88 94
13 123 123 118 118 * * 182 182 179 179 88 94
14 123 123 118 118 308 308 170 182 179 179 88 88
15 123 123 127 127 308 308 170 182 179 179 79 88
16 123 123 118 118 308 308 182 182 179 179 88 94
17 123 125 115 118 308 308 182 182 179 179 88 94
18 123 125 * * 308 308 170 182 179 179 94 94
19 115 123 118 118 308 308 170 182 179 179 88 94
20 123 123 127 127 308 308 186 186 * * 88 88
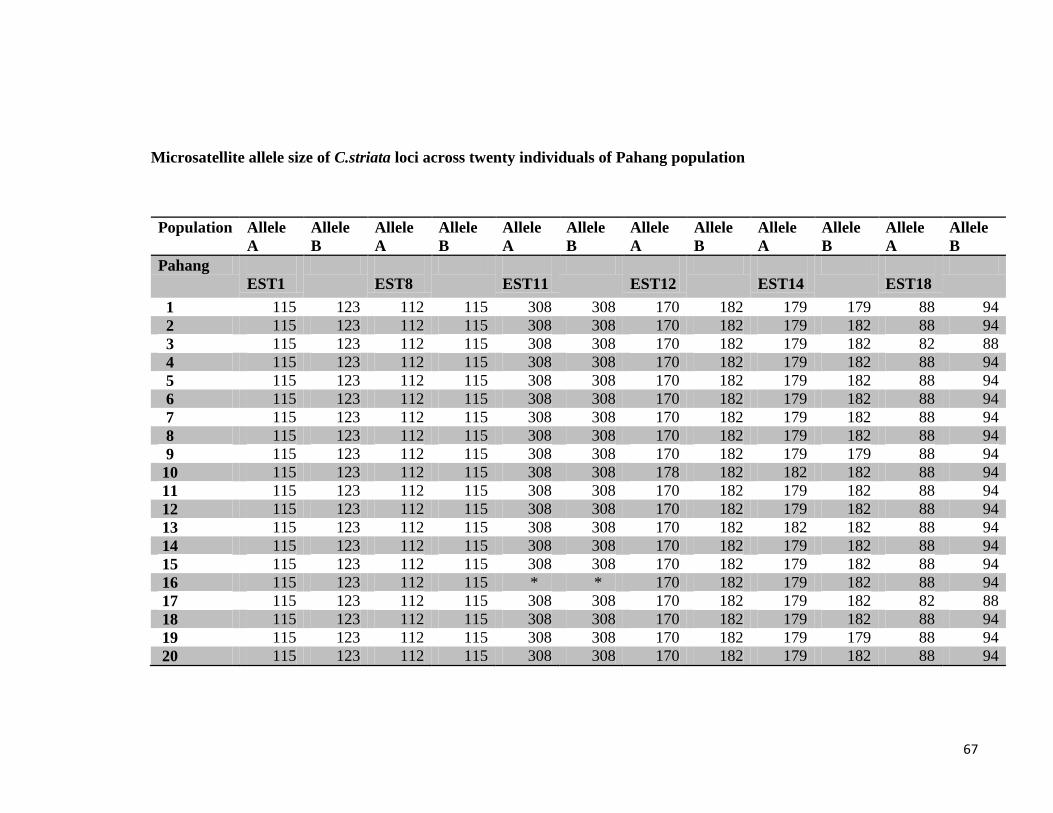
67
Microsatellite allele size of C.striata loci across twenty individuals of Pahang population
Population Allele
A
Allele
B
Allele
A
Allele
B
Allele
A
Allele
B
Allele
A
Allele
B
Allele
A
Allele
B
Allele
A
Allele
B
Pahang
EST1
EST8
EST11
EST12
EST14
EST18
1 115 123 112 115 308 308 170 182 179 179 88 94
2 115 123 112 115 308 308 170 182 179 182 88 94
3 115 123 112 115 308 308 170 182 179 182 82 88
4 115 123 112 115 308 308 170 182 179 182 88 94
5 115 123 112 115 308 308 170 182 179 182 88 94
6 115 123 112 115 308 308 170 182 179 182 88 94
7 115 123 112 115 308 308 170 182 179 182 88 94
8 115 123 112 115 308 308 170 182 179 182 88 94
9 115 123 112 115 308 308 170 182 179 179 88 94
10 115 123 112 115 308 308 178 182 182 182 88 94
11 115 123 112 115 308 308 170 182 179 182 88 94
12 115 123 112 115 308 308 170 182 179 182 88 94
13 115 123 112 115 308 308 170 182 182 182 88 94
14 115 123 112 115 308 308 170 182 179 182 88 94
15 115 123 112 115 308 308 170 182 179 182 88 94
16 115 123 112 115 * * 170 182 179 182 88 94
17 115 123 112 115 308 308 170 182 179 182 82 88
18 115 123 112 115 308 308 170 182 179 182 88 94
19 115 123 112 115 308 308 170 182 179 179 88 94
20 115 123 112 115 308 308 170 182 179 182 88 94

68
68
REFERENCES
1. Adamson, E. A. S., Hurwood, D. A., & Mather, P. A. (2010). A reappraisal of the evolution
of Asian snakehead fishes (Pisces, Channidae) using molecular data from multiple genes and
fossil calibration. Molecular Phylogenetics and Evolution, 56(2), 707-717.
2. Ambok, B. A. M., Mohd, A. A., Patimah, I., & Tam, B. H. (2007). Molecular data from the
Cytochrome b for the phylogeny of Channidae (Channa sp.) in Malaysia. Biotechnology,
6(1), 22-27.
3. Anmarkrud, J. A., Kleven, O., Bachmann, L., & Lifjeld, J. T. (2008). Microsatellite
evolution: Mutations, sequence variation, and homoplasy in the hypervariable avian
microsatellite locus HrU10. J. Evolutionary Biolology, 8, 138.
4. Appleyard, S. A., Grewe, P. M., Innes, B. H., & Ward, R. D. (2001). Population structure of
yellow fin tuna (Thunnus albacores) in the western Pacific Ocean, inferred from
microsatellite loci. Marine biology, 139, 383-383
5. Avise, J. C. (1996). Introduction: the scope of conservation genetics. Conservation Genetics:
Case Histories from Nature, 1-9
6. Bagley, M. J., Lindquist, D. G., & Geller, J. B. (1999). Microsatellite variation, effective
population size, and population genetic structure of vermilion snapper, Rhomboplites
aurorubens, off the southeastern USA. Marine Biology, 134, 609-620.
69
7. Bai, Z. Y., Niu, D. H., & Li, J. L. (2011). Development and characterization of EST-SSR
markers in the freshwater pearl mussel (Hyriopsis Cumingii). Conservation Genet Resour,
3,765-767.
8. Ball, A. O., Sedberry, G. R., Zatcoff, M. S., Chapman, R. W., & Carlin, J. L. (2000).
Population structure of the wreckfish Polyprion americanus determined with microsatellite
genetic markers. Marine Biology, 137, 1077-1090.
9. Balloux, F., & Lugon-Moulin, N. (2002). The estimation of population differentiation with
microsatellite markers. Molecular Ecology, 11, 155-165.
10. Barbará , T. C., Palma-Silva, G. M., Paggi, F., Bered, M. F., Fay., & Lexer, C. (2007). Cross-
species transfer of nuclear microsatellite markers: Potential and limitations. Molecular
Ecology, 16, 3759-3767.
11. Beaumont, A. R., & Hoare, K. (2003). Biotechnology and Genetics in Fisheries and
aquaculture. Blackwell Science, Oxford p.158.
12. Benjamin A. Pierce. (2010). A Conceptual Approach. W. H. Freeman; Fourth edition
13. Berg, L. S. (1947). Classification of fishes both recent and fossil. Ann Arbor, Michigan, J.W.
Edwards, 517 p
14. Berra, T. M. (2001). Freshwater fish distribution: New York, Academic Press, 604 p

70
15. Borrone, J. W., Brown, J. S., Kuhn, D. N., Motamayor, J. C., & Schnell, R. J. (2007).
Microsatellite markers developed from Theobroma cacao L. expressed sequence tags. Mol.
Ecol. Notes, 7, 236-239.
16. Bozkaya, F., & Kurar, E. (2005). Linkage disequilibrium between MHC-linked microsatellite
loci in White Karaman, Awassi and Merinolandschaf sheep breeds. F.U.Sajlik Bilimleri
Dergisi, 19, 57-61.
17. Byrne, M., Marquez-Garcia, M. I., Uren, T., & Smith, D. S. (1996). Conservation and genetic
diversity of microsatellite loci in the genus Eucalyptus. Aust. J. Bot, 44, 331-341.
18. Cadrin, B., Wang, H. P., Li, L., Givens, C., & Wallat, G. (2005). Yellow perch strain
evaluation I: Genetic variation of six brood stock populations. Aquaculture, 271, 142-151.
19. Callen, D. F., Thompson, A. D., Shen, Y., Phillips, H. A., Richards, R. I., Mulley, J. C., &
Sutherland, G. R. (1993). Incidence and origin of ‘null’ alleles in the (AC)n microsatellite
markers. American Journal of Human Genetics, 52, 922-927.
20. Chang, Y. M., Kuang, Y. Y., Liang, L. Q., Lu, C. Y., He, J. G., & Su, X. W. (2008). Searching
for protein-coding genes using microsatellites in common carp by comparing to zebrafish
EST database [J]. Zool Res, 29 (4), 373-378.
21. Chauhan, T., & Rajiv, K. (2010). Molecular markers and their applications in fisheries and
aquaculture. Advances in Bioscience and Biotechnology, 1, 281-291.

71
22. Chapman, N. H., & Wijsman, E. M. (1998). Genome screens using linkage disequilibrium
tests: optimal marker characteristics and feasibility. Am J Hum Genet, 63, 1872-1885.
23. Chistakov, D. A., Hellemans, B., & Volckaert, F. A. M. (2006). Microsatellites and their
genomic distribution, evolution, function and applications: A review with special reference
to fish genetics. Aquaculture, 255, 1-29.
24. Cordeiro, G. M., Casu, R., McIntyre, C. L., Manners, J. M., & Henry, R. J. (2001).
Microsatellite markers from sugarcane (Saccharum spp.) ESTs cross transferable to erianthus
and sorghum. Plant Sci, 160, 1115-1123.
25. Courtenay, W. R., & Williams, J. D. (2004). Snakeheads (Pisces, Channidae)- a biological
synopsis and risk assessment. Denver: U.S. Geological Survey.
26. Crawford, A. M., Buchanan, F. C., & Swarbrick, P. A. (1990). Ovine dinucleotide repeat
polymorphism at the MAF 18 Locus. Animal Genetics, 21, 433-434.
27. Decroocq, V., Fave, M. G., Hagen, L., Bordenave, L., & Decroocq, S. (2003). Development
and transferability of apricot and grape EST microsatellite markers across taxa. Theor Appl
Genet, 106, 912-922.
28. Decroocq, V., Fave, M. G., Hagen, L., Bordenave, L., & Decroocq, S. (2003). Development
and transferability of apricot and grape ESTmicrosatellite markers across taxa Theor. Appl.
Genet., 106, 912–922.
72
29. Dieringer, D., & scholotterer, C. (2003). Two distinct modes of microsatellite mutation
processes: evidence from the complete genomic sequences of nine species. Genome
Research, 13, 2242-2251.
30. DOF (2011). Channa striata. In: Fisheries Research Institute (FRJ). Department of Fisheries
Malaysia: Ministry of Agriculture & Agro-Based Industry Malaysia. Retrieved from
18/3/2012, from http://www.dbserver.fri.gov.my.
31. Edwards, K. J., Barker, J. H., Daly, A., Jones, C., & Karp, A. (1996). Microsatellite libraries
enriched for several microsatellite sequences in plants. BioTechniques, 20, 758-760.
32. Estoup, A., & Angers, B. (1998).“Microsatellites andminisatellites for molecular ecology:
theoretical and empirical considerations,” Advances in Molecular Ecology, G. R. Carvalho,
Ed., pp. 55–79.
33. FAO (2011). State of world aquaculture. In: Aquaculture topics and activities. Fisheries and
Aquaculture Department: Food and Agricultural Organization of the United Nations.
Retrieved 11/03/2012, from http://www.fao.org/fishery/topic/13540/en.
34. Ferguson, M. (1994). The role of molecular genetic markers in the management of cultured
fishes. Reviews in Fish Biology and Fisheries, 4, 351-373.
35. FitzSimmons, N. N., Moritz, C., & Moore, S. S. (1995). Conservation and dynamics of
microsatellite loci over 300 million years of marine turtle evolution. Molecular Biology
Evolution, 12, 432-440.

73
36. Franklin, I. R. (1980). Evolutionary change in small populations. Conservation Biology: an
evolutionary-ecological perspective. 135-150.
37. Froese R, Pauly D, editors. FishBase. 2008. World Wide Web electronic
publication. www.fishbase.org (11/2008).
38. Gam, L. H., Leow, C. Y., & Baie, S. (2006). Proteomic Analysis of Snakehead Fish (Channa
striata) Muscle Tissue. Malaysian Journal of Biochemistry and Molecular Biology, 14, 25-
32.
39. Gemmell, N. J., Allen, P. J., Goodman, S. J., & Reed, J. Z. (1997). Interspecific microsatellite
markers for the study of pinniped populations. Mol. Ecol., 6, 661-666.
40. Glaubitz, J.C. (2004) CONVERT: A user-friendly program to reformat diploid genotypic
data for commonly used population genetic software packages. Molecular Ecology Notes,
Volome 4, Issue 2.
41. Gold, J. R., & Turner, T. F. (2002). Population structure of red drum (Sciaenops ocellatus)
in the northern Gulf of Mexico, as inferred from variation in nuclear-encoded microsatellites.
Marine Biology, 140, 249-265.
42. Guo, S., & Thompson, E. (1992) Performing the exact test of Hardy-Weinberg proportion
for multiple alleles. Biometrics, 48, 361-372.
74
43. Gupta, P. K., & Rustgi, S. (2004). Molecular markers from the transcribed/expressed region
of the genome in higher plants. Funct Integr Genomics, 4, 139-162.
44. Gupta, P. K., & Varshney, R. K. (2000). The development and use of microsatellite markers
for genetic analysis and plant breeding with emphasis on bread wheat. Euphytica, 113, 163-
185.
45. Gupta, P. K., Rustgi, S., Sharma, S., Singh, R., Kumar, N., & Balyan, H. S. (2003).
Transferable EST-SSR markers for the study of polymorphism and genetic diversity. Mol
Genet Genomics, 270, 315-323.
46. Hempel, K., & Peakall, R. (2003). Cross-species amplification from crop soybean Glycine
max provides informative microsatellite markers for the study of inbreeding wild relatives.
J. Genome, 46(3), 382-393.
47. Holmen, J., Vøllestad, L. A., Jakobsen, K. S., & Primmer, C. R. (2005). Cross-species
amplification of zebrafish and central stoneroller microsatellite loci in six other cyprinids. J.
Fish Biol, 66(3), 851-859.
48. Holmen, J., Vøllestad, L. A., Jakobsen, K. S., & Primmer, C. R. (2009). Cross-species
amplification of 36 cyprinid microsatellite loci in Phoxinus phoxinus (L.) and Scardinius
erythrophthalmus (L.). BMC Res Notes, 2, 248.
49. Hossain, M. K., Latifa, G. A., & Rahman, M. M. (2008). Observations on induced breeding
of snakehead murrel,Channa striatus (Bloch, 1793) Int. J. Sustain Crop Prod, 3, 65–68.

75
50. Jarne, P., & Lagoda, P. J. L. (1996). “Microsatellites, from molecules to populations and
back,” Trends in Ecology and Evolution, 10, 424–429.
51. Karl, S. A., & Avise, J. C. (1992). Balancing selection at allozyme loci in oysters:
implications from nuclear RFLPs. Science, 256, 100-102
52. Kottelat, M., Whitten, A. J., Kartikasari, S. N., & Wirjoatmodjo, S. (1993). Freshwater fishes
of Western Indonesia and Sulawesi. Periplus Editions, Hong Kong, 259pp.
53. Lakra, W. S. (2001). Genetics and Molecular Biology in Aquaculture. Asian-Aust. J. Anim.
Aci. 6, 894-898.
54. Lee, P. G., & Ng, P. K. L. (1994). The systematics and ecology of snakeheads (Pisces:
Channidae) in Peninsular Malaysia and Singapore. Hydrobiologia, 285, 59–74.
55. Lee, P. G., & Ng, P. K. L. (1991). The snakehead fishes of the Indo-Malayan Region. Nature
Malaysiana, 4, 113-129.
56. Levinson, G., & Gutman, G. A. (1987). Slipped-strand mispairing: a major mechanism for
DNA sequence evolution. Mol Biol Evol, 4, 20-21.
57. Li, J. L., Wang, G. L., Bai, Z. Y., & Yue, G. H. (2007). Ten polymorphic microsatellites from
freshwater pearl mussel, Hyriopsis cumingii. Mol Ecol Notes, 7, 1357-1359.
76
58. Li, X., Musikasinthorn, P., & Kumazawa, Y. (2006). Molecular phylogenetic analyses of
snakeheads (Perciformes: Channidae) using mitochondrial DNA sequences. Ichthyol.Res.,
53, 148-159.
59. Lin, G., Chang, A., Yap, W., & Yue, G. H. (2008). Characterization and cross-species
amplification of microsatellites from the endangered Hawksbill turtle (Eretmochelys
imbricate) [J]. Conserv Genet, 9, 1071-1073.
60. Liu, Z. J., & Cordes, J. F. (2004). DNA marker technologies and their applications in
aquaculture genetics. Aquaculture, 238, 1-37.
61. Luikart, G., & England, P. R. (1999). Statistical analysis of microsatellite DNA data. Trends
in Ecology and Evolution, 14, 253-256.
62. Lymbery, A. J. (2000). Genetic improvement in the Australian aquaculture industry.
Aquaculture Research, 31, 145-149
63. Mat Jais, A. M. (2007a). Molecular size of the bio-active component from haruan Channa
striatus extract. Journal Applied Science, 7, 2198–2199.
64. Mat Jais, A. M. (2007b). Pharmacognosy and pharmacology of Haruan (Channa striatus), A
medicinal fish with wound healing properties. Bol. Latinoam. Caribe Plant. Med.
Aromaticas, 6(3), 52-60.

77
65. Meglécz, E., Costedoat, C., Dubut, V., Gilles, A., Malausa, T., Pech, N. & Martin J, F.
(2010). QDD: a user-friendly program to select microsatellite markers and design primers
from large sequencing projects. Bioinformatics, 26, 403-404.
66. Michelle, N. Y. T., Shanti, G., & Loqman, M. Y. (2004). Effect of orally
administered Channa striatus extract against experimentally-induced osteoarthritis in
rabbits. Int J Appl Res Vet Med, 2, 171–175.
67. Mohsin, A. K. M., & Ambak, M. A. (1992). Freshwater fishes of Peninsula Malaysia. Dewan
Bahasa and Pustaka (DBP), Kuala Lumpur, Malaysia, 284 p
68. Moore, S. S., Sargenat, L. L., King, T. J., Mattila, J. S., Georges, M., & Metzel, D. J. S.
(1991). The conservation of dinucleotide microsatellite among mammalian genomes allows
the use of heterologous PCR primer pairs in closely related species. Genomics, 10, 654-660.
69. Morin, P. A., Mahboubi, P., Wedel, S., & Rogers, J. (1998). Rapid screening and comparison
of human microsatellite markers in baboons: allele size is conserved, but allele number is
not. Genomics, 53, 12-20.
70. Musikasinthorn, P. (2003). Channoidei (snakeheads). In M. Hutchins, A. Thoney, P. V.
Loiselle & N. Schlager (Eds.), Grzimek's animal life encylopedia, 2nd Edn., Fishes I-II, 5,
437-447.

78
71. Nagarajan, M., Haniffa, M. A., Gopalakrishnan, A., Basheer, V. S., & Muneer A. (2006).
Genetic variability of Channa punctatus populations using randomly amplified
polymorphic DNA. Aquac Res, 37, 1151–1155.
72. Ng, M. Y. T., Shanti, G., & Loqman, M. Y. (2004). Effect of Orally Administered Channa
Striatus Extract Against Experimentally-Induced Osteoarthritis in Rabbits. Intern. J. Appl.
Res. Vet. Med., 2, 171-175.
73. Ng, P. K. L., & Lim, K. K. P. (1990). Snakeheads (Pisces: Channidae): Natural, history,
biology and economic importance: Essays in Zoology, Papers Commemorating the 40th
Anniversary of the Department of Zoology, National University of Singapore, 127-152.
74. Norris, D. E., Shurtleff, A. C., Tourq, Y. T., & Lanzaro, G. C. (2001). Microsatellite DNA
polymorphism and heterozygisity among field and laboratory populations of anopheles
gambiae ss (Diptera: Culicidae). Journal of Medical Entomology, 38, 336-340
75. O’Connell, M., Dillon, M. C., Wright, J. M., Bentzen, P., Merkouris, S., & Seeb, J. (1998).
Genetic structuring among Alaskan Pacific herring populations identified using
microsatellite variation. J Fish Biol, 53, 150-163.
76. Oliveira, E. J., Pádua, J. G., Zucchi, M. I., Vencovsky, R., et al. (2006). Origin, evolution
and genome distribution of microsatellites. Genet. Mol. Biol, 29, 294-307.
77. Pashley, C. H., Ellis, J. R., McCauley, D. E. & Burke, J. M. (2006). EST databases as a source
for molecular markers: lessons from Helianthus. J. Heredity, 97, 381-388.
79
78. Pinheiro, F., Palma-Silva, C., de Barros, F., & Cozzolino, S. (2009). Cross-amplification and
characterization of microsatellite loci for the Neotropical orchid genus Epidendrum .
Genetics and Molecular Biology, 32, 337-339.
79. Qiu, L., Yang, C., Tian, B., Yang, J. B., Liu, A. (2010). Exploiting EST databases for the
development and characterization of EST-SSR markers in castor bean (Ricinus communis
L.). BMC Plant Biology, 10, 278
80. Qu, C., Liang, X., Huang, W., & Cao, L. (2012). Isolation and characterization of 46 Novel
Polymorphic EST-Simple sequence repeats (SSR) markers in two Sinipercine fishes
(Siniperca) and cross-species amplification. Int. J. Mol. Sci, 13, 9534-9544.
81. Rahim, M. H. A., Rozila, A., & Mat Jais, A. M. (2009). The physical-chemical and
morphological study of Haruan of Channa striatus in Peninsular Malaysia. Research journal
of biological sciences, 4(9), 994-1009.
82. Ross, K. G., Shoemaker, D. D., Krieger, M. J. B., DeHeer, C. J., & Keller, L. (1999).
Assessing genetic structure with multiple classes of molecular markers: a case study
involving the introduced fire ant Solenopsis invicta. Mol Biol Evol, 16, 525-543.
83. Schlötterer, C., & Tautz, D. (1992). Slippage synthesis of simple sequence DNA. Nucleic
Acids Res, 20, 211-215.
84. Scott, K. D., Eggler, P., Seaton, G., Rossetto, M., Ablett, E. M., Lee, L. S., & Henry, R. J.
(2000). Analysis of SSRs derived from grape ESTs. Theor Appl Genet, 100, 723-726.

80
85. Scribner, K. T., Gust, J. R., & Fields, R. L. (1996). Isolation and characterization of novel
salmon microsatellite loci: cross-species amplification and population genetic applications.
Canada Journal of Fisheries Aquatic Science, 53, 833-841.
86. Scribner, K. T., & Pearce, J. M. (2000). Microsatellites: evolutionary and methodological
background and empirical applications at individual, population and phylogenetic level. In:
Molecular Methods in Ecology (A. Baker, ed), pp. 235-271. Blackwell Science Limited,
London, 337 pp.
87. Shaw, P. W., Pierce, G. J., & Boyle, P. R. (1999). Subtle population structuring within a
highly vagile marine invertebrate, the veined squid Logilo forbesi, demonstrated with
microsatellite markers. Mol Ecol, 8, 407-417.
88. Slate, J., & Pemberton, J. M. (2002). Comparing molecular measures for detecting inbreeding
depression. Journal of Evolutionary Biology, 15, 20-31.
89. Slatkin, M. (1991). Inbreeding coefficients and coalescence times. Genetics Research, 58,
167-175
90. Slatkin, M. (1994). Linkage disequilibrium in growing and stable populations. Genetic, 137,
331-336
91. Slatkin, M. (1995). A measure of population subdivision based on microsatellite allele
frequencies. Genetics, 139, 457-462.
81
92. Stenkellner, H., Lexer, C., & Turetschek, E. (1997). Conservation of (GA)n microsatellite
between Quercus species. Molecular Ecology 6, 1189–1194.
93. Talwar, P. K., & Jhingran A. G. (1992). Inland fishes of India and adjacent countries, Vol. 1.
A.A.
94. Tao, W., Mayden, R. L., & He, S. (2014). Remarkable phylogenetic resolution of the most
complex clade of Cyprinidae (Teleostei: Cypriniformes): A proof of concept of homology
assessment and partitioning sequence data integrated with mixed model Bayesian analyse.
Molecular phylogenetics and revolution, 66(3), 603-616.
95. Tong, J., Wang, Z., Yu, X., Wu, Q., & Chu, K. H. (2002). Cross-species amplification in
silver carp and bighead carp with microsatellite primers of common carp. Mol Ecol Notes, 2,
245-247.
96. Van Oosterhout, C., Hutchinson, W. F., Wills, D. P. M., & Shipley, P. (2004). MICRO-
CHECKER: software for identifying and correcting genotyping errors in microsatellite data.
Molecular Ecology Notes, 4, 535–538.
97. Varshney, R. K., Graner, A., & Sorrells, M. E. (2005). Genic microsatellite markers in plants:
features and applications. Trends Biotechnol, 23, 48-55.
98. Vishwanath, W., & Geetakumari, K. (2009). Diagnosis and interrelationships of fishes of the
genus Channa Scopoli (Teleostei: Channidae) of northeastern India. Journal of Threatened
Taxa, 1, 97-105.
82
99. Wigginton, J. E., Cutler, D. J., & Abecasis, G. R. (2005). A Note on Exact Tests of Hardy-
Weinberg Equilibrium. The American Journal of Human Genetics, 76, 887-893.
100. Wright, S. (1978) Evolution and the Genetics of Population, Variability Within and
Among Natural Populations. The University of Chicago Press, Chicago.
101. Yaakob, W. A. A., & Ali, A. B. (1992). Simple method for backyard production of
snakehead (Channa Striata Bloch) fry. Naga, 15(2), 22-23
102. Wang, Y. J., Li, X. Y., Han, J., Fang, W. M., Li, X. D., Wang, S. S., & Fang, J. G.
(2011). Analysis of genetic relationships and identification of flowering-meicultivars
using EST-SSR markers developed from apricot and fruiting-mei. J. Science P, 12-17
103. Zakaria, Z. A., Somchit, M. N., Sulaiman, M. R., & Mat Jais, A. M. (2004).
Preliminary investigation properties of Haruan (Channa striatus) fillet extracted with
various solvent systems. Pakistan J Biol Sc, 7, 1706–1710.
104. Zuraini, A., Somchit, M. N., Solihah, M. H., Goh, Y. M., Arifah, A. K., Zakaria, M.
S., … Mat Jais, A. M. (2006). Fatty acid and amino acid composition of three local
MalaysianChanna spp. fish. Food Chemistry, 97, 674-678.

83


![KULIAH TUMOR MARKER S.ppt [Read-Only] - ocw.usu.ac.idocw.usu.ac.id/.../elo173_slide_tumor_markers.pdf · TUMOR MARKER’S Prof. Adi Koesoema Aman . ... Klasifikasi Penanda Tumor](https://img.pdfslide.us/doc/110x75/5a77bc1f7f8b9a93088e0a67/kuliah-tumor-marker-sppt-read-only-ocwusuacidocwusuacidelo173slidetumor.jpg)