Embed Size (px)
Citation preview
i
MOLECULAR CHARACTERIZATION OF CONGENITAL MENTAL RETARDATION IN
PAKISTAN
A THESIS SUBMITTED TO
UNIVERSITY OF THE PUNJAB
IN COMPLETE FULFILLMENT OF THE REQUIREMENT FOR THE DEGREE OF
DOCTOR OF PHILOSOPHY
IN
MOLECULAR BIOLOGY
BY
MUHAMMAD YASIR ZAHOOR
SUPERVISORS:
DR. SHAHEEN N. KHAN &
DR. SHEIKH RIAZUDDIN
NATIONAL CENTRE OF EXCELLENCE IN MOLECULAR BIOLOGY UNIVERSITY OF THE PUNJAB, LAHORE
(2011)

ii
PPPRRRAAAIIISSSEEE BBBEEE TTTOOO AAALLLLLLAAAHHH,,, TTTHHHEEE CCCHHHEEERRRIIISSSHHHEEERRR AAANNNDDD
SSSUUUSSSTTTAAAIIINNNEEERRR OOOFFF TTTHHHEEE WWWOOORRRLLLDDDSSS,,, MMMOOOSSSTTT GGGRRRAAACCCIIIOOOUUUSSS,,,
MMMOOOSSSTTT MMMEEERRRCCCIIIFFFUUULLL...
iii
CERTIFICATE
It is certified that the research work described in this thesis is the original work of the
author Muhammad Yasir Zahoor and has been carried out under our direct supervision.
We have personally gone through all the data reported in the manuscript and certify their
correctness/authenticity. It is further certified that the material included in this thesis have
not been used in part or full in a manuscript already submitted or in the process of
submission in partial/complete fulfillment of the award of any other degree from any
other institution. It is also certified that the thesis has been prepared under our supervision
according to the prescribed format and we endorse its evaluation for the award of Ph.D.
degree through the official procedures of the University.
In accordance with the rules of the Centre, data books # M-173 and 896 are declared as
unexpendable document that will be kept in the registry of the Centre for a minimum of
three years from the date of the thesis defense examination.
Signature of the Supervisor: __________________
Name: Dr. Shaheen N. Khan
Designation: Professor
Signature of the Supervisor: __________________
Name: Dr. Sheikh Riazuddin Designation: National Professor
iv
SUMMARY
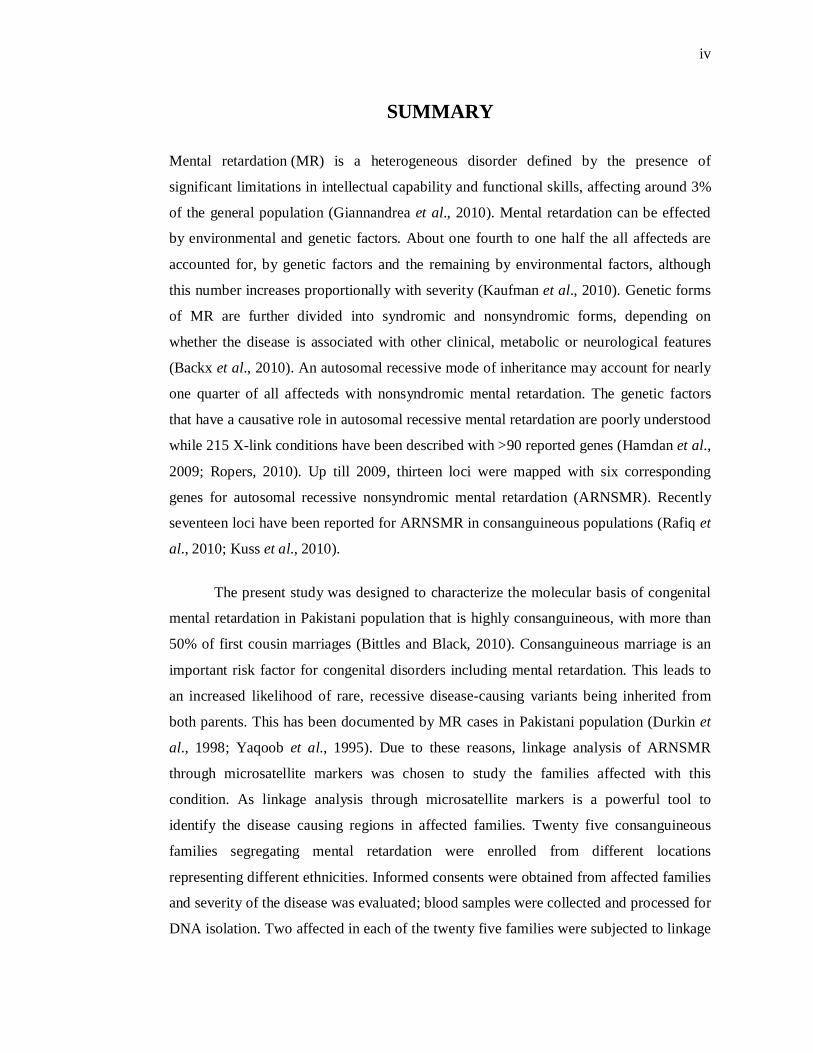
Mental retardation (MR) is a heterogeneous disorder defined by the presence of
significant limitations in intellectual capability and functional skills, affecting around 3%
of the general population (Giannandrea et al., 2010). Mental retardation can be effected
by environmental and genetic factors. About one fourth to one half the all affecteds are
accounted for, by genetic factors and the remaining by environmental factors, although
this number increases proportionally with severity (Kaufman et al., 2010). Genetic forms
of MR are further divided into syndromic and nonsyndromic forms, depending on
whether the disease is associated with other clinical, metabolic or neurological features
(Backx et al., 2010). An autosomal recessive mode of inheritance may account for nearly
one quarter of all affecteds with nonsyndromic mental retardation. The genetic factors
that have a causative role in autosomal recessive mental retardation are poorly understood
while 215 X-link conditions have been described with >90 reported genes (Hamdan et al.,
2009; Ropers, 2010). Up till 2009, thirteen loci were mapped with six corresponding
genes for autosomal recessive nonsyndromic mental retardation (ARNSMR). Recently
seventeen loci have been reported for ARNSMR in consanguineous populations (Rafiq et
al., 2010; Kuss et al., 2010).
The present study was designed to characterize the molecular basis of congenital
mental retardation in Pakistani population that is highly consanguineous, with more than
50% of first cousin marriages (Bittles and Black, 2010). Consanguineous marriage is an
important risk factor for congenital disorders including mental retardation. This leads to
an increased likelihood of rare, recessive disease-causing variants being inherited from
both parents. This has been documented by MR cases in Pakistani population (Durkin et
al., 1998; Yaqoob et al., 1995). Due to these reasons, linkage analysis of ARNSMR
through microsatellite markers was chosen to study the families affected with this
condition. As linkage analysis through microsatellite markers is a powerful tool to
identify the disease causing regions in affected families. Twenty five consanguineous
families segregating mental retardation were enrolled from different locations
representing different ethnicities. Informed consents were obtained from affected families
and severity of the disease was evaluated; blood samples were collected and processed for
DNA isolation. Two affected in each of the twenty five families were subjected to linkage
v
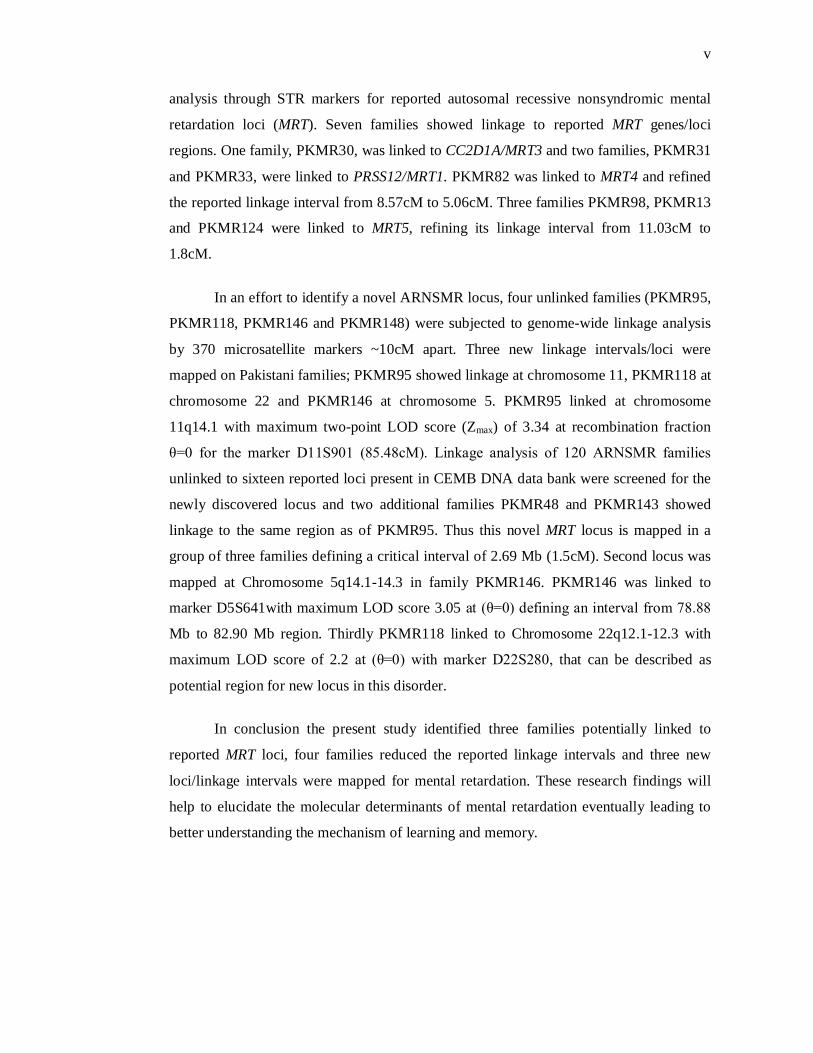
analysis through STR markers for reported autosomal recessive nonsyndromic mental
retardation loci (MRT). Seven families showed linkage to reported MRT genes/loci
regions. One family, PKMR30, was linked to CC2D1A/MRT3 and two families, PKMR31
and PKMR33, were linked to PRSS12/MRT1. PKMR82 was linked to MRT4 and refined
the reported linkage interval from 8.57cM to 5.06cM. Three families PKMR98, PKMR13
and PKMR124 were linked to MRT5, refining its linkage interval from 11.03cM to
1.8cM.
In an effort to identify a novel ARNSMR locus, four unlinked families (PKMR95,
PKMR118, PKMR146 and PKMR148) were subjected to genome-wide linkage analysis
by 370 microsatellite markers ~10cM apart. Three new linkage intervals/loci were
mapped on Pakistani families; PKMR95 showed linkage at chromosome 11, PKMR118 at
chromosome 22 and PKMR146 at chromosome 5. PKMR95 linked at chromosome
11q14.1 with maximum two-point LOD score (Zmax) of 3.34 at recombination fraction
θ=0 for the marker D11S901 (85.48cM). Linkage analysis of 120 ARNSMR families
unlinked to sixteen reported loci present in CEMB DNA data bank were screened for the
newly discovered locus and two additional families PKMR48 and PKMR143 showed
linkage to the same region as of PKMR95. Thus this novel MRT locus is mapped in a
group of three families defining a critical interval of 2.69 Mb (1.5cM). Second locus was
mapped at Chromosome 5q14.1-14.3 in family PKMR146. PKMR146 was linked to
marker D5S641with maximum LOD score 3.05 at (θ=0) defining an interval from 78.88
Mb to 82.90 Mb region. Thirdly PKMR118 linked to Chromosome 22q12.1-12.3 with
maximum LOD score of 2.2 at (θ=0) with marker D22S280, that can be described as
potential region for new locus in this disorder.
In conclusion the present study identified three families potentially linked to
reported MRT loci, four families reduced the reported linkage intervals and three new
loci/linkage intervals were mapped for mental retardation. These research findings will
help to elucidate the molecular determinants of mental retardation eventually leading to
better understanding the mechanism of learning and memory.
vi
Acknowledgments
All the praises and thanks be to Allah, the Lord of the worlds, Who is the ultimate source
of all knowledge to mankind. Bow in obeisance, I before my Lord, WHO bestows me to
fortitude and impetus to accomplish this work. “O Allah! Shower Thy blessings and
beneficence on holy Prophet Muhammad and his Family”. He taught us supreme
standards in life and he is an everlasting source of light in darkness.
I wish to express wholehearted respect and thanks to Dr. Shaheen N. Khan for her
dynamic supervision, adept advices and expert problem shoots. It is privilege and honor
for me to express my profound gratitude to Dr. S. Riazuddin for his kind supervision,
constructive suggestions and inspiring guidance during the course of this study.
I am grateful to Dr Ahmed A. Shahid, Incharge Programme and Imran Shafi
assistant student coordinator for cooperative behavior. I am thankful to lab members
Dr.Shahid, Rashid, Qasim, Amjad, Tanveer, Khitab and Sohail for their nice accompany.
Thanks are due to project mates Dr. Mohsin and Attia for nice cooperation. I like to
admire the accompany of my class fellows specially Khawaja, Papu, Ansari and Bhinder
during the course of this study. Thanks are also due to my teachers especially Bajwa Sb.
Finally, I must acknowledge encouragement and support of my family and cousins
especially Shakil’s and Chohan’s. I feel an immense admiration of my spouse and baby
for moral support. Most importantly my mother, whose prayers and limitless efforts
helped me a lot in my life.
Muhammad Yasir Zahoor
vii
LIST OF CONTENTS
................................................................................................ Page
CERTIFICATE ................................................................................................... iii SUMMARY ......................................................................................................... iv ACKNOWLEDGMENTS ................................................................................... vi LIST OF CONTENTS ......................................................................................... vii LIST OF TABLES ............................................................................................... xi LIST OF FIGURES ............................................................................................. xii ABBREVIATIONS AND SYMBOLS ................................................................. xiv
INTRODUCTION ..............................................................................1-4 SECTION 1 REVIEW OF LITERATURE ...........................................5-35 CHAPTER I OVERVIEW OF MENTAL RETARDATION .................................6-12 WHAT IS MENTAL RETARDATION....................................................... 7 CLINICAL FEATURES........................................................................................ 7 DIAGNOSIS OF MENTAL RETARDATION ...................................................... 7 CLASSIFICATION OF MENTAL RETARDATION ............................................ 9 PREVELENCE OF MENTAL RETARDATION .................................................. 11 CAUSES OF MENTAL RETARDATION ............................................................ 11 ENVIRONMENTAL FACTORS .......................................................................... 11
CHAPTER II GENETIC & MOLECULAR FACTORS OF MENTAL RETARDATION ........................................................13-30 CHROMOSOMAL ABNORMALITIES ............................................................... 14 GENE DEFECTS IN MENTAL RETARDATION ................................................ 17 X-link Mental Retardation ..................................................................................... 17 Autosomal Form of Mental Retardation ................................................................. 21
CHAPTER III LINKAGE ANALYSIS” A KEY TOOL FOR MAPPING DISEASE GENES ..................................................31-35
LINKAGE ANALYSIS ......................................................................................... 32 RECOMBINANT FRACTION.............................................................................. 33 LOD SCORE METHOD ....................................................................................... 34
viii
MULTIPOINT MAPPING .................................................................................... 34 DNA POLYMORPHISMS AS A TOOL FOR LINKAGE ANALYSIS ................. 34 SECTION 2 MATERIALS & METHODS ............................................36-57 FIELD WORK .................................................................................................. 37 IDENTIFICATION AND ENROLLMENT OF FAMILIES .................................. 37 CLINICAL EVALUATION .................................................................................. 38 Clinical History and General Examination ........................................................ 38 ASSESMENT OF IQ LEVEL ............................................................................... 39 LAB WORK ...................................................................................................... 42 DNA EXTRACTION ............................................................................................ 42 QUANTIFICATION OF DNA .............................................................................. 42 PREPARATION OF REPLICA DNA PLATES .................................................... 43 LINKAGE ANALYSIS FOR REPORTED MRT LOCI ......................................... 44 Genotyping Microsatellite Markers by Polymerase Chain Reaction .................. 46 PCR Cycle ........................................................................................................ 46 GENOME WIDE SCAN ....................................................................................... 47 Standardization of ABI PRISM® Linkage Mapping Set..................................... 47 Multiplex PCR Protocol .................................................................................... 50 Multiplex PCR Cycle ........................................................................................ 50 SAMPLE PREPARATION FOR ABI PRISM® 3100 GENETIC ANALYZER ..... 51 PRINCIPLE OF AUTOMATED FLUORESCENT GENOTYPING ..................... 51 HAPLOTYPE ANALYSIS.................................................................................... 54 DATA ORGANIZATION TO PERFORM LOD SCORE CALCULATION.......... 54 Data Sheet ........................................................................................................ 54 Ranges Sheet .................................................................................................... 54 The Macros of the Software .............................................................................. 54 Modules ............................................................................................................ 55 LOD SCORE CALCULATIONS .......................................................................... 56 Designing of ‘Macros’ for “Easylinkage” software ............................................... 57 SECTION 3 RESULTS AND DISCUSSION ........................................58-98
ix
CHAPTER I LINKAGE ANALYSIS OF REPORTED AUTOSOMAL RECESSIVE MENTAL RETARDATION LOCI ...................................................59-69 PREFACE ............................................................................................................. 60 LINKAGE TO MRT1/PRSS12- PKMR31 .............................................................. 61 LINKAGE TO MRT1/PRSS12- PKMR33 .............................................................. 62 LINKAGE TO MRT3/CC2D1A- PKMR30 ............................................................ 63 LINKAGE TO MRT4- PKMR82 ........................................................................... 64 LINKAGE TO MRT5- PKMR98 ........................................................................... 66 LINKAGE TO MRT5- PKMR13&124 .................................................................. 67 CHAPTER II MAPPING & REFINEMENT OF A NEW LOCUS FOR AUTOSOMAL RECESSIVE NONSYNDROMIC MENTAL RETARDATION AT CHROMOSOME 11q14.1 ...........70-81 PKMR95 .......................................................................................................... 71 Clinical Evaluation ........................................................................................... 71 Genome-Wide Scan .......................................................................................... 71 LOD Score Calculations ................................................................................... 72 Typing Additional Markers and Haplotype Analysis of PKMR95 ..................... 72 NEW MRT LOCUS ............................................................................................... 72 Additional Families linked to New MRT Locus at Chromosome 11q14.1 ............... 76 PKMR143 ........................................................................................................ 76 Haplotype Analysis of PKMR143 ..................................................................... 76 PKMR48 .......................................................................................................... 78 Haplotype Analysis of PKMR48 ....................................................................... 78 LINKAGE INTERVAL OF A NEW MRT LOCUS AT CHROMOSOME 11q14.1 .............................................................................. 80 CHAPTER III MAPPING OF SECOND NEW LOCUS FOR AUTOSOMAL RECESSIVE NONSYNDROMIC MENTAL RETARDATION AT CHROMOSOME 5q14.1-14.3 ............................................................82-86 PKMR146 ........................................................................................................ 83 Clinical Evaluation ........................................................................................... 83 Genome-Wide Scan .......................................................................................... 83 LOD Score Calculations and Haplotype Analysis of PKMR146........................ 83
x
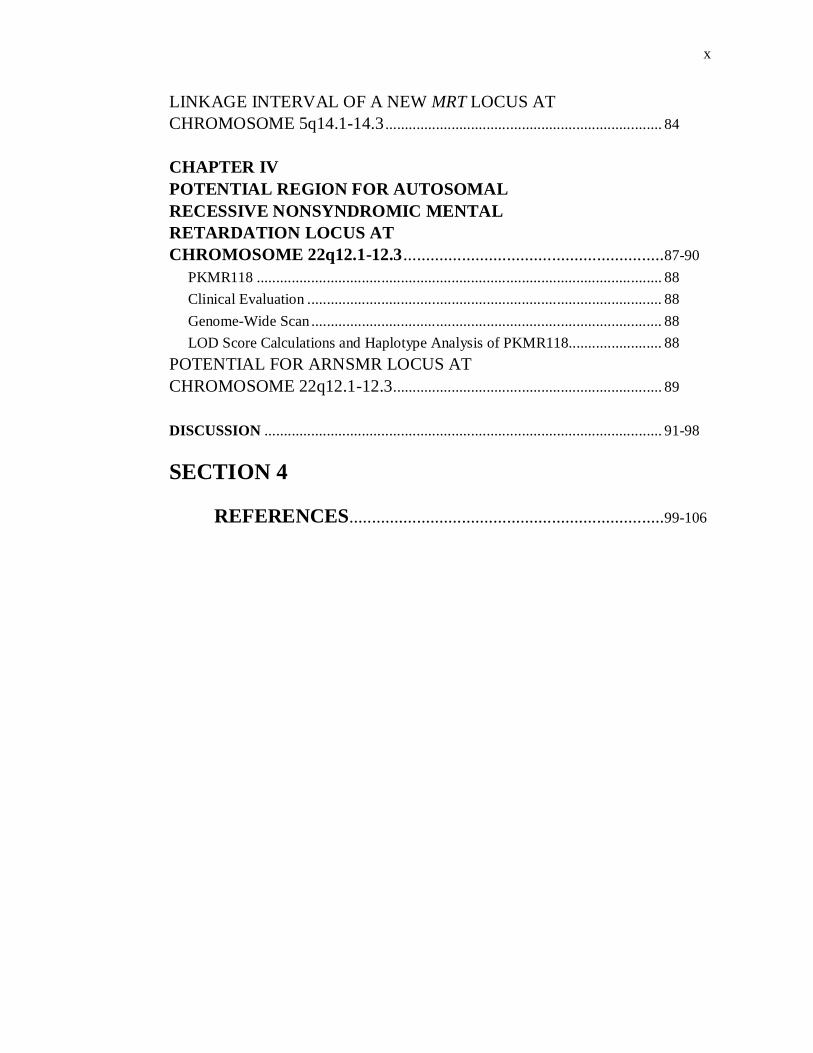
LINKAGE INTERVAL OF A NEW MRT LOCUS AT CHROMOSOME 5q14.1-14.3 ....................................................................... 84 CHAPTER IV POTENTIAL REGION FOR AUTOSOMAL RECESSIVE NONSYNDROMIC MENTAL RETARDATION LOCUS AT CHROMOSOME 22q12.1-12.3 ..........................................................87-90 PKMR118 ........................................................................................................ 88 Clinical Evaluation ........................................................................................... 88 Genome-Wide Scan .......................................................................................... 88 LOD Score Calculations and Haplotype Analysis of PKMR118........................ 88 POTENTIAL FOR ARNSMR LOCUS AT CHROMOSOME 22q12.1-12.3 ..................................................................... 89 DISCUSSION ...................................................................................................... 91-98 SECTION 4 REFERENCES ......................................................................99-106
xi
LIST OF TABLES
................................................................................................ Page
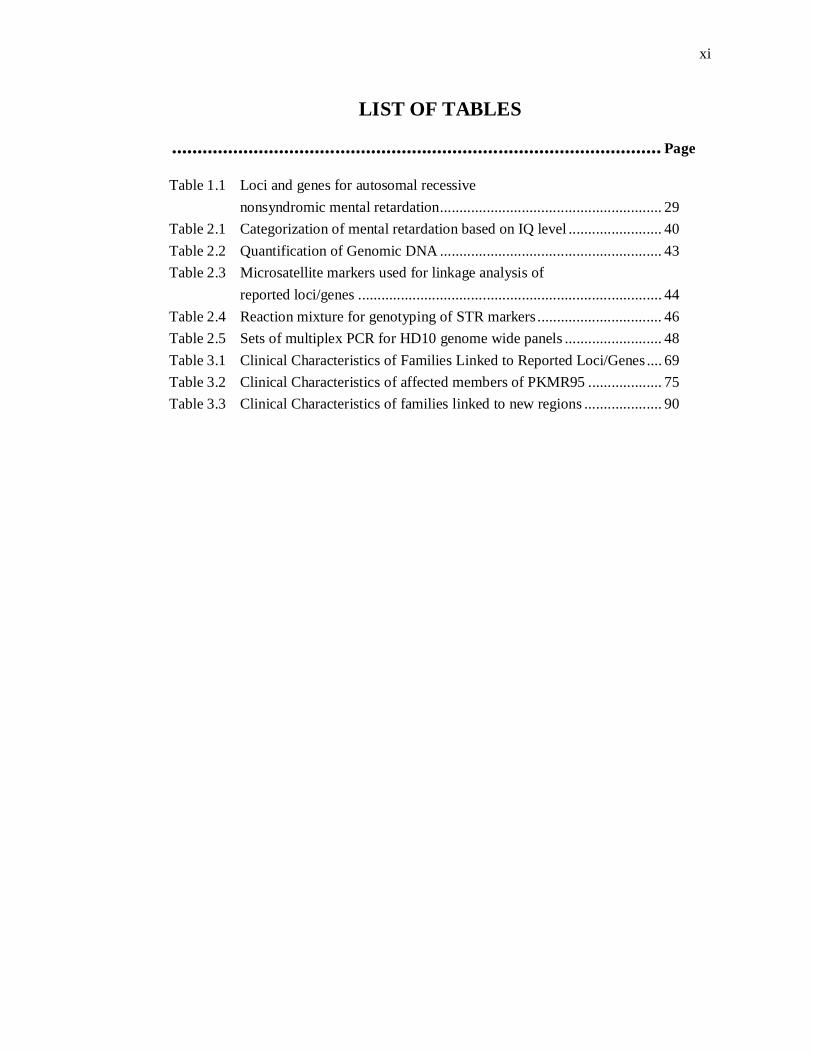
Table 1.1 Loci and genes for autosomal recessive nonsyndromic mental retardation ......................................................... 29 Table 2.1 Categorization of mental retardation based on IQ level ........................ 40 Table 2.2 Quantification of Genomic DNA ......................................................... 43 Table 2.3 Microsatellite markers used for linkage analysis of reported loci/genes .............................................................................. 44 Table 2.4 Reaction mixture for genotyping of STR markers ................................ 46 Table 2.5 Sets of multiplex PCR for HD10 genome wide panels ......................... 48 Table 3.1 Clinical Characteristics of Families Linked to Reported Loci/Genes .... 69 Table 3.2 Clinical Characteristics of affected members of PKMR95 ................... 75 Table 3.3 Clinical Characteristics of families linked to new regions .................... 90
xii
LIST OF FIGURES
................................................................................................ Page
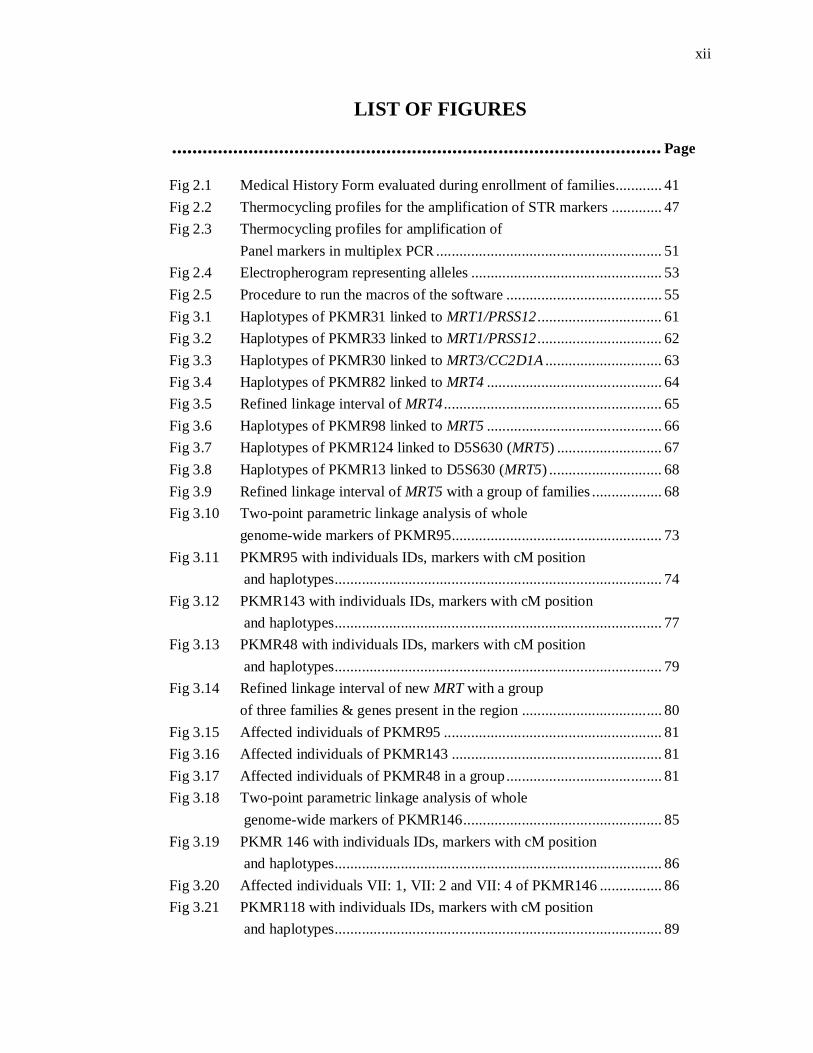
Fig 2.1 Medical History Form evaluated during enrollment of families............ 41 Fig 2.2 Thermocycling profiles for the amplification of STR markers ............. 47 Fig 2.3 Thermocycling profiles for amplification of Panel markers in multiplex PCR .......................................................... 51 Fig 2.4 Electropherogram representing alleles ................................................. 53 Fig 2.5 Procedure to run the macros of the software ........................................ 55 Fig 3.1 Haplotypes of PKMR31 linked to MRT1/PRSS12 ................................ 61 Fig 3.2 Haplotypes of PKMR33 linked to MRT1/PRSS12 ................................ 62 Fig 3.3 Haplotypes of PKMR30 linked to MRT3/CC2D1A .............................. 63 Fig 3.4 Haplotypes of PKMR82 linked to MRT4 ............................................. 64 Fig 3.5 Refined linkage interval of MRT4 ........................................................ 65 Fig 3.6 Haplotypes of PKMR98 linked to MRT5 ............................................. 66 Fig 3.7 Haplotypes of PKMR124 linked to D5S630 (MRT5) ........................... 67 Fig 3.8 Haplotypes of PKMR13 linked to D5S630 (MRT5) ............................. 68 Fig 3.9 Refined linkage interval of MRT5 with a group of families .................. 68 Fig 3.10 Two-point parametric linkage analysis of whole genome-wide markers of PKMR95 ...................................................... 73 Fig 3.11 PKMR95 with individuals IDs, markers with cM position and haplotypes .................................................................................... 74 Fig 3.12 PKMR143 with individuals IDs, markers with cM position and haplotypes .................................................................................... 77 Fig 3.13 PKMR48 with individuals IDs, markers with cM position and haplotypes .................................................................................... 79 Fig 3.14 Refined linkage interval of new MRT with a group of three families & genes present in the region .................................... 80 Fig 3.15 Affected individuals of PKMR95 ........................................................ 81 Fig 3.16 Affected individuals of PKMR143 ...................................................... 81 Fig 3.17 Affected individuals of PKMR48 in a group ........................................ 81 Fig 3.18 Two-point parametric linkage analysis of whole genome-wide markers of PKMR146 ................................................... 85 Fig 3.19 PKMR 146 with individuals IDs, markers with cM position and haplotypes .................................................................................... 86 Fig 3.20 Affected individuals VII: 1, VII: 2 and VII: 4 of PKMR146 ................ 86 Fig 3.21 PKMR118 with individuals IDs, markers with cM position and haplotypes .................................................................................... 89
xiii
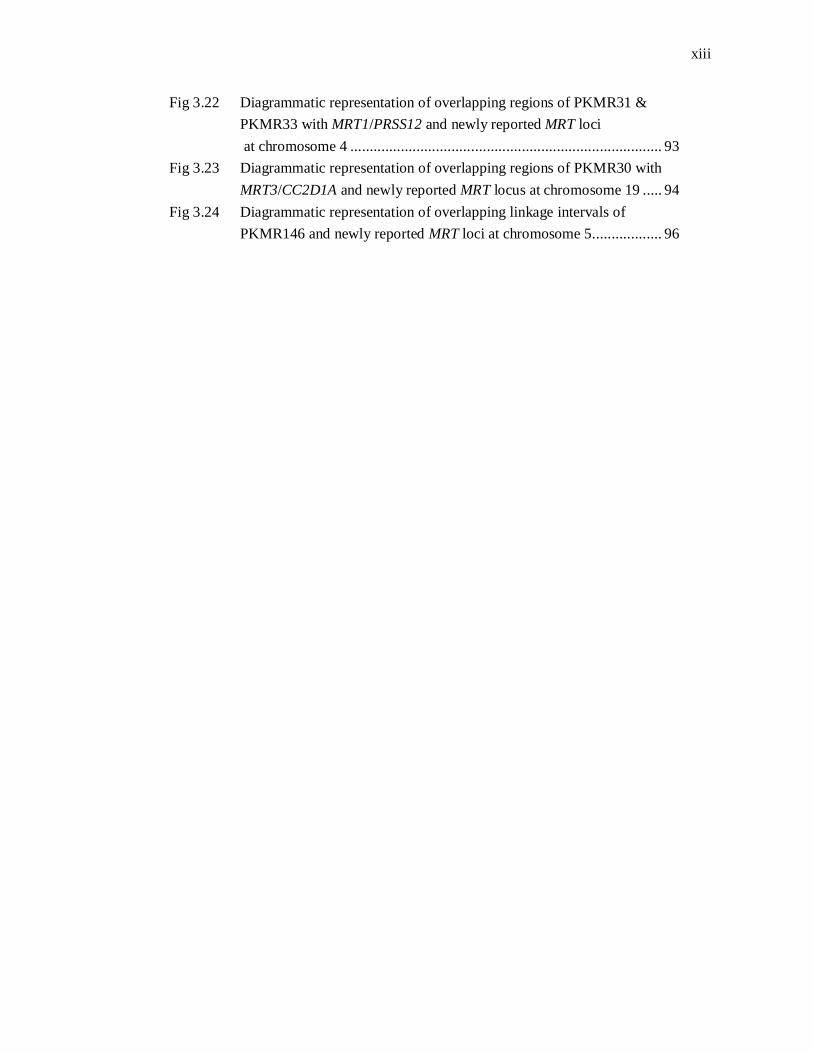
Fig 3.22 Diagrammatic representation of overlapping regions of PKMR31 & PKMR33 with MRT1/PRSS12 and newly reported MRT loci at chromosome 4 ................................................................................ 93 Fig 3.23 Diagrammatic representation of overlapping regions of PKMR30 with
MRT3/CC2D1A and newly reported MRT locus at chromosome 19 ..... 94 Fig 3.24 Diagrammatic representation of overlapping linkage intervals of PKMR146 and newly reported MRT loci at chromosome 5 .................. 96
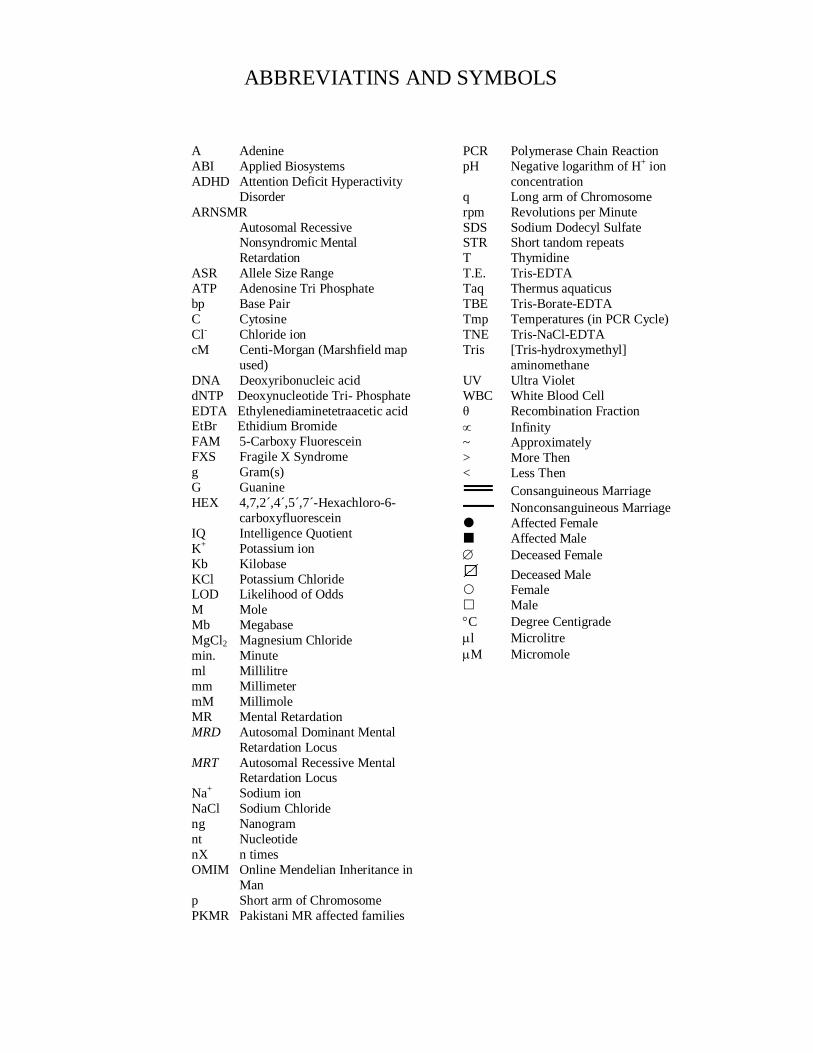
A Adenine ABI Applied Biosystems ADHD Attention Deficit Hyperactivity
Disorder ARNSMR
Autosomal Recessive Nonsyndromic Mental Retardation
ASR Allele Size Range ATP Adenosine Tri Phosphate bp Base Pair C Cytosine Cl- Chloride ion cM Centi-Morgan (Marshfield map
used) DNA Deoxyribonucleic acid dNTP Deoxynucleotide Tri- Phosphate EDTA Ethylenediaminetetraacetic acid EtBr Ethidium Bromide FAM 5-Carboxy Fluorescein FXS Fragile X Syndrome g Gram(s) G Guanine HEX 4,7,2´,4´,5´,7´-Hexachloro-6-
carboxyfluorescein IQ Intelligence Quotient K+ Potassium ion Kb Kilobase KCl Potassium Chloride LOD Likelihood of Odds M Mole Mb Megabase MgCl2 Magnesium Chloride min. Minute ml Millilitre mm Millimeter mM Millimole MR Mental Retardation MRD Autosomal Dominant Mental
Retardation Locus MRT Autosomal Recessive Mental
Retardation Locus Na+ Sodium ion NaCl Sodium Chloride ng Nanogram nt Nucleotide nX n times OMIM Online Mendelian Inheritance in
Man p Short arm of Chromosome PKMR Pakistani MR affected families
PCR Polymerase Chain Reaction pH Negative logarithm of H+ ion
concentration q Long arm of Chromosome rpm Revolutions per Minute SDS Sodium Dodecyl Sulfate STR Short tandom repeats T Thymidine T.E. Tris-EDTA Taq Thermus aquaticus TBE Tris-Borate-EDTA Tmp Temperatures (in PCR Cycle) TNE Tris-NaCl-EDTA Tris [Tris-hydroxymethyl]
aminomethane UV Ultra Violet WBC White Blood Cell θ Recombination Fraction Infinity ~ Approximately > More Then < Less Then
Consanguineous Marriage Nonconsanguineous Marriage
Affected Female Affected Male Deceased Female
Deceased Male Female Male C Degree Centigrade l Microlitre M Micromole
ABBREVIATINS AND SYMBOLS
1
INTRODUCTION
Mental retardation (MR) is a neurodevelopmental disability characterized by impaired
cognitive functioning; defining a significant subaverage intellectual ability and
limitations in at least two or more adaptive skills with the onset before age of 18
years. Intellectual dysfunction is an overall intelligence quotient (IQ) lowers than 70
and adaptive behavior is associated with functional deficit in daily-living skills, social
and communication skills. Assuming average IQ of 100 in normal population, the
disease is grouped into, on the basis of severity: mild (IQ level 50 to 69); moderate
(IQ level 35 to 49); severe (IQ level 20 to 34); and profound (IQ level below 20)
(DSM-IV, 2000; WHO, 1992). It affects 1-3% of general population and has serious
impact on the life of affected individuals, their families and the society as a whole
(Hamdan et al., 2009; Rafiq et al., 2010; Backx et al., 2010).
The disorder represents one of the most difficult challenges faced today by
clinicians and geneticists. The causes of the impairment are extremely heterogeneous
contributed by environmental and genetic factors and has been diagnosed in only one
half of the cases (Basel-Vanagaite, 2007). Environmental factors include prenatal
exposure of the fetus to toxic substances (e.g., alcohol, drugs), illness of the mother
(e.g. exposure to rubella, cytomegalovirus), premature birth, low birth weight and
childhood diseases (e.g. measles) etc, which lead to irreparable damage of the nervous
system (Kaufman et al., 2010). Genetic causes of mental retardation are present in
25–50% of all cases however this number increases proportionally with severity (Liu
et al., 2010; Giannandrea et al., 2010). Genetic factors of mental retardation include
chromosomal abnormalities and monogenic defects. Chromosomal abnormalities have
been reported in MR, with different types of aberrations; aneuploidies,
submicroscopic deletions and duplications (Curry et al., 1997). Autosomal trisomies
that are compatible with human viability and the X-chromosome almost always result
in some degree of MR as part of a syndrome, as illustrated by trisomy 21, the most
common genetic form of MR (Rauch et al., 2006).
Our understanding to monogenic causes of the disease has substantially
improved in the last decade. However search for gene defects causing MR has
focused exclusively on the X-chromosome. So far, >90 genes have been implicated in
2
X-linked MR among these 40 genes have been described for nonsyndromic X-link
MR (Ropers, 2010; Kaufman et al., 2010). Recent studies have shown that autosomal
recessive mental retardation (ARMR) is extremely heterogeneous which is not
surprising because about one half of all human genes are expressed in the brain and
that is the reason to believe that the number of underlying gene defects will go into
thousands (Inlow and Restifo; 2004). Autosomal forms, either due to dominant de
novo mutations or to recessive gene defects, are presumably more common than X-
linked genes, and their molecular elucidation is a challenge for researchers in this
field (Ropper, 2008).
ARMR is particularly prevalent in highly consanguineous populations and
genetic isolates, and may account for nearly a quarter of all individuals with
nonsyndromic MR (NSMR) (Bartley and Hall, 1978; Wright et al., 1959).
Consanguinity is very high in Pakistani population (Bittles and Black, 2010). More
than two third of the population have marriages within clans and castes (Hussain and
Bittles, 1998). The consanguineous marriages lead to high prevalence of mental
retardation in Pakistani population (Gustavson, 2005). Majority of patients of MR
have nonsyndromic form, which is characterized by the absence of associated
morphologic, radiologic, and metabolic features but genetic factors involved in
nonsyndromic mental retardation remain poorly understood (Ropper and Hamel,
2005; Hamdan et al., 2009). So this study was designed to elucidate the autosomal
recessive nonsyndromic mental retardation (ARNSMR) through homozygosity
mapping in affected Pakistani families.
To date thirty loci have been published for autosomal recessive nonsyndromic
mental retardation with six corresponding genes. OMIM uses the acronym MRT for
ARNSMR loci. There were three genes, mapped for ARNSMR each in a single large
consanguineous family or clan up till 2006 (Basel-Vanagaite et al., 2006; Higgins et
al., 2004; Molinari et al., 2002). In 2007 homozygosity mapping in consanguineous
Iranian families with ARNSMR revealed eight novel MRT loci (Najmabadi et al.,
2007. The same group was able to identify the underlying gene defects GRIK2
(Motazacker et al., 2007) and TUSC3 (Garshasbi et al., 2008; Molinari et al., 2008) in
two loci. Three novel loci and one gene TRAPPC9 for ARNSMR have been described
in Pakistani population (Rafiq et al., 2010; Mir et al., 2009). Recently Kuss et al.
3
(2010) identified 27 single linkage intervals with at least 14 new MRT loci through
homozygosity mapping.
Families with MR have scarcity of affected individuals in multiple generations
as patients with mental retardation rarely reproduce. This result in non significance of
statistical evaluation: LOD (logarithm of the odds) score and linkage with LOD score
< 3 cannot be described as new locus. Najmabadi et al. (2007) reported four linkage
intervals with LOD scores below three. Rafique et al. (2010) reported two probable
regions for this disease. Recently Kuss et al. (2010) also described thirteen linkage
intervals with non significant LOD score (< 3) for ARNSMR.
In the present study twenty five families segregating mental retardation were
enrolled. Seven families were found linked to reported ARNSMR genes/loci. Four
families linked to reported MRT loci and reduced the reported linkage intervals.
PKMR82 linked to MRT4 and refined the reported linkage interval from 8.57cM to
5.06cM. Three families (PKMR98, PKMR13 and PKMR124) were linked to MRT5,
refining its linkage interval from 11.03cM to 1.8cM. Three families potentially linked
to loci in which genes have been reported; PKMR30 linked to CC2D1A/MRT3 and
families PKMR31 and PKMR33 linked to PRSS12/MRT1. These families have
linkage intervals exceeding than reported loci and might have some other disease
causing defect unless their regions are sequenced. Therefore these are described as
potentially linked to these loci/genes.
The four unlinked families (PKMR95, PKMR118, PKMR146 and PKMR148)
were subjected to genome-wide linkage analysis. Genome-wide scan revealed three
novel linkage intervals/loci for ARNSMR mapped on Pakistani families. PKMR95
linked at chromosome 11q14.1 with maximum two-point LOD score (Zmax) of 3.34 at
recombination fraction θ=0 for the marker D11S901 (85.48cM). Typing additional
markers and additional individuals showed a 1.5cM (2.69 Mb) interval of
homozygosity delimited by markers D11S1396 (85.48cM) and D11S4135 (86.26cM).
120 ARNSMR families present in CEMB DNA data bank were screened for this
region. Two families PKMR48 and PKMR143 were linked to the new region as of
PKMR95. Second locus was mapped at Chromosome 5q14.1-14.3 in family
PKMR146. This family linked to marker D5S641 with maximum LOD score 3.05 at
(θ=0) defining the interval of 4.02 Mb (8.54cM). This region has been defined by
4
flanking markers D5S672 (86.26cM) at proximal and D5S1726 (94.8cM) at distal
side. Third linkage interval has been mapped in family PKMR118 at Chromosome
22q12.1-12.3. This family showed maximum LOD score of 2.2 at (θ=0) with marker
D22S280. This region of 8.36 Mb, delimited by markers D22S1163 (28.02cM) and
D22S277 (36.22cM) can be described as potential region for new locus.
In conclusion the linkage intervals mapped in Pakistani families will help to
identify the molecular component involved in this disability and will be a significant
contribution to the existing knowledge of mental retardation. It will also pave the way
for finding cure for this disorder in future.

5
SECTION-1
REVIEW OF LITERATURE
6
CHAPTER-1
OVERVIEW OF MENTAL RETARDATION
7
WHAT IS MENTAL RETARDATION?
Mental Retardation (MR) can be defined as a disability characterized by subaverage
cognitive functioning and lack of functional skills with the onset before the age of 18.
The term cognition includes both a component relating to mental functioning and one
relating to individuals' functional skills in their environment. Mental retardation (MR)
is an overall intelligence quotient lower than 70, associated with functional deficit in
adaptive behaviour, such as daily-living skills, social skills and communication and
these conditions should present from childhood (defined as age 18 years or less)
(Basel-Vanagaite, 2007).
CLINICAL FEATURES; Children with mental retardation may learn to sit up, to
crawl, or to walk later than other children, or they may learn to talk later. Both adults
and children with mental retardation may also exhibit the following characteristics:
Delays in oral language development
Deficits in memory skills
Difficulty learning social rules
Difficulty with problem solving skills
Delays in the development of adaptive behaviors such as self-help or self-
care skills
Lack of social inhibitors
The limitations of cognitive functioning will cause a child with mental
retardation to learn and develop more slowly than a normal child. Children may take
longer to learn language, develop social skills, and take care of their personal needs
such as dressing or eating. Learning will take them longer, require more repetition,
and skills may need to be adapted to their learning level. Nevertheless, virtually every
child is able to learn, develop and become participating members of the community.
DIAGNOSIS OF MENTAL RETARDATION; Three criteria must be met for a
diagnosis of mental retardation: an IQ below 70, significant limitations in two or more
8
areas of adaptive behavior (as measured by an adaptive behavior rating scale, i.e.
communication, self-help skills, interpersonal skills, and more), and evidence that the
limitations became apparent before the age of 18 according to Diagnostic and
Statistical Manual of Mental Disorders (DSM-IV, 2000).
IQ BELOW 70
An intelligence quotient, or IQ, is a score derived from one of several different standardized tests designed to assess intelligence. The term "IQ", from the German Intelligenz-Quotient, was devised by the German psychologist William Stern in 1912 as a proposed method of scoring children's intelligence tests such as those developed by Alfred Binet and Théodore Simon in the early 20th Century. The first English-language IQ test, the Terman-Binet, was adapted from an instrument used to measure potential to achieve developed by Binet in France. Terman translated the test and employed it as a means to measure intellectual capacity based on oral language, vocabulary, numerical reasoning, memory, motor speed and analysis skills. IQ tests in practice in the world include the Stanford-Binet Intelligence Scale, the Wechsler Intelligence Scales, the Wechsler Preschool and Primary Scale of Intelligence, and the Kaufman Assessment Battery for Children. Interviews with parents or other caregivers are used to assess the child's daily living, muscle control, communication, and social skills. The mean score on the currently available IQ tests is 100, with a standard deviation of 15 (WAIS/WISC-IV) or 16 (Stanford-Binet). Sub-average intelligence is generally considered to be present when an individual scores two standard deviatons below the test mean. Factors other than cognitive ability (depression, anxiety, etc.) can contribute to low IQ scores; it is important for the evaluator to rule them out prior to concluding that measured IQ is "significantly below average".
Since the diagnosis is not based only on IQ scores, but must also take into
consideration a person's adaptive functioning, the diagnosis is not made rigidly. It
encompasses intellectual scores, adaptive functioning scores from an adaptive
behavior rating scale based on descriptions of known abilities provided by someone
familiar with the person, and also the observations of the assessment examiner who is
able to find out directly from the person what he or she can understand, communicate,
and the like.
9
Although the term "IQ" is still in common use, the scoring of modern IQ tests
such as the Wechsler Adult Intelligence Scale is now based on a projection of the
subject's measured rank on the Gaussian bell curve with a center value (average IQ) of
100, and a standard deviation of 15, although not all tests adhere to that standard
deviation.
LACK OF ADAPTIVE BEHAVIOR/SKILS
A complete medical, family, social, and educational history is compiled from existing
medical and school records (if applicable) and from interviews with parents. Adaptive
behavior, or adaptive functioning, refers to the skills needed to live independently (or
at the minimally acceptable level for age). To assess adaptive behavior, professionals
compare the functional abilities of a child to those of other children of similar age. To
measure adaptive behavior, professionals use structured interviews, with which they
systematically elicit information about persons' functioning in the community from
people who know them well. There are many adaptive behavior scales, and accurate
assessment of the quality of someone's adaptive behavior requires clinical judgment
as well. Certain skills are important to adaptive behavior, such as:
Daily Living Skills, such as getting dressed, using the bathroom, and feeding oneself;
Communication skills, such as understanding what is said and being able to answer;
Social skills with peers, family members, spouses, adults, and others.
CLASSIFICATION OF MENTAL RETARDATION
The Diagnostic and Statistical Manual of Mental Disorders, fourth edition, text
revision, which is the diagnostic standard for mental health care professionals in the United States and the ICD-10 Classification of Mental and Behavioural Disorders, World Health Organization (WHO) , Geneva 1992 is used in Europe; classifies four different degrees of mental retardation. These four levels of mental retardation are: mild, moderate, severe, and profound. These levels are determined by performance on standardized IQ tests and by the potential to learn adaptive skills such as communication and social interaction (DSM-IV, 2000; WHO,1992).
10
Mild retardation
The vast majority of people with mental retardation has IQ levels of 50 to 69 and is considered mildly retarded. Approximately 85% of the mentally retarded population is in the mildly retarded category. Mildly retarded children often go undiagnosed until they are well into their school years. They are often slower to walk, talk, and feed themselves than most other children. They can learn practical skills, including reading
and math, up to about the fourth to sixth grade level. Mildly retarded adults usually build social and job skills and can live on their own.
Moderate retardation
A much smaller number of people with mental retardation have IQs ranging from 35 to 49 and are considered moderately retarded. About 10% of the mentally retarded population is considered moderately retarded. Children who are moderately retarded show noticeable delays in developing speech and motor skills. Although they are unlikely to acquire useful academic skills, they can learn basic communication, some
health and safety habits, and other simple skills. They cannot learn to read or do math. Moderately retarded adults usually cannot live alone, but they can do some simple tasks and travel alone in familiar places.
Severe retardation
An even smaller percentage of people with mental retardation have IQs ranging from 20 to 34 and are considered severely mentally retarded. About 3–4% of the mentally retarded population is severely retarded. Their condition is likely to be diagnosed at birth or soon after. By preschool age, they show delays in motor development and
little or no ability to communicate. With training, they may learn some self-help skills, such as how to feed and bathe themselves. They usually learn to walk and gain a basic understanding of speech as they get older. Adults who are severely mentally retarded may be able to follow daily routines and perform simple tasks, but they need to be directed and live in a protected environment.
Profound retardation
Only a very few people with mental retardation have IQs of 0 to 24 and are considered severely mentally retarded. Only 1–2% of the mentally retarded
population is classified as profoundly retarded. Their condition is usually diagnosed at
11
birth, and they may have other medical problems and need nursing care. Children who are profoundly retarded need to be continuously supervised. These children show delays in all aspects of development. With training, they may learn to use their legs, hands, and jaws. Adults who are profoundly retarded usually learn some speech and may learn to walk. They cannot take care of themselves and need complete support in daily living. Profoundly retarded people need a high level of structure and
supervision.
However, epidemiological studies often use a simplified classification, grouping their subjects into mild ID (IQ50-70) and severe ID (IQ<50) (Ropers and Hamel 2005).
PREVLANCE OF MENTAL RETARDATION
This disability is a devastating disorder; with serious impact on affected individuals and their families, as well as on health and social services, affecting up to 3% of general population in the world (Rafiq et al., 2010; Hamadan et al., 2009). Reported estimates are of 0.3–0.5% for moderate and severe MR and of 1–3% when mild MR is included (Stevenson et al., 2000) and with a higher proportion of males to females affected (1.4:1) (Chelly et al., 2006).
CAUSES OF MENTAL RETARDATION
The causes of the impairment are extremely heterogeneous and although a cause for mental retardation has been diagnosed in only half of the cases, it has been estimated that half of all cases are due to environmental factors and half to genetic factors (Winnepenninckx et al., 2003).
ENVIRONMENTAL FACTORS
Problems during pregnancy
During prenatal and perinatal stages of pregnancy lot of factors can contribute of this disability. Pregnant women who drink too much alcohol risk having a mentally retarded child through a condition known as fetal alcohol syndrome (FAS) especially heavy drinking during the first twelve weeks (trimester) of pregnancy. Some studies have shown that even moderate alcohol use during pregnancy may cause learning disabilities in children. This is a common, and preventable, cause of mental retardation. Drug abuse and cigarette smoking during pregnancy have also been
12
linked to mental retardation. Maternal infections and such illnesses as glandular disorders, rubella, toxoplasmosis, and cytomegalovirus (CMV) infection may cause mental retardation. Even though the mother may not be harmed by the infection, the developing fetus becomes infected through the mother, and shows much more serious effects of the infection. Some drugs (for example, cocaine or amphetamines), when taken during pregnancy, may harm the mental development of the unborn child.
Maternal malnutrition and exposure to radiation during pregnancy can also cause mental retardation.
Problems during childbirth
Problems during childbirth such as an interruption in the supply of oxygen to the baby during the delivery can also cause mental retardation. Babies born prematurely (born before the normal duration of pregnancy has ended) are more likely to be mentally retarded than babies born at full term, especially if the baby is very premature and weighs less than 3.3 pounds (1.5 kg).
Disorders occurring after birth Mental retardation can also be caused by problems after birth such as lead or mercury poisoning, severe malnutrition, accidents that cause severe head injuries, an interruption in the supply of oxygen to the brain (for example, near-drowning), or diseases such as encephalitis, meningitis, and untreated hypothyroidism in infants. Some of these conditions are more likely to occur in children raised in circumstances of severe poverty, neglect, or abuse. The genetic causes are discussed in next chapter.
13
CHAPTER-II
GENETIC &
MOLECULAR FACTORS
OF MENTAL RETARDATION
14
GENETIC & MOLECULAR BASIS OF MENTAL
RETARDATION
The genetics basis of mental retardation is an extraordinary field having started with
modest beginnings with an initial survey of patients confined to long stay hospital
institutions in the 1930s (Penrose, 1938). A genetic etiology for mental retardation has
been recognized for many years and since the first identification of Down syndrome
as a chromosome abnormality, the focus of mental retardation research has been to
identify smaller and smaller chromosome abnormalities associated with disease
(Lejeune et al., 1959).
Genetic factors of mental retardation include chromosomal abnormalities and
gene dysfunction, which are individually required for development of cognitive
functions (Chelly et al., 2006). On the basis of associated anomalies, MR can be
syndromic as well as nonsyndromic. Syndromic form of MR is accompanied by
malformations, dysmorphic features, or neurological abnormalities; whereas
nonsyndromic forms have no comorbid features (Rafiq et al., 2010).
CHROMOSOMAL ABNORMALITIES AND MENTAL RETARDATION
Chromosomal aberrations are disruptions in the normal chromosomal content of a
cell, and are a major cause of genetic conditions in humans. It is a genetic abnormality
which is usually a de novo or a spontaneous mutation. It includes numerical
chromosome abnormalities, partial chromosome abnormalities and microdeletions.
Chromosomal abnormalities are responsible for up to 28% of all mental retardation
cases (Curry et al., 1997). It is not inherited if parent is not balanced carrier and
recurrence risk is very low. Chromosomal disorders can be detected using light
microscope, but cryptic chromosomal aberration less than 4 Mb cannot be seen.
Fluorescence In Situ Hybridization (FISH) techniques using fluorescence labeled
DNA sequence can be used for identifying a small abnormality in chromosomal
DNA.
15
Numerical Chromosome Abnormalities
Abnormal number of chromosomes, that occurs when an individual is missing either a
chromosome from a pair (monosomy) or has more than two chromosomes of a pair
(trisomy, tetrasomy, etc). It is caused by additional (polyploidy) or missing
(monosomy) chromosomes from the normal set of 46. Reported live-born autosomal
chromosome polyploidies are restricted to trisomy 13 (Patau’s syndrome), 18
(Edwards’ syndrome) and 21 (Down syndrome). Trisomy 21 that is responsible for
Down syndrome, is the most frequent cause of mental retardation (Hodapp et al.,
2003), affecting on average 1 in 1500 but the risk increases exponentially with the age
of the mother (Winnepenninckx et al., 2003). Many features shared by Patau’s
syndrome and Edwards’ syndrome are common like patients are always severely
mentally retarded and most affected children die during the first weeks after birth
(Winnepenninckx et al,. 2003). Chromosome 13, 18 and 21 are among the three gene-
poorest chromosomes of the human genome (www.ncbi.nih.gov), explaining the
reason that only these polyploidies are viable. Monosomy of any autosomal
chromosome is invariably lethal at the earliest stage of embryonic life. Numerical sex
chromosome abnormalities are more common than numerical autosomal
abnormalities, but not necessarily associated with mental retardation. Turner
syndrome (females possessing only one X chromosome) and Klinefelter patients
(XXY males) may be intellectually normal. However, once the number of X
chromosomes exceeds two, such as in the triple X syndrome, patients are always
mentally retarded (Winnepenninckx et al., 2003).
Partial Chromosome Abnormalities
Partial chromosome abnormalities may occur on any part of any chromosome, that
includes deletions, insertions, inversions, translocations etc. Deletions may cause
diverse phenotypes, depending on both the size and location of the deletion, but
almost invariably including mental retardation. As a general rule, deletions spanning
more than 2% of the total genome are not viable, with a minimum size of roughly a
single chromosome band, or 5-15 Mb, can be detected under a microscope on
chromosome spreads made of blood cells (Winnepenninckx et al., 2003). Cri-du-chat
syndrome, characterized by mental retardation and cat-like crying in childhood is the
examples of cytogenetically visible deletions. Translocations can remain without
16
clinical consequences as long as they are balanced, without loss or gain of genetic
material and do not interrupt an important gene. Robertsonian translocation, which
results from the breakage of two acrocentric chromosomes (13, 14, 15, 21 or 22) at or
close to their centromeres followed by a fusion of the long arms. The resulting hybrid
chromosome consists of two long arms of for instance chromosomes 14 and 21. As
the short arm of these acrocentric chromosomes contains abundant ribosomal
sequences only, the carrier of this Robertsonian translocation remains unaffected.
However, the progeny of such a patient may inherit an extra copy of the long arm of
chromosome 21 on top of chromosome 14 and suffer from Down syndrome, or may
inherit an extra copy of the long arm of chromosome 14 and not be viable.
Cytogenetically Invisible Microdeletions
i. Interstitial microdeletions
Microdeletions are submicroscopic deletions which are cytogenetically not visible, are
too small to detect under a microscope. These deletions are responsible for the loss of
only a limited chromosomal segment, taking away a few genes only and causing so-
called contiguous gene syndromes. Such deletions do not occur at random positions in
the genome but tend to cluster in specific regions. For example Williams-Beuren
syndrome that is associated with mental retardation in combination with recognizable
phenotypic features and an asymmetric cognition profile is due to submicroscopic
deletion of a segment on chromosome 7q11.23. Smith-Magenis syndrome has a
phenotype including psychomotor and growth retardation and behavioural problems is
due to deletion of 17p11.2 portion. In addition, the velocardiofacial syndrome, caused
by a 22q11 microdeletion, is characterized by cleft palate, cardiac anomalies, typical
faces, and learning disability. Such deletions are not routinely detected by karyotype
analysis, but may be detected by fluorescence in situ hybridisation (FISH) with probes
specific for that chromosomal region upon request by an experienced clinician
(Winnepenninckx et al., 2003).
ii. Subtelomeric deletions
A specific subcategory of cytogenetically invisible deletions includes deletions at the
end of chromosomes. Chromosomal rearrangements involving telomeres are
emerging as a significant cause of idiopathic (Flint et al., 1995) as well as familial
17
mental retardation (Feder et al., 2000). Telomeres are composed of a TG rich repeat
(TTAGGG)n which is similar in all vertebrates. This simple sequence is repeated
several hundred to several thousand times and the number of repeats is variable
between individuals and with age. Immediately adjacent to these repeats lay complex
families of repetitive DNA that may be shared among several chromosomes (Mefford
and Trask, 2002). The function of these subtelomeric sequences, which may extend
over a few hundred kilobases, remains unknown. The high degree of sequence
similarity could cause “crosstalk” between telomeric regions, a process from which
the rearrangements may arise. The telomeric regions are extremely gene-rich which
explains why the relatively small deletions of subtelomeric sequences frequently
cause mental retardation such as observed in the Miller-Dieker syndrome (deletion of
the 17p telomere) and the a-thalassemia/mental retardation syndrome (deletion of the
16p telomere) (Winnepenninckx et al., 2003). Though initial studies reported
identification of subtelomeric deletions in 5-10% of all cases of idiopathic mental
retardation (Knight et al., 1999) the exact frequency of these mutations still remains
unknown due to the fact that it is not possible to detect these cytogenetically invisible
subtelomeric deletions by routine karyotyping.
GENE DEFECTS IN MENTAL RETRATDATION
Mutations in a single gene may disrupt its function and may cause mental retardation
or a variety of phenotypes associated with mental retardation, depending on the
function of the mutated gene and the impact of the mutation on its function. Presently
when we talk about gene dysfunction it refers to monogenic defects. A subdivision
within this group of disorders is based on the mode of inheritance.
X-LINKED MENTAL RETARDATION
X-Linked Mental Retardation (XLMR) is the most studied cause of monogenic MR
affecting mostly males, with an estimated prevalence of nearly 1/1000 males
(Chiurazzi et al., 2008). X-linked forms of mental retardation are estimated to cause
10-20% of all inherited cases of mental retardation. Chiurazzi et al. (2008) have listed
215 XLMR conditions, subdivided according to their clinical presentation: 149 with
specific clinical findings, including 98 syndromes and 51 neuromuscular conditions,
and 66 nonspecific (MRX) forms. More than 120 X-linked inherited disorders have
18
been described in which mental retardation (MR) appears as the primary character or
at least a major component of the disease phenotype (Stevenson, 2000; Martinez-
Garay, et al., 2007). Most XLMR conditions are inherited as X-linked recessive traits,
although female carriers may manifest usually milder symptoms (Chiurazzi et al.,
2008). XLMR has been originally classified as syndromic (SXLMR) and
nonsyndromic (NSXLMR), depending on whether the patients display additional
physical, behavioral, or neurological symptoms, or if MR is the only clinical
manifestation respectively (Ropers, 2005; Martınez-Garay et al., 2007). To date 91
XLMR gene defects have been identified (Ropers, 2010).
There are approximately 40 genes known to cause NSMR and ~80% of these
reside on the X chromosome (Kaufman et al. 2010). Some of these genes cause both
SMR and NSMR, depending on the mutation, or may even vary within families,
possibly modulated by additional factors. In the case of ATRX gene the same
mutation in the same family led to all family members having characteristic facial
features, except for one who had NSMR (Guerrini et al. 2000). This gene has been
shown to cause several other MR syndromes, for which different mutations have been
identified (Yntema et al. 2002; Gibbons et al. 2003; Howard et al. 2004).
Several other genes that classically cause syndromes may also cause
NSXLMR. MECP2, which causes Rett syndrome, has been identified in a number of
NSMR cases (Orrico et al. 2000; Couvert et al. 2001; Dotti et al. 2002). Previously
thought to be lethal in males, an MECP2 missense mutation was found to cause
severe MR in males, and a much milder phenotype in females (Dotti et al. 2002).
These findings suggest that there may be a quantifiable genotype/phenotype
correlation for certain mutations. ARX is one of the most frequently mutated genes in
XLMR. It encodes a transcription factor, responsible for both gene repression and
activation, which is essential for normal development of the CNS. Mutations in this
gene are responsible for causing 7 distinct but overlapping MR-related phenotypes,
including NSMR (Friocourt et al. 2006).
As the X-chromosome has been highly scrutinized in the search for genes for
NSMR (McLaren and Bryson 1987) however, reviews of X-linked genes in MR have
postulated that genes on the X-chromosome likely account for only 10–12% of the
genes involved in genetic cases of MR (Ropers and Hamel 2005; Mandel and Chelly
19
2004; Kleefstra and Hamel 2005). Therefore genes on the X-chromosome appear to
account for some, but not all, of the increased male prevalence (the X-chromosome
contains ~4% of the genes in the genome). It is probable that X-linked genes are not
the sole reason for gender differences, and those other factors, both genetic and non-
genetic, might influence the sex ratio. These could include environmental influences
or increased penetrance of certain autosomal mutations in males.
The most common heritable X-link form is the fragile X mental retardation
syndrome, affecting approximately 1 in 5000 males and 1 in 10000 females. It is
caused by the expansion of a tract of CGG repeats in the 5¢-untranslated region of the
Fragile X mental retardation (FMR1) gene located at Xq27.3 (Hawkins et al. 2010).
Fragile X syndrome (FMR1 Gene)
Fragile X syndrome (FXS) is one of the most common forms of inherited mental
retardation, it is transmitted as an X-linked dominant trait and with reduced
penetrance (80% in males and 30% in females) (Warren and Sherman, 2001; Warren
and Nelson, 1994). The clinical presentations of fragile X syndrome include mild to
severe mental retardation, with IQ between 20 and 60, mildly abnormal facial features
of a prominent jaw and large ears, mainly in males, and macroorchidism in post-
pubescent males. Many patients also display subtle connective tissue abnormalities,
hyperactive and attention deficit disorder and autistic-like behavior (Warren and
Sherman, 2001; Warren and Nelson, 1994; Sofocleous et al., 2009). At the genomic
level, fragile X syndrome is associated with the expansion of a naturally occurring
CGG trinucleotide tandem repeat in the promoter region and 5’ untranslated region of
the fragile X mental retardation 1 gene (FMR1) at Xq27.3 that occurs in fragile site,
designated FRAXA (Fragile site, X chromosome, A site) (Dahl et al., 2007) FMR1 is
a highly conserved gene that consists of 17 exons and spans ~38 kb (Ashley et al.,
1993; Eichler et al., 1993). Within the 4.4 kb of FMR1 transcript, a CGG trinucleotide
repeat is located at the 5'-untranslated region (5'-UTR). Due to hyperexpansion of
polymorphic (CGG) repeat at 5’-untranslated region in exon 1 of the FMR1 gene
leading to methylation and down regulation of transcription of the gene (Uyguner et
al., 2000). The number of CGG repeats is highly variable, and 4 allelic forms of
FMR1 have been defined: normal alleles have more than 50 CGG repeats and are
stable upon transmission from generation to generation; intermediate (or “gray-zone”)
20
alleles have 50–58 CGG repeats and may show some instability; permutations have
between 59 and round about 200 repeats and are liable to further expand upon
transmission; and the alleles in individuals with fragile X syndrome have more than
200 repeats and is known as full mutation (Dahl et al., 2007). It has been found that
full mutation leads to transcriptional silencing of FMR1 gene and inhibition of FMRP
proteins (Sofocleous et al., 2009). The FMR1 gene is widely expressed in both human
and murine tissues. In situ hybridization with the adult mouse tissues showed
abundant expression in brain, testes, ovary, esophageal epithelium, thymus, eye and
spleen, with moderate expression in colon, uterus, thyroid and liver, and no
expression in the heart, aorta or muscle (Hinds et al., 1993). Analysis of the amino
acid sequence of FMRP revealed the presence of two types of RNA-binding motif,
two ribonucleoprotein K homology domains (KH domains) and clusters of arginine
and glycine residues (RGG boxes), which suggested that FMRP is an RNA-binding
protein and This property of FMRP suggested that the RNA-binding is critical for
FMRP functions (Ashley et al., 1993; Siomi et al., 1993).
Although CGG repeat expansion seems to happen during meiosis or early
embryonic development, the exact timing of expansion has yet to be determined.
Individuals with FXS about 1% of the phenotype is caused by deletions or point
mutations along the FMR1 gene. Absence of functional FMRP, which is thought to
play key role in the maturing process of dendrites in the brain, is the cause of FXS
(Sofocleous et al., 2009). Developing the animal models that display similar CGG
repeat instability during transmission through generations will be critical to the
understanding of the molecular mechanism of CGG repeat expansion, which remains
very elusive. The physiological function of FMRP is being extensively studied that
showed the absence of FMRP leads to the clinical phenotype of fragile X syndrome.
Both molecular genetics and neurobiological approaches have to be combined to
bring closer molecular abnormalities to the neurobehavioral phenotypes. New animal
models and paradigms of behavior testing have to be developed. These studies will
also provide us with insight into the mechanisms of cognition, memory and behavior
in human. Moreover, discovery of those genes whose mRNAs interact with FMRP
will provide candidate genes for other disorders limiting cognition development (Jin
and Warren, 2000).
21
AUTOSOMAL FORM OF MENTAL RETARDATION
Although autosomal forms of nonsyndromic mental retardation account for the
majority of cases of mental retardation, the genes that are involved remain largely
unknown and in recent years it has become the subject of intensive study.
Autosomal Dominant Mental Retardation
As patients with mental retardation rarely reproduce, pedigrees of autosomal
dominant mental retardation are infrequently observed. For this only a few genes have
been found that cause ADNSMR. OMIM uses the acronym MRD for loci for “mental
retardation, autosomal dominant”. For MRD1 the methyl binding domain 5 gene,
MBD5 on 2q23.1 was identified by SNP microarray analysis, indicating a 200Kb de
novo deletion (Wagenstaller et al. 2007). The gene for MRD2, on 9p24, dedicator of
cytokinesis 8 was identified in 2 unrelated patients, by mapping breakpoints of a
depletion and translocation respectively (Griggs et al. 2008). The MRD3 and MRD4
genes, CDH15 and KIRREL3 respectively, both were mapped to the chromosomal
breakpoint of an individual with a balanced (11;16)(q24.2;q24) translocation
presenting with severe MR and several other dysmorphisms (Bhalla et al. 2008).
Hamadan et al., (2009) reported autosomal dominant nonsyndromic MR
gene SYNGAP1(MRD5), which encodes a ras GTPase-activating protein that is
critical for cognition and synapse function, in 94 patients with nonsyndromic mental
retardation and identified de novo truncating mutations (K138X, R579X, and
L813RfsX22) in three of these patients.
Recently Backx et al (2010) described a familial reciprocal translocation
(4; 6) (p16.1; q22) that segregates with mild MR, epilepsy and behavioural problems.
Breakpoint analysis using array painting revealed that the PPP2R2C gene is disrupted
on chromosome 4p. The PPP2R2C gene, encoding a subunit of proteinphosphatase
2Awith a unique expression pattern in brain and a role in synaptic plasticity,
represents a good candidate responsible for the MR present in the carriers.
Additionally, mutations in SHANK2 have been reported in cases of
autism and NSMR. Four unrelated individuals with NSMR and 7 unrelated
22
individuals with autism have either CNV deletions or sequence mutations in SHANK2
(Berkel et al. 2010).
Autosomal Recessive Mental Retardation
Similarly it is challenging to map successfully Autosomal Recessive Nonsyndromic
Mental Retardation (ARNSMR) genes due to extreme genetic heterogeneity,
insufficient family sizes and lack of consanguinity. An autosomal recessive mode of
inheritance may account for nearly a quarter of all individuals with nonsyndromic
mental retardation (NSMR) (Basel-Vanagaite et al., 2007) but genetic factors
involved in nonsyndromic mental retardation remain poorly understood. Most patients
have the nonsyndromic form of the disorder, which is characterized by the absence of
associated morphologic, radiologic, and metabolic features (Roper and Hamel, 2005).
Autosomal recessive nonsyndromic mental retardation (ARNSMR) account for the
majority of cases of mental retardation, the genes that are involved remain largely
unknown. Functional considerations argue for ARMR to be more common and there
is reason to believe that most of the patients with ‘idiopathic’ MR carry autosomal
recessive gene defects. However, no more than six gene defects causing
nonsyndromic ARMR have been identified. Until 2006, three genes were identified in
nonsyndromic ARMR (Basel-Vanagaite et al., 2006; Higgins et al., 2004; Molinari et
al., 2002). In 2007 homozygosity mapping in consanguineous Iranian families with
nonsyndromic autosomal recessive MR was conducted, and at least eight novel MRT
loci were identified along with four non-significant linkage intervals (Najmabadi et
al., 2007). The same group has able to identify the underlying gene defects GRIK2
(Motazacker et al., 2007) and TUSC3 (Garshasbi et al., 2008; Molinari et al., 2008) in
two of the Loci described before. An additional locus for ARNSMR was identified in
one Turkish family (Uyguner et al., 2007). Mean while mutation in gene TRAPPC9
involved in ARNSMR has been reported in Pakistani family (Mir et al., 2009). In
TRAPPC9 additional mutations were found by Mochida et al. (2009) and Philippe et
al. (2009). PRSS12 (Molinari et al., 2002) CRBN (Higgins et al., 2004) CC2DIA
(Basel et al., 2004), GRIK2 ( Motazacker et al., 2007), TUSC3/N33 (Molinari et al.,
2008) and TRAPPC9 (Mir et al. 2009; Philippe et al. 2009; Mochida et al. 2009) with
thirty reported Loci. Three additional genes have been suggested as ARNSMR genes
and reported at recent genetics meetings, but have yet to be published. Only two of
23
the ARNSMR genes published to date have been identified in more than one family
(Kaufman et al. 2010).
Much progress has been made to illustrate ARNSMR loci since the year
2010 when this document was being written. Kuss et al. (2010) identified 27 single
linkage intervals with at least fourteen new loci through homozygosity mapping.
Three novel loci have also been described in Pakistani families (Rafiq et al., 2010).
OMIM uses the acronym MRT for “mental retardation, autosomal recessive” and MRT
loci reported till December 2010 have been described in Table 1.1 with reported
regions.
i. MRT1/PRSS12
PRSS12 is the first gene reported as a cause of autosomal recessive nonsyndromic
Mental Retardation (Molinari et al., 2002). A 4–base pair deletion on exon 7 in the
neuronal serine protease neurotrypsin gene PRSS12 on chromosome 4q26 was
segregating with autosomal recessive nonsyndromic mental retardation in a large
consanguineous Algerian family with four affected children. PRSS12 encodes a
neurotrypsin which is a secreted protein of 875 amino acids, belonging to the sub
family of trypsin-like serine proteases. Search for serine proteases that are expressed
in brain leads to the discovery of PRSS12 through PCR (Zhu et al., 1996). In situ
hybridization experiments on human fetal brains showed that neurotrypsin was highly
expressed in brain structures involved in learning and memory. Immunoelectron
microscopy on adult human brain sections revealed that neurotrypsin is located in
presynaptic nerve endings, particularly over the presynaptic membrane lining the
synaptic cleft. these data not only suggested that the balance between proteolytic
enzymes and their inhibitors is crucial for regulation of neural plasticity but also that
neurotrypsin-mediated proteolysis is required for normal synaptic function and
suggest potential insights into the pathophysiological bases of mental retardation. On
the basis of its localization in presynaptic terminals; its expression in many brain
areas during neural development; and its strong expression in adult brain particularly
in areas that are involved in learning and memory makes PRSS12 gene an excellent
candidate as a regulator of synaptic development and function (Molinari et al., 2002).
24
ii. MRT2/CRBN
Higgins et al., (2004) identified the segregation of ARNSMR of a large German
Kindred with a homozygous C > T transisition at position 1274 (1274C>T), of a novel
gene CRBN on chromosome 3p26.2 (Higgins et al., 2004). This mutation change
arginine (R) residue at codon 419 results in premature stop codon making protein
truncated. It is the 2nd gene whose allelic variants are reported as cause of autosomal
recessive non syndromic MR. The gene was named CRBN based on its putative role
in cerebral development and the presence of its large, highly conserved Lon domain.
Cereblon, the protein encoded by the CRBN gene belongs to an Adenosine 5’-
triphosphate-dependent Lon protease gene family represented by multi-domain
enzymes associated with diverse functions from proteolysis to membrane trafficking
(Jo et al., 2005). CRBN mRNA is highly expressed in various tissues (Xin et al.,
2008). Cereblon was identified as being directly associated with large conductance
Ca21-activated K1 (BKCa) channels (Rotanova et al., 2006), which are important in
the control of neuronal excitability and transmitter release (Orio et al., 2002; Faber et
al., 2003). The predicted protein sequence is highly conserved across species, and it
belongs to a family of proteins that selectively degrade short-lived polypeptides and
regulate mitochondrial replication and transcription. One member of the Lon-
containing protein family is regionally expressed in the human hippocampus, an
important neuroanatomic region that is involved in long-term potentiation and
learning. The mutation in the CRBN gene described interrupts an N-myristoylation
site and eliminates a casein kinase II phosphorylation site at the C terminus. This gene
is associated with mild mental retardation in a large kindred. This finding implicates a
role for the ATP-dependent degradation of proteins in memory and learning. Xin et
al., (2008) investigated the general properties of CRBN, showing that mutation of
human cereblon gene (CRBN) is revealed to be related with mild mental retardation.
iii. MRT3/CC2D1A
Basel-Vanagaite et al., (2003) confirmed further genetic heterogeneity of MR by
excluding the association of disease phenotype of four consanguineous Israeli Arab
families with severe NSMR comprising of 10 affected and 24 unaffected individuals
with previously reported loci. A new ARNSMR locus on the chromosomal region
19p13.12-p13.2 through linkage analysis was mapped. Recombination events and a
25
common disease bearing haplotype defined a critical region of 2.4 Mb. These data
suggest that the extent of genetic heterogeneity in autosomal recessive NSMR may be
significant. Because of the increasing number of possible autosomal recessive NSMR
loci, suggestion for formal classification of these genes was introduced.
The linkage interval contains 56 known or hypothetical genes. They employed
positional cloning strategy to identify the disease gene at this locus. The linakge
interval was narrowed down from 2.4 Mb to 0.9 Mb on chromosome 19p13.12 by
identification of five additional families segregating MRT3 linked phenotype.
Candidate genes were prioritized for sequencing on the basis of their expression in the
brain. As a result of this effort, a protein-truncating mutation in the CC2D1A in nine
consanguineous families with severe autosomal recessive NSMR was identified. This
study confirmed the absence of the wild type protein in the lymphoblastoid cells of
the patients. The CC2D1A gene covers 37 Kb of genomic DNA on 19p13.12. It
encodes 3715 bp long mRNA, containing 31 exons. At least 12 splice variants have
been identified (UCSC genome browser). The coding sequence is 2853 bp long. The
gene is widely expressed in various tissues. Freud-1, encoded by CC2DIA, a neuronal
calcium-regulated repressor of the serotonin (5HT1A) receptor (Ou et al., 2003).
Recent studies have revealed that Freud-1 also binds to an intronic repressor element
in the dopamine receptor D2 gene (Rogaeva et al., 2007). The CC2D1A protein
contains 950 amino acids, although a shorter isoform of the protein exists, which
contains only 388 amino acids. CC2D1A is a member of a previously uncharacterized
gene family that carries two conserved motifs, a C2 domain and a DM14 domain. The
C2 domain is found in proteins which function in calcium-dependent phospholipid
binding. The DM14 domain is unique to the CC2D1A protein family, and its role is
unknown. CC2D1A is a putative signal transducer participating in positive regulation
of I-κB kinase/NF-κB cascade. The expression of CC2D1A mRNA in the embryonic
ventricular zone and developing cortical plate in staged mouse embryos, persisting
into adulthood with highest expression in the cerebral cortex and hippocampus.
Because the NF-kB pathway is important for neural plasticity and memory, this
finding may also explain why CC2D1A is indispensable for normal brain function in
humans (Ropers, 2008).
26
iv. MRT6/GRIK2
Motazacker et al., (2007) reported a complex mutation in the ionotropic glutamate
receptor 6 gene (GRIK2, also called “GLUR6”) that were found cosegregating in large
consanguineous Iranian family with moderate-to-severe nonsyndromic autosomal
recessive mental retardation. Electrophysiological data of the Patients DNA showed a
single non polymorphic sequence change, resulting in deletion removing exons 7 and
8 of the GRIK2 gene. This leads to removal of in an in-frame deletion of 84 aa
between amino acids 317 and 402, close to the first ligand binding domain (S1) in the
extracellular N-terminal region of GLUK6 protein. GLUK6 is a subunit of kainate
receptors (KARs) that is highly expressed in the brain. Impact of GRIK2 mutation on
GLUK6 protein structure results in lacking the first ligand-binding domain, the
adjacent transmembrane domain, and the putative pore loop, suggesting a complete
loss of function of the GLUK6 protein. Cloning of wild-type GLUK6 from human fetal
brain RNA was done and it was confirmed that this defect was sufficient to impair
GLUK6 protein function. In parallel, PCR experiments were performed with various
primer combinations to define the borders of the deletion but failed to amplify a
junction fragment. Southern-blot analysis was used to investigate the 5’ region of the
putative deletion in all available family members. The expected fragment size,
corresponding to a GRIK2 allele lacking exons 7 and 8, was 1.5 kb, yet it was
identified a 6.5-kb band in carriers of the mutant allele, which shows to the presence
of a more complex genomic rearrangement. Through further PCR and sequencing
analyses and Southern-blot experiments, the full extent of the observed mutation were
elucidated. In addition to the 120-kb deletion (spanning exons 7 and 8), the mutation
comprises an inversion of 80 kb, including exons 9, 10, and 11 in combination with a
deletion of 20 kb of intron 11. At the protein level, this rearrangement can be
expected to result in the loss not only of the first ligand-binding domain but also of
the adjacent transmembrane domain and the putative pore loop of GLUK6.
v. MRT7/TUSC3
Garshasbi et al., (2008) investigated a large consanguineous family comprising of
seven patients with nonsyndromic ARMR in four sibships. Genome-wide SNP typing
enabled him to map the relevant genetic defect to a 4.6 Mbp interval on chromosome
8. Haplotype analyses and copy-number studies lead to the identification of a
27
homozygous deletion partly removing TUSC3 (N33) in all patients. PCR
amplification and sequencing of the junction fragment showed that 121,595 bp were
homozygously deleted in all patients. Heterozygous carriers were identified by PCR
amplification of the junction fragment and a PCR product specific for the normal
allele. All obligate carriers of this family were heterozygous, and none of 192
unrelated healthy individuals from the same population that were screened as controls,
carried this deletion. Other potentially disease-causing mutations were excluded by
sequencing the exons and exon-intron boundaries of all genes in the relevant linkage
interval. Apart from two known SNPs and one silent nucleotide exchange, no further
sequence alterations were found. TUSC3 is thought to encode a subunit of the
endoplasmic reticulum-bound oligosaccharyltransferase complex that catalyzes a
pivotal step in the protein N-glycosylation process. Expression studies of TUSC3 gene
was carried out by generating cDNA. A series of primer combinations were used to
perform PCR for one or several adjacent exon sequences and together encompassing
the entire gene. All predicted PCR products were found to be present in the controls
but not in the patient, proving the complete absence of a TUSC3 transcript in
homozygous deletion carriers. Therefore it is conclude that the deletion causes a
complete loss of TUSC3 function. TUSC3 is expressed in a wide range of human
tissues, including the brain. TUSC3 has 11 exons spanning ~224 Kbp of the genomic
DNA on chromosome 8p22. According to the UniProtKB database, TUSC3 encodes a
predicted 348 amino acid protein with five potential transmembrane domains and
seems to be involved in catalyzing the transfer of a 14-sugar oligosaccharide from
dolichol to nascent protein. This reaction is the central step in the N-linked protein
glycosylation pathway. This study suggest that in contrast to other genetic defects of
glycosylation, inactivation of TUSC3 causes nonsyndromic MR.
iv.MRT13/TRAPPC9
The second ARNSMR gene to be identified in more than one family is TRAPPC9, for
MRT13, which encodes a protein called NIBP. TRAPPC9 mutations have been found
in 4 unrelated families from different parts of the world (Mir et al. 2009; Philippe et
al. 2009; Mochida et al. 2009). NIBP directly interacts with NIK and IKKβ, which
results in the activation the NF-κB pathway (Hu et al. 2005). It has been shown to be
involved in axonal outgrowth in vitro, and may be involved in neuronal cell survival
28
(Hu et al. 2005). Interestingly, the same truncating allelic variant segregates in two
families from two different countries (Mir et al. 2009; Mochida et al. 2009). It is
possible that this represents a historic variant passed down through many generations,
and may represent a relatively common cause of ARNSMR, although this requires
further investigation. It is also possible that the two families are distantly related
although this is thought unlikely due to the distance between Pakistan and Israel, and
the limited transmigration of the populations involved.
Three additional genes have been suggested as ARNSMR genes and reported
at recent genetics meetings, but have yet to be published. Two of these genes were
found to have missense mutations, which would represent the first instances of
missense mutations causing autosomal NSMR (Najmabadi et al. 2009 Abstract;
Moheb et al. 2009 Abstract). One of these is the ZNF526 gene, which encodes a
C2H2 zinc finger protein that is expressed in the brain (Moheb et al. 2009 Abstract).
This mutation has been identified in two Iranian families. The other gene with
missense mutations is ST3GAL3, which codes for a glycosyl tranferase that catalyzes
the transfer of sialic acid to galactose-containing substrates, and has been identified in
two Iranian families (Najmabadi et al. 2009 Abstract; Grahn et al. 2002). Two more
unrelated families have been mapped to the same locus, 1p34 (Najmabadi et al. 2009
Abstract). Finally, two unrelated families were found to have nonsense and frame
shift mutations in ZC3H14, which is a recently described CCCH-type zinc finger gene
(Garshasbi et al. 2009 Abstract; Leung et al. 2009). These three genes, if validated,
will be interesting because all of them have been identified in more than one family.
The genetic causes of ARNSMR are rapidly being uncovered and will be
essential for genetic counseling, diagnostics and treatments in the future. This study
will enhanced efficiency for genetic diagnostics for ARNSMR and also aid our
understanding of the molecular pathways and processes involved in memory and
learning.
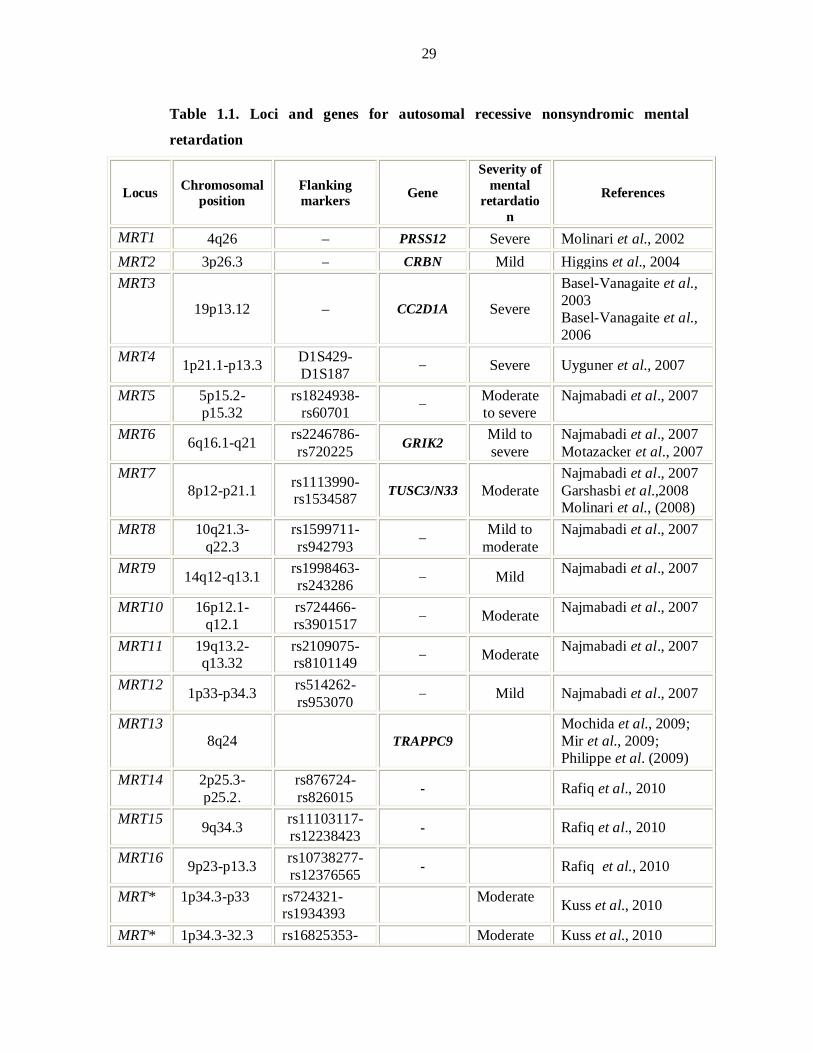
29
Table 1.1. Loci and genes for autosomal recessive nonsyndromic mental
retardation
Locus Chromosomal position
Flanking markers Gene
Severity of mental
retardation
References
MRT1 4q26 – PRSS12 Severe Molinari et al., 2002 MRT2 3p26.3 – CRBN Mild Higgins et al., 2004 MRT3
19p13.12 – CC2D1A Severe
Basel-Vanagaite et al., 2003 Basel-Vanagaite et al., 2006
MRT4 1p21.1-p13.3 D1S429-D1S187 – Severe Uyguner et al., 2007
MRT5 5p15.2-p15.32
rs1824938-rs60701 – Moderate
to severe Najmabadi et al., 2007
MRT6 6q16.1-q21 rs2246786-rs720225 GRIK2 Mild to
severe Najmabadi et al., 2007 Motazacker et al., 2007
MRT7 8p12-p21.1 rs1113990-
rs1534587 TUSC3/N33 Moderate Najmabadi et al., 2007 Garshasbi et al.,2008 Molinari et al., (2008)
MRT8 10q21.3-q22.3
rs1599711-rs942793 – Mild to
moderate Najmabadi et al., 2007
MRT9 14q12-q13.1 rs1998463-rs243286 – Mild Najmabadi et al., 2007
MRT10 16p12.1-q12.1
rs724466-rs3901517 – Moderate Najmabadi et al., 2007
MRT11 19q13.2-q13.32
rs2109075-rs8101149 – Moderate Najmabadi et al., 2007
MRT12 1p33-p34.3 rs514262-rs953070 – Mild Najmabadi et al., 2007
MRT13 8q24 TRAPPC9
Mochida et al., 2009; Mir et al., 2009; Philippe et al. (2009)
MRT14 2p25.3-p25.2.
rs876724-rs826015 - Rafiq et al., 2010
MRT15 9q34.3 rs11103117-rs12238423 - Rafiq et al., 2010
MRT16 9p23-p13.3 rs10738277-rs12376565 - Rafiq et al., 2010
MRT* 1p34.3-p33 rs724321-rs1934393
Moderate Kuss et al., 2010
MRT* 1p34.3-32.3 rs16825353- Moderate Kuss et al., 2010
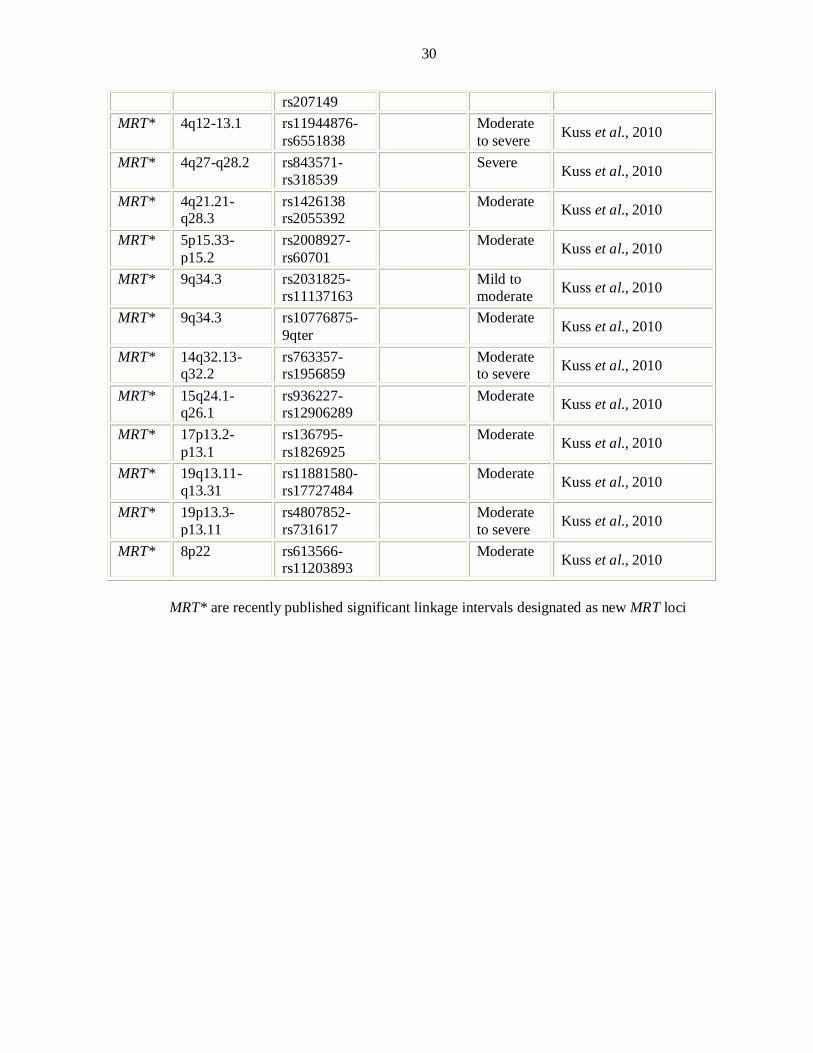
30
rs207149 MRT* 4q12-13.1 rs11944876-
rs6551838 Moderate
to severe Kuss et al., 2010
MRT* 4q27-q28.2 rs843571-rs318539
Severe Kuss et al., 2010
MRT* 4q21.21-q28.3
rs1426138 rs2055392
Moderate Kuss et al., 2010
MRT* 5p15.33-p15.2
rs2008927-rs60701
Moderate Kuss et al., 2010
MRT* 9q34.3 rs2031825-rs11137163
Mild to moderate Kuss et al., 2010
MRT* 9q34.3 rs10776875-9qter
Moderate Kuss et al., 2010
MRT* 14q32.13-q32.2
rs763357-rs1956859
Moderate to severe Kuss et al., 2010
MRT* 15q24.1-q26.1
rs936227-rs12906289
Moderate Kuss et al., 2010
MRT* 17p13.2-p13.1
rs136795- rs1826925
Moderate Kuss et al., 2010
MRT* 19q13.11-q13.31
rs11881580-rs17727484
Moderate Kuss et al., 2010
MRT* 19p13.3-p13.11
rs4807852-rs731617
Moderate to severe Kuss et al., 2010
MRT* 8p22 rs613566-rs11203893
Moderate Kuss et al., 2010
MRT* are recently published significant linkage intervals designated as new MRT loci
31
CHAPTER-III
“LINKAGE ANALYSIS” A KEY TOOL FOR
MAPPING DISEASE GENES
32
LINKAGE ANALYSIS
Linkage analysis is a powerful, family-based approach to disease mapping in human
pedigrees. Specific copies of the genomic region harboring the disease gene are co-
inherited with the disease within a family; this reflects lack of recombination between
the disease mutation and neighboring genetic markers, due to their close proximity.
Within a family, individuals who share a disease will typically share alleles at markers
near the disease gene. The particular alleles co-inherited with the disease often differ
between families, reflecting allelic heterogeneity or ancestral genetic recombination
events. Results of linkage analysis are reported as LOD scores representing the
relative likelihood that a disease locus and a genetic marker are genetically linked
(with a recombination fraction theta), rather than that they are genetically unlinked. A
LOD score of at least +3.0 is typically considered evidence of linkage and LOD score
of −2 or below excludes disease linkage to a region (Ott, 1991).
HOMOZYGOSITY MAPPING
Homozygosity mapping is a method for mapping the human genome, used to detect
genes that cause disease only when both copies in an individual are mutated. The
method takes advantage of the fact that inbred affected individuals are likely to have
two recessive copies of the disease allele from a common ancestor; i.e. two identical-
by-descent (IBD) alleles. Since small chromosomal regions tend to be transmitted as a
whole, affected individuals will also have identical-by-descent alleles at markers
located nearby the disease locus and thus will be homozygous at these markers. The
basic idea of the method to locate genes involved in rare recessive traits is thus to search
for regions of homozygosity that are shared by different affected individuals. The
mapping of genes involved in rare recessive disorders in large outbred population is
often a difficult task because of the lack of families with multiple affected individuals.
Homozygosity mapping is an efficient gene mapping method applicable to rare
recessive disorders in inbred populations.
Given the innate heterogeneity of the NSMR phenotypes, it is of little surprise
that its genetics are equally as complex. It is thought that rare variants are likely
responsible for most cases of NSMR, and this has been the focus of NSMR genetics for
33
some time, although association studies are still used to identify polymorphisms that
potentially contribute to the phenotype (e.g. SNAP25; Gosso et al. 2008).
All of the genes identified for autosomal recessive NSMR thus far have been
identified through microarray technology combined with homozygosity mapping using
large consanguineous families. Use of consanguineous multiplex families allows the
identification of these linkage regions with relative ease. The regions are then
confirmed by microsatellite analysis, and sequencing of genes within the region will
often lead to the identification of a disease gene. Consanguinity is marriage between
closely related individuals, and is common in many countries around the world,
particularly in the Middle East and Asia. In Pakistan—a country of 173 million
people—consanguineous unions make up 62.7% of marriages, and ~80% of which are
between first cousins, according to a national census (Hussain and Bittles 1998).
Multiply affected consanguineous families have been integral in determining autosomal
recessive causes of disease. The co-segregation of large stretches of homozygous alleles
only in affected family members in a consanguineous family increases the likelihood
that the region contains a gene that is relevant to the phenotype, and statistics in the
literature support this concept (Lander and Botstein 1987).
RECOMBINATION FRACTION
Alleles at loci on same chromosome for different genes co-segregate at a rate that is
associated to the physical distance between them on the chromosome. This rate is the
probability or recombination fraction (θ), of a recombination event occurring between
two loci. Two loci are said to be genetically linked when recombination fraction is
less than 0.5. One of these loci is the disease locus while the other is a polymorphic
marker like microsatellite repeats. The recombination fraction ranges from θ=0 for
loci right next to each other through θ = 0.5 for loci apart (or on different
chromosomes), so that it can be taken as a measure of the genetic distance or map
distance between gene loci. Two loci which show 1% recombination are defined as
being 1 centiMorgan (cM) apart on the genetic map, and a genetic distance of 1 cM
represents 0.9 Mb on the sex averaged physical map (Foroud, 1997).
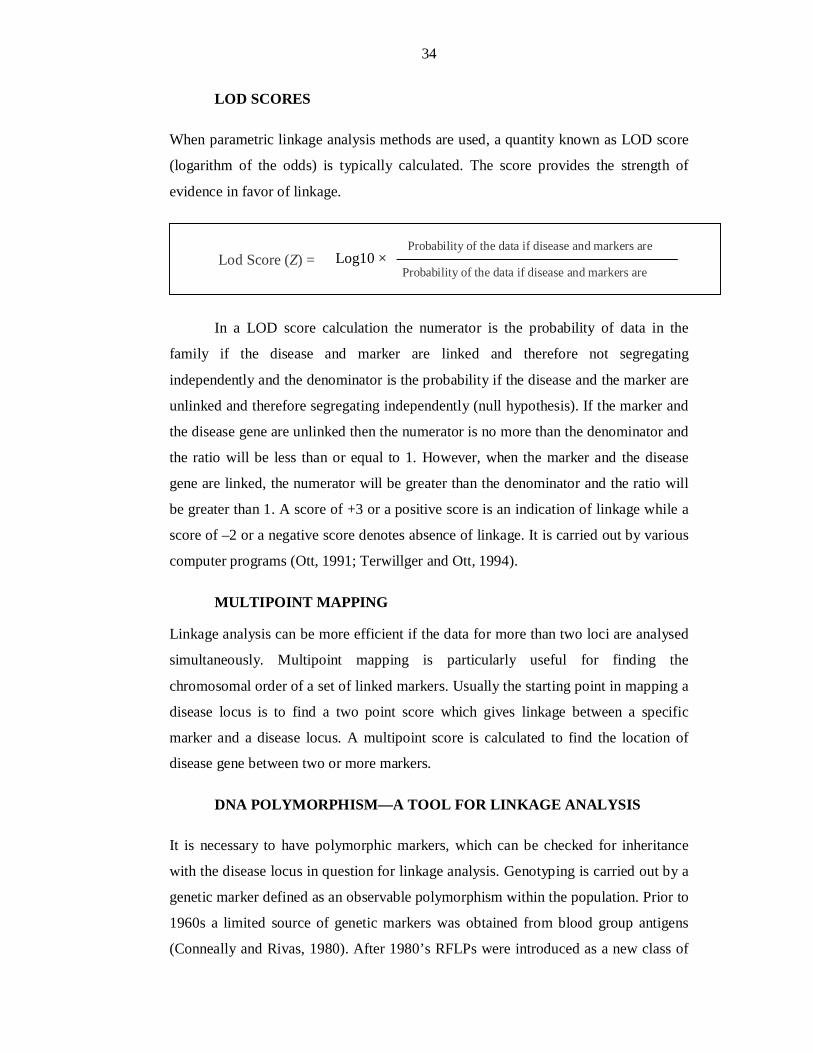
34
LOD SCORES
When parametric linkage analysis methods are used, a quantity known as LOD score
(logarithm of the odds) is typically calculated. The score provides the strength of
evidence in favor of linkage.
In a LOD score calculation the numerator is the probability of data in the
family if the disease and marker are linked and therefore not segregating
independently and the denominator is the probability if the disease and the marker are
unlinked and therefore segregating independently (null hypothesis). If the marker and
the disease gene are unlinked then the numerator is no more than the denominator and
the ratio will be less than or equal to 1. However, when the marker and the disease
gene are linked, the numerator will be greater than the denominator and the ratio will
be greater than 1. A score of +3 or a positive score is an indication of linkage while a
score of –2 or a negative score denotes absence of linkage. It is carried out by various
computer programs (Ott, 1991; Terwillger and Ott, 1994).
MULTIPOINT MAPPING
Linkage analysis can be more efficient if the data for more than two loci are analysed
simultaneously. Multipoint mapping is particularly useful for finding the
chromosomal order of a set of linked markers. Usually the starting point in mapping a
disease locus is to find a two point score which gives linkage between a specific
marker and a disease locus. A multipoint score is calculated to find the location of
disease gene between two or more markers.
DNA POLYMORPHISM—A TOOL FOR LINKAGE ANALYSIS
It is necessary to have polymorphic markers, which can be checked for inheritance
with the disease locus in question for linkage analysis. Genotyping is carried out by a
genetic marker defined as an observable polymorphism within the population. Prior to
1960s a limited source of genetic markers was obtained from blood group antigens
(Conneally and Rivas, 1980). After 1980’s RFLPs were introduced as a new class of
Lod Score (Z) = Probability of the data if disease and markers are
Probability of the data if disease and markers are Log10 ×
35
genetic markers (Botstein et al., 1980). The RFLPs detect genome sequence
differences that results in the presence or absence of a restriction enzyme cutting site.
Subsequently, VNTRs (Variable number of tandem repeats) and SSLPs (simple
sequence length polymorphism) were identified as a new source for genetic markers.
The most useful class of polymorphisms for the purpose of genomic screening and
fine genetic mapping are the SSLPs. The main advantage of SSLPs is there ubiquitous
presence across the genome and a small amount of DNA is required as compared to
RFLPs or VNTRs.
The simple sequence repeats also known as microsatellite, have revolutionized
the world of genotyping. STRs are hyper variable tandem sequence repeats which
consist of di-tri- or tetra-nucleotide repeats. The most widely used STRs to be
developed for genotyping are the simple (CA)n and (GT)n repeats. The (CA)n repeats
are extremely abundant and can be found, on average, once every 30-60 kb. (CA)n
repeats are generally polymorphic if the repeat length is greater than 10. By isolating
and sequencing DNA fragments containing the microsatellite, PCR primers that
flanked the STRs can be created and used to amplify it.

36
SECTION-2
MATERIALS AND METHODS
37
Study of the molecular characterization of congenital mental retardation in Pakistan
was divided into two phases:
1. Field work
Identification of families with two or more affected individuals with
mental retardation
Enrollment of identified families and collection of blood samples
Clinical assessment
2. Bench work
DNA Isolation
Linkage to reported autosomal recessive nonsyndromic MR loci
Genome wide scan to map new ARNSMR loci
Refinement of linkage interval & search of additional families
FIELD WORK
IDENTIFICATION AND ENROLLMENT OF FAMILIES
Families with two or more affected individuals were ascertained through the schools
and centers for special education from different cities of Pakistan.
Principals/incharges were contacted and briefed about the research program on mental
retardation and they were requested to distribute comprehensive performa to the
students to collect information about the history of mental retardation in the family.
The forms were designed to acquire preliminary information about the number of
affected individuals in the family of a student, the postal address and contact number.
After receiving feedbacks, the families were selected on the basis of number of
affected individuals and pattern of inheritance in a family. Disease history, detailed
pedigree drawing and level of the intellectual disability were ascertained by
personally visiting those families. Detailed history was taken from each family to
minimize the presence of other abnormalities and environmental causes for mental
retardation. Families were questioned about memory, learning and behavioral
problems of affected individuals. Other anomalies like skeletal problems and systemic
defects like thyroid, kidneys, heart dysfunction and infectious diseases, like
38
meningitis, antibiotic usage and injury; were discussed and noted. If a family had
other affected relatives with mental retardation, they were also included in the study
depending upon their willingness and availability. Multiple family members were
interviewed to construct the pedigrees and to confirm consanguineous sibships.
Pedigrees of the enrolled families were drawn using Cyrillic® program (Cyrillic for
Windows 3.1) and Macromedia® FreeHand® software.
CLINICAL EVALUATION
Detailed medical histories were obtained for all the individuals of the enrolled
families to minimize the presence of other abnormalities and environmental causes for
mental retardation.
Medical History and General Examination
The clinical history is the first step in investigation. The following points are
of particular importance.
Prenatal History:
Acute infection like German measles (rubella) or toxoplasmosis
Perinatal History:
Oxygen deficiency problem
Premature birth
Developmental history:
Age at sitting, crawling, walking or any other motor skills
Speech development or any speech difficulties
Performance in school
Appropriate social adjustment
Behavioral condition:
Epilepsy
Hypotonia
Aggressiveness

39
Autism
Family history:
Loss of mental functioning in siblings and family
General Examination:
General appearance, Health,
Height, Head circumference
Musculoskeletal, Neurological and systemic defects
MR Level:
Age of recognition of mental functioning disability
Severity of mental functioning disability (mild, moderate, severe, profound)
Level of memory and learning
ASSESSMENT OF IQ LEVEL
An intelligence quotient, or IQ, is a score derived from one of several different
standardized tests designed to assess intelligence. It measures intellectual capacity
based on oral language, vocabulary, numerical reasoning, memory, motor speed and
analysis skills. Stanford-Binet and Wechsler Intelligence Scale are used in world to
measure intellectual level. These scales have been developed into native language
with local psychologist. During enrolment of the affected families intellectual scores
were measured, try to cover all subtests. The test consists of subtests, not all subtests
are administered to each age group; but five subtests are administered to all age
levels.
These subtests are:
Vocabulary
Comprehension
Pattern Analysis
Quantitative
Memory
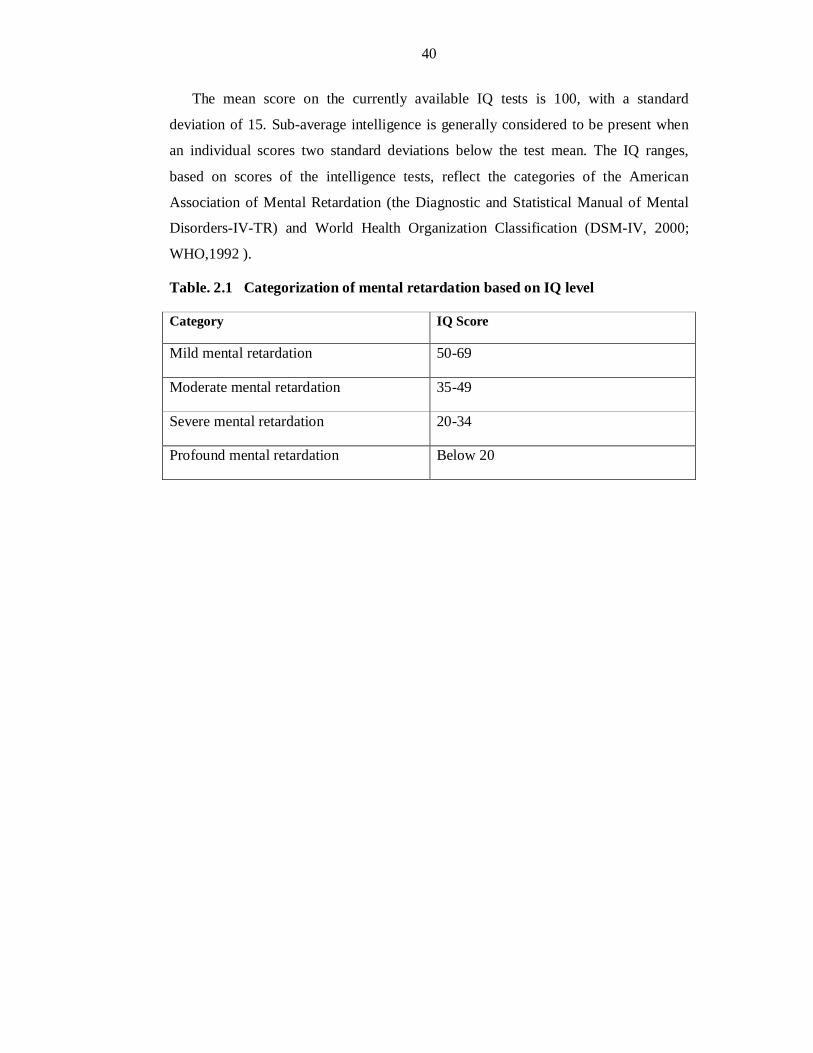
40
The mean score on the currently available IQ tests is 100, with a standard
deviation of 15. Sub-average intelligence is generally considered to be present when
an individual scores two standard deviations below the test mean. The IQ ranges,
based on scores of the intelligence tests, reflect the categories of the American
Association of Mental Retardation (the Diagnostic and Statistical Manual of Mental
Disorders-IV-TR) and World Health Organization Classification (DSM-IV, 2000;
WHO,1992 ).
Table. 2.1 Categorization of mental retardation based on IQ level
Category IQ Score
Mild mental retardation 50-69
Moderate mental retardation 35-49
Severe mental retardation 20-34
Profound mental retardation Below 20
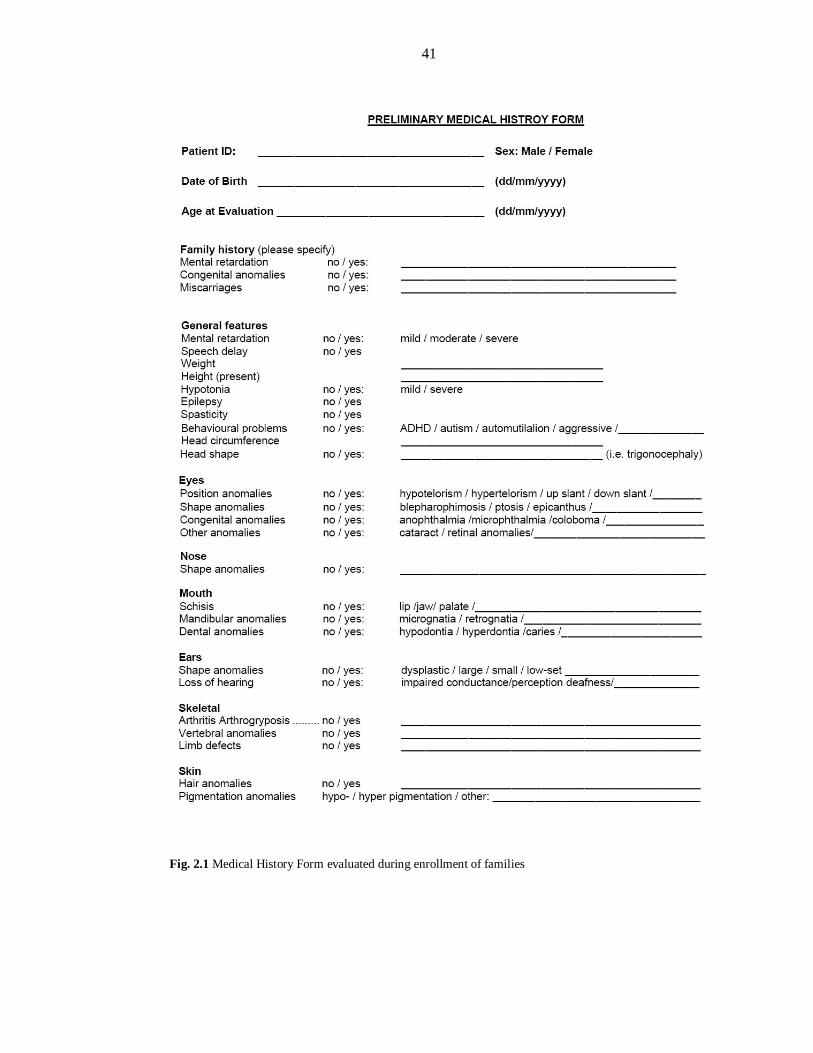
41
Fig. 2.1 Medical History Form evaluated during enrollment of families
42
LAB WORK
DNA EXTRACTION
From Blood Samples
10 ml of venous blood samples were collected in 50 ml Sterilin® falcon tubes already
containing 400 l of 0.5 M EDTA. Till the commencement of DNA extraction, blood
samples were kept frozen at -20°C. Genomic DNA was isolated from the blood
samples following a non-organic method (Grimberg et al., 1989).
Blood samples were thawed.
35 ml of TE buffer (10 mM Tris-Cl, 2 mM EDTA, pH 8.0) was added for
washing of blood samples. Samples were centrifuged at 3000 rpm for 20 min
and supernatant was discarded. Washing was repeated for three to four times
till the WBC pellet is free of hemoglobin.
Digestion of proteins in the pellets of WBC was carried out by adding 0.5 mg
of proteinase K along with 200 l of 10% SDS in the presence of 6 ml TNE
buffer (10 mM Tris-Cl, 400 mM NaCl and 2 mM EDTA,).
The samples were left overnight in an incubating shaker at 37oC and a speed
of 250 rpm.
Proteins were precipitated by adding 1 ml of saturated 6M NaCl, followed by
vigorous shaking and chilling on ice for 15 min before centrifugation at 3000
rpm for 20 minutes.
DNA was extracted from the supernatant by adding equal volume of
isopropanol.
After washing the DNA pellet with 70% ethanol, DNA was dissolved in 1.5
ml TE buffer (10 mM Tris, 0.2 mM EDTA) and heated at 70oC in a water bath
for 1 hr to inactivate remaining nucleases.
QUANTIFICATION OF DNA
Two methods were used for quantification of DNA.
1. Optical density measurements (Spectrophotometery)
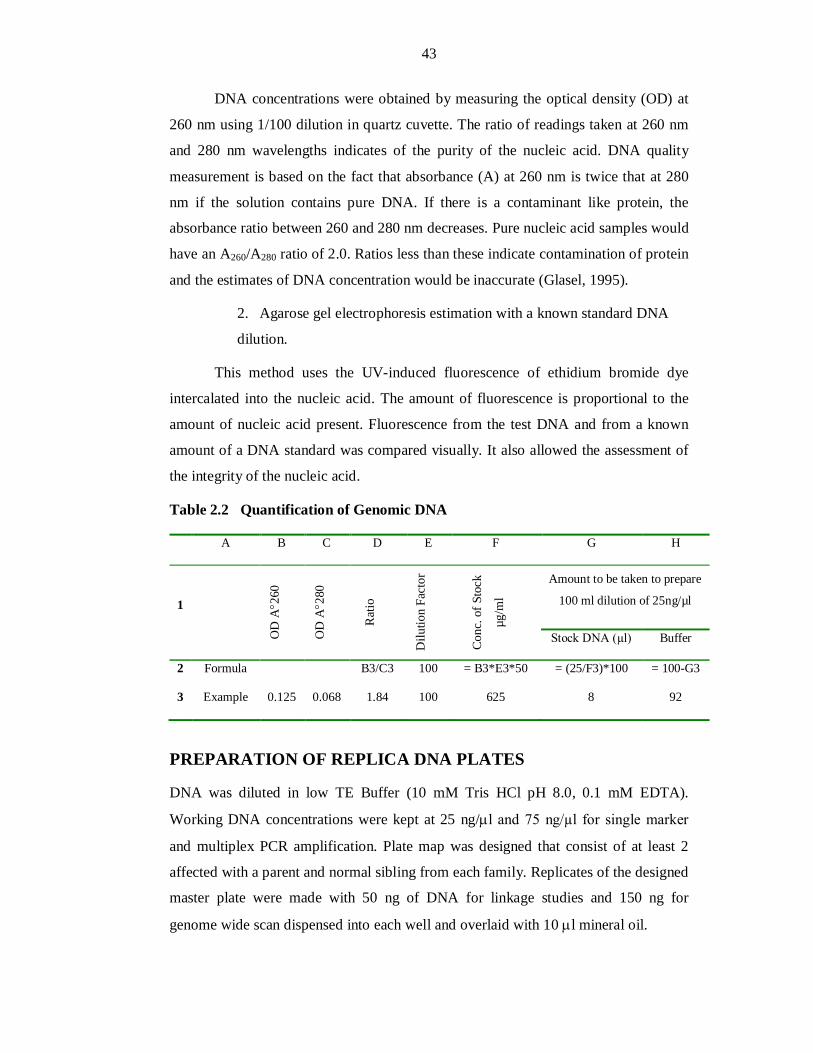
43
DNA concentrations were obtained by measuring the optical density (OD) at
260 nm using 1/100 dilution in quartz cuvette. The ratio of readings taken at 260 nm
and 280 nm wavelengths indicates of the purity of the nucleic acid. DNA quality
measurement is based on the fact that absorbance (A) at 260 nm is twice that at 280
nm if the solution contains pure DNA. If there is a contaminant like protein, the
absorbance ratio between 260 and 280 nm decreases. Pure nucleic acid samples would
have an A260/A280 ratio of 2.0. Ratios less than these indicate contamination of protein
and the estimates of DNA concentration would be inaccurate (Glasel, 1995).
2. Agarose gel electrophoresis estimation with a known standard DNA
dilution.
This method uses the UV-induced fluorescence of ethidium bromide dye
intercalated into the nucleic acid. The amount of fluorescence is proportional to the
amount of nucleic acid present. Fluorescence from the test DNA and from a known
amount of a DNA standard was compared visually. It also allowed the assessment of
the integrity of the nucleic acid.
Table 2.2 Quantification of Genomic DNA
A B C D E F G H
1
OD
A2
60
OD
A2
80
Rat
io
Dilu
tion
Fact
or
Con
c. o
f Sto
ck
µg/m
l
Amount to be taken to prepare
100 ml dilution of 25ng/µl
Stock DNA (µl) Buffer
2 Formula B3/C3 100 = B3*E3*50 = (25/F3)*100 = 100-G3
3 Example 0.125 0.068 1.84 100 625 8 92
PREPARATION OF REPLICA DNA PLATES
DNA was diluted in low TE Buffer (10 mM Tris HCl pH 8.0, 0.1 mM EDTA).
Working DNA concentrations were kept at 25 ng/l and 75 ng/µl for single marker
and multiplex PCR amplification. Plate map was designed that consist of at least 2
affected with a parent and normal sibling from each family. Replicates of the designed
master plate were made with 50 ng of DNA for linkage studies and 150 ng for
genome wide scan dispensed into each well and overlaid with 10 l mineral oil.
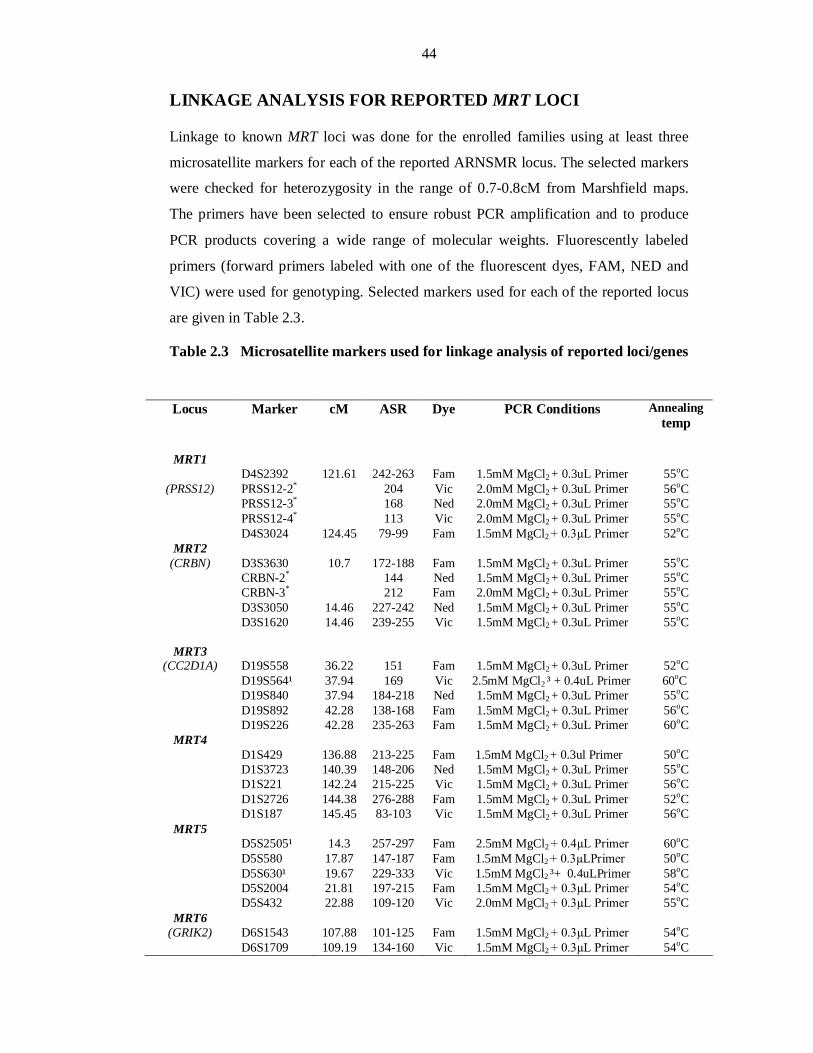
44
LINKAGE ANALYSIS FOR REPORTED MRT LOCI
Linkage to known MRT loci was done for the enrolled families using at least three
microsatellite markers for each of the reported ARNSMR locus. The selected markers
were checked for heterozygosity in the range of 0.7-0.8cM from Marshfield maps.
The primers have been selected to ensure robust PCR amplification and to produce
PCR products covering a wide range of molecular weights. Fluorescently labeled
primers (forward primers labeled with one of the fluorescent dyes, FAM, NED and
VIC) were used for genotyping. Selected markers used for each of the reported locus
are given in Table 2.3.
Table 2.3 Microsatellite markers used for linkage analysis of reported loci/genes
Locus Marker cM ASR Dye PCR Conditions Annealing temp
MRT1 D4S2392 121.61 242-263 Fam 1.5mM MgCl2 + 0.3uL Primer 55oC
(PRSS12) PRSS12-2* 204 Vic 2.0mM MgCl2 + 0.3uL Primer 56oC PRSS12-3* 168 Ned 2.0mM MgCl2 + 0.3uL Primer 55oC PRSS12-4* 113 Vic 2.0mM MgCl2 + 0.3uL Primer 55oC D4S3024 124.45 79-99 Fam 1.5mM MgCl2 + 0.3µL Primer 52oC
MRT2 (CRBN) D3S3630 10.7 172-188 Fam 1.5mM MgCl2 + 0.3uL Primer 55oC
CRBN-2* 144 Ned 1.5mM MgCl2 + 0.3uL Primer 55oC CRBN-3* 212 Fam 2.0mM MgCl2 + 0.3uL Primer 55oC D3S3050 14.46 227-242 Ned 1.5mM MgCl2 + 0.3uL Primer 55oC D3S1620 14.46 239-255 Vic 1.5mM MgCl2 + 0.3uL Primer 55oC
MRT3
(CC2D1A) D19S558 36.22 151 Fam 1.5mM MgCl2 + 0.3uL Primer 52oC D19S564¹ 37.94 169 Vic 2.5mM MgCl2 ³ + 0.4uL Primer 60oC D19S840 37.94 184-218 Ned 1.5mM MgCl2 + 0.3uL Primer 55oC D19S892 42.28 138-168 Fam 1.5mM MgCl2 + 0.3uL Primer 56oC D19S226 42.28 235-263 Fam 1.5mM MgCl2 + 0.3uL Primer 60oC
MRT4 D1S429 136.88 213-225 Fam 1.5mM MgCl2 + 0.3ul Primer 50oC D1S3723 140.39 148-206 Ned 1.5mM MgCl2 + 0.3uL Primer 55oC D1S221 142.24 215-225 Vic 1.5mM MgCl2 + 0.3uL Primer 56oC D1S2726 144.38 276-288 Fam 1.5mM MgCl2 + 0.3uL Primer 52oC D1S187 145.45 83-103 Vic 1.5mM MgCl2 + 0.3uL Primer 56oC
MRT5 D5S2505¹ 14.3 257-297 Fam 2.5mM MgCl2 + 0.4µL Primer 60oC D5S580 17.87 147-187 Fam 1.5mM MgCl2 + 0.3µLPrimer 50oC D5S630¹ 19.67 229-333 Vic 1.5mM MgCl2 ³+ 0.4uLPrimer 58oC D5S2004 21.81 197-215 Fam 1.5mM MgCl2 + 0.3µL Primer 54oC D5S432 22.88 109-120 Vic 2.0mM MgCl2 + 0.3µL Primer 55oC
MRT6 (GRIK2) D6S1543 107.88 101-125 Fam 1.5mM MgCl2 + 0.3µL Primer 54oC
D6S1709 109.19 134-160 Vic 1.5mM MgCl2 + 0.3µL Primer 54oC
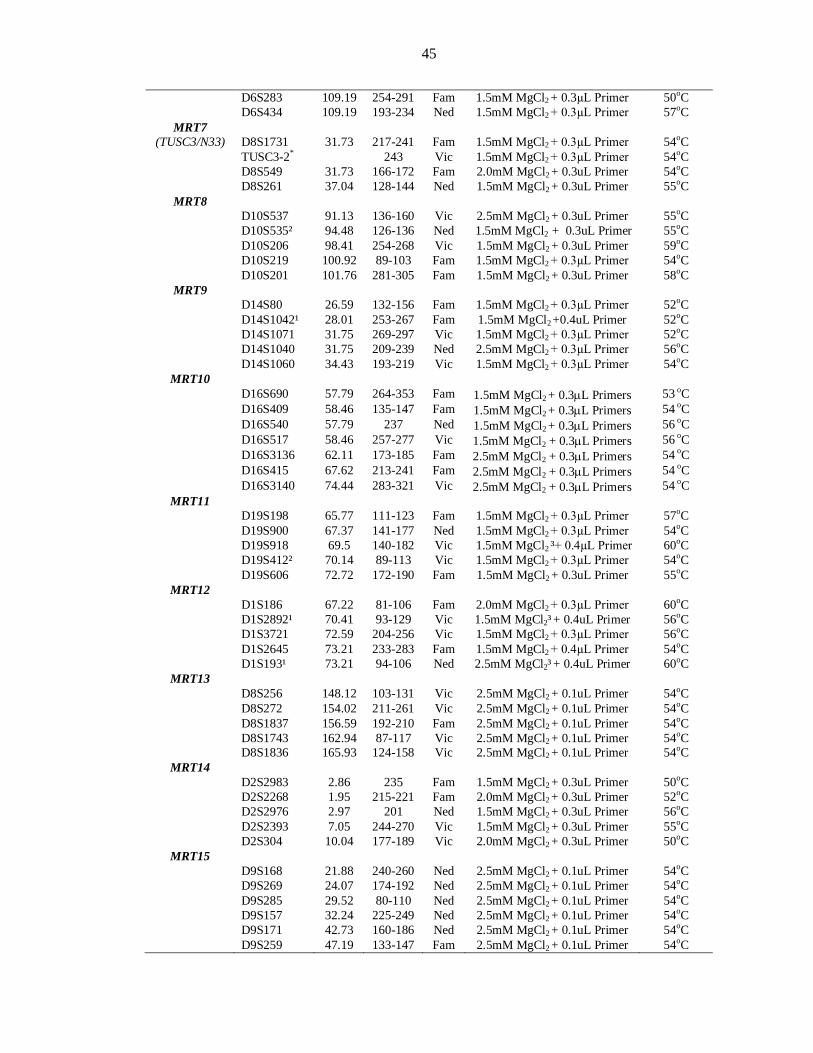
45
D6S283 109.19 254-291 Fam 1.5mM MgCl2 + 0.3µL Primer 50oC D6S434 109.19 193-234 Ned 1.5mM MgCl2 + 0.3µL Primer 57oC
MRT7 (TUSC3/N33) D8S1731 31.73 217-241 Fam 1.5mM MgCl2 + 0.3µL Primer 54oC
TUSC3-2* 243 Vic 1.5mM MgCl2 + 0.3µL Primer 54oC D8S549 31.73 166-172 Fam 2.0mM MgCl2 + 0.3uL Primer 54oC D8S261 37.04 128-144 Ned 1.5mM MgCl2 + 0.3uL Primer 55oC
MRT8 D10S537 91.13 136-160 Vic 2.5mM MgCl2 + 0.3uL Primer 55oC D10S535² 94.48 126-136 Ned 1.5mM MgCl2 + 0.3uL Primer 55oC D10S206 98.41 254-268 Vic 1.5mM MgCl2 + 0.3uL Primer 59oC D10S219 100.92 89-103 Fam 1.5mM MgCl2 + 0.3µL Primer 54oC D10S201 101.76 281-305 Fam 1.5mM MgCl2 + 0.3uL Primer 58oC
MRT9 D14S80 26.59 132-156 Fam 1.5mM MgCl2 + 0.3µL Primer 52oC D14S1042¹ 28.01 253-267 Fam 1.5mM MgCl2 +0.4uL Primer 52oC D14S1071 31.75 269-297 Vic 1.5mM MgCl2 + 0.3µL Primer 52oC D14S1040 31.75 209-239 Ned 2.5mM MgCl2 + 0.3µL Primer 56oC D14S1060 34.43 193-219 Vic 1.5mM MgCl2 + 0.3µL Primer 54oC
MRT10 D16S690 57.79 264-353 Fam 1.5mM MgCl2 + 0.3L Primers 53 oC D16S409 58.46 135-147 Fam 1.5mM MgCl2 + 0.3L Primers 54 oC D16S540 57.79 237 Ned 1.5mM MgCl2 + 0.3L Primers 56 oC D16S517 58.46 257-277 Vic 1.5mM MgCl2 + 0.3L Primers 56 oC D16S3136 62.11 173-185 Fam 2.5mM MgCl2 + 0.3L Primers 54 oC D16S415 67.62 213-241 Fam 2.5mM MgCl2 + 0.3L Primers 54 oC D16S3140 74.44 283-321 Vic 2.5mM MgCl2 + 0.3L Primers 54 oC
MRT11 D19S198 65.77 111-123 Fam 1.5mM MgCl2 + 0.3µL Primer 57oC D19S900 67.37 141-177 Ned 1.5mM MgCl2 + 0.3µL Primer 54oC D19S918 69.5 140-182 Vic 1.5mM MgCl2 ³+ 0.4µL Primer 60oC D19S412² 70.14 89-113 Vic 1.5mM MgCl2 + 0.3µL Primer 54oC D19S606 72.72 172-190 Fam 1.5mM MgCl2 + 0.3uL Primer 55oC
MRT12 D1S186 67.22 81-106 Fam 2.0mM MgCl2 + 0.3µL Primer 60oC D1S2892¹ 70.41 93-129 Vic 1.5mM MgCl2³ + 0.4uL Primer 56oC D1S3721 72.59 204-256 Vic 1.5mM MgCl2 + 0.3µL Primer 56oC D1S2645 73.21 233-283 Fam 1.5mM MgCl2 + 0.4µL Primer 54oC D1S193¹ 73.21 94-106 Ned 2.5mM MgCl2³ + 0.4uL Primer 60oC
MRT13 D8S256 148.12 103-131 Vic 2.5mM MgCl2 + 0.1uL Primer 54oC D8S272 154.02 211-261 Vic 2.5mM MgCl2 + 0.1uL Primer 54oC D8S1837 156.59 192-210 Fam 2.5mM MgCl2 + 0.1uL Primer 54oC D8S1743 162.94 87-117 Vic 2.5mM MgCl2 + 0.1uL Primer 54oC D8S1836 165.93 124-158 Vic 2.5mM MgCl2 + 0.1uL Primer 54oC
MRT14 D2S2983 2.86 235 Fam 1.5mM MgCl2 + 0.3uL Primer 50oC D2S2268 1.95 215-221 Fam 2.0mM MgCl2 + 0.3uL Primer 52oC D2S2976 2.97 201 Ned 1.5mM MgCl2 + 0.3uL Primer 56oC D2S2393 7.05 244-270 Vic 1.5mM MgCl2 + 0.3uL Primer 55oC D2S304 10.04 177-189 Vic 2.0mM MgCl2 + 0.3uL Primer 50oC
MRT15 D9S168 21.88 240-260 Ned 2.5mM MgCl2 + 0.1uL Primer 54oC D9S269 24.07 174-192 Ned 2.5mM MgCl2 + 0.1uL Primer 54oC D9S285 29.52 80-110 Ned 2.5mM MgCl2 + 0.1uL Primer 54oC D9S157 32.24 225-249 Ned 2.5mM MgCl2 + 0.1uL Primer 54oC D9S171 42.73 160-186 Ned 2.5mM MgCl2 + 0.1uL Primer 54oC D9S259 47.19 133-147 Fam 2.5mM MgCl2 + 0.1uL Primer 54oC
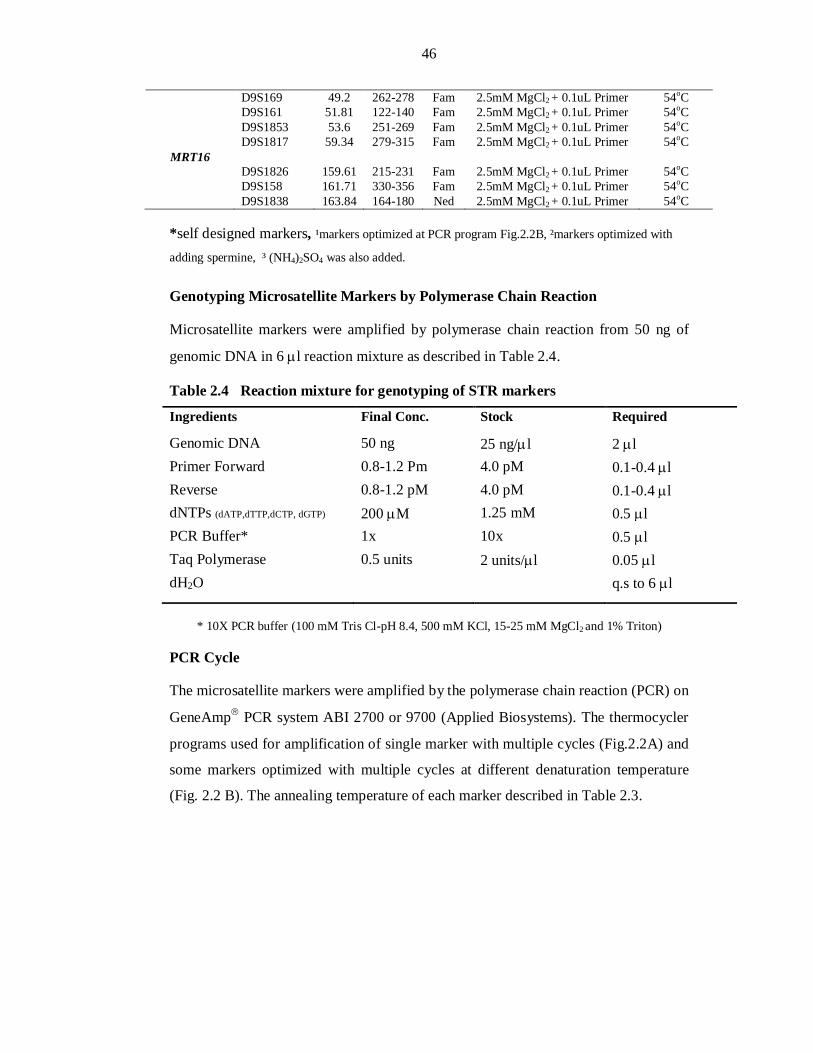
46
*self designed markers, ¹markers optimized at PCR program Fig.2.2B, ²markers optimized with
adding spermine, ³ (NH4)2SO4 was also added.
Genotyping Microsatellite Markers by Polymerase Chain Reaction
Microsatellite markers were amplified by polymerase chain reaction from 50 ng of
genomic DNA in 6 l reaction mixture as described in Table 2.4.
Table 2.4 Reaction mixture for genotyping of STR markers
Ingredients Final Conc. Stock Required
Genomic DNA 50 ng 25 ng/l 2 l Primer Forward 0.8-1.2 Pm 4.0 pM 0.1-0.4 l Reverse 0.8-1.2 pM 4.0 pM 0.1-0.4 l dNTPs (dATP,dTTP,dCTP, dGTP) 200 M 1.25 mM 0.5 l PCR Buffer* 1x 10x 0.5 l Taq Polymerase 0.5 units 2 units/l 0.05 l dH2O q.s to 6 l
* 10X PCR buffer (100 mM Tris Cl-pH 8.4, 500 mM KCl, 15-25 mM MgCl2 and 1% Triton)
PCR Cycle
The microsatellite markers were amplified by the polymerase chain reaction (PCR) on
GeneAmp PCR system ABI 2700 or 9700 (Applied Biosystems). The thermocycler
programs used for amplification of single marker with multiple cycles (Fig.2.2A) and
some markers optimized with multiple cycles at different denaturation temperature
(Fig. 2.2 B). The annealing temperature of each marker described in Table 2.3.
D9S169 49.2 262-278 Fam 2.5mM MgCl2 + 0.1uL Primer 54oC D9S161 51.81 122-140 Fam 2.5mM MgCl2 + 0.1uL Primer 54oC D9S1853 53.6 251-269 Fam 2.5mM MgCl2 + 0.1uL Primer 54oC D9S1817 59.34 279-315 Fam 2.5mM MgCl2 + 0.1uL Primer 54oC
MRT16 D9S1826 159.61 215-231 Fam 2.5mM MgCl2 + 0.1uL Primer 54oC D9S158 161.71 330-356 Fam 2.5mM MgCl2 + 0.1uL Primer 54oC D9S1838 163.84 164-180 Ned 2.5mM MgCl2 + 0.1uL Primer 54oC
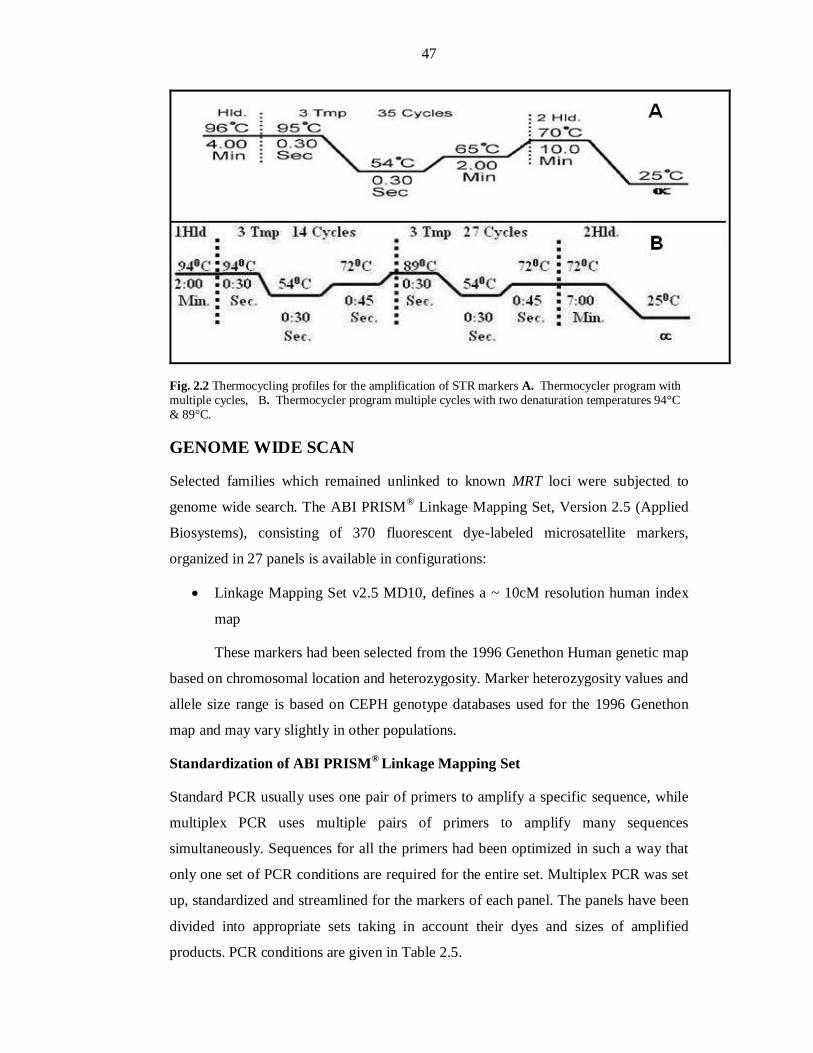
47
Fig. 2.2 Thermocycling profiles for the amplification of STR markers A. Thermocycler program with multiple cycles, B. Thermocycler program multiple cycles with two denaturation temperatures 94°C & 89°C.
GENOME WIDE SCAN
Selected families which remained unlinked to known MRT loci were subjected to
genome wide search. The ABI PRISM® Linkage Mapping Set, Version 2.5 (Applied
Biosystems), consisting of 370 fluorescent dye-labeled microsatellite markers,
organized in 27 panels is available in configurations:
Linkage Mapping Set v2.5 MD10, defines a ~ 10cM resolution human index
map
These markers had been selected from the 1996 Genethon Human genetic map
based on chromosomal location and heterozygosity. Marker heterozygosity values and
allele size range is based on CEPH genotype databases used for the 1996 Genethon
map and may vary slightly in other populations.
Standardization of ABI PRISM® Linkage Mapping Set
Standard PCR usually uses one pair of primers to amplify a specific sequence, while
multiplex PCR uses multiple pairs of primers to amplify many sequences
simultaneously. Sequences for all the primers had been optimized in such a way that
only one set of PCR conditions are required for the entire set. Multiplex PCR was set
up, standardized and streamlined for the markers of each panel. The panels have been
divided into appropriate sets taking in account their dyes and sizes of amplified
products. PCR conditions are given in Table 2.5.
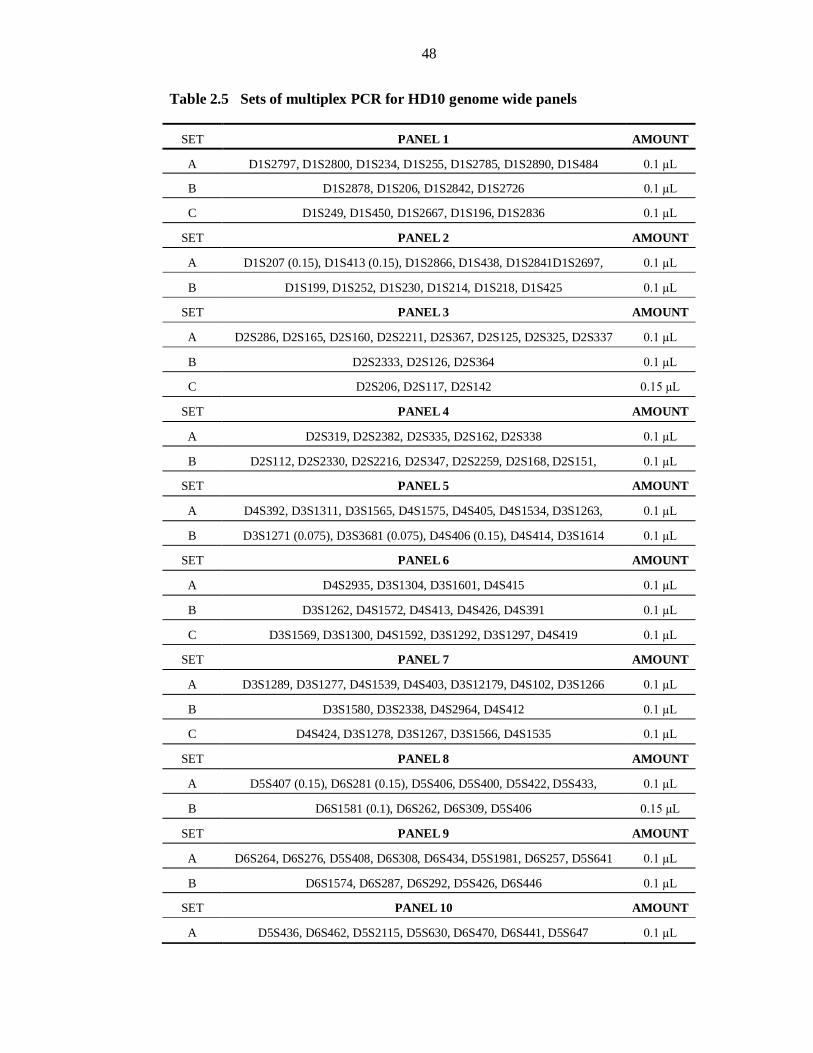
48
Table 2.5 Sets of multiplex PCR for HD10 genome wide panels
SET PANEL 1 AMOUNT
A D1S2797, D1S2800, D1S234, D1S255, D1S2785, D1S2890, D1S484 0.1 µL
B D1S2878, D1S206, D1S2842, D1S2726 0.1 µL
C D1S249, D1S450, D1S2667, D1S196, D1S2836 0.1 µL
SET PANEL 2 AMOUNT
A D1S207 (0.15), D1S413 (0.15), D1S2866, D1S438, D1S2841D1S2697, 0.1 µL
B D1S199, D1S252, D1S230, D1S214, D1S218, D1S425 0.1 µL
SET PANEL 3 AMOUNT
A D2S286, D2S165, D2S160, D2S2211, D2S367, D2S125, D2S325, D2S337 0.1 µL
B D2S2333, D2S126, D2S364 0.1 µL
C D2S206, D2S117, D2S142 0.15 µL
SET PANEL 4 AMOUNT
A D2S319, D2S2382, D2S335, D2S162, D2S338 0.1 µL
B D2S112, D2S2330, D2S2216, D2S347, D2S2259, D2S168, D2S151, 0.1 µL
SET PANEL 5 AMOUNT
A D4S392, D3S1311, D3S1565, D4S1575, D4S405, D4S1534, D3S1263, 0.1 µL
B D3S1271 (0.075), D3S3681 (0.075), D4S406 (0.15), D4S414, D3S1614 0.1 µL
SET PANEL 6 AMOUNT
A D4S2935, D3S1304, D3S1601, D4S415 0.1 µL
B D3S1262, D4S1572, D4S413, D4S426, D4S391 0.1 µL
C D3S1569, D3S1300, D4S1592, D3S1292, D3S1297, D4S419 0.1 µL
SET PANEL 7 AMOUNT
A D3S1289, D3S1277, D4S1539, D4S403, D3S12179, D4S102, D3S1266 0.1 µL
B D3S1580, D3S2338, D4S2964, D4S412 0.1 µL
C D4S424, D3S1278, D3S1267, D3S1566, D4S1535 0.1 µL
SET PANEL 8 AMOUNT
A D5S407 (0.15), D6S281 (0.15), D5S406, D5S400, D5S422, D5S433, 0.1 µL
B D6S1581 (0.1), D6S262, D6S309, D5S406 0.15 µL
SET PANEL 9 AMOUNT
A D6S264, D6S276, D5S408, D6S308, D6S434, D5S1981, D6S257, D5S641 0.1 µL
B D6S1574, D6S287, D6S292, D5S426, D6S446 0.1 µL
SET PANEL 10 AMOUNT
A D5S436, D6S462, D5S2115, D5S630, D6S470, D6S441, D5S647 0.1 µL
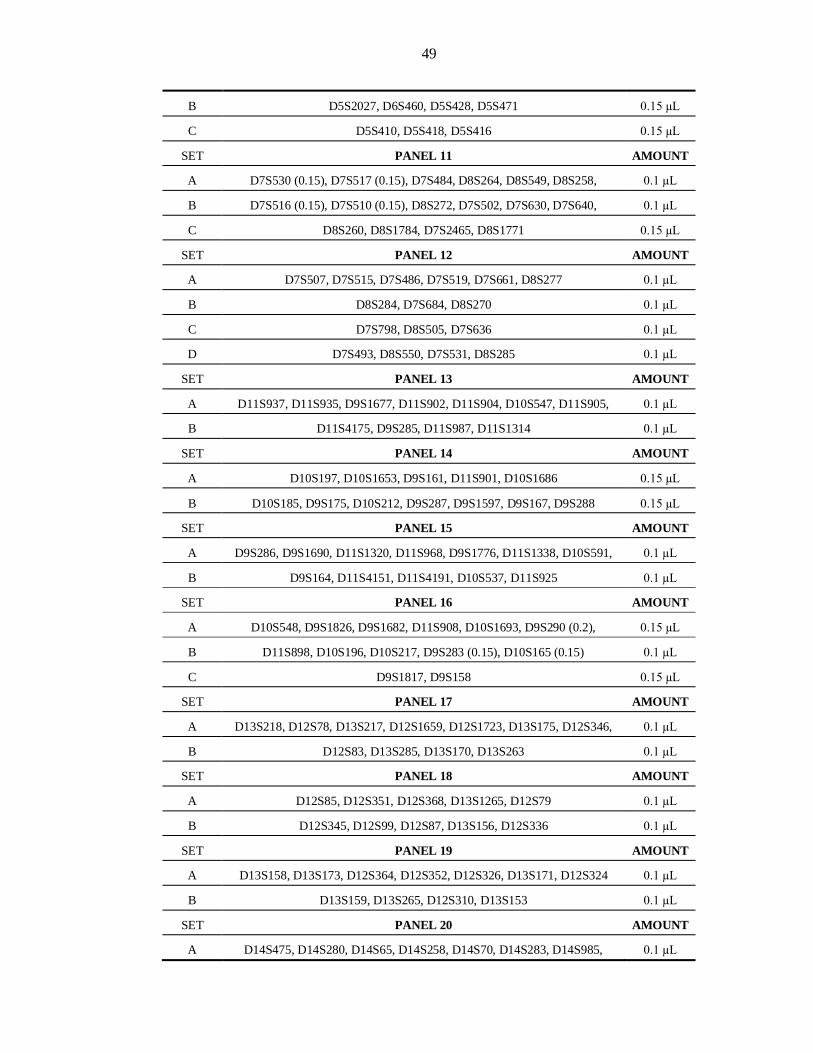
49
B D5S2027, D6S460, D5S428, D5S471 0.15 µL
C D5S410, D5S418, D5S416 0.15 µL
SET PANEL 11 AMOUNT
A D7S530 (0.15), D7S517 (0.15), D7S484, D8S264, D8S549, D8S258, 0.1 µL
B D7S516 (0.15), D7S510 (0.15), D8S272, D7S502, D7S630, D7S640, 0.1 µL
C D8S260, D8S1784, D7S2465, D8S1771 0.15 µL
SET PANEL 12 AMOUNT
A D7S507, D7S515, D7S486, D7S519, D7S661, D8S277 0.1 µL
B D8S284, D7S684, D8S270 0.1 µL
C D7S798, D8S505, D7S636 0.1 µL
D D7S493, D8S550, D7S531, D8S285 0.1 µL
SET PANEL 13 AMOUNT
A D11S937, D11S935, D9S1677, D11S902, D11S904, D10S547, D11S905, 0.1 µL
B D11S4175, D9S285, D11S987, D11S1314 0.1 µL
SET PANEL 14 AMOUNT
A D10S197, D10S1653, D9S161, D11S901, D10S1686 0.15 µL
B D10S185, D9S175, D10S212, D9S287, D9S1597, D9S167, D9S288 0.15 µL
SET PANEL 15 AMOUNT
A D9S286, D9S1690, D11S1320, D11S968, D9S1776, D11S1338, D10S591, 0.1 µL
B D9S164, D11S4151, D11S4191, D10S537, D11S925 0.1 µL
SET PANEL 16 AMOUNT
A D10S548, D9S1826, D9S1682, D11S908, D10S1693, D9S290 (0.2), 0.15 µL
B D11S898, D10S196, D10S217, D9S283 (0.15), D10S165 (0.15) 0.1 µL
C D9S1817, D9S158 0.15 µL
SET PANEL 17 AMOUNT
A D13S218, D12S78, D13S217, D12S1659, D12S1723, D13S175, D12S346, 0.1 µL
B D12S83, D13S285, D13S170, D13S263 0.1 µL
SET PANEL 18 AMOUNT
A D12S85, D12S351, D12S368, D13S1265, D12S79 0.1 µL
B D12S345, D12S99, D12S87, D13S156, D12S336 0.1 µL
SET PANEL 19 AMOUNT
A D13S158, D13S173, D12S364, D12S352, D12S326, D13S171, D12S324 0.1 µL
B D13S159, D13S265, D12S310, D13S153 0.1 µL
SET PANEL 20 AMOUNT
A D14S475, D14S280, D14S65, D14S258, D14S70, D14S283, D14S985, 0.1 µL
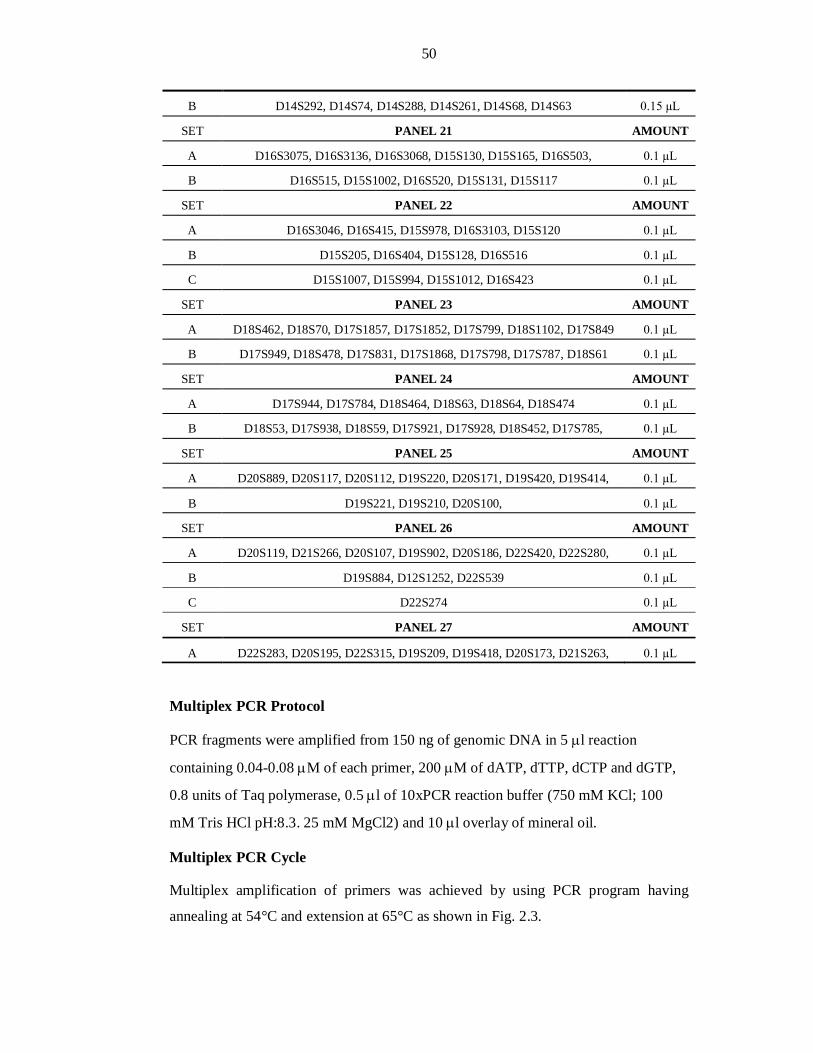
50
B D14S292, D14S74, D14S288, D14S261, D14S68, D14S63 0.15 µL
SET PANEL 21 AMOUNT
A D16S3075, D16S3136, D16S3068, D15S130, D15S165, D16S503, 0.1 µL
B D16S515, D15S1002, D16S520, D15S131, D15S117 0.1 µL
SET PANEL 22 AMOUNT
A D16S3046, D16S415, D15S978, D16S3103, D15S120 0.1 µL
B D15S205, D16S404, D15S128, D16S516 0.1 µL
C D15S1007, D15S994, D15S1012, D16S423 0.1 µL
SET PANEL 23 AMOUNT
A D18S462, D18S70, D17S1857, D17S1852, D17S799, D18S1102, D17S849 0.1 µL
B D17S949, D18S478, D17S831, D17S1868, D17S798, D17S787, D18S61 0.1 µL
SET PANEL 24 AMOUNT
A D17S944, D17S784, D18S464, D18S63, D18S64, D18S474 0.1 µL
B D18S53, D17S938, D18S59, D17S921, D17S928, D18S452, D17S785, 0.1 µL
SET PANEL 25 AMOUNT
A D20S889, D20S117, D20S112, D19S220, D20S171, D19S420, D19S414, 0.1 µL
B D19S221, D19S210, D20S100, 0.1 µL
SET PANEL 26 AMOUNT
A D20S119, D21S266, D20S107, D19S902, D20S186, D22S420, D22S280, 0.1 µL
B D19S884, D12S1252, D22S539 0.1 µL
C D22S274 0.1 µL
SET PANEL 27 AMOUNT
A D22S283, D20S195, D22S315, D19S209, D19S418, D20S173, D21S263, 0.1 µL
Multiplex PCR Protocol
PCR fragments were amplified from 150 ng of genomic DNA in 5 l reaction
containing 0.04-0.08 M of each primer, 200 M of dATP, dTTP, dCTP and dGTP,
0.8 units of Taq polymerase, 0.5 l of 10xPCR reaction buffer (750 mM KCl; 100
mM Tris HCl pH:8.3. 25 mM MgCl2) and 10 l overlay of mineral oil.
Multiplex PCR Cycle
Multiplex amplification of primers was achieved by using PCR program having
annealing at 54°C and extension at 65°C as shown in Fig. 2.3.
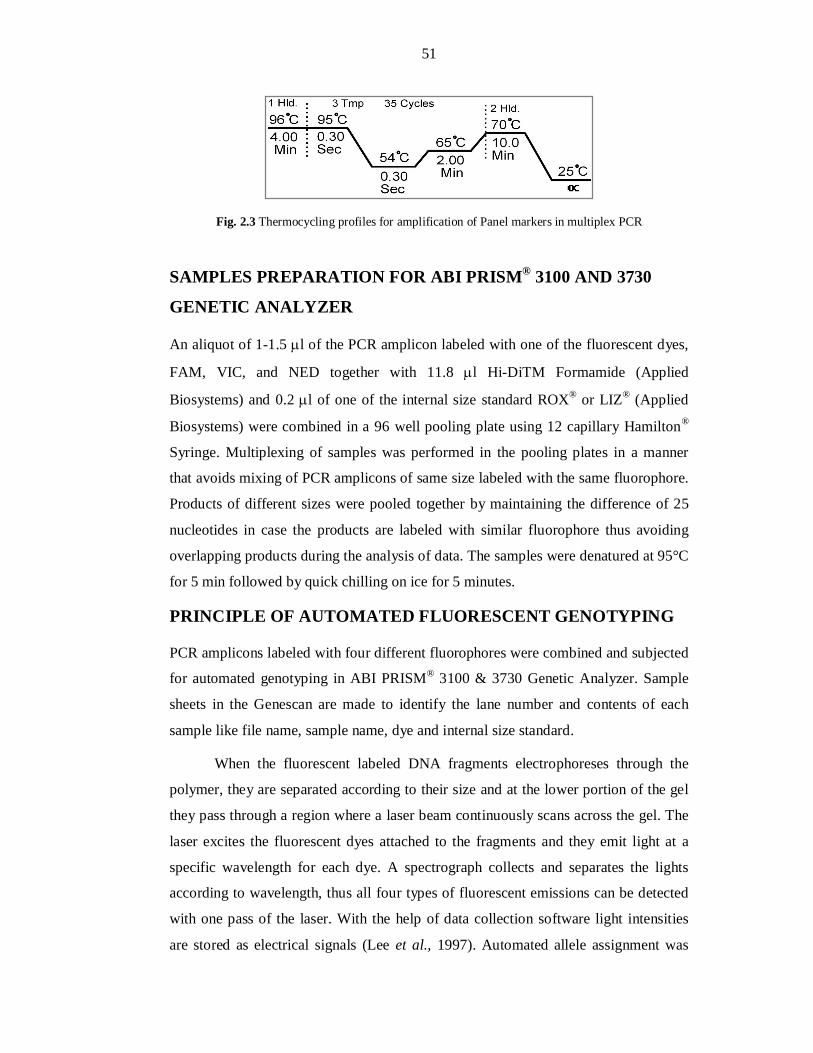
51
Fig. 2.3 Thermocycling profiles for amplification of Panel markers in multiplex PCR
SAMPLES PREPARATION FOR ABI PRISM® 3100 AND 3730
GENETIC ANALYZER
An aliquot of 1-1.5 l of the PCR amplicon labeled with one of the fluorescent dyes,
FAM, VIC, and NED together with 11.8 l Hi-DiTM Formamide (Applied
Biosystems) and 0.2 l of one of the internal size standard ROX® or LIZ® (Applied
Biosystems) were combined in a 96 well pooling plate using 12 capillary Hamilton®
Syringe. Multiplexing of samples was performed in the pooling plates in a manner
that avoids mixing of PCR amplicons of same size labeled with the same fluorophore.
Products of different sizes were pooled together by maintaining the difference of 25
nucleotides in case the products are labeled with similar fluorophore thus avoiding
overlapping products during the analysis of data. The samples were denatured at 95°C
for 5 min followed by quick chilling on ice for 5 minutes.
PRINCIPLE OF AUTOMATED FLUORESCENT GENOTYPING
PCR amplicons labeled with four different fluorophores were combined and subjected
for automated genotyping in ABI PRISM® 3100 & 3730 Genetic Analyzer. Sample
sheets in the Genescan are made to identify the lane number and contents of each
sample like file name, sample name, dye and internal size standard.
When the fluorescent labeled DNA fragments electrophoreses through the
polymer, they are separated according to their size and at the lower portion of the gel
they pass through a region where a laser beam continuously scans across the gel. The
laser excites the fluorescent dyes attached to the fragments and they emit light at a
specific wavelength for each dye. A spectrograph collects and separates the lights
according to wavelength, thus all four types of fluorescent emissions can be detected
with one pass of the laser. With the help of data collection software light intensities
are stored as electrical signals (Lee et al., 1997). Automated allele assignment was
52
performed using the Genescan analysis and Genotyper 3.7 NT software (Applied
Biosystem). The Genescan analysis software uses the automated fluorescent detection
capability of the ABI genetic analysis instrument to size and quantitate DNA
fragments and displays the result of the experiment as a reconstructed gel image,
electropherogram or tabular data or a combination of electropherogram and
corresponding tabular data. The Genotyper import Genescan sample files and
converts data from Genescan files into user application results. Genotypic results
include dye color, sample fragments with identifying labels, quantitative data, sample
information and comments (Fig. 2.4). The Genotyper software also screens out peaks
resulting from PCR related artifacts fragments detected during electrophoresis. The
Genotyper results are transferred to data spread sheets for haplotype and statistical
analyses.
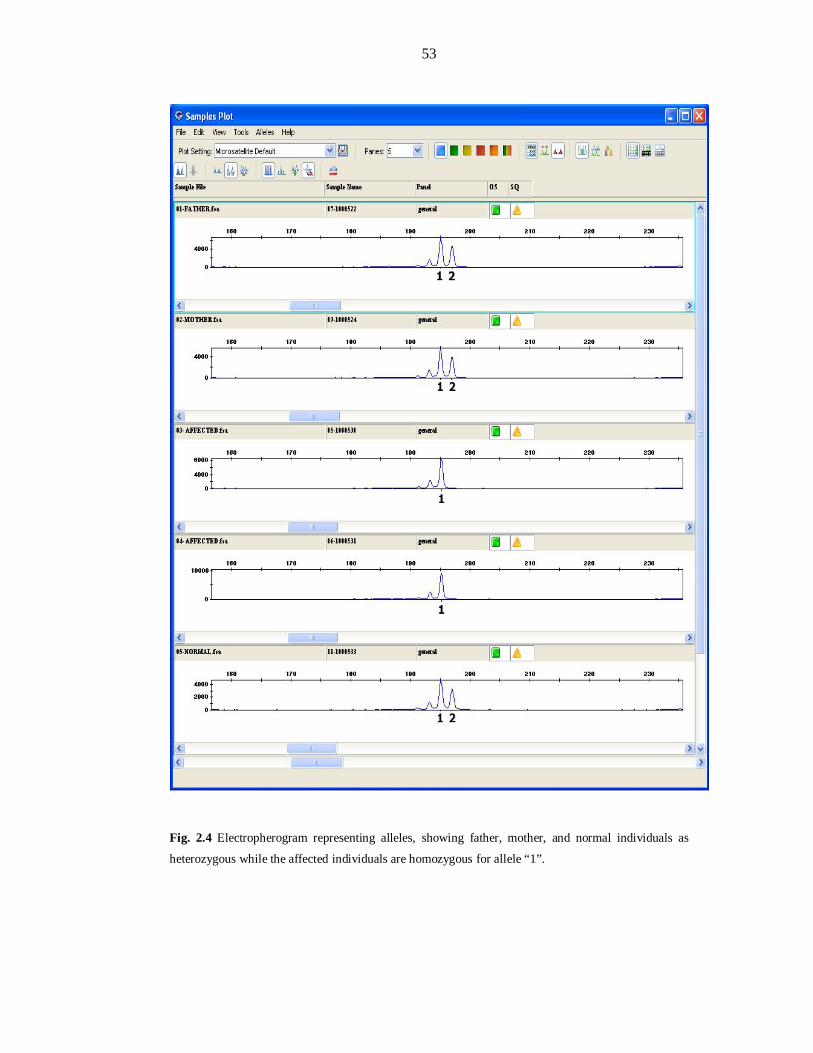
53
Fig. 2.4 Electropherogram representing alleles, showing father, mother, and normal individuals as
heterozygous while the affected individuals are homozygous for allele “1”.
54
HAPLOTYPE ANALYSIS
A haplotype representing an individual’s chromosomal segment is the set of
genotyped alleles arranged according to the cM distance along a chromosome. Alleles
were arranged in ways that confirm the inheritance pattern of segregating disease.
Linkage to a particular locus was confirmed when homozygous data of affected
members correlates with the disease pattern in the family tree.
DATA ORGANIZATION TO PERFORM LOD SCORE
CALCULATION
The Microsoft Excel based macros was specially developed by Bioinformatics Lab,
CEMB. The macros consist of different modules. Different excel sheets are named:
Data Sheet, Ranges Sheet, Basic Information Sheet, and Code Sheet and help in
integrating different excel sheets to analyze data.
Data Sheet
The Data sheet is the primary sheet in which the records of size of alleles after
genotyping were entered. It contained the following information: Panel ID, Marker’s
name, cM distance, Labeling dye, ASR, Person name and its ID from the pedigree,
Disease status/relation. Markers were listed column wise while individuals were
arranged horizontally and per individual 2 columns were assigned for the set of alleles
as shown in Fig. 2.5
Ranges Sheet
The data entered in the data sheet was subjected to different analysis parameters by
using different modules of the macro, like Parentage, Coloring, Coding, and Filing.
To run a specific module, ranges i.e. specific number of column and rows were given
in the ranges sheet.
The Macros of the Software
Data sheet and the Ranges sheet act as a backbone to run different modules of
software. To run the macros, click “Tools” on the Menubar, select Macro, and then
Macros (Alt+F8). A window with the list of modules was opened; the relevant
module was selected and Run command given. The whole procedure is depicted
below in Fig. 2.5.
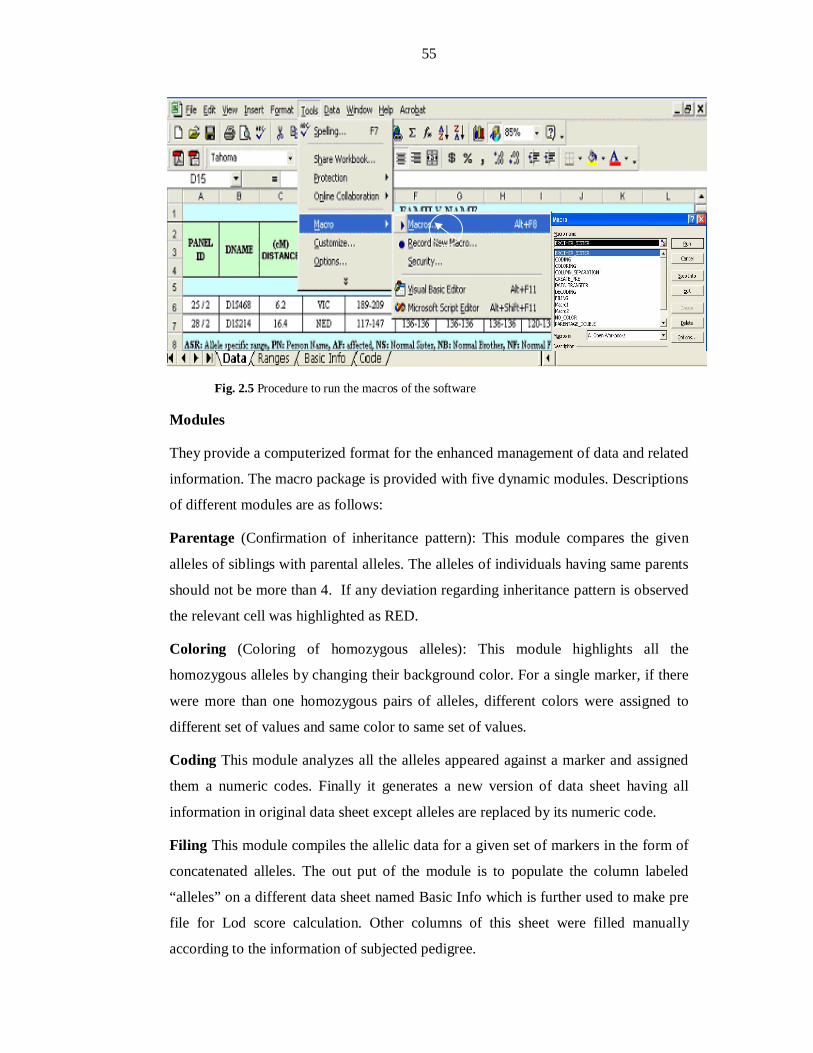
55
Fig. 2.5 Procedure to run the macros of the software
Modules
They provide a computerized format for the enhanced management of data and related
information. The macro package is provided with five dynamic modules. Descriptions
of different modules are as follows:
Parentage (Confirmation of inheritance pattern): This module compares the given
alleles of siblings with parental alleles. The alleles of individuals having same parents
should not be more than 4. If any deviation regarding inheritance pattern is observed
the relevant cell was highlighted as RED.
Coloring (Coloring of homozygous alleles): This module highlights all the
homozygous alleles by changing their background color. For a single marker, if there
were more than one homozygous pairs of alleles, different colors were assigned to
different set of values and same color to same set of values.
Coding This module analyzes all the alleles appeared against a marker and assigned
them a numeric codes. Finally it generates a new version of data sheet having all
information in original data sheet except alleles are replaced by its numeric code.
Filing This module compiles the allelic data for a given set of markers in the form of
concatenated alleles. The out put of the module is to populate the column labeled
“alleles” on a different data sheet named Basic Info which is further used to make pre
file for Lod score calculation. Other columns of this sheet were filled manually
according to the information of subjected pedigree.
56
Create_PRE: This module picks the data from “Basic Info” sheet; arrange it in a
specific pattern recommended by Linkage software and saves in a text-formatted file
with a “pre” extension. This pre file is used as starting point while calculating LOD
Scores.
LOD SCORE CALCULATIONS
LOD scores represent the most efficient statistical proof of evaluating pedigrees for
linkage. Lod scores were calculated using FASTLINK (v4.1p), a DOS based software
package (Schaffer et al., 1996). Two point and multipoint lod scores were calculated
with MLINK and LINKMAP programs respectively (Terwillger and Ott, 1994).
Mental retardation was assumed to be inherited in an autosomal recessive manner
with complete penetrance. Recombination frequencies were assumed to be equal in
both males and females. Genetic distances were based on Marshfield human genetic
map.
PRE FILE is a simple notepad file containing information regarding family structure,
affection status and sex of individuals along with their genotypic data for one or more
than one marker.
PED FILE A file in which the information about the consanguineous marriages/loops
in the family is entered. The loops are broken with the help of a program named
MAKEPED so that the program doesn’t revolve in enclosed circle. As the result the
program makes double entry of those individuals from where the loops were broken
and make a .Ped file.
DAT FILE This file is make with a help of program named PREPLINK, and
contains the allele frequency of each marker for which LOD score is to be calculated.
The frequency of MR alleles were estimated by genotyping the genomic DNA from
100 unrelated Pakistani subjects. Some time, the allele frequencies were considered
equal, according to the data of family or 10 alleles with equal frequency of 0.1 were
assumed to make total sum equals to 1.0.
LCP is a linkage control program which takes .ped and .dat files as input files and
generates pedin batch file which is then executed and file with default name as
Final.out is made.
57
FAM2PD PROGRAM This program reads the Final.out file and gives a text file of
LOD score in notepad file format.
Designing of Microsoft Excel based Visual Basic ‘Macros’ for “EasyLinkage”
software
‘Macro’ is a set of instructions to perform various tasks. Mirosoft Office based
macros’ are recorded in Visual Basic Script. Three macros were recorded for working
with EasyLinkage GUI software package. EasyLinkage require two types of input
files:
1. Pedigree information file [*.pro]
2. Marker information file(s) [*.abi]
The details of recorded macros are as under:
Create_pro
This macro convert the Microsoft Excel raw family data into *.pro file that contains
the necessary information about the pedigree. This file contains five data columns
containing pedigree ID, individual ID, father ID, mother ID, sex, and disease status
respectively. Such *.pro file is used as input pedigree information file for
EasyLinkage software.
Create_abi_singal_marker
This macro converts the genotype data against a single STR marker to make marker
information file (*.abi).
Create_abi_multiple_markers
This macro converts the genotype data against multiple STR marker to make multiple
marker information files (*.abi) accordingly.

58
SECTION-3
RESULTS AND DISCUSSION
59
CHAPTER-I
LINKAGE ANALYSIS OF REPORTED
RECESSIVE MENTAL RETERDATION
(MRT) LOCI
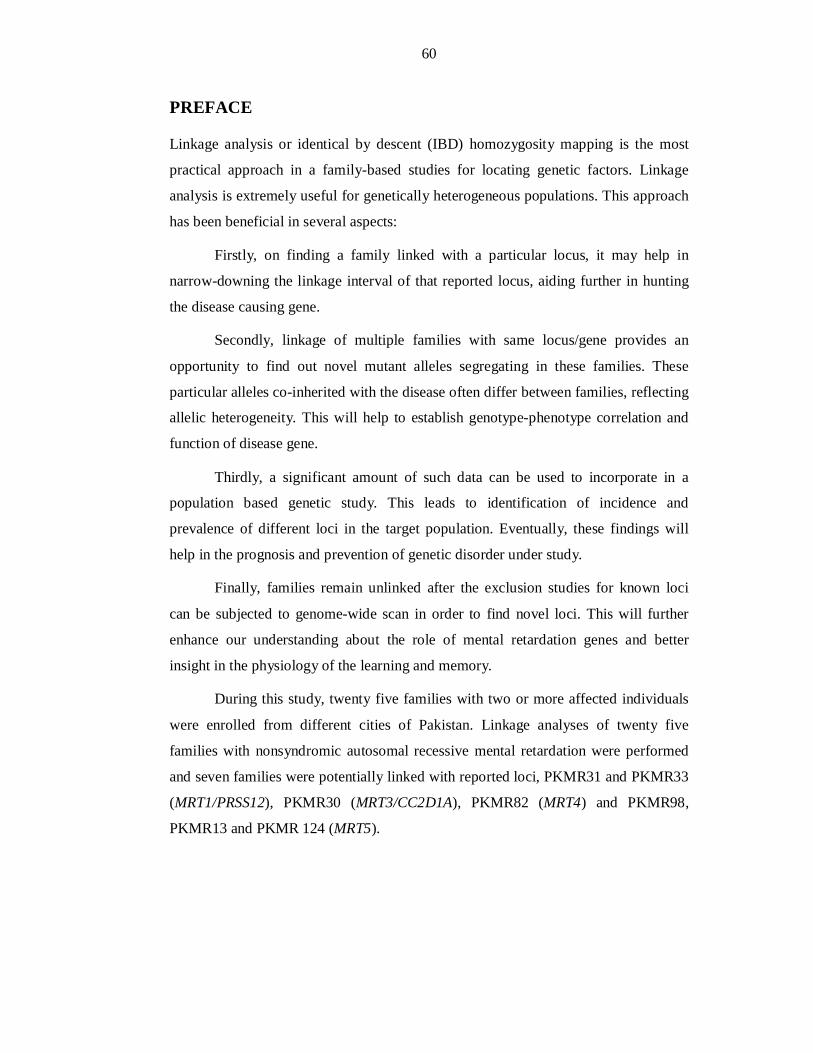
60
PREFACE
Linkage analysis or identical by descent (IBD) homozygosity mapping is the most
practical approach in a family-based studies for locating genetic factors. Linkage
analysis is extremely useful for genetically heterogeneous populations. This approach
has been beneficial in several aspects:
Firstly, on finding a family linked with a particular locus, it may help in
narrow-downing the linkage interval of that reported locus, aiding further in hunting
the disease causing gene.
Secondly, linkage of multiple families with same locus/gene provides an
opportunity to find out novel mutant alleles segregating in these families. These
particular alleles co-inherited with the disease often differ between families, reflecting
allelic heterogeneity. This will help to establish genotype-phenotype correlation and
function of disease gene.
Thirdly, a significant amount of such data can be used to incorporate in a
population based genetic study. This leads to identification of incidence and
prevalence of different loci in the target population. Eventually, these findings will
help in the prognosis and prevention of genetic disorder under study.
Finally, families remain unlinked after the exclusion studies for known loci
can be subjected to genome-wide scan in order to find novel loci. This will further
enhance our understanding about the role of mental retardation genes and better
insight in the physiology of the learning and memory.
During this study, twenty five families with two or more affected individuals
were enrolled from different cities of Pakistan. Linkage analyses of twenty five
families with nonsyndromic autosomal recessive mental retardation were performed
and seven families were potentially linked with reported loci, PKMR31 and PKMR33
(MRT1/PRSS12), PKMR30 (MRT3/CC2D1A), PKMR82 (MRT4) and PKMR98,
PKMR13 and PKMR 124 (MRT5).
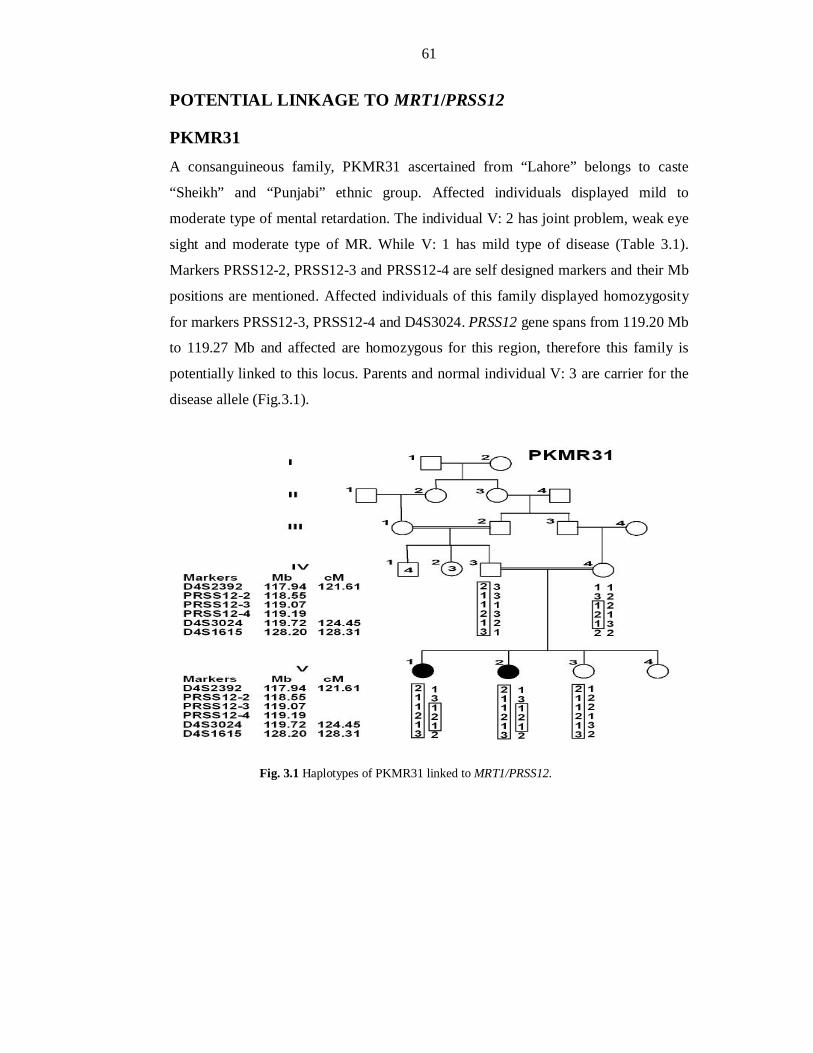
61
POTENTIAL LINKAGE TO MRT1/PRSS12
PKMR31 A consanguineous family, PKMR31 ascertained from “Lahore” belongs to caste
“Sheikh” and “Punjabi” ethnic group. Affected individuals displayed mild to
moderate type of mental retardation. The individual V: 2 has joint problem, weak eye
sight and moderate type of MR. While V: 1 has mild type of disease (Table 3.1).
Markers PRSS12-2, PRSS12-3 and PRSS12-4 are self designed markers and their Mb
positions are mentioned. Affected individuals of this family displayed homozygosity
for markers PRSS12-3, PRSS12-4 and D4S3024. PRSS12 gene spans from 119.20 Mb
to 119.27 Mb and affected are homozygous for this region, therefore this family is
potentially linked to this locus. Parents and normal individual V: 3 are carrier for the
disease allele (Fig.3.1).
Fig. 3.1 Haplotypes of PKMR31 linked to MRT1/PRSS12.
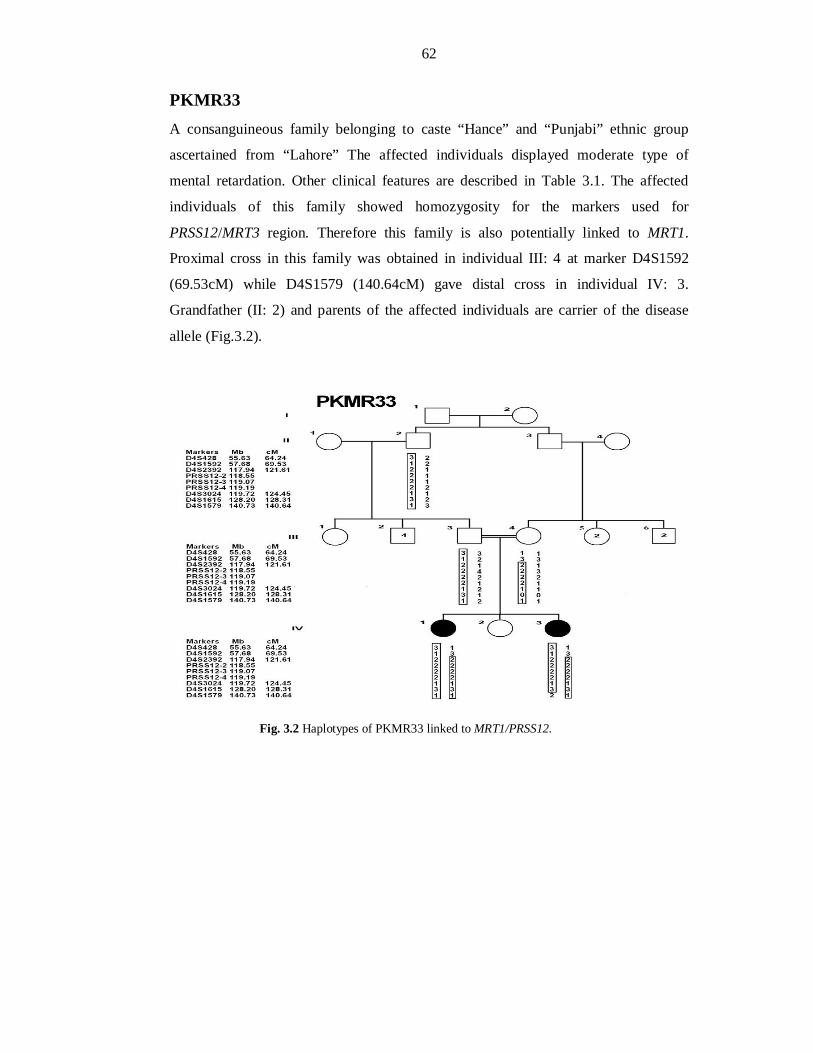
62
PKMR33 A consanguineous family belonging to caste “Hance” and “Punjabi” ethnic group
ascertained from “Lahore” The affected individuals displayed moderate type of
mental retardation. Other clinical features are described in Table 3.1. The affected
individuals of this family showed homozygosity for the markers used for
PRSS12/MRT3 region. Therefore this family is also potentially linked to MRT1.
Proximal cross in this family was obtained in individual III: 4 at marker D4S1592
(69.53cM) while D4S1579 (140.64cM) gave distal cross in individual IV: 3.
Grandfather (II: 2) and parents of the affected individuals are carrier of the disease
allele (Fig.3.2).
Fig. 3.2 Haplotypes of PKMR33 linked to MRT1/PRSS12.
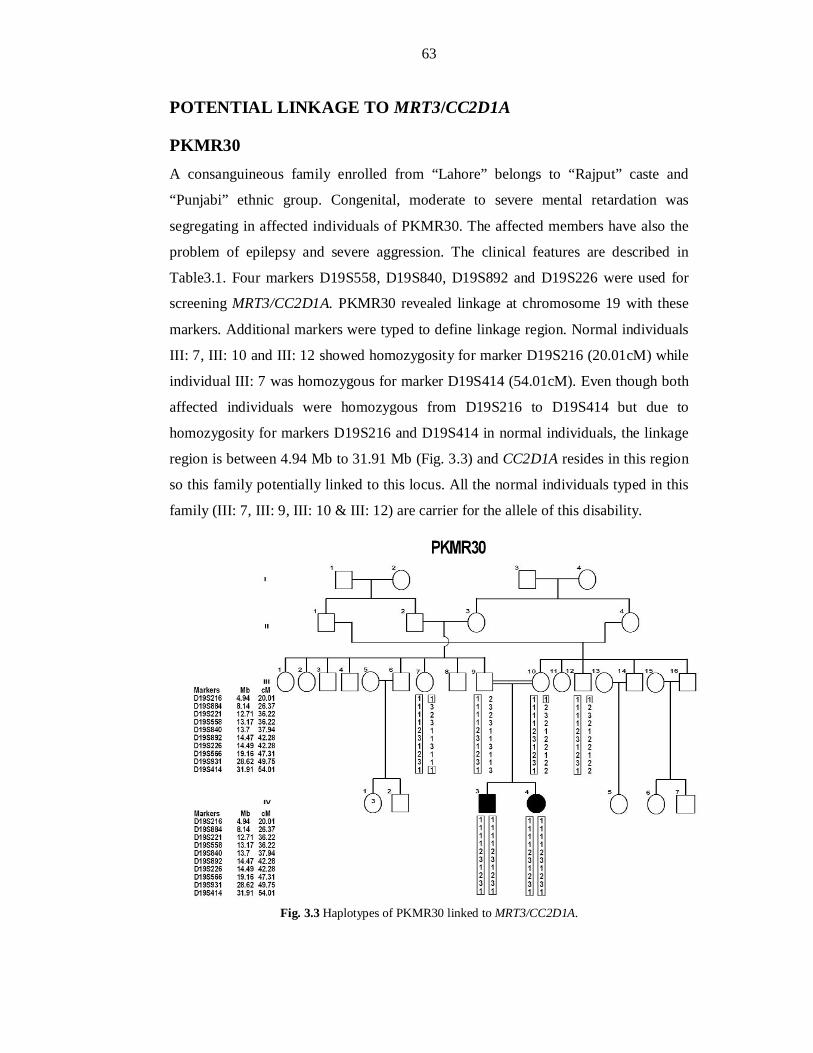
63
POTENTIAL LINKAGE TO MRT3/CC2D1A
PKMR30 A consanguineous family enrolled from “Lahore” belongs to “Rajput” caste and
“Punjabi” ethnic group. Congenital, moderate to severe mental retardation was
segregating in affected individuals of PKMR30. The affected members have also the
problem of epilepsy and severe aggression. The clinical features are described in
Table3.1. Four markers D19S558, D19S840, D19S892 and D19S226 were used for
screening MRT3/CC2D1A. PKMR30 revealed linkage at chromosome 19 with these
markers. Additional markers were typed to define linkage region. Normal individuals
III: 7, III: 10 and III: 12 showed homozygosity for marker D19S216 (20.01cM) while
individual III: 7 was homozygous for marker D19S414 (54.01cM). Even though both
affected individuals were homozygous from D19S216 to D19S414 but due to
homozygosity for markers D19S216 and D19S414 in normal individuals, the linkage
region is between 4.94 Mb to 31.91 Mb (Fig. 3.3) and CC2D1A resides in this region
so this family potentially linked to this locus. All the normal individuals typed in this
family (III: 7, III: 9, III: 10 & III: 12) are carrier for the allele of this disability.
Fig. 3.3 Haplotypes of PKMR30 linked to MRT3/CC2D1A.
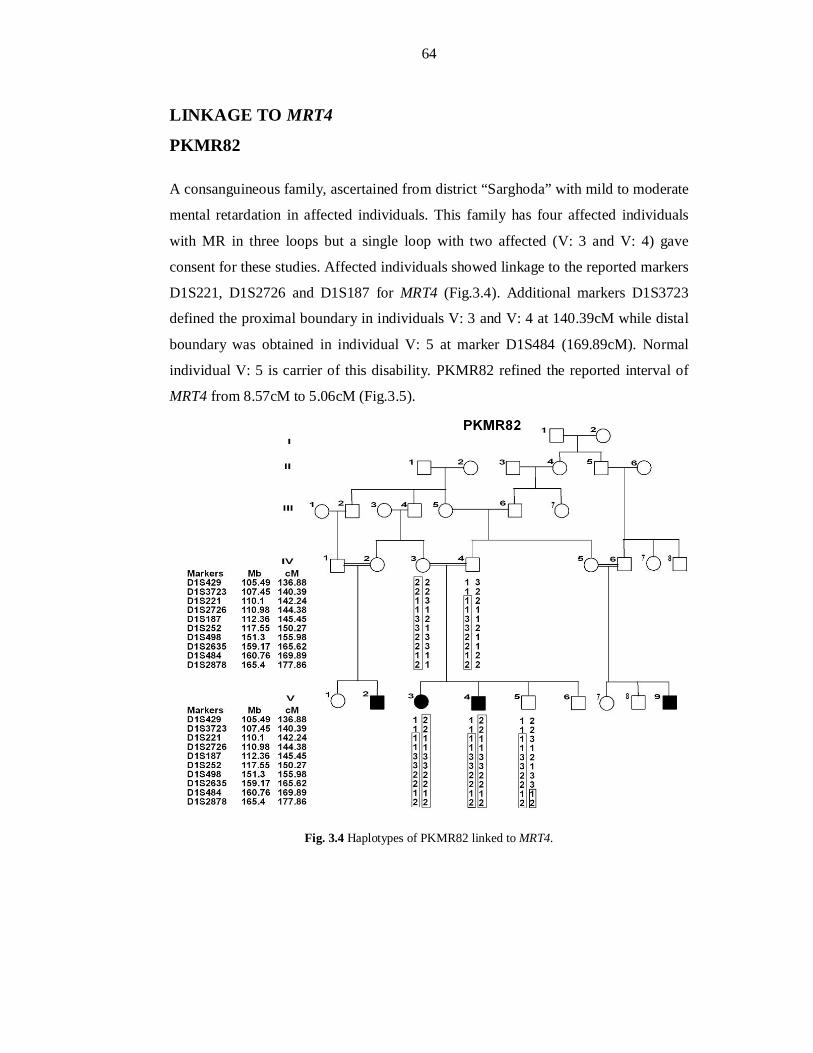
64
LINKAGE TO MRT4
PKMR82
A consanguineous family, ascertained from district “Sarghoda” with mild to moderate
mental retardation in affected individuals. This family has four affected individuals
with MR in three loops but a single loop with two affected (V: 3 and V: 4) gave
consent for these studies. Affected individuals showed linkage to the reported markers
D1S221, D1S2726 and D1S187 for MRT4 (Fig.3.4). Additional markers D1S3723
defined the proximal boundary in individuals V: 3 and V: 4 at 140.39cM while distal
boundary was obtained in individual V: 5 at marker D1S484 (169.89cM). Normal
individual V: 5 is carrier of this disability. PKMR82 refined the reported interval of
MRT4 from 8.57cM to 5.06cM (Fig.3.5).
Fig. 3.4 Haplotypes of PKMR82 linked to MRT4.
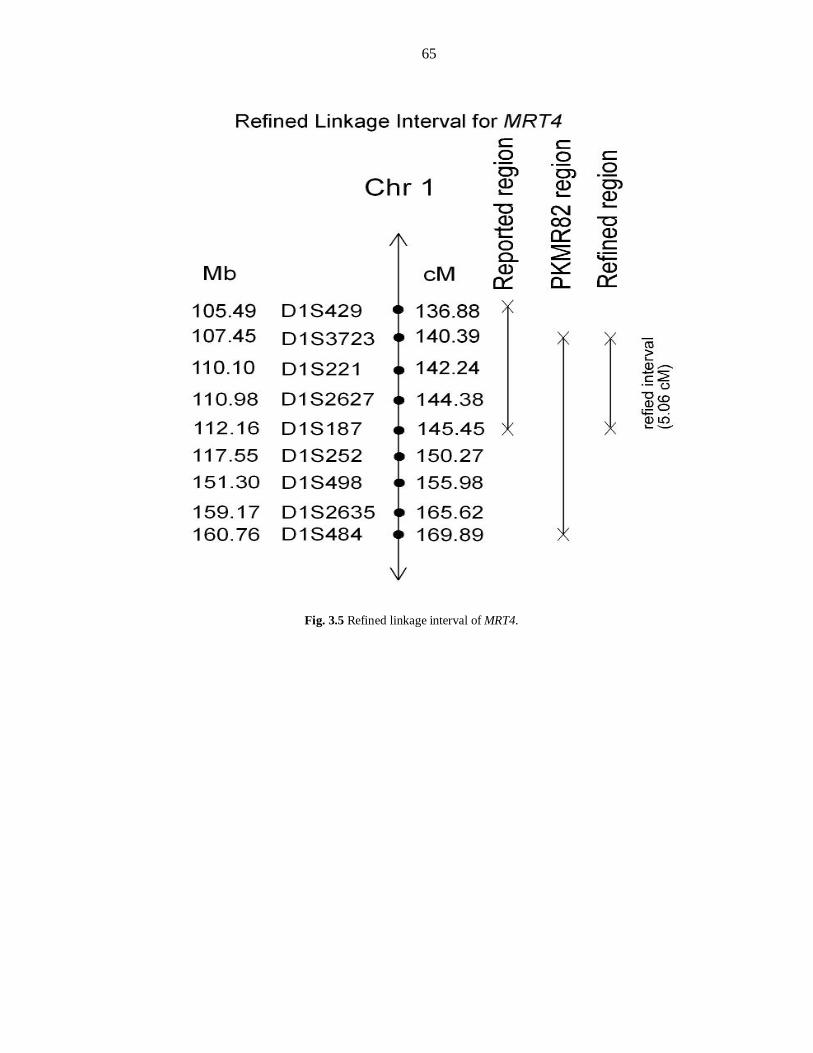
65
Fig. 3.5 Refined linkage interval of MRT4.
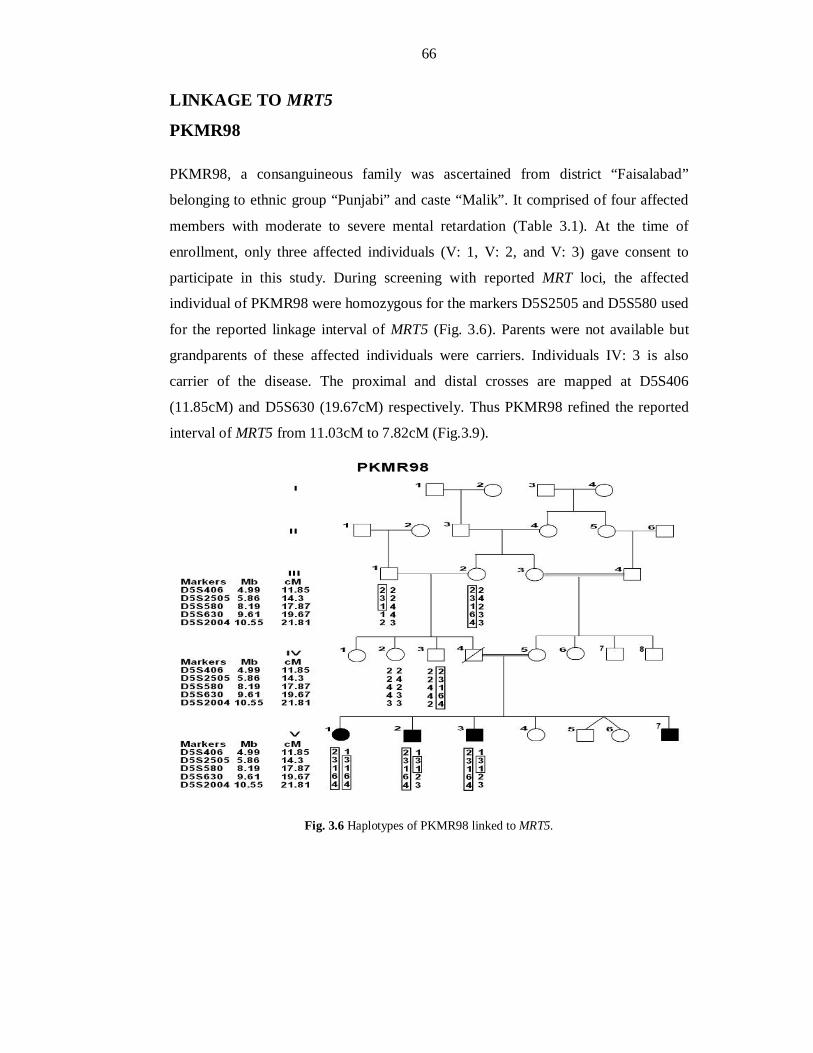
66
LINKAGE TO MRT5
PKMR98
PKMR98, a consanguineous family was ascertained from district “Faisalabad”
belonging to ethnic group “Punjabi” and caste “Malik”. It comprised of four affected
members with moderate to severe mental retardation (Table 3.1). At the time of
enrollment, only three affected individuals (V: 1, V: 2, and V: 3) gave consent to
participate in this study. During screening with reported MRT loci, the affected
individual of PKMR98 were homozygous for the markers D5S2505 and D5S580 used
for the reported linkage interval of MRT5 (Fig. 3.6). Parents were not available but
grandparents of these affected individuals were carriers. Individuals IV: 3 is also
carrier of the disease. The proximal and distal crosses are mapped at D5S406
(11.85cM) and D5S630 (19.67cM) respectively. Thus PKMR98 refined the reported
interval of MRT5 from 11.03cM to 7.82cM (Fig.3.9).
Fig. 3.6 Haplotypes of PKMR98 linked to MRT5.
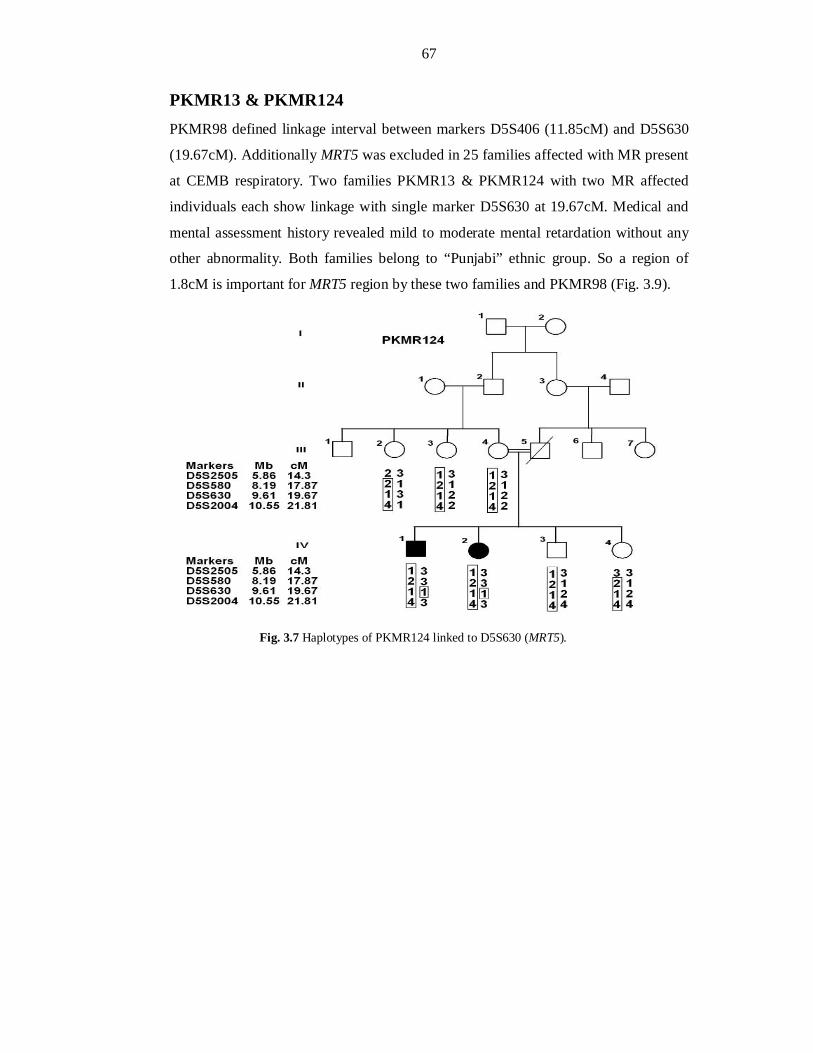
67
PKMR13 & PKMR124 PKMR98 defined linkage interval between markers D5S406 (11.85cM) and D5S630
(19.67cM). Additionally MRT5 was excluded in 25 families affected with MR present
at CEMB respiratory. Two families PKMR13 & PKMR124 with two MR affected
individuals each show linkage with single marker D5S630 at 19.67cM. Medical and
mental assessment history revealed mild to moderate mental retardation without any
other abnormality. Both families belong to “Punjabi” ethnic group. So a region of
1.8cM is important for MRT5 region by these two families and PKMR98 (Fig. 3.9).
Fig. 3.7 Haplotypes of PKMR124 linked to D5S630 (MRT5).
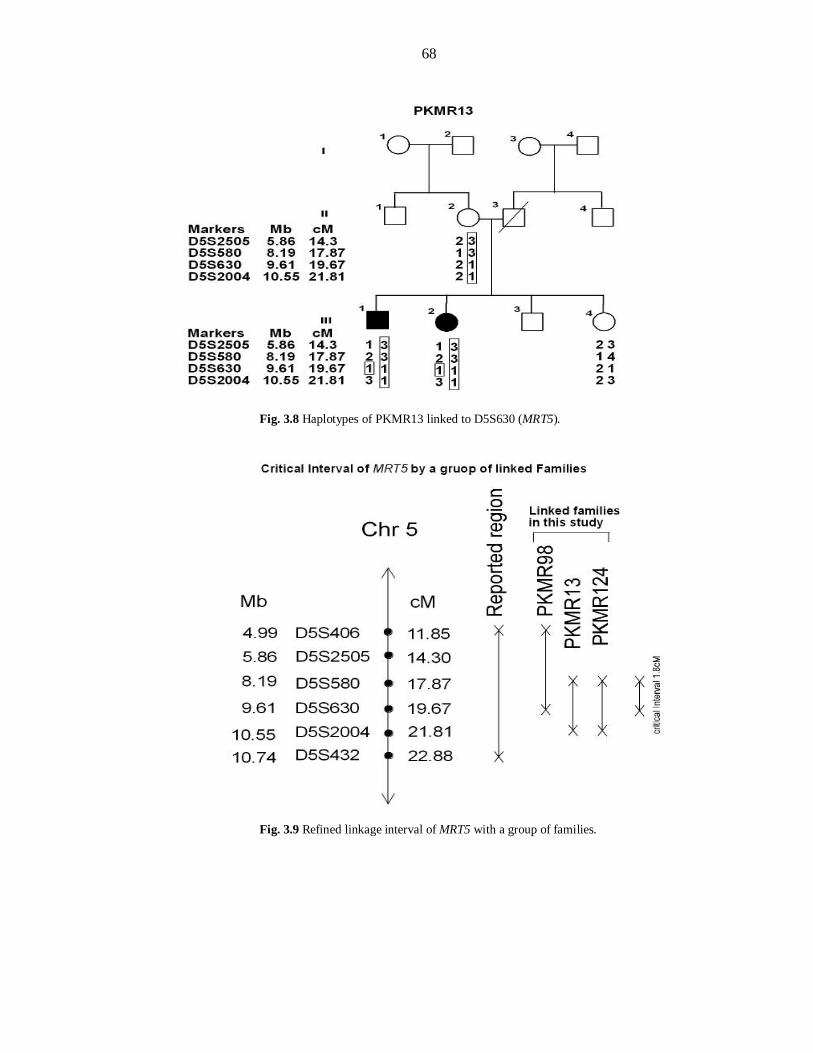
68
Fig. 3.8 Haplotypes of PKMR13 linked to D5S630 (MRT5).
Fig. 3.9 Refined linkage interval of MRT5 with a group of families.
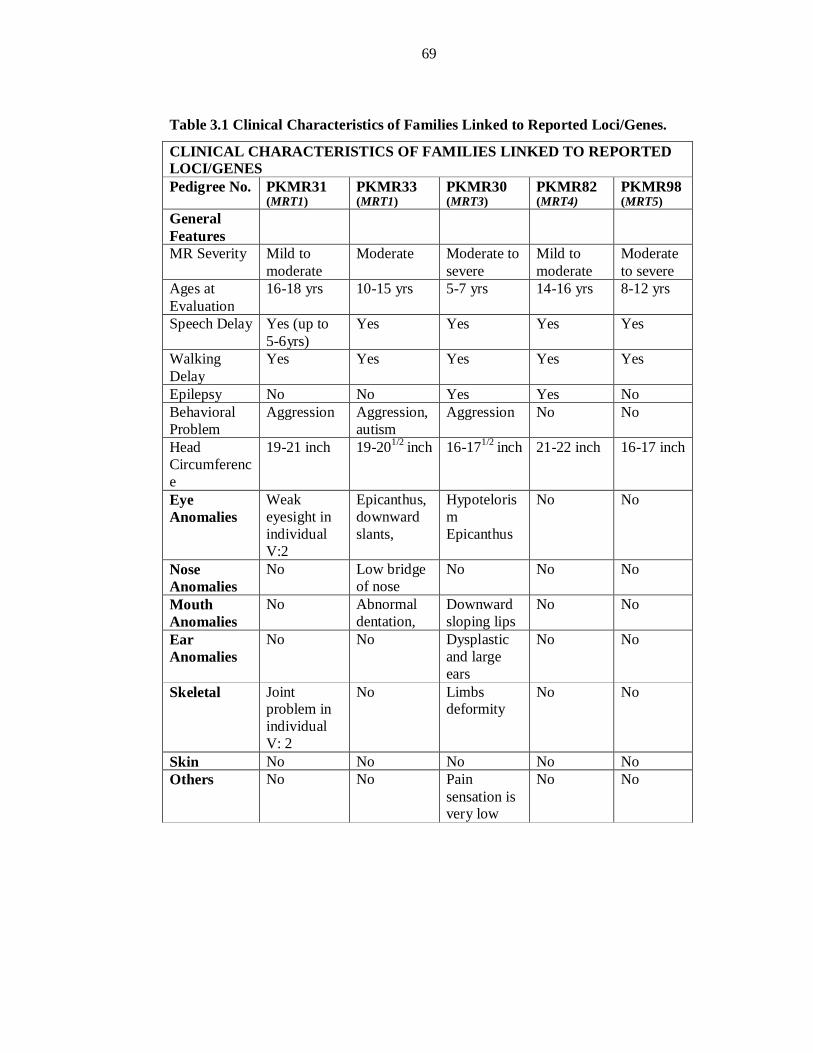
69
Table 3.1 Clinical Characteristics of Families Linked to Reported Loci/Genes.
CLINICAL CHARACTERISTICS OF FAMILIES LINKED TO REPORTED LOCI/GENES Pedigree No. PKMR31
(MRT1) PKMR33 (MRT1)
PKMR30 (MRT3)
PKMR82 (MRT4)
PKMR98 (MRT5)
General Features
MR Severity Mild to moderate
Moderate Moderate to severe
Mild to moderate
Moderate to severe
Ages at Evaluation
16-18 yrs 10-15 yrs 5-7 yrs 14-16 yrs 8-12 yrs
Speech Delay Yes (up to 5-6yrs)
Yes Yes Yes Yes
Walking Delay
Yes Yes Yes Yes Yes
Epilepsy No No Yes Yes No Behavioral Problem
Aggression Aggression, autism
Aggression No No
Head Circumference
19-21 inch 19-201/2 inch 16-171/2 inch 21-22 inch 16-17 inch
Eye Anomalies
Weak eyesight in individual V:2
Epicanthus, downward slants,
Hypotelorism Epicanthus
No No
Nose Anomalies
No Low bridge of nose
No No No
Mouth Anomalies
No Abnormal dentation,
Downward sloping lips
No No
Ear Anomalies
No No Dysplastic and large ears
No No
Skeletal Joint problem in individual V: 2
No Limbs deformity
No No
Skin No No No No No Others No No Pain
sensation is very low
No No
70
CHAPTER-II
MAPPING & REFINEMENT OF A NEW
LOCUS FOR AUTOSOMAL RECESSIVE
NONSYNDROMIC MENTAL
RETARDATION AT CHROMOSOME 11q14.1
71
Genome wide scan strategy was adopted to map a new ARNSMR locus. Genome
wide linkage was performed on four unlinked families PKMR95, PKMR118,
PKMR146 and PKMR148 by using ABI PRISM® Linkage Mapping Set version 2.5
containing 370 fluorescently labeled microsatellite markers spaced at an average
interval of ~10cM across the human genome.
PKMR95 PKMR 95, a large consanguineous family was enrolled from Karachi and belongs to
“Pakhtoon” ethnic group and “Yousafzae” caste. Transmission of mental retardation
phenotype in four affected individuals consistent with autosomal recessive mode of
inheritance (Fig.3.11).
Clinical evaluation Clinical histories were obtained from participating family members to rule out
obvious environmental causes of intellectual disability. Physical and mental
evaluations were undertaken to verify severity of disease. PKMR95 displayed
congenital, moderate type of nonsyndromic mental retardation. Clinical evaluations
suggested no other malformations except mental retardation related to lack of
adaptive behavior i.e. delay in walking and speech delay (Table 3.2). Pictures of the
some affected members of PKMR95 are shown in Figure 3.15 to describe phenotype
of the disease.
Genome-wide Scan For genome-wide scan, eight individuals including four normal (V: 5, V: 6, VI: 4 and
VI: 10) and four affected individuals (VI: 7, VI: 8, VI: 9, and VII: 2) (Fig 3.11) were
selected. Genome wide scan was performed using HD10 Panel of ABI PRISM®
Linkage Mapping Set, Version 2.5 (Applied Biosystems). The microsatellite markers
were amplified by polymerase chain reaction (PCR) on a Gene Amp PCR system
2700 (ABI®) according to standardized conditions (Table 2.3), analyzed on an ABI
PRISM® 3730 Genetic Analyzer and all the alleles were assigned using Genescan and
Genotyper Software (Applied Biosystems).
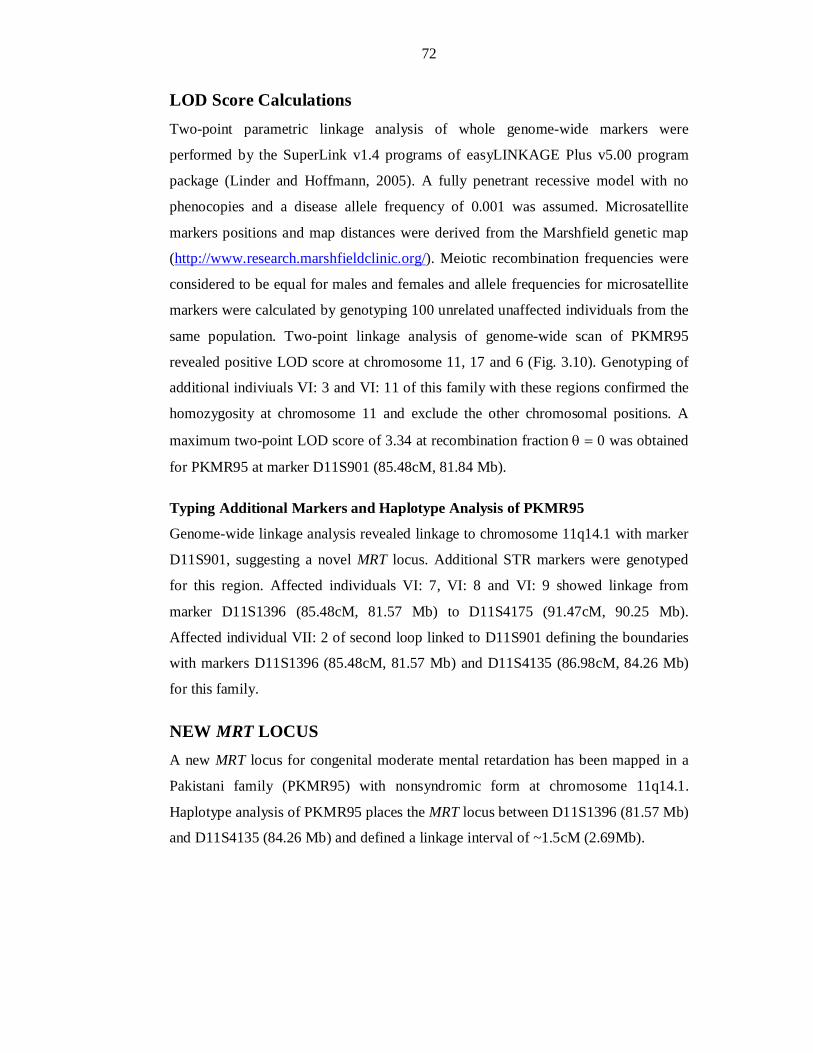
72
LOD Score Calculations Two-point parametric linkage analysis of whole genome-wide markers were
performed by the SuperLink v1.4 programs of easyLINKAGE Plus v5.00 program
package (Linder and Hoffmann, 2005). A fully penetrant recessive model with no
phenocopies and a disease allele frequency of 0.001 was assumed. Microsatellite
markers positions and map distances were derived from the Marshfield genetic map
(http://www.research.marshfieldclinic.org/). Meiotic recombination frequencies were
considered to be equal for males and females and allele frequencies for microsatellite
markers were calculated by genotyping 100 unrelated unaffected individuals from the
same population. Two-point linkage analysis of genome-wide scan of PKMR95
revealed positive LOD score at chromosome 11, 17 and 6 (Fig. 3.10). Genotyping of
additional indiviuals VI: 3 and VI: 11 of this family with these regions confirmed the
homozygosity at chromosome 11 and exclude the other chromosomal positions. A
maximum two-point LOD score of 3.34 at recombination fraction 0 was obtained
for PKMR95 at marker D11S901 (85.48cM, 81.84 Mb).
Typing Additional Markers and Haplotype Analysis of PKMR95
Genome-wide linkage analysis revealed linkage to chromosome 11q14.1 with marker
D11S901, suggesting a novel MRT locus. Additional STR markers were genotyped
for this region. Affected individuals VI: 7, VI: 8 and VI: 9 showed linkage from
marker D11S1396 (85.48cM, 81.57 Mb) to D11S4175 (91.47cM, 90.25 Mb).
Affected individual VII: 2 of second loop linked to D11S901 defining the boundaries
with markers D11S1396 (85.48cM, 81.57 Mb) and D11S4135 (86.98cM, 84.26 Mb)
for this family.
NEW MRT LOCUS
A new MRT locus for congenital moderate mental retardation has been mapped in a
Pakistani family (PKMR95) with nonsyndromic form at chromosome 11q14.1.
Haplotype analysis of PKMR95 places the MRT locus between D11S1396 (81.57 Mb)
and D11S4135 (84.26 Mb) and defined a linkage interval of ~1.5cM (2.69Mb).
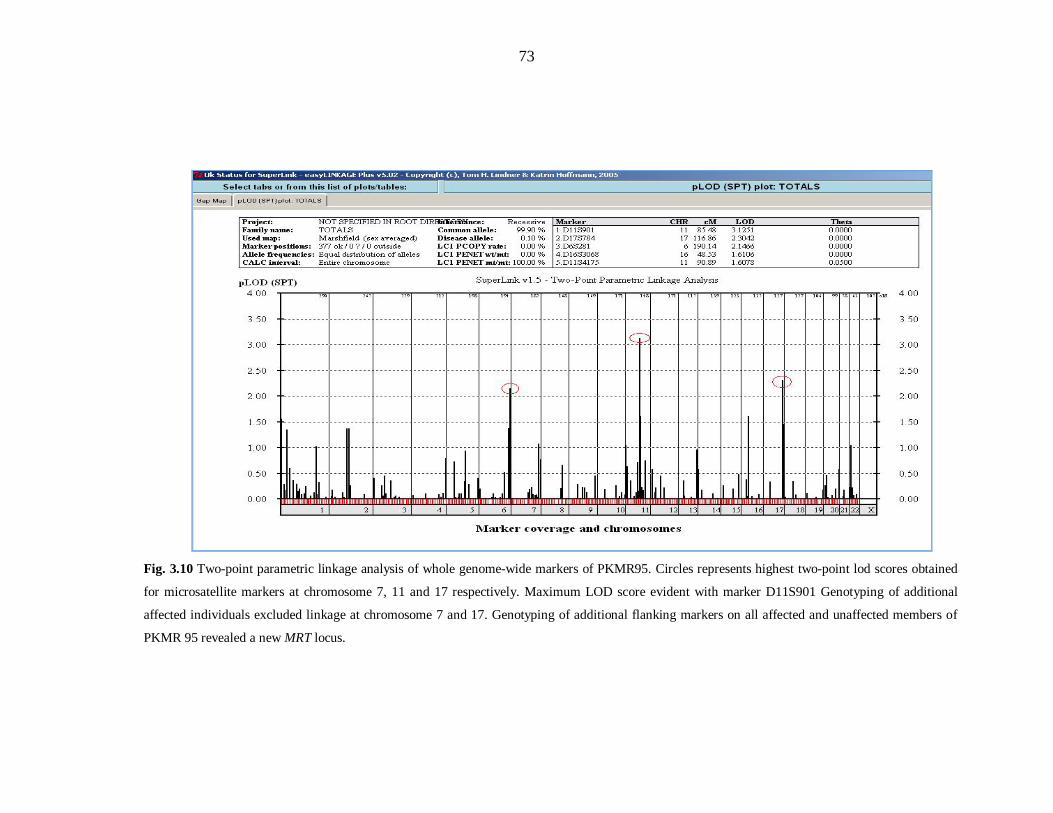
73
Fig. 3.10 Two-point parametric linkage analysis of whole genome-wide markers of PKMR95. Circles represents highest two-point lod scores obtained
for microsatellite markers at chromosome 7, 11 and 17 respectively. Maximum LOD score evident with marker D11S901 Genotyping of additional
affected individuals excluded linkage at chromosome 7 and 17. Genotyping of additional flanking markers on all affected and unaffected members of
PKMR 95 revealed a new MRT locus.
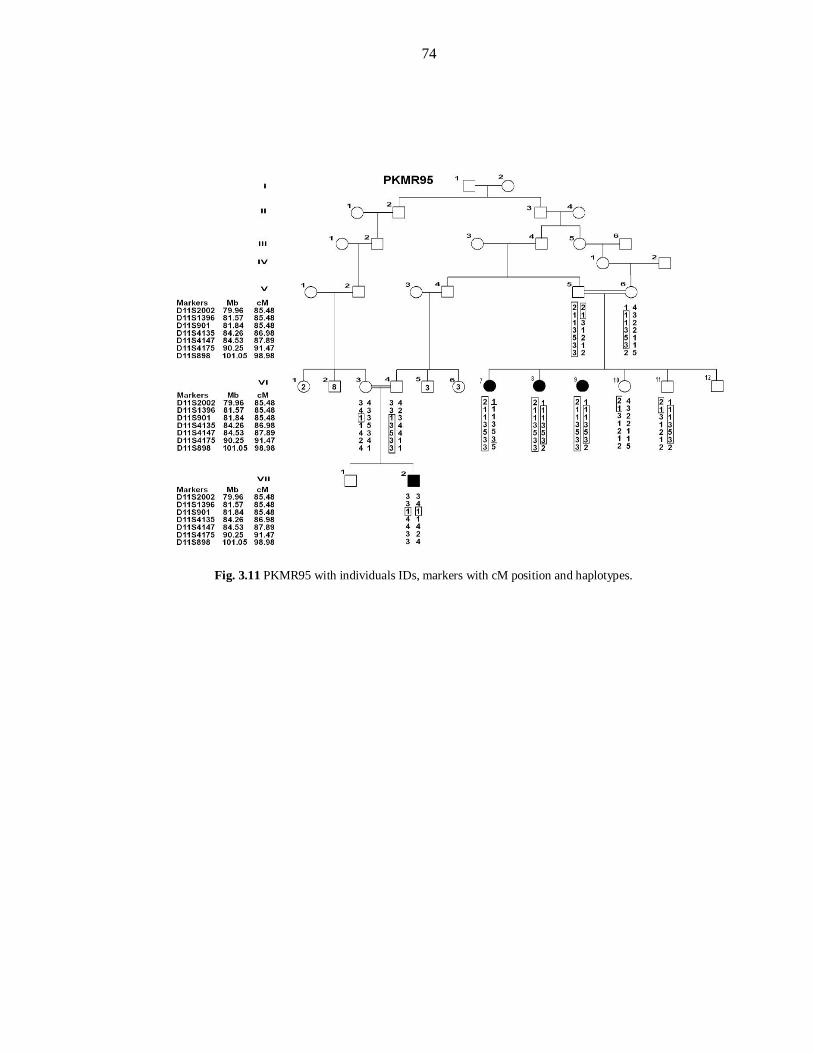
74
Fig. 3.11 PKMR95 with individuals IDs, markers with cM position and haplotypes.
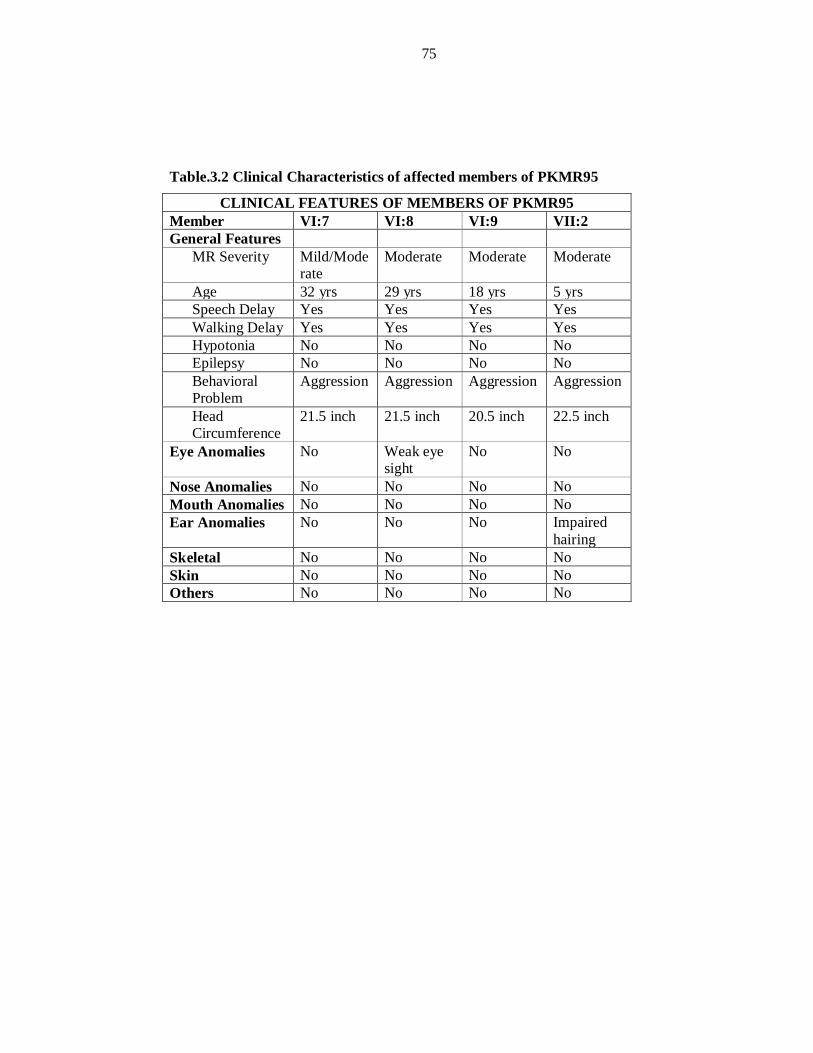
75
Table.3.2 Clinical Characteristics of affected members of PKMR95
CLINICAL FEATURES OF MEMBERS OF PKMR95 Member VI:7 VI:8 VI:9 VII:2 General Features
MR Severity Mild/Moderate
Moderate Moderate Moderate
Age 32 yrs 29 yrs 18 yrs 5 yrs Speech Delay Yes Yes Yes Yes Walking Delay Yes Yes Yes Yes Hypotonia No No No No Epilepsy No No No No Behavioral Problem
Aggression Aggression Aggression Aggression
Head Circumference
21.5 inch 21.5 inch 20.5 inch 22.5 inch
Eye Anomalies No Weak eye sight
No No
Nose Anomalies No No No No Mouth Anomalies No No No No Ear Anomalies No No No Impaired
hairing Skeletal No No No No Skin No No No No Others No No No No
76
Additional Families linked to New MRT Locus at
Chromosome 11q14.1
An extensive screening was done to find more families linked to the newly mapped
locus. The marker D11S901 linked to new region was used to screen Pakistani
families segregating ARNSMR. The unlinked 120 families segregating congenital,
recessive intellectual disability present at CEMB DNA bank were screened for the
new MRT locus.
During this search, two additional families PKMR143 and PKMR48 were
found linked with D11S901. After initial evidence of linkage in these families,
additional microsatellite markers were genotyped on all the enrolled members to
confirm the linkage.
PKMR143
PKMR143 enrolled from Lahore and belongs to “Shahani” caste of “Punjabi” ethnic
group, was found linked to this new region. Medical histories and mental assessment
record showed moderate nonsyndromic mental retardation in affected individuals.
Clinical characteristics are described in Table 3.3 and pictures in Fig 3.16.
Haplotype Analysis of PKMR143
During screening, the family PKMR143 showed linkage with chromosome 11q14.1
markers. Additional markers were typed and this family showed linkage for 15.15cM
region with defining markers D11S1761 (83.83cM) and D11S898 (98.98cM).
Haplotype analysis also showed that individual VI: 3 is a carrier for the affected allele
(Fig.3.12).
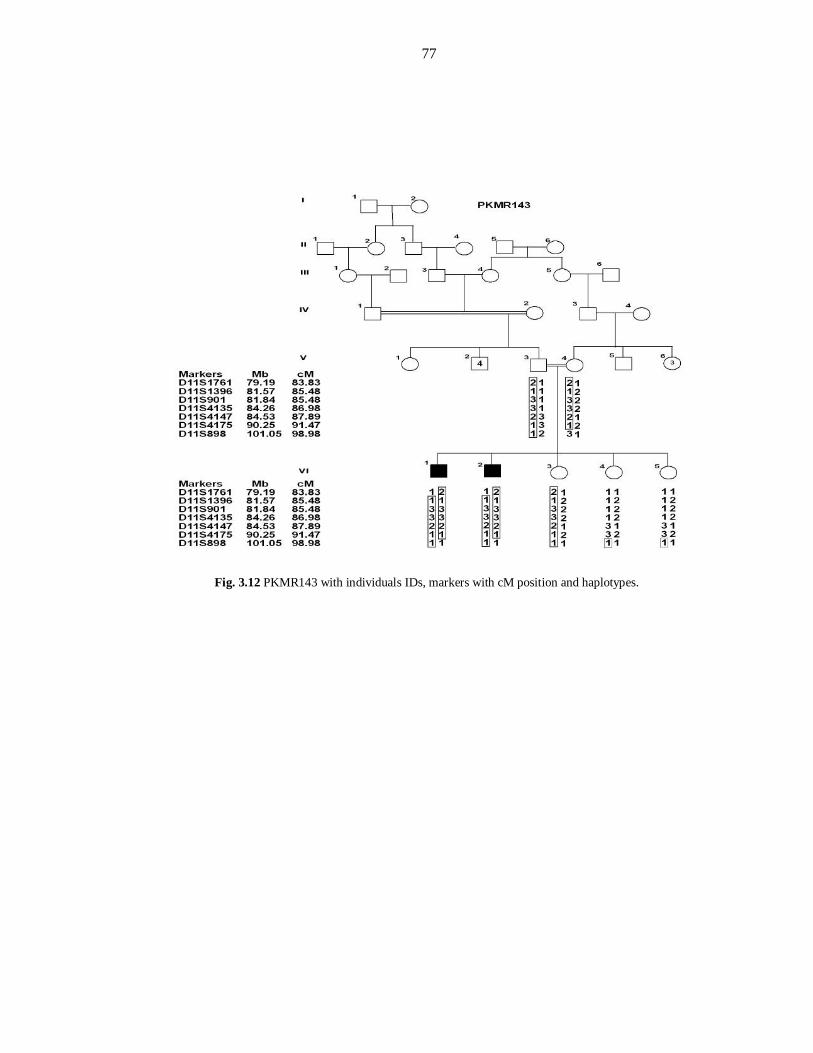
77
Fig. 3.12 PKMR143 with individuals IDs, markers with cM position and haplotypes.
78
PKMR48
Another family PKMR48 showed linkage to chromosome 11q14.1 during screening
of 120 unlinked families present at CEMB DNA bank. This family was enrolled from
Lower Dir and belongs to the “Pakhtoon” ethnic group and “Miangan” caste. The
family consists of three affected individuals in single loop having moderate congenital
mental retardation. Individual VI: 2 has eyesight problem and abnormality in dental
patron. Clinical data is described in Table 3.3. All affected individuals appeared in the
sixth generation of the pedigree (Fig.3.13). Pictures of affected individuals are shown
in Figure 3.17.
Haplotype Analysis of PKMR48
The family PKMR48 showed linkage with D11S901. Additional markers were typed
on all members and markers D11S901 and D11S4175 were found linked in this
family. Two markers remained unlink between these markers so two linkage regions
are defined. The first linkage interval spanned a region of 1.5cM region with flanking
markers D11S1396 and D11S4135 (Fig.3.13). This region is same as defined by
PKMR95.
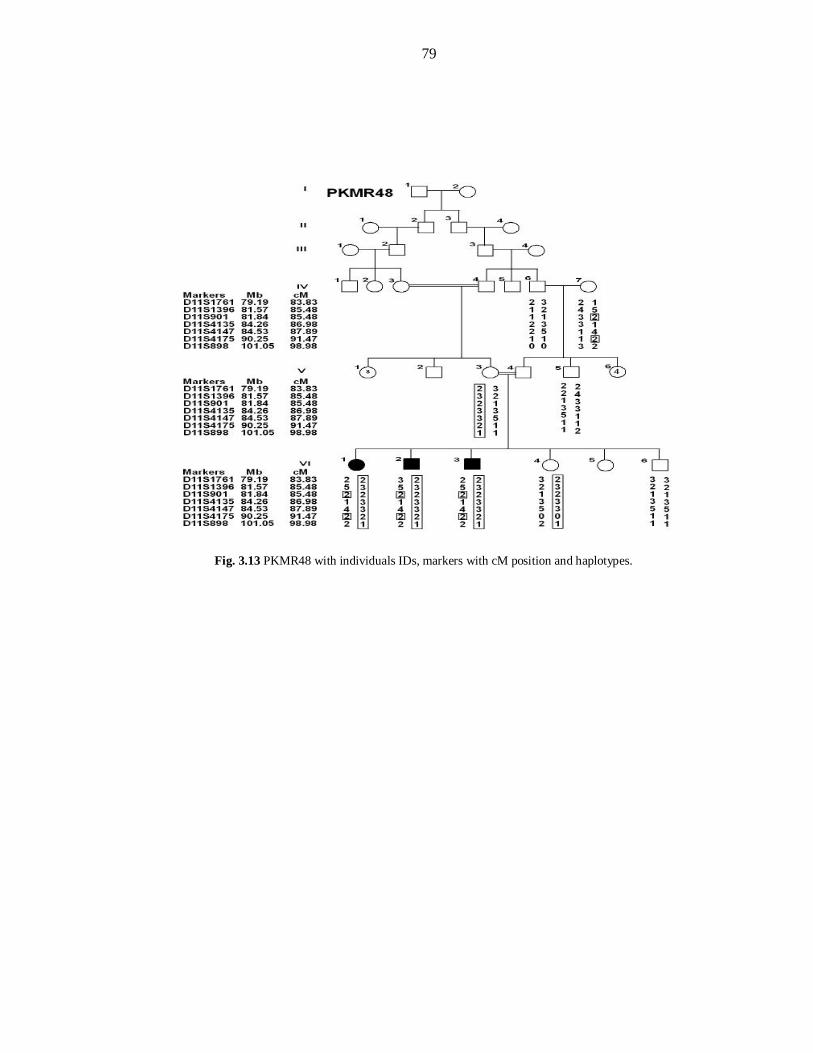
79
Fig. 3.13 PKMR48 with individuals IDs, markers with cM position and haplotypes.
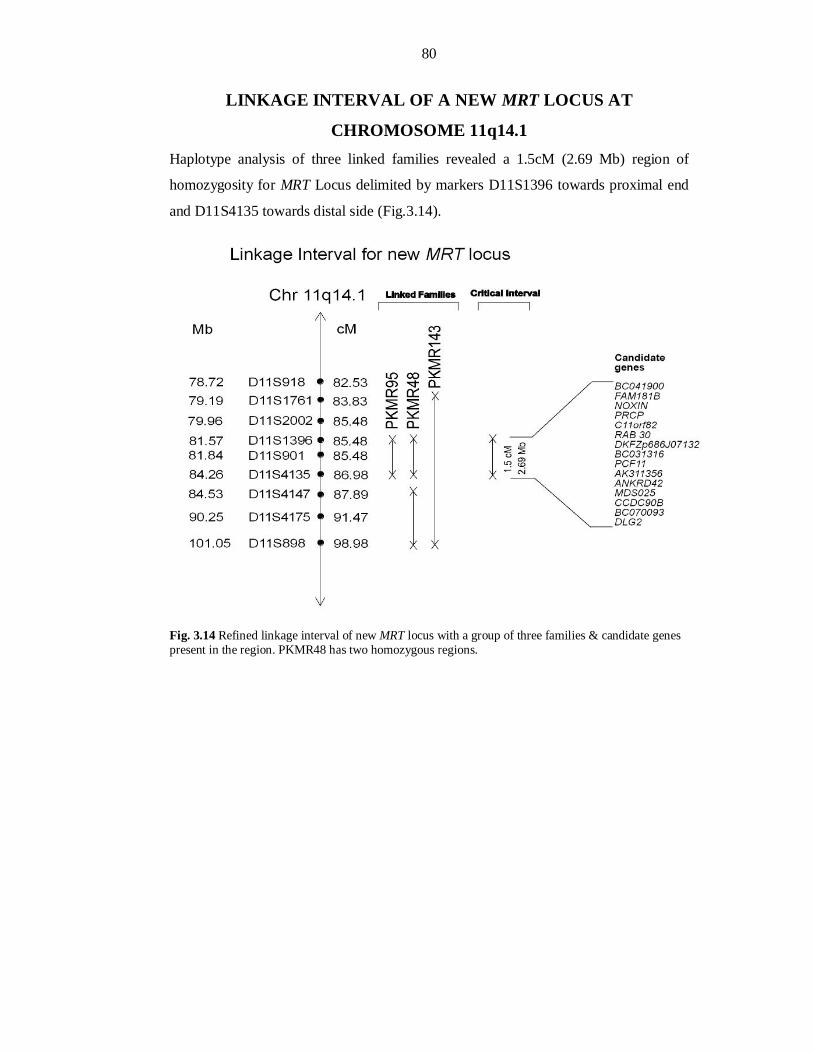
80
LINKAGE INTERVAL OF A NEW MRT LOCUS AT
CHROMOSOME 11q14.1 Haplotype analysis of three linked families revealed a 1.5cM (2.69 Mb) region of
homozygosity for MRT Locus delimited by markers D11S1396 towards proximal end
and D11S4135 towards distal side (Fig.3.14).
Fig. 3.14 Refined linkage interval of new MRT locus with a group of three families & candidate genes present in the region. PKMR48 has two homozygous regions.
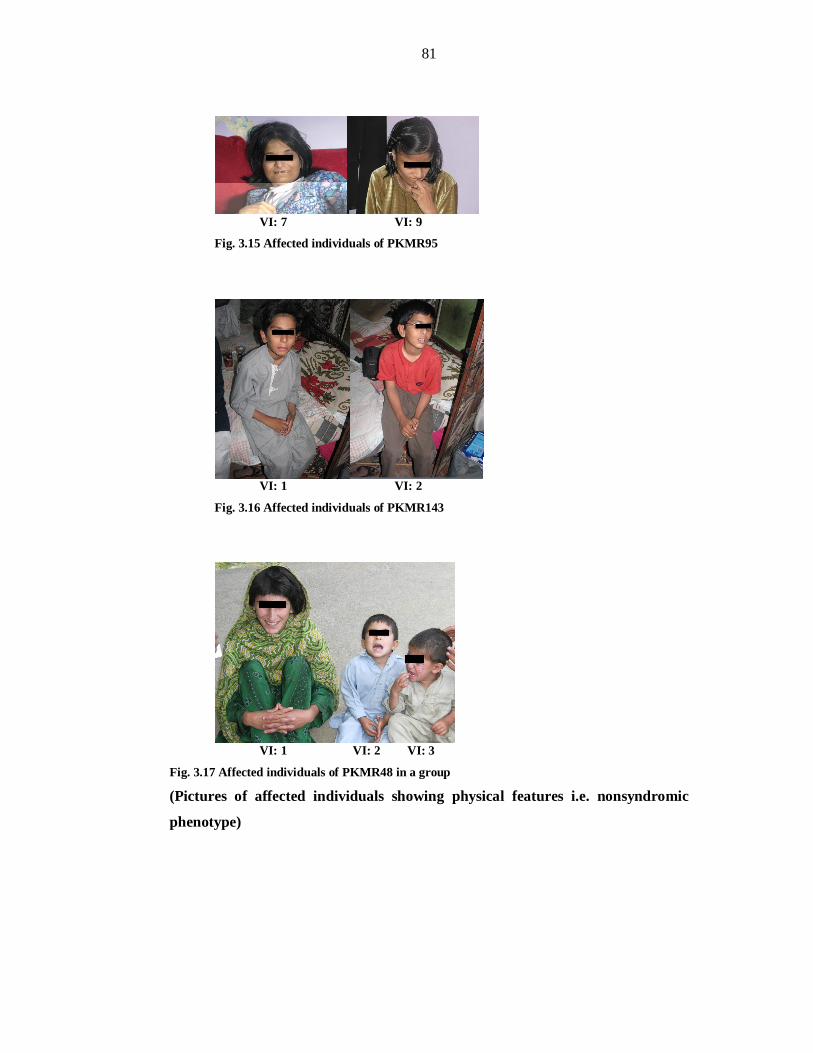
81
VI: 7 VI: 9
Fig. 3.15 Affected individuals of PKMR95
VI: 1 VI: 2
Fig. 3.16 Affected individuals of PKMR143
VI: 1 VI: 2 VI: 3
Fig. 3.17 Affected individuals of PKMR48 in a group (Pictures of affected individuals showing physical features i.e. nonsyndromic
phenotype)
82
CHAPTER-III
MAPPING OF SECOND NEW LOCUS FOR
AUTOSOMAL RECESSIVE
NONSYNDROMIC MENTAL
RETARDATION AT CHROMOSOME
5q14.1-14.3
83
PKMR146 PKMR146 was a consanguineous family, was enrolled from Jehlum and belongs to
“Awan” caste and “Punjabi” ethnic group. This family comprise of four individuals
with intellectual disability in a single loop (Fig.3.19).
Clinical evaluation Medical history, mental and physical evaluation at the time of enrolment
demonstrated mild to moderate mental retardation without any abnormality and
autuosomal recessive pattern of inheritance. Clinical features are described in Table
3.3 and pictures in Figure 3.20.
Genome-wide Scan For genome-wide scan, eight individuals including four normal (V:4, VI:3, VII:5 and
VII:6) and four affected individuals (VII:1, VII:2, VII:3, and VII:4) were selected
(Fig.3.19). Genome wide scan was performed using HD10 Panel of ABI PRISM®
Linkage Mapping Set, Version 2.5 (Applied Biosystems).
LOD Score Calculations and Haplotype Analysis of PKMR146
Two-point parametric linkage analysis of whole genome-wide markers were
performed by the SuperLink v1.4 programs of easyLINKAGE Plus v5.00 program
package (Linder and Hoffmann, 2005). A fully penetrant recessive model with no
phenocopies and a disease allele frequency of 0.001 was assumed. Microsatellite
markers positions and map distances were derived from the Marshfield genetic map
(http://www.research.marshfieldclinic.org/). Meiotic recombination frequencies were
considered to be equal for males and females and allele frequencies for microsatellite
markers were calculated by genotyping 100 unrelated unaffected individuals from the
same population. Two-point linkage analysis of genome-wide scan revealed positive
LOD score at chromosome 5 for PKMR146 (Fig. 3.18). Individual VI: 4 was
collected and genotyped. Some additional markers were also typed. A maximum two-
point LOD score of 3.05 at recombination fraction 0 was obtained for PKMR146
at marker D5S641 (92.38cM, 82.0Mb). The haplotype analysis of PKMR146 showed
individual VII: 5 as carrier of the affected allele.
84
LINKAGE INTERVAL OF A NEW LOCUS AT CHROMOSOME
5q14.1-14.3
The family PKMR146 was linked to Chromosome 5q14.1-14.3 with a LOD score
3.05 at (θ=0) at marker D5S641. So a new linkage interval of 8.54cM (4.02 Mb) has
been mapped for autosomal recessive nonsyndromic mental retardation. This region is
flanked by markers D5S672 (86.26cM) and D5S1726 (94.8cM).
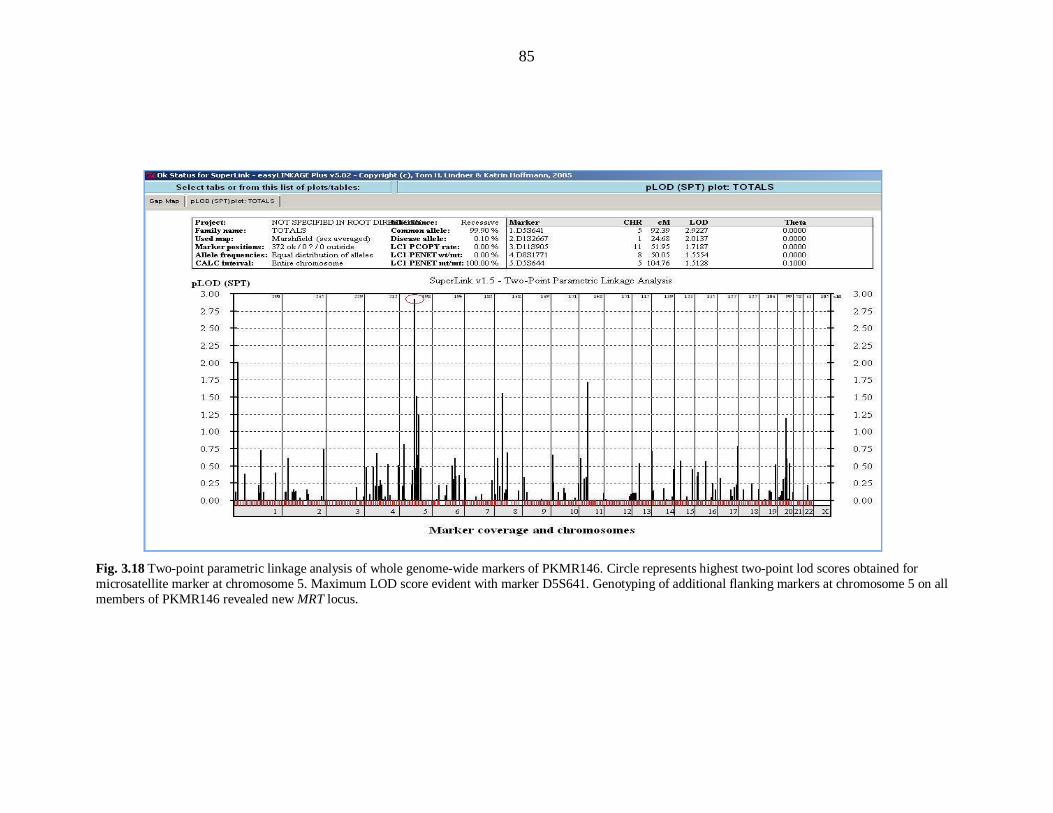
85
Fig. 3.18 Two-point parametric linkage analysis of whole genome-wide markers of PKMR146. Circle represents highest two-point lod scores obtained for microsatellite marker at chromosome 5. Maximum LOD score evident with marker D5S641. Genotyping of additional flanking markers at chromosome 5 on all members of PKMR146 revealed new MRT locus.
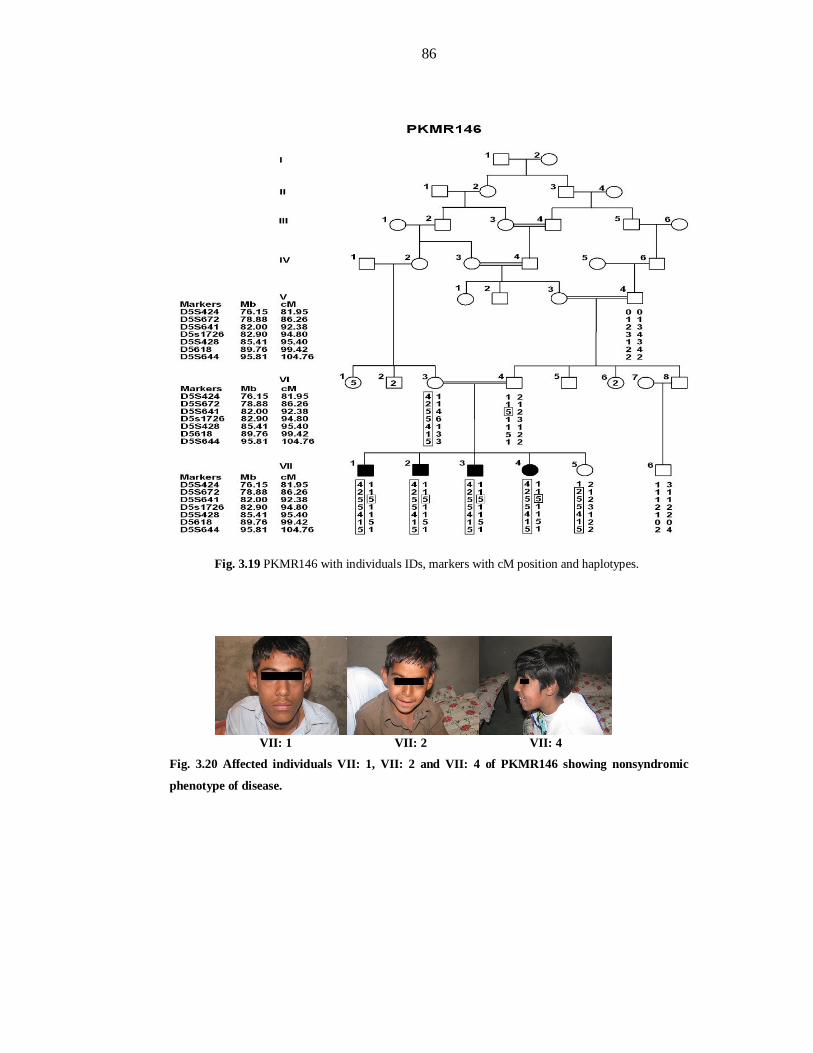
86
Fig. 3.19 PKMR146 with individuals IDs, markers with cM position and haplotypes.
VII: 1 VII: 2 VII: 4
Fig. 3.20 Affected individuals VII: 1, VII: 2 and VII: 4 of PKMR146 showing nonsyndromic
phenotype of disease.
87
CHAPTER-IV
POTENTIAL REGION FOR AUTOSOMAL
RECESSIVE NONSYNDROMIC MENTAL
RETARDATION LOCUS AT CHROMOSOME
22q12.1-12.3
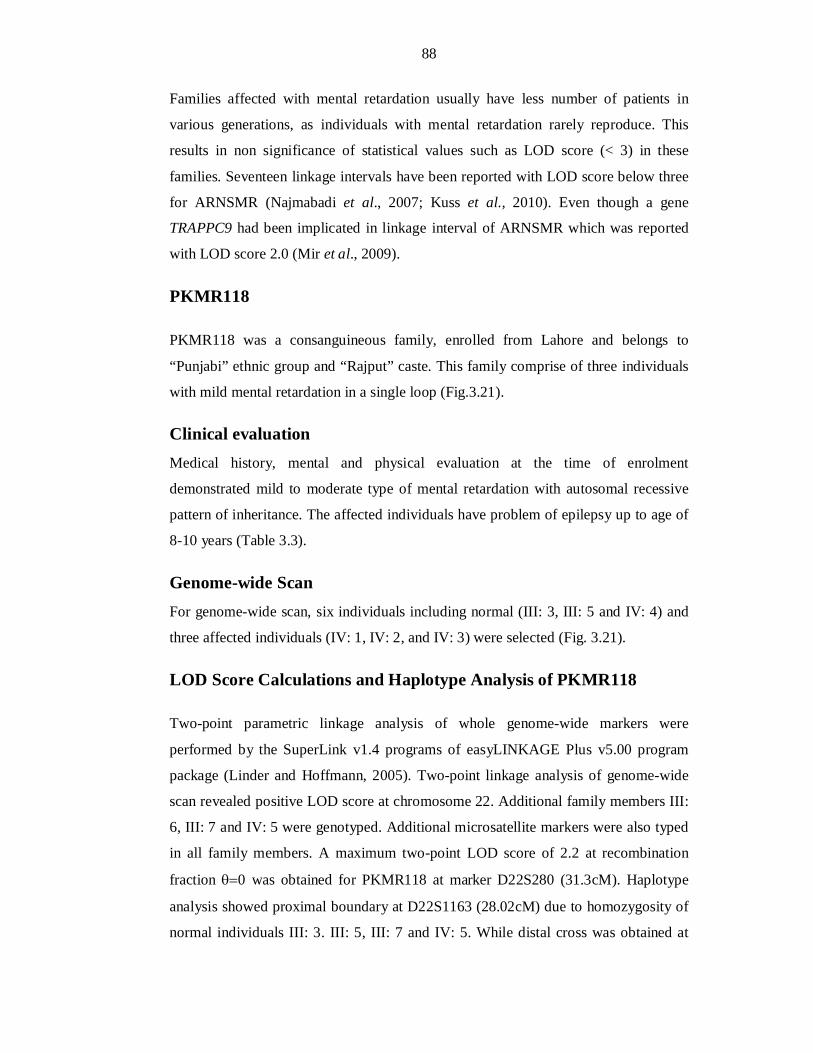
88
Families affected with mental retardation usually have less number of patients in
various generations, as individuals with mental retardation rarely reproduce. This
results in non significance of statistical values such as LOD score (< 3) in these
families. Seventeen linkage intervals have been reported with LOD score below three
for ARNSMR (Najmabadi et al., 2007; Kuss et al., 2010). Even though a gene
TRAPPC9 had been implicated in linkage interval of ARNSMR which was reported
with LOD score 2.0 (Mir et al., 2009).
PKMR118
PKMR118 was a consanguineous family, enrolled from Lahore and belongs to
“Punjabi” ethnic group and “Rajput” caste. This family comprise of three individuals
with mild mental retardation in a single loop (Fig.3.21).
Clinical evaluation Medical history, mental and physical evaluation at the time of enrolment
demonstrated mild to moderate type of mental retardation with autosomal recessive
pattern of inheritance. The affected individuals have problem of epilepsy up to age of
8-10 years (Table 3.3).
Genome-wide Scan For genome-wide scan, six individuals including normal (III: 3, III: 5 and IV: 4) and
three affected individuals (IV: 1, IV: 2, and IV: 3) were selected (Fig. 3.21).
LOD Score Calculations and Haplotype Analysis of PKMR118
Two-point parametric linkage analysis of whole genome-wide markers were
performed by the SuperLink v1.4 programs of easyLINKAGE Plus v5.00 program
package (Linder and Hoffmann, 2005). Two-point linkage analysis of genome-wide
scan revealed positive LOD score at chromosome 22. Additional family members III:
6, III: 7 and IV: 5 were genotyped. Additional microsatellite markers were also typed
in all family members. A maximum two-point LOD score of 2.2 at recombination
fraction 0 was obtained for PKMR118 at marker D22S280 (31.3cM). Haplotype
analysis showed proximal boundary at D22S1163 (28.02cM) due to homozygosity of
normal individuals III: 3. III: 5, III: 7 and IV: 5. While distal cross was obtained at
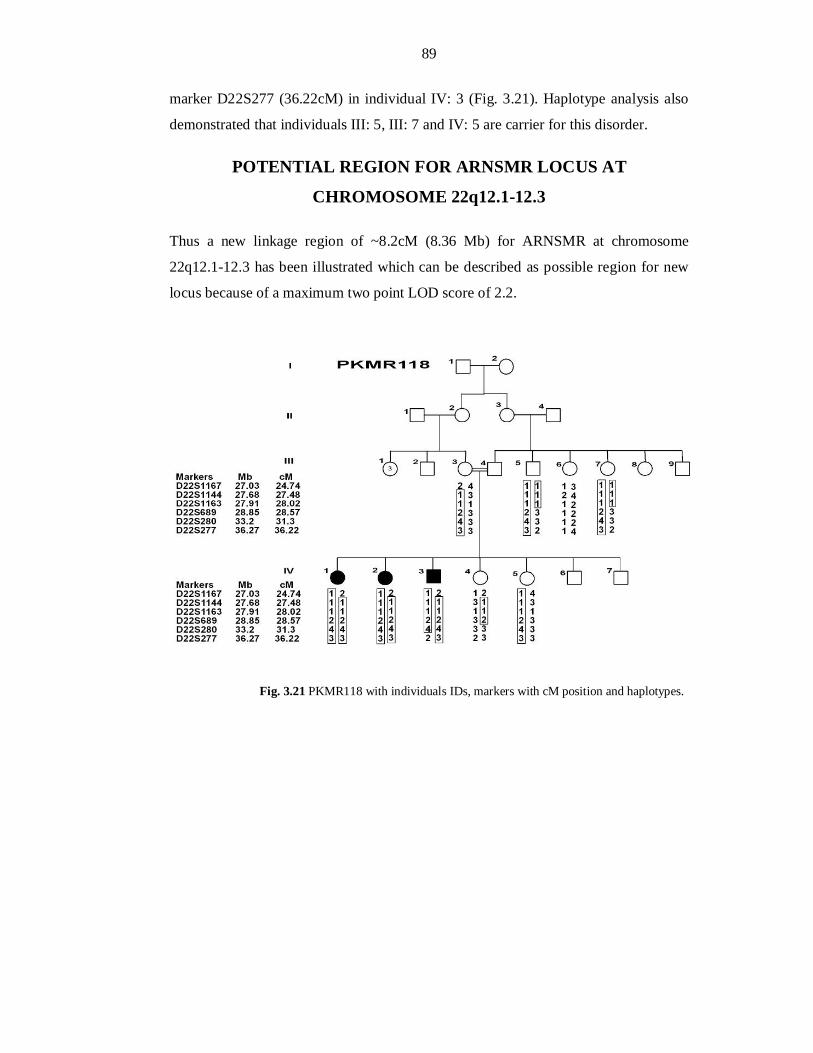
89
marker D22S277 (36.22cM) in individual IV: 3 (Fig. 3.21). Haplotype analysis also
demonstrated that individuals III: 5, III: 7 and IV: 5 are carrier for this disorder.
POTENTIAL REGION FOR ARNSMR LOCUS AT
CHROMOSOME 22q12.1-12.3
Thus a new linkage region of ~8.2cM (8.36 Mb) for ARNSMR at chromosome
22q12.1-12.3 has been illustrated which can be described as possible region for new
locus because of a maximum two point LOD score of 2.2.
Fig. 3.21 PKMR118 with individuals IDs, markers with cM position and haplotypes.
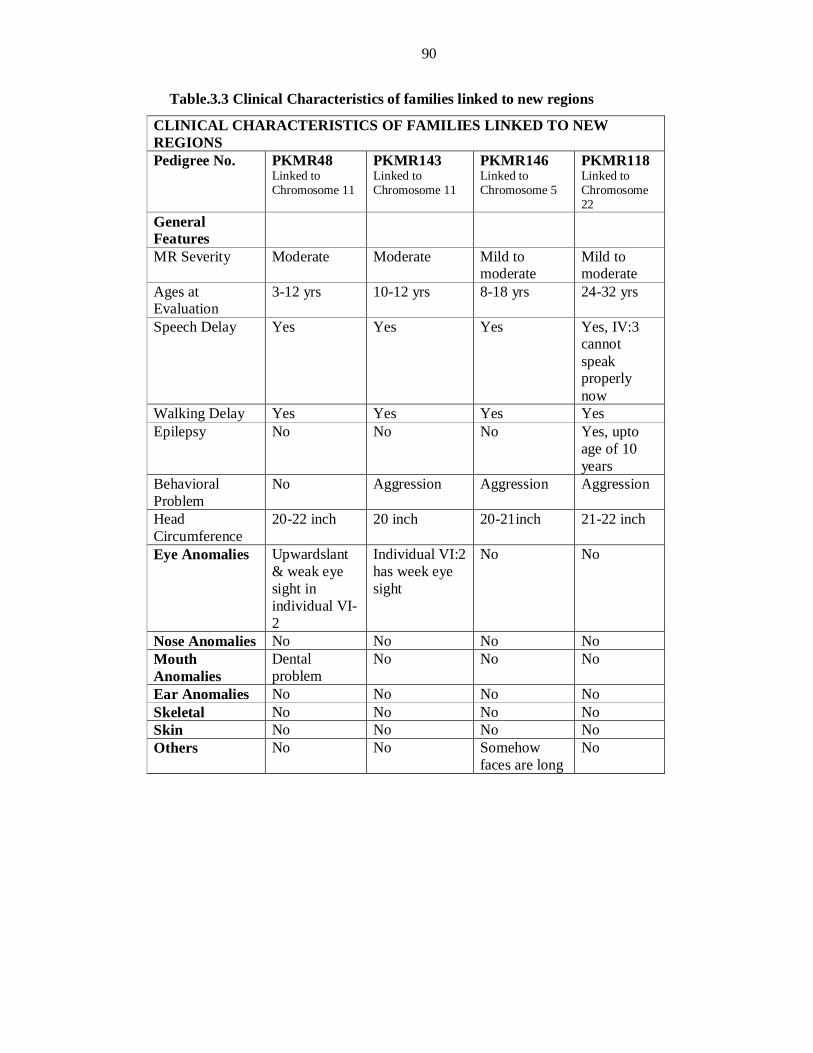
90
Table.3.3 Clinical Characteristics of families linked to new regions
CLINICAL CHARACTERISTICS OF FAMILIES LINKED TO NEW REGIONS Pedigree No. PKMR48
Linked to Chromosome 11
PKMR143 Linked to Chromosome 11
PKMR146 Linked to Chromosome 5
PKMR118 Linked to Chromosome 22
General Features
MR Severity Moderate Moderate Mild to moderate
Mild to moderate
Ages at Evaluation
3-12 yrs 10-12 yrs 8-18 yrs 24-32 yrs
Speech Delay Yes Yes Yes Yes, IV:3 cannot speak properly now
Walking Delay Yes Yes Yes Yes Epilepsy No No No Yes, upto
age of 10 years
Behavioral Problem
No Aggression Aggression Aggression
Head Circumference
20-22 inch 20 inch 20-21inch 21-22 inch
Eye Anomalies Upwardslant & weak eye sight in individual VI-2
Individual VI:2 has week eye sight
No No
Nose Anomalies No No No No Mouth Anomalies
Dental problem
No No No
Ear Anomalies No No No No Skeletal No No No No Skin No No No No Others No No Somehow
faces are long No
91
DISCUSSION
Approximately 1-3% of the human population suffers from learning and adaptive disabilities; termed as mental retardation which produces a severe lifelong burden on the life of the patients, and their families (Hamadan et al., 2009; Rafiq et al., 2010). The causes of the impairment are extremely heterogeneous and have been diagnosed in only half of the cases (Winnepenninckx et al., 2003). Genetic causes of MR are thought to be present in 25–50% of cases, although this number increases proportionally with severity (Van-Buggenhout et al., 2001; Kaufman et al., 2010).
One fourth of affecteds with nonsyndromic mental retardation have an autosomal recessive mode of inheritance (Basel-Vanagaite et al., 2007). Consanguineous families are important in determining autosomal recessive
determinants of the disease. Modell and Darr (2002) reported that recessively inherited congenital conditions are more common in consanguineous populations. The offsprings of consanguineous individuals have an increased likelihood of rare, recessive disease causing variants (alleles) being inherited from both maternal and paternal lineages. Pakistani population is a rich source of consanguineous families (Bittles and Black, 2010) and has high prevalence of congenital mental retardation (Gustavson, 2005). In this disorder, although families are consanguineous but number of affected in a pedigree are not large as patients with MR rarely reproduce. Only four
loci had been reported up till now in Pakistani population for ARNSMR; MRT13/TRAPPC9 on chromosome 8 (Mir et al., 2009), MRT14 on chromosome 2, MRT15 & MRT16 on Chromosome 9 (Rafiq et al., 2010). Therefore lot of work needs to be done to characterize mental retardation in Pakistani population.
This study was design to characterize the homozygosity mapping through STR markers in Pakistani families affected with ARNSMR. The linkage studies of the families with mental retardation have many benefits. It helps in localizing the disease causing regions on genome and positional cloning of the localized segments. It leads to identify the underlying disease causing gene defects. These studies are helpful to control the disease transmission in next generations by genetic counseling and knowing the carrier status of the normal members in the affected families. The linkage data is also helpful in establishing genotype-phenotype correlations.
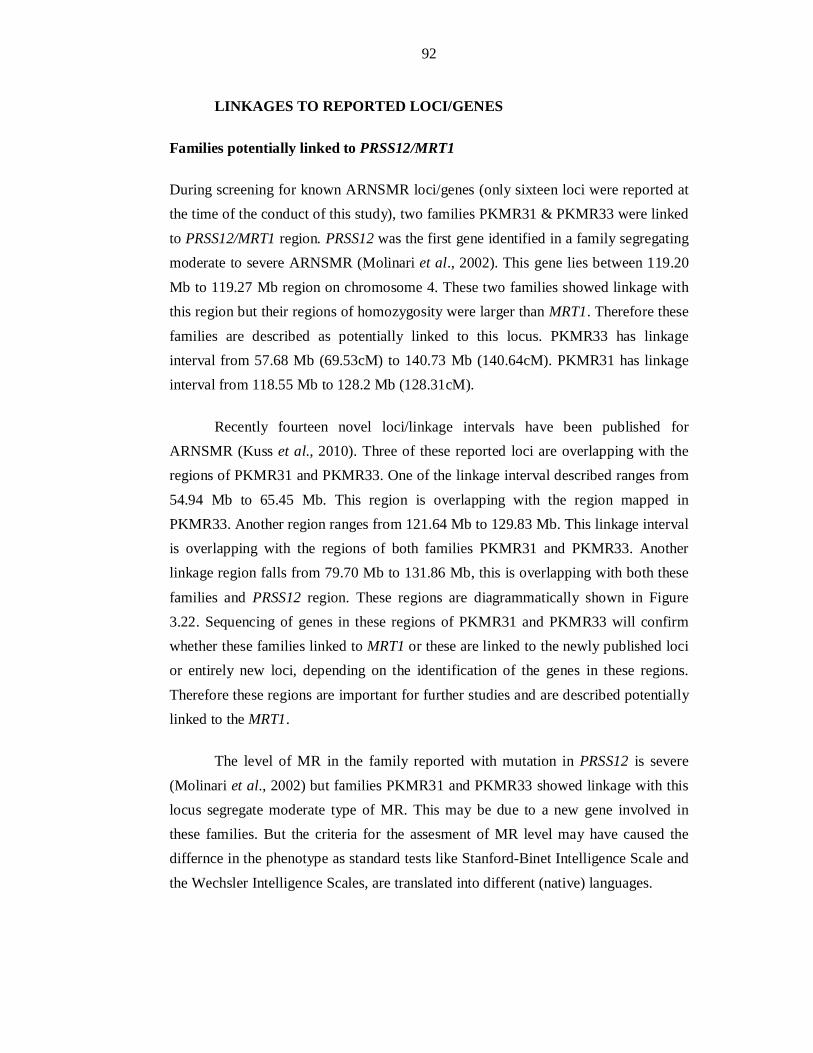
92
LINKAGES TO REPORTED LOCI/GENES
Families potentially linked to PRSS12/MRT1
During screening for known ARNSMR loci/genes (only sixteen loci were reported at the time of the conduct of this study), two families PKMR31 & PKMR33 were linked to PRSS12/MRT1 region. PRSS12 was the first gene identified in a family segregating moderate to severe ARNSMR (Molinari et al., 2002). This gene lies between 119.20 Mb to 119.27 Mb region on chromosome 4. These two families showed linkage with this region but their regions of homozygosity were larger than MRT1. Therefore these families are described as potentially linked to this locus. PKMR33 has linkage interval from 57.68 Mb (69.53cM) to 140.73 Mb (140.64cM). PKMR31 has linkage interval from 118.55 Mb to 128.2 Mb (128.31cM).
Recently fourteen novel loci/linkage intervals have been published for ARNSMR (Kuss et al., 2010). Three of these reported loci are overlapping with the regions of PKMR31 and PKMR33. One of the linkage interval described ranges from 54.94 Mb to 65.45 Mb. This region is overlapping with the region mapped in PKMR33. Another region ranges from 121.64 Mb to 129.83 Mb. This linkage interval is overlapping with the regions of both families PKMR31 and PKMR33. Another linkage region falls from 79.70 Mb to 131.86 Mb, this is overlapping with both these
families and PRSS12 region. These regions are diagrammatically shown in Figure 3.22. Sequencing of genes in these regions of PKMR31 and PKMR33 will confirm whether these families linked to MRT1 or these are linked to the newly published loci or entirely new loci, depending on the identification of the genes in these regions. Therefore these regions are important for further studies and are described potentially linked to the MRT1.
The level of MR in the family reported with mutation in PRSS12 is severe (Molinari et al., 2002) but families PKMR31 and PKMR33 showed linkage with this locus segregate moderate type of MR. This may be due to a new gene involved in these families. But the criteria for the assesment of MR level may have caused the differnce in the phenotype as standard tests like Stanford-Binet Intelligence Scale and the Wechsler Intelligence Scales, are translated into different (native) languages.
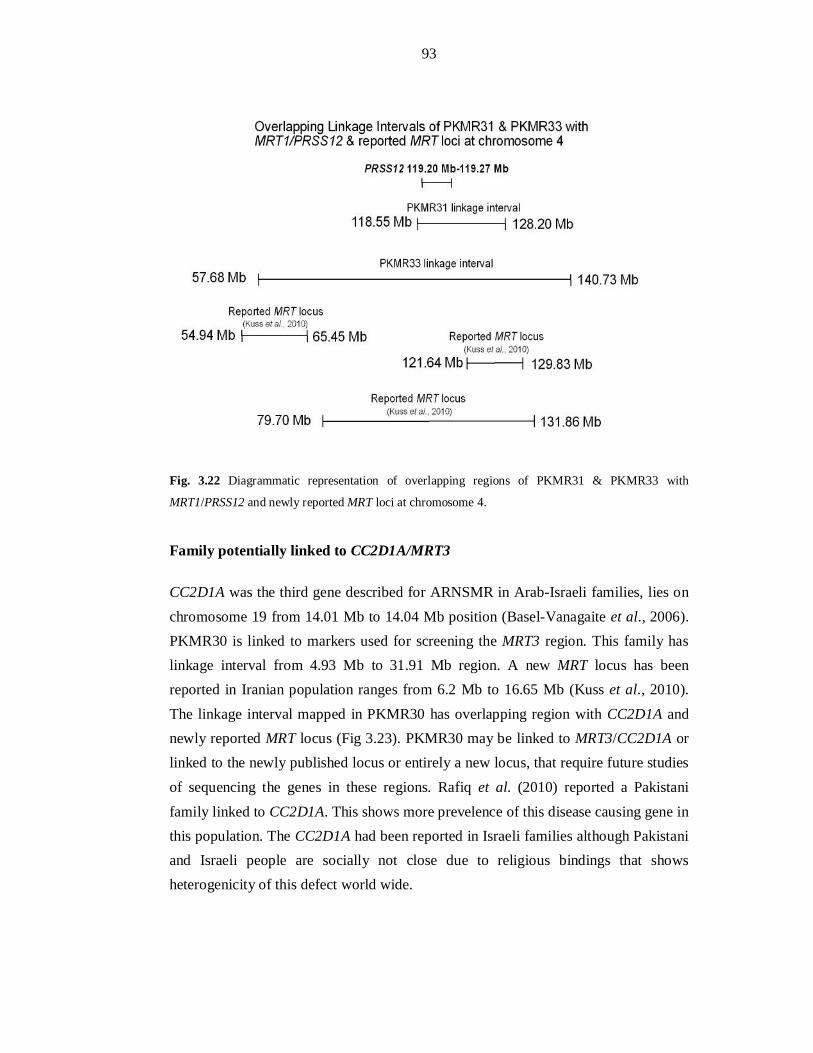
93
Fig. 3.22 Diagrammatic representation of overlapping regions of PKMR31 & PKMR33 with
MRT1/PRSS12 and newly reported MRT loci at chromosome 4.
Family potentially linked to CC2D1A/MRT3
CC2D1A was the third gene described for ARNSMR in Arab-Israeli families, lies on chromosome 19 from 14.01 Mb to 14.04 Mb position (Basel-Vanagaite et al., 2006). PKMR30 is linked to markers used for screening the MRT3 region. This family has linkage interval from 4.93 Mb to 31.91 Mb region. A new MRT locus has been reported in Iranian population ranges from 6.2 Mb to 16.65 Mb (Kuss et al., 2010). The linkage interval mapped in PKMR30 has overlapping region with CC2D1A and newly reported MRT locus (Fig 3.23). PKMR30 may be linked to MRT3/CC2D1A or linked to the newly published locus or entirely a new locus, that require future studies of sequencing the genes in these regions. Rafiq et al. (2010) reported a Pakistani family linked to CC2D1A. This shows more prevelence of this disease causing gene in this population. The CC2D1A had been reported in Israeli families although Pakistani and Israeli people are socially not close due to religious bindings that shows heterogenicity of this defect world wide.
94
Fig. 3.23 Diagrammatic representation of overlapping regions of PKMR30 with MRT3/CC2D1A and
newly reported MRT locus at chromosome 19.
Families linked to MRT4 and MRT5
Two families linked to MRT loci in which genes have not been mapped until now and
reduced the reported linkage intervals. These families will be helpful for hunting
disease causing genes as by reducing the region. Uyguner et al. (2007) described
MRT4 in a Turkish family at chromosome 1 from 136.88cM to 145.45cM. PKMR82
linked to MRT4 and refined the reported 8.57cM region to 5.06cM.
MRT5 was reported in Iranian family at chromosome 5 spanning from 5.09
Mb to 10.74 Mb (Najmabadi et al., 2007). PKMR98 linked to MRT5 at chromosome 5
from 4.99 Mb to 9.61 Mb and reduced reported 5.65 Mb interval to 4.52 Mb. Two
other families PKMR13 & PKMR124 showed linkage with marker D5S630 defining
linkage interval from 8.19 Mb to 10.55 Mb. These families refined the reported MRT5
interval to 2.36 Mb (1.8cM) which is important for further studies (Fig.3.9). Another
Iranian family has been reported linked to MRT5 from 5.09 Mb to 10.73 Mb (Kuss et
al., 2010). MRT4 and MRT5 were reported in Turkish and Iranian population
respectively. These two counties are religiously and socially close to Pakistan
therefore families linked to these loci may carry common gene defect.
95
NOVEL LINKAGE INTERVALS
MAPPING OF A NOVEL MRT LOCUS AT CHROMOSOME 11q14.1
It is difficult to find group of families linked to a single locus/gene in mental retardation. Only two of the ARNSMR genes published to date have been identified in more than one family or clan (Kaufman et al., 2010). The gene identification in the reported MRT loci is difficult as these regions are quite lengthy (Najmabadi et al., 2007; Rafiq et al., 2010 & Kuss et al., 2010). The novel locus at chromosome 11 in this study has been mapped in a group of three families with refined region of 1.5cM (2.69Mb).
Three affected individuals (VI: 7, VI: 8 and VI: 9) of PKMR95 have
homozygous region from 81.57 Mb to 101.05 Mb. Affected individual (VII: 2) of second loop of this family has linkage with marker D11S901 (81.84 Mb) defining the linkage interval of 2.69 Mb (1.5cM) for this family from 81.57 Mb to 84.26 Mb (Fig 3.11) and maximum two point LOD score of 3.34 was generated with the marker D11S901. Another family PKMR143 has linkage interval from 79.19 Mb to 101.05 Mb. Third family PKMR48 showed two linked regions at markers D11S901 (81.84 Mb) and D11S4175 (90.25 Mb). Linkage intervals of PKMR143 and affected individuals of PKMR95 in sixth generation are linked to both regions of PKMR48
(Fig 3.14). While affected individual in seventh generation has linkage interval overlapping with only one of linked region of PKMR48. Therefore it is anticipated that PKMR48 may have same disease causing defect as PKMR95 and PKMR143 or different from these families. PKMR143 may have defective gene same as for PKMR95 due to their overlapping linkage regions or linked to second region of homozygosity in PKMR48. It is possible that these families may have digenic cause of mental retardation so future studies for these regions are important.
These three families were enrolled from cities of three different provinces, Karachi (Sindh), Lahore (Punjab) and Sawat (Khaberpakhtoon). This describes prevalence of this chromosome 11 specific disorder. All of these families have moderate type of mental retardation that indicates a common mutational hot spot.
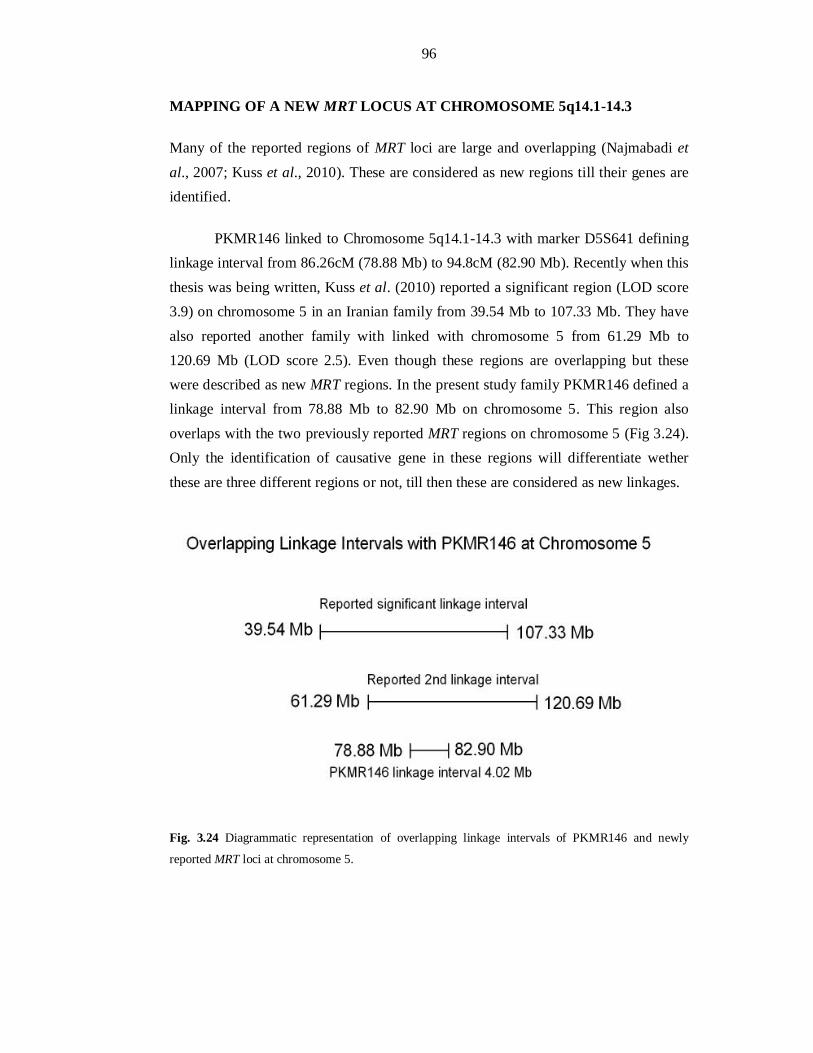
96
MAPPING OF A NEW MRT LOCUS AT CHROMOSOME 5q14.1-14.3
Many of the reported regions of MRT loci are large and overlapping (Najmabadi et al., 2007; Kuss et al., 2010). These are considered as new regions till their genes are identified.
PKMR146 linked to Chromosome 5q14.1-14.3 with marker D5S641 defining linkage interval from 86.26cM (78.88 Mb) to 94.8cM (82.90 Mb). Recently when this thesis was being written, Kuss et al. (2010) reported a significant region (LOD score 3.9) on chromosome 5 in an Iranian family from 39.54 Mb to 107.33 Mb. They have also reported another family with linked with chromosome 5 from 61.29 Mb to 120.69 Mb (LOD score 2.5). Even though these regions are overlapping but these were described as new MRT regions. In the present study family PKMR146 defined a linkage interval from 78.88 Mb to 82.90 Mb on chromosome 5. This region also overlaps with the two previously reported MRT regions on chromosome 5 (Fig 3.24). Only the identification of causative gene in these regions will differentiate wether these are three different regions or not, till then these are considered as new linkages.
Fig. 3.24 Diagrammatic representation of overlapping linkage intervals of PKMR146 and newly
reported MRT loci at chromosome 5.
97
POTENTIAL LOCUS AT CHROMOSOME 22q12.1-12.3
PKMR118 linked to Chromosome 22q12.1-12.3 with a LOD score of 2.2 at (θ=0) at
marker D22S280. This linkage interval of 8.2cM (8.36 Mb) can be described as
potential region for new locus for ARNSMR. This family has history of epilepsy. Few
affecteds in a family result in non significance of statistical values i.e. LOD score
below 3. Najmabadi et al. (2007) reported four linkage intervals with LOD scores
below three. Recently Kuss et al. (2010) also described thirteen non significant loci of
ARNSMR. The major difficulty in molecular characterization of this disability is
small family size with few affected individuals. Multigeneration affected families are
rare. Therefore finding a family that provides high enough LOD score is not common.
In few cases families with non significant LOD score also helped in identification of
MRT gene such as TRAPPC9 which has been mapped in a family which was reported
previously with LOD score 2.0 (Mir et al., 2009). The traditional cutoff of LOD score
< 3 is an arbitrary one and linkage studies of genetic diseases with few affected
members in a pedigree should be considered linked with somewhat lower cutoff.
All of the reported loci/genes for ARNSMR thus far have been identified through homozygosity mapping using microarray technology in consanguineous families. This method allows a fast genotyping of the individuals. But this technology results in finding long stretch of homozygous regions in the genome. While screening the homozygosity through microsatellite markers results in refined regions. This is quite evident in the new linkage intervals identified in this study. More refined linkage intervals helps to find the disease causing genes, which would lie within the region.
The present study resulted in mapping of three novel linkage intervals at
chromosome 5q14.1-14.3, 11q14.1 and 22q12.1-12.3 for ARNSMR. Three families
were found potentially linked to already reported genes; PKMR31 & PKMR33
(MRT1/PRSS12) and PKMR30 (MRT3/CC2D1A). Four families PKMR82 (MRT4)
and PKMR98, PKMR13 & PKMR 124 (MRT5) linked to MRT loci and reduced the
reported linkage intervals.
This study will help in the identification of new candidate disease genes and
finding the mechanism involved of this disability. The genetic determinants being

98
uncovered will help in understanding the molecular processes involved in learning
and memory. This study will also be helpful in reducing this disorder by genetic
counseling through carrier screening in normal individuals of related families. This, in
turn, will help in prevention and treatment of this disorder in the future.

99
SECTION-1
REFERENCES
100
Ashley, C.T.J., Wilkinson, K.D., Reines, D., Warren, S.T. (1993) FMR1 protein: conserved RNP family domains and selective RNA binding. Science 262:563–566.
Backx, L., Vermeesch, J., Pijkels, E., de Ravel de l'Argentière, T., Seuntjens, E., Van Esch, H. (2010) PPP2R2C, a gene disrupted in autosomal dominant intellectual disability. Eur J Hum Genet 53 (5):239-243.
Bartley, J.A., Hall, B.D. (1978) Mental retardation and multiple congenital anomalies of unknown etiology: frequency of occurrence in similarly affected sibs of the proband. Birth Defects Res Clin & Mol Terat 14:127–137.
Basel-Vanagaite, L. (2007) Genetics of autosomal recessive non-syndromic mental retardation: recent advances. Clin Genet 72:167-174.
Basel-Vanagaite, L., Alkelai, A., Straussberg, R., Magal, N., Inbar, D., Mahajna, M. and Shohat, M. (2003) Mapping of a new locus for autosomal recessive non-syndromic mental retardation in the chromosomal region 19p13.12-p13.2: further genetic heterogeneity. J Medl Genetics 40:729-732.
Basel-Vanagaite, L., Attia, R., Yahav, M., Ferland, R.J., Anteki, L., Walsh, C.A., Olender, T., Straussberg, R.,
Magal, N., Taub, E., Drasinover, V., Alkelai, V., Bercovich, D., Rechavi, G., Simon, A.J. and Shohat, M. (2006) The CC2D1A, a member of a new gene family with C2 domains, is involved in autosomal recessive nonsyndromic mental retardation. J Med Genet 43:203-210.
Berkel, S., Marshall, C.R., Weiss, B., et al. (2010) Mutations in the SHANK2 synaptic scaffolding gene in Autism Spectrum Disorder and mental retardation. Nat Genet.
Bhalla, K., Luo, Y., Buchan, T., et al. (2008) Alterations in CDH15 and KIRREL3 in patients with mild to severe intellectual disability. Am J Hum Genet 83:703–13.
Bittles, A. H., Black, M. L. (2010) Consanguinity, human evolution, and complex diseases. PNAS 107(1):1779-86.
Botstein, D., White, R. L., Skolnick, M., Davis, R. W. (1980) Construction of a genetic linkage map in man using restriction fragment length polymorphisms. Am J Hum Genet 32:314-331.
Chelly, J., Khelfaoui, M., Francis, F., Cherif, B., Bienvenu, T. (2006) Genetics and pathophysiology of mental retardation. Eur J Hum Genet 14:701–713.
Chiurazzi, P., Schwartz, C.E., Gecz, J., Neri, G. (2008). XLMR genes: update 2007. Eur J Hum Genet 16: 422–434.
Conneally, P. M., Rivas, (1980) Linakge analysis in man (New York, Plenum).
Couvert, P., Bienvenu, T., Aquaviva, C., et al. (2001) MECP2 is highly mutated in X-linked mental retardation. Hum Mol Genet 10:941–6.
Curry, C.J., Stevenson, R.E., Aughton, D., Byrne, J., Carey, J.C., Cassidy, S., Cunniff, C., Graham, Jr. J.M., Jones, M.C., Kaback, M.M., Moeschler, J., Schaefer, G.B., Schwartz, S., Tarleton, J. and Opitz, J. (1997) Evaluation of Mental Retardation: Recommendations of a Consensus Conference. Am J Med Genet 72:468-477.
Dahl, C., Grønskov, K., Larsen, L.A., Guldberg, P., Nielsen, K.B. (2007) A Homogeneous Assay for Analysis of FMR1 Promoter Methylation in Patients with Fragile X Syndrome. Clinic Chem 53:790-793.
Dotti, M.T., Orrico, A., De Stefano, N., Battisti, C., Sicurelli, F., Severi, S., et al. (2002) A Rett Syndrome MECP2 mutation that causes mental retardation in men. Neurology 58:226–30.
101
DSM-IV; Diagnostic and statistical manual of mental disorders, Text Revision. 4th ed. (2000) Washington: American Psychiatric Association.
Durkin, M.S., Hasan, Z.M., Hasan, K.Z. (1998) Prevalence and correlates of mental retardation among children in Karachi, Pakistan. Am J Epidemiol 147:281–8.
Eichler, E.E., Richards, S., Gibbs, R.A., Nelson, D.L. (1993) Fine structure of the human FMR1 gene. Hum Mol Genet 2:1147-1153.
Faber, E.S., Sah, P. (2003) Calcium-activated potassium channels: multiple contributions to neuronal function. Neuroscientist 9:181–194.
Feder, H.E., Reyniers, E., Uhrig, S., Golla, A., Wauters, J., Kroisel, P., Bossuyt, P., Rost, I., Jedele, K., Zierler, H., Schwab, S., Wildenauer, D., Speicher, M., Willems, P.J., Meitinger, T., Kooy, R.F. (2000) Familiar mental retardation syndrome ATR-16 due to an inherited cryptic subtelomeric translocation t(3;16)(q29;p13.3). Am J Hum Genet 66:16-25.
Flint, J., Wilkie, A.O.M., Buckle, V.J., Winter, R.B., Holland, A.J., McDermid, H.E. (1995) The detection of
subtelomeric chromosomal rearrangements in idiopathic mental retardation. Nat Genet 9:132-139.
Foroud, T. (1997) Introduction to genetic linkage analysis. Cancer Invest 15:548-552.
Friocourt, G., Poirier, K., Rakic, S., Parnavelas, J.G., Chelly, J. (2006) The role of ARX in cortical development. Eur J Neurosci 23:869–76.
Garshasbi, M., Kahrizi, K., Tzschach, A., et al. (2009) ZC3H14 mutations cosegregate with Non-Syndromic Autosomal Recessive Mental Retardation (NS-ARMR) in two Iranian families. American Society of Human Genetics Meeting: 190.
Garshasbi, M., Hadavi, V., Habibi, H., Kahrizi, K., Kariminejad, R., Behjati, F., Tzschach, A., Najmabadi, H., Ropers, H.H. and Kuss, A.W. (2008) A Defect in the TUSC3 Gene is Associated with Autosomal Recessive Mental Retardation. Am J Hum Genet 82:1-7.
Giannandrea, M., Bianchi, V., Mignogna, M.L., Sirri, A., Carrabino, S., D'Elia, E., Vecellio, M., Russo, S., Cogliati, F., Larizza, L., Ropers, H.H., Tzschach, A., Kalscheuer, V., Oehl-Jaschkowitz, B., Skinner, C., Schwartz, C.E., Gecz, J., Van Esch, H., Raynaud, M., Chelly, J., de Brouwer, A.P., Toniolo, D., D'Adamo, P. (2010) Mutations in the small GTPase gene RAB39B are responsible for X-linked mental retardation associated with autism, epilepsy, and macrocephaly. Am J Hum Genet 12;86(2):185-95.
Gibbons, R.J., Pellagatti, A., Garrick, D., Wood, W.G., Malik, N., Ayyub, H., et al. (2003) Identification of acquired somatic mutations in the gene encoding chromatin-remodeling factor ATRX in the Alpha-Thalassemia Myelodysplasia Syndrome (ATMDS). Nat Genet 34:446–9.
Glasel, J. A. (1995) Validity of Nucleic Acid Purities Monitored by A260/A280 Absorbance Ratios. Biotechniques 18:62-63.
Gosso, M.F., de Geus, E.J., Polderman, T.J., Boomsma, D.I., Heutink, P., Posthuma, D. (2008) Common variants underlying cognitive ability: further evidence for association between the SNAP-25 gene and cognition using a family-based study in two independent Dutch cohorts. Genes Brain Behav 7:355–64.
Grahn, A., Barkhordar, G.S., Larson, G. (2002) Cloning and sequencing of nineteen transcript isoforms of the human alpha2, 3-sialyltransferase gene, ST3Gal III; its genomic organisation and expression in human tissues. Glycoconj J 19:197–210.
Griggs, B.L., Ladd, S., Saul, R.A., DuPont, B.R., Srivastava, A.K. (2008) Dedicator of cytokinesis 8 is disrupted in two patients with mental retardation and developmental disabilities. Genomics 91:195–202.
Grimberg, J., Nawoschik, S., Belluscio, L., McKee, R., Turck, A., Eisenberg, A. (1989) A simple and efficient non-organic procedure for the isolation of genomic DNA from blood. Nucl Acids Res 17:8390.
102
Guerrini, R., Shanahan, J.L., Carrozzo, R., Bonanni, P., Higgs, D.R., Gibbons, R.J. (2000) A nonsense mutation of the ATRX gene causing mild mental retardation and epilepsy. Ann Neurol 47:117–21.
Gustavson, K.H. (2005) Review article: Prevalence and aetiology of congenital birth defects, infant mortality and mental retardation in Lahore, Pakistan: A prospective cohort study. Acta Pædiatrica 94:769–774.
Hamdan, F.F., Gauthier, J., Spiegelman, D., et al. (2009) Mutations in SYNGAP1 in autosomal nonsyndromic mental retardation. N Engl J Med 360:599–605.
Hamdan, F.F., Piton, A., Gauthier, J., et al. (2009) De novo STXBP1 mutations in mental retardation and nonsyndromic epilepsy. Ann Neurol 65:748–53.
Hawkins, M., Boyle, J., Wright, K.E., Elles, R., Ramsden, S.C., O’Grady, A., Sweeney, M., Barton, D.E., Burgess, T., Moore, M., Burns, C., Stacey, G., Gray, E., Metcalfe, P., Hawkins, J.R. (2011) Preparation and validation of the first WHO international genetic reference panel for Fragile X syndrome. Eur J Hum Genet 19:10–17.
Higgins, J.J., Pucilowska, J., Lombardi, R.Q., Rooney, J.P. (2004) A mutation in a novel ATP-dependent Lon protease gene in a kindred with mild mental retardation. Neurology 23;63(10):1927-31.
Hinds, H.L., Ashley, C.T., Sutcliffe, J.S., Nelson, D.L., Warren, S.T., Housman, D.E., Schalling, M. (1993) Tissue specific expression of FMR-1 provides evidence for a functional role in fragile X syndrome. Nat Genet 3: 36–43.
Hodapp, R.M., DesJardin, J.L., Ricci, L.A. (2003) Genetic Syndromes of Mental Retardation. Infant Young Child 16:152–160.
Howard, M.T., Malik, N., Anderson, C.B., Voskuil, J.L., Atkins, J.F., Gibbons, R.J. (2004) Attenuation of an amino-terminal premature stop codon mutation in the ATRX gene by an alternative mode of translational initiation. J Med Genet 41:951–6.
Hu, W.H., Pendergast, J.S., Mo, X.M., et al. (2005) NIBP, a novel NIK and IKK (beta)-binding protein that enhances NF-(kappa)B activation. J Biol Chem 280:29233–41.
Hussain, R., Bittles, A.H. (1998) The prevalence and demographic characteristics of consanguineous marriages in Pakistan. J Biosoc Sci 30:261–275.
Inlow, J.K., Restifo, L.L. (2004) Molecular and comparative genetics of mental retardation. Genetics 166:835–881.
Jin, P., Warren, S.T. (2000) Understanding the molecular basis of fragile X syndrome. Hum Mol Genet 9(6): 901-908.
Jo, S., Lee, K.H., Song, S., Jung, Y.K., Park, C.S. (2005) Identification and functional characterization of cereblon as a binding protein for largeconductance calcium-activated potassium channel in rat brain. J Neurochem 94:1212–1224.
Kaufman, L., Ayub, M., Vincent, J.B. (2010) The genetic basis of non-syndromic intellectual disability: a review. J Neurodev Disord 2(4):182-209.
Kleefstra, T., Hamel, B.C. (2005) X-linked mental retardation: further lumping, splitting and emerging phenotypes. Clin Genet 67:451–67.
Knight, S.J.L., Regan, R., Nicod, A., Horsley, S.W., Kearney, L., Homfray, T., Winter, R.M., Bolton, P., Flint, J. (1999) Subtle chromosomal rearrangements in children with unexplained mental retardation. Lancet 354:1676-1681.
Kuss, A.W., Garshasbi, M., Kahrizi, K., Tzschach, A., Behjati, F., Darvish, H., Abbasi-Moheb, L., Puettmann, L., Zecha, A., Weissmann, R., Hu, H., Mohseni, M., Abedini, S.S., Rajab, A., Hertzberg, C.,
103
Wieczorek, D., Ullmann, R., Ghasemi-Firouzabadi, S., Banihashemi, S., Arzhangi, S., Hadavi, V., Bahrami-Monajemi, G., Kasiri, M., Falah, M., Nikuei, P., Dehghan, A., Sobhani, M., Jamali, P., Ropers, H.H., Najmabadi, H. (2011) Autosomal recessive mental retardation: homozygosity mapping identifies 27 single linkage intervals, at least 14 novel loci and several mutation hotspots. Hum Genet 129(2):141-8.
Lander, E.S., Botstein, D. (1987) Homozygosity mapping: a way to map human recessive traits with the DNA of inbred children. Science 236:1567–70.
Lee, L. G., Spurgeon, S. L., Heiner, C. R., Benson, S. C., Rosenblum, B. B., Menchen, S. M., Graham, R. J., Constantinescu, A., Upadhya, K. G., Cassel, J. M. (1997) New energy transfer dyes for DNA sequencing. Nucl Acids Res 25:2816-2822.
Lejeune, J., Turpin, R., Gautier, M. (1959) Mongolism: a chromosomal disease (trisomy). Bull. Acad. Natl Med 143:256–265
Leung, S.W., Apponi, L.H., Cornejo, O.E., Kitchen, C.M., Valentini, S.R., Pavlath, G.K., et al. (2009) Splice variants of the human ZC3H14 gene generate multiple isoforms of a zinc finger polyadenosine RNA binding protein. Gene 439:71–8.
Linder, T.H., Hoffmann, K. (2005) easyLINKAGE: A PERL script for easy and automated two-/multipoint linkage analyses. Bioinformatics 21:405-407.
Liu, Z., Xu, D., Zhao, Y., Zheng, J. (2010) Non-syndromic mild mental retardation candidate gene CDKL3 regulates neuronal morphogenesis. Neurobiol Dis 39(3):242-51.
Mandel, J.L., Chelly, J. (2004) Monogenic X-linked mental retardation: is it as frequent as currently estimated? The paradox of the ARX (Aristaless X) mutations. Eur J Hum Genet 12:689–93.
Martınez-Garay, I., Toma´s, M., Oltra, S., Ramser, J., Molto, M.D., Prieto, F., Meindl, A., Kutsche, K., Martınez, F. (2007) A two base pair deletion in the PQBP1 gene is associated with microphthalmia, microcephaly, and mental retardation. Eur J Hum Genet 15:29–34.
McLaren, J., Bryson, S.E. (1987) Review of recent epidemiological studies of mental retardation: prevalence, associated disorders, and etiology. Am J Ment Retard 92:243–54.
Mefford, H.C., Trask, B.J. (2002) The complex structure and dynamic evolution of human subtelomeres. Nat Rev Genet 3: 91-102.
Mir, A., Kaufman, L., Noor, A., Motazacker, M.M., Jamil, T., Azam, M., Kahrizi, K., Rafiq, M.A., Weksberg, R., Nasr, T., Naeem, F., Tzschach, A., Kuss, A.W., Ishak, G.E., Doherty, D., Ropers, H.H., Barkovich, A.J., Najmabadi, H., Ayub, M., Vincent, J.B. (2009) Identification of mutations in TRAPPC9, which encodes the NIK- and IKK-beta-binding protein, in nonsyndromic autosomal-recessive mental retardation. Am J Hum Genet 85(6):909-15.
Mochida, G.H., Mahajnah, M., Hill, A.D., Basel-Vanagaite, L., Gleason, D., Hill, R.S., Bodell, A., Crosier, M.,
Straussberg, R., Walsh, C.A. (2009) A truncating mutation of TRAPPC9 is associated with autosomal-recessive intellectual disability and postnatal microcephaly. Am J Hum Genet 85(6):897-902.
Modell, B., Darr, A. (2002) Science and society: genetic counselling and customary consanguineous marriage. Nat Rev Genet 3:225–9.
Moheb, L.A., Jensen, L.R., Garshasbi, M., et al. (2009) Two independent mutations in the ZNF526 gene are associated with nonsyndromic autosomal recessive mental retardation. American Society of Human Genetics Meeting:2078.
Molinari, F., Foulquier, F., Tarpey, P.S., Morelle, W., Boissel, S., Teague, J., Edkins, S., Futreal, P.A., Stratton, M.R., Turner, G., Matthijs, G., Gecz, J., Munnich, A., Colleaux, L. (2008) Oligosaccharyltransferase-Subunit Mutations in Nonsyndromic Mental Retardation. Am J Hum Genet 82:1–8.
104
Molinari, F., Rio, M. Meskenatic, V., Encha-Razavi, F., Auge, V., Bocq, D., Briault, S., Vekemans, M., Munnich, A., Attie-Bitach, T., Souderegger, P. and Colleaux, L. (2002) Truncating neurotrypsin mutation in autosomal recessive nonsyndromic mental retardation. Science 298, 1779-1781.
Motazacker, M.M., Rost, B.R., Hucho, T., Garshasbi, M., Kahrizi, K., Ullmann, B., Abedini, S.S., Nieh, S.E., Amini, S.H., Goswami, C., Tzschach, A., Jensen, L.R., Schmitz, D., Ropers, H.H., Najmabadi, H., Kuss, A.W. (2007) A defect in the ionotropic glutamate receptor 6 gene (GRIK2) is associated with autosomal recessive mental retardation. Am J Hum Genet 81:792-798.
Najmabadi, H., Garshasbi, M., Bahman, I., et al. (2009) Homozygosity mapping in 4 unrelated Iranian families with autosomal recessive mental retardation identifies overlapping linkage intervals on chromosome 1p34: a frequent cause of ARMR? American Society of Human Genetics Meeting:2019.
Najmabadi, H., Motazacker, M.M., Garshasbi, M., Kahrizi, K., Tzschach, A., Chen, W., Behjati, F., Hadavi, V., Nieh, S.E., Abedini, S.S., Vazifehmand, R., Firouzabadi, S.G., Jamali, P., Falah, M., Seifati, S.M., Grüters, A., Lenzner, S., Jensen, L.R., Rüschendorf, F., Kuss, A.W., Ropers, H.H. (2007) Homozygosity mapping in consanguineous families reveals extreme heterogeneity of nonsyndromic autosomal recessive mental retardation and identifies 8 novel gene loci. Hum Genet 121:43–48.
Orio, P., Rojas, P., Ferreira, G., Latorre, R. (2002) New disguises for an old channel: MaxiK channel b-subunits. News Physiol Sci 17: 156–161.
Orrico, A., Lam, C., Galli, L., Dotti, M.T., Hayek, G., Tong, S.F., et al. (2000) MECP2 mutation in male patients with non-specific X-linked mental retardation. FEBS Lett 481:285–8.
Ott, J. (1991) Analysis of human linkage (Baltimore and London, John Hopkinís University Press).
Ou, X.M., Lemonde, S., Jafar-Nejad, H., Bown, C.D., Goto, A., Rogaeva, A., Albert, P.R. (2003). Freud-1: a neuronal calcium-regulated repressor of the 5-HT1A receptor gene. J Neurosci 23:7415–7425.
Penrose, L. (1938) A Clinical and Genetic Study of 1280 Cases of Mental Defect, HMSO, London.
Philippe, O., Rio, M., Carioux, A., et al. (2009) Combination of linkage mapping and microarray expression analysis identifies NF-kappaB signaling defect as a cause of autosomal-recessive mental retardation. Am J Hum Genet 85:903–8.
Rafiq, M.A., Ansar, M., Marshall, C.R., Noor, A., Shaheen, N., Mowjoodi, A., Khan, M.A., Ali, G., Amin-ud-Din, M., Feuk, L., Vincent, J.B., Scherer, S.W. (2010) Mapping of three novel loci for non-syndromic autosomal recessive mental retardation (NS-ARMR) in consanguineous families from Pakistan. Clin Genet 78(5):478-83.
Rauch, A., Hoyer, J., Guth, S., et al. (2006) Diagnostic yield of various genetic approaches in patients with unexplained developmental delay or mental retardation. Am J Med Genet 140:2063–74.
Rogaeva, A., Galaraga, K., Albert, P.R. (2007) The Freud-1/ CC2D1A family: transcriptional regulators implicated in mental retardation. J Neurosci Res 85:2833-2838.
Ropers, H.H. (2010) Genetics of early onset cognitive impairment. Annu Rev Genomics Hum Genet 22;11:161-87.
Ropers, H.H., Hamel, B.C. (2005) X-linked mental retardation. Nat Rev Genet 6:46–57.
Ropers, H.H. (2008) Genetics of intellectual disability. Curr Opin Genet Dev 18(3):241-50.
Ropers, H.H., Hamel B.C. (2005) X-linked mental retardation. Nat Rev Genet 6:46-57.
Rotanova, T.V., Botos, I., Melnikov, E.E., Rasulova, F., Gustchina, A., Maurizi, M.R., Wlodawer, A. (2006) Slicing a protease: structural features of the ATP-dependent Lon proteases gleaned from investigations of isolated domains. Prot Sci 15:1815–1828.
105
Siomi, H., Siomi, M.C., Nussbaum, R.L., Dreyfuss, G. (1993) The protein product of the fragile X gene, FMR1, has characteristics of an RNA-binding protein. Cell 74:291–298.
Sofocleous, C., Kolialexi, A., Mavrou, A. (2009) Molecular diagnosis of Fragile X syndrome. Exp Rev Mol Diag 9(1):23-30.
Stevenson, R.E., Schwartz, C.E. and Schroer, R.J. (2000) X-linked mental retardation. New York, Oxford: Oxford University Press
Terwillger, J. D., Ott, J. (1994) Handbook of human genetic linkage (Baltimore, John Hopkins University Press).
Uyguner, O., Kayserili, H., Li, Y., Karaman, B., Nu¨ rnberg, G., Hennies, H.C., Becker, C., Nu¨ rnberg, P., Basxaran, S., Apak, M.Y., Wollnik, B. (2007) A new locus for autosomal recessive non-syndromic mental retardation maps to 1p21.1-p13.3. Clin Genet 71:212–219.
Uyguner, Z.O., Wollnik, B., Kayserili, H., Tükel, T., Basaran, S., Apak, M.Y. (2000) Establishment of a Nonradioactive Molecular Diagnosis of Fragile-X Syndrome. Tur J Med Sci 30:253–260.
Van-Buggenhout, G.J., Trommelen, J.C.M., Brunner, H.G., Hamel, B.C.J., Fryns, J.P. (2001) Clinical etiological survey of a population of 471 mentally retarded patients living in an institution in the Southern part of the Netherlands. Commun Genet. 4:109–122.
Wagenstaller, J., Spranger, S., Lorenz-Depiereux, B., et al. (2007) Copy-number variations measured by single-nucleotide-polymorphism oligonucleotide arrays in patients with mental retardation. Am J Hum Genet 81:768–79.
Warren, S.T., Nelson, D.L. (1994) Advances in molecular analysis of fragile X syndrome. J Am Med Assoc 27:536-542.
Warren, S.T., Sherman, S.L. (2001) The fragile X syndrome. In: Scriver, C.R., Beaudet, A.L., Sly, W.S., Valle, D. eds. metabolic basis of inherited disease. 8th ed. New York. McGraw-Hill 1257–1290.
WHO: The ICD-10 classification of mental and behavioural disorders (WHO,1992).
Winnepenninckx, B., Rooms, L. and, Kooy, F. (2003) Mental retardation:a review of the genetic causes. British J Dev Disab 49(1):29-44
Wright, S.W., Tarjan, G., Eyer, L. (1959) Investigation of families with two or more mentally defective siblings: clinical observations. Am J Dis Child 97:445–456.
Xin, W., Xiaohua, N., Peilin, C., Xin, C., Yaqiong, S., Qihan, W. (2008) Primary function analysis of human mental retardation related gene CRBN. Mol Bio Rep 35:251–256.
Yaqoob, M., Bashir, A., Tareen, K., Gustavson, K.H., Nazir, R., Jalil, F., et al. (1995) Severe mental retardation in 2 to 24-month-old children in Lahore, Pakistan: a prospective cohort study. Acta Paediatr 84:267-72.
Yntema, H.G., Poppelaars, F.A., Derksen, E., Oudakker, A.R., van Roosmalen, T., Jacobs, A., et al. (2002) Expanding phenotype of XNP mutations: mild to moderate mental retardation. Am J Med Genet 110:243–7.
Zhu, X., Jiang, M., Peyton, M., Boulay, G., Hurst, R., Stephani, E., Birnbaumer, L. (1996) Trp, a novel mammalian gene family essential for agonistactivated capacitative Ca2+ entry. Cell 85:661–671.
106
ELECTRONIC DATABASE INFORMATION URL’s mostly used: Applied Biosystems:
www.appliedbiosystems.com
Center for Medical Genetics, Marshfield Medical Research Foundation:
http://research.marshfieldclinic.org/genetics/
Ensembl Genome Browser:
http://www.ensembl.org/
European Mental Retardation Consortium:
http://www.euromrx.com
Google Scholar:
http://scholar.google.com.pk/schhp
The GDB Human Genome Database:
http://www.gdb.org/
National Center for Biotechnology Information (NCBI):
http://www.ncbi.nlm.nih.gov/
Online Mendelian Inheritance in Man (OMIM):
http://www.ncbi.nlm.nih.gov/entrez/OMIM/
Primer3 Web-Based Server:
http://frodo.wi.mit.edu/cgi-bin/primer3/primer3_www.cgi/
PubMed (NCBI):
http://www.ncbi.nlm.nih.gov/entrez/query.fcgi/
The Human Genome Organization (HUGO):
http://www.gene.ucl.ac.uk/hugo/
UCSC Genome Browser:
http://genome.ucsc.edu/