Embed Size (px)
Citation preview
Molecular Cell, Vol. 11, 445–457, February, 2003, Copyright 2003 by Cell Press
The Kinesin-Related Protein MCAK Isa Microtubule Depolymerase that Formsan ATP-Hydrolyzing Complex at Microtubule Ends
al., 1996; Tournebize et al., 2000). Also, inhibition ofMCAK interferes with the poleward movement of chro-mosomes during anaphase A in CHO cells (Maney etal., 1998); again, this is consistent with MCAK depoly-merizing MTs because chromosome movement during
Andrew W. Hunter,2,5 Michael Caplow,3
David L. Coy,2 William O. Hancock,4 Stefan Diez,1
Linda Wordeman,2 and Jonathon Howard1,*1Max Planck Institute of Molecular Cell Biology
and Geneticsanaphase is associated with the shortening of the MTs01307 Dresdenthat connect the chromosome (via the kinetochore atGermanywhich MCAK is localized) to the pole. The finding that2 Department of Physiology and Biophysicsoverexpression of MCAK causes loss of MTs in in-University of Washingtonterphase as well as mitotic cells (Maney et al., 1998,Seattle, Washington 981952001), together with the high levels of expression of3 Department of Biochemistry and BiophysicsFKIF2 and mKIF2 in nondividing cells in the retina andUniversity of North Carolina Medical Schoolthe brain, suggests that Kin I kinesins also regulate MTChapel Hill, North Carolina 27599depolymerization outside of mitosis (Kinoshita et al.,4 Department of Bioengineering2001).Pennsylvania State University
The evidence that Kin I kinesins can depolymerizeUniversity Park, Pennsylvania 16802MTs in vitro is strong. Addition of purified, recombinantproteins to MTs that have been stabilized by taxol orthe slowly hydrolyzed GTP analog GMP-CPP causesSummaryalmost complete loss of polymer in the presence of ATPafter 10–30 min (Desai et al., 1999; Maney et al., 2001;MCAK belongs to the Kin I subfamily of kinesin-relatedNiederstrasser et al., 2002; Moores et al., 2002). Further-proteins, a unique group of motor proteins that aremore, when MTs are incubated with Kin I kinesins in thenot motile but instead destabilize microtubules. Wepresence of the nonhydrolyzable ATP analog AMP-PNP,show that MCAK is an ATPase that catalytically de-electron micrographs reveal curled protofilament struc-polymerizes microtubules by accelerating, 100-fold,tures at their ends (GMP-CPP-stabilized MTs; Desai etthe rate of dissociation of tubulin from microtubuleal., 1999) or in solution (taxol-stabilized MTs; Moores etends. MCAK has one high-affinity binding site per pro-al., 2002). This again supports a depolymerizing activitytofilament end, which, when occupied, has both thebecause protofilament curls are intermediate structuresdepolymerase and ATPase activities. MCAK targetsin the depolymerization pathway (Mandelkow et al.,protofilament ends very rapidly (on-rate 54 �M�1·s�1),1991; Muller-Reichert et al., 1998).perhaps by diffusion along the microtubule lattice,
In contrast to the evidence for depolymerization activ-and, once there, removes �20 tubulin dimers at a rateity, the evidence that Kin I kinesins are motors that move
of 1 s�1. We propose that up to 14 MCAK dimers as-along the MT surface is weak. An early report suggested
semble at the end of a microtubule to form an ATP-that mKIF2 has directed motility (Noda et al., 1995), but
hydrolyzing complex that processively depolymerizes we and others (Desai et al., 1999) have not been ablethe microtubule. to replicate this finding, and a critical examination of
the experimental methods indicates that contaminationIntroduction by kinesin or another plus-end-directed motor cannot
be ruled out.The Kin I proteins are an unusual subfamily of kinesin- With their unique functional and structural properties,related proteins (Kim and Endow, 2000; Lawrence et al., Kin I kinesins may provide a window into the mechanism2002): in the presence of ATP they do not move along by which motor proteins in general regulate the depoly-the surface of MTs (microtubules) like other motor pro- merization of MTs (Lombillo et al., 1995; Hunter andteins but instead bind to the ends of MTs and depolymer- Wordeman, 2000). There are many open questions aboutize them (Desai et al., 1999). The Kin I family includes how Kin I kinesins depolymerize MTs. How does a Kinmitotic centromere-associated kinesin (MCAK) from I kinesin get to the end of a MT? Does it stay at thehamster (Wordeman and Mitchison, 1995), mKIF2 from end of the MT while it removes tubulin dimers—is itmouse (Noda et al., 1995; Santama et al., 1998), XKCM1 processive? Or does it dissociate from the MT end withfrom Xenopus (Walczak et al., 1996), and FKIF from fish each tubulin dimer that it removes—is it nonprocessive?(Bost-Usinger et al., 1997). Consistent with the depoly- How is ATP hydrolysis coupled to the depolymerizationmerization activity of Kin I kinesins observed in vitro, reaction? Kin I proteins are classified as kinesins be-
cause they share the conserved motor domain that de-depletion or inhibition of XKCM1 increases the size offines this superfamily of proteins. Because the motorthe mitotic spindle in egg extracts, presumably by in-domain of conventional kinesin is an ATPase, it is ex-creasing the length of the constituent MTs (Walczak etpected that Kin I kinesins are also ATPases. However,the ATPase activity of Kin I kinesins has not been mea-*Correspondence: [email protected], and there are reports that ATP hydrolysis is not5 Present address: Department of Cell Biology and Anatomy, Medicalnecessary for the depolymerization activity (Moores etUniversity of South Carolina, 173 Ashley Avenue, P.O. Box 250508,
Charleston, South Carolina 29425. al., 2002). To address these questions, we have devel-
Molecular Cell446
oped assays to quantify simultaneously the depolymeri-zation and ATPase activities of MCAK.
Results
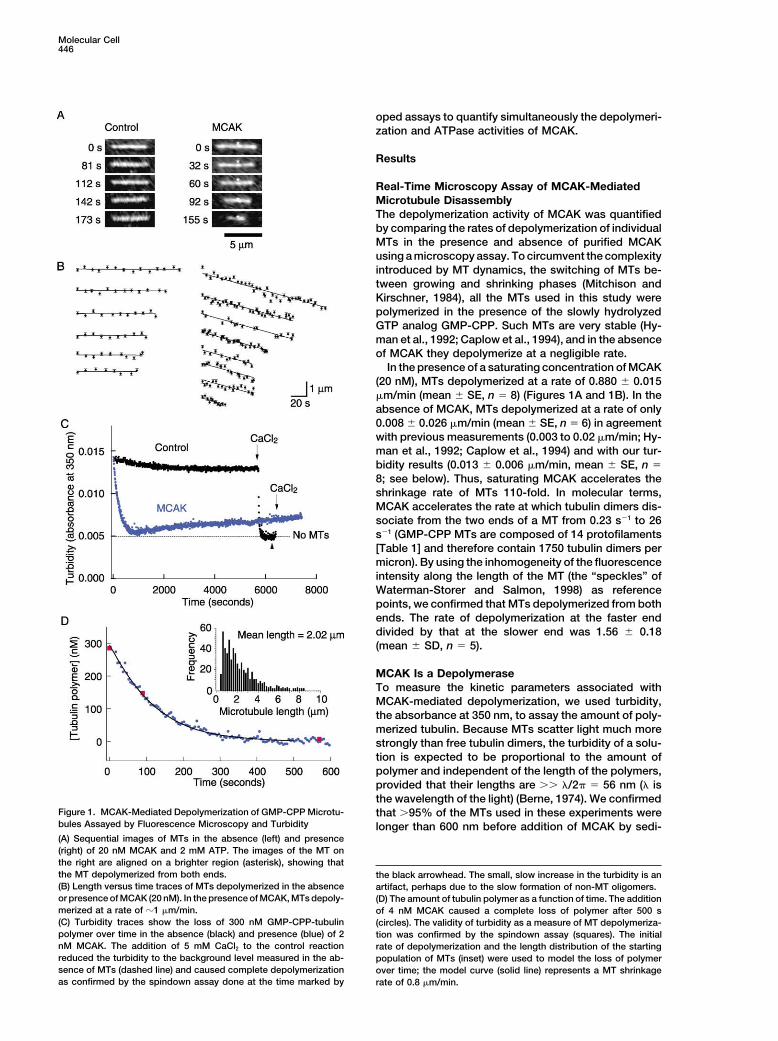
Real-Time Microscopy Assay of MCAK-MediatedMicrotubule DisassemblyThe depolymerization activity of MCAK was quantifiedby comparing the rates of depolymerization of individualMTs in the presence and absence of purified MCAKusing a microscopy assay. To circumvent the complexityintroduced by MT dynamics, the switching of MTs be-tween growing and shrinking phases (Mitchison andKirschner, 1984), all the MTs used in this study werepolymerized in the presence of the slowly hydrolyzedGTP analog GMP-CPP. Such MTs are very stable (Hy-man et al., 1992; Caplow et al., 1994), and in the absenceof MCAK they depolymerize at a negligible rate.
In the presence of a saturating concentration of MCAK(20 nM), MTs depolymerized at a rate of 0.880 � 0.015�m/min (mean � SE, n � 8) (Figures 1A and 1B). In theabsence of MCAK, MTs depolymerized at a rate of only0.008 � 0.026 �m/min (mean � SE, n � 6) in agreementwith previous measurements (0.003 to 0.02 �m/min; Hy-man et al., 1992; Caplow et al., 1994) and with our tur-bidity results (0.013 � 0.006 �m/min, mean � SE, n �8; see below). Thus, saturating MCAK accelerates theshrinkage rate of MTs 110-fold. In molecular terms,MCAK accelerates the rate at which tubulin dimers dis-sociate from the two ends of a MT from 0.23 s�1 to 26s�1 (GMP-CPP MTs are composed of 14 protofilaments[Table 1] and therefore contain 1750 tubulin dimers permicron). By using the inhomogeneity of the fluorescenceintensity along the length of the MT (the “speckles” ofWaterman-Storer and Salmon, 1998) as referencepoints, we confirmed that MTs depolymerized from bothends. The rate of depolymerization at the faster enddivided by that at the slower end was 1.56 � 0.18(mean � SD, n � 5).
MCAK Is a DepolymeraseTo measure the kinetic parameters associated withMCAK-mediated depolymerization, we used turbidity,the absorbance at 350 nm, to assay the amount of poly-merized tubulin. Because MTs scatter light much morestrongly than free tubulin dimers, the turbidity of a solu-tion is expected to be proportional to the amount ofpolymer and independent of the length of the polymers,provided that their lengths are �� �/2� � 56 nm (� isthe wavelength of the light) (Berne, 1974). We confirmed
Figure 1. MCAK-Mediated Depolymerization of GMP-CPP Microtu- that �95% of the MTs used in these experiments werebules Assayed by Fluorescence Microscopy and Turbidity longer than 600 nm before addition of MCAK by sedi-(A) Sequential images of MTs in the absence (left) and presence(right) of 20 nM MCAK and 2 mM ATP. The images of the MT onthe right are aligned on a brighter region (asterisk), showing thatthe MT depolymerized from both ends. the black arrowhead. The small, slow increase in the turbidity is an(B) Length versus time traces of MTs depolymerized in the absence artifact, perhaps due to the slow formation of non-MT oligomers.or presence of MCAK (20 nM). In the presence of MCAK, MTs depoly- (D) The amount of tubulin polymer as a function of time. The additionmerized at a rate of �1 �m/min. of 4 nM MCAK caused a complete loss of polymer after 500 s(C) Turbidity traces show the loss of 300 nM GMP-CPP-tubulin (circles). The validity of turbidity as a measure of MT depolymeriza-polymer over time in the absence (black) and presence (blue) of 2 tion was confirmed by the spindown assay (squares). The initialnM MCAK. The addition of 5 mM CaCl2 to the control reaction rate of depolymerization and the length distribution of the startingreduced the turbidity to the background level measured in the ab- population of MTs (inset) were used to model the loss of polymersence of MTs (dashed line) and caused complete depolymerization over time; the model curve (solid line) represents a MT shrinkageas confirmed by the spindown assay done at the time marked by rate of 0.8 �m/min.
Depolymerase and ATPase Activities of MCAK447
Table 1. Depolymerase Activity of MCAK
Quantity Parameter Value
Maximum shrinkage rate per MTa 0.95 � 0.1 �m/minMaximum tubulin off rate per MTa 28 � 3 s�1
Protofilaments per MTb 14.0 � 0.2Maximum MCAKs per protofilament end N/(14 � 2) 0.86 � 0.14Maximum tubulin off rate per protofilament end kcat 1.0 � 0.2 s�1
Affinity for protofilament end K 1.0 � 0.2 nMAssociation rate to protofilament end kon 54 � 9 �M�1·s�1
Dissociation rate from protofilament end koff 0.054 � 0.013 s�1
Temperature: 23 � 1C.a From the turbidity experiments.b From Hyman et al., 1995.
menting the MTs and measuring their length distribution shrinkage rate of 0.95 � 0.10 �m/min per MT, whichcorresponds to 28 tubulin dimers per second per MT.using fluorescence microscopy (Figure 1D, inset).
When MCAK was added to a solution containing MTs This is in close agreement with the depolymerizationrate measured in the microscopy assay (Figure 1B).and ATP, the turbidity decreased approximately expo-
nentially over 10 min (Figure 1C). A control showed that The data shown in Figure 2A accord with the expecta-tion that MCAK has its depolymerase activity at the endsthere was little decrease in turbidity in the absence of
MCAK (Figure 1C). Addition of CaCl2, which is known to of MTs, rather than on the lattice. If MCAK acted on theMT lattice then we would expect the depolymerizationdepolymerize MTs (O’Brien et al., 1997; Muller-Reichert
et al., 1998), did not lead to a further decrease in turbidity rate to saturate when the lattice tubulin was saturated,which would require 300 nM MCAK. Instead, depolymer-in the MCAK trace, even though it rapidly decreased
the turbidity in the control trace (Figure 1C). Finally, a ization saturates at 4 nM MCAK. Furthermore, the half-maximal rate of depolymerization occurred at 1.6 � 0.2spindown assay confirmed that the total amount of tu-
bulin polymer decreased in proportion to the turbidity nM MCAK, indicating that MCAK must have a high affin-ity for MT ends.signal (Figure 1D). These observations establish the va-
lidity of the turbidity assay and allow us to draw animportant conclusion: MCAK acts catalytically. A single MCAK Has One High-Affinity Binding Sitemolecule of MCAK can remove as many as 150 tubulin per Protofilament Enddimers from the ends of MTs (300 nM polymerized tu- To estimate the number of MCAK binding sites per MTbulin is depolymerized by 2 nM MCAK). Thus, MCAK is end and the binding affinity, we considered a model ina depolymerase. which MCAK [M] binds to sites at the ends of MTs [P]
where they form catalytically active complexes [MP] thatMCAK Has a High Affinity for Microtubule Ends remove tubulin dimers [Tb] from the end with a rateWe used the turbidity assay to determine how much constant kcat. We writeMCAK is needed to depolymerize MTs at the maximumrate. When increasing amounts of MCAK were added
M Pkon
><
koff
MPto a fixed concentration of MTs, the rate of depolymeri-zation increased (Figure 2A), and at MCAK concentra-tions of �2 nM, depolymerization was complete within K �
koff
kon
�[M][P][MP]600 s. To analyze these results, we plotted the initial rate
of depolymerization against the MCAK concentration ddt
[Tb] � kcat[MP]. (1)(Figure 2B). The initial rate was used to minimize thecontribution from any possible repolymerization of tu-bulin dimers released during the reaction and also tominimize the effect of the turbidity artifact that occurs kon is the second order on-rate constant for association
of MCAK to the binding sites; MCAK could target theafter 1000 s (Figure 1C). Because the concentration ofMTs was known from the spindown assay, the initial site directly from aqueous solution or indirectly via the
MT lattice. koff is the off-rate constant for dissociationrate of polymer loss could be expressed as the averageshrinkage rate of individual MTs. of MCAK from the binding site; MCAK could leave on its
own or in a complex with a tubulin dimer. The constant KThe initial rate of depolymerization depended on theMCAK concentration according to a sigmoidal curve. At corresponds to the concentration of binding sites nec-
essary for half-maximum MCAK binding (and thus half-low concentrations, the depolymerization rate increasedapproximately with the square of the MCAK concentra- maximal depolymerase activity). If MCAK were in ther-
modynamic equilibrium with its binding sites, then kontion (Hill coefficient � 1.6, 1.9, and 2.6 for the threecurves shown in Figure 2B). This indicates that there and koff would correspond to a reversible reaction and
K would be the dissociation constant (according to themay be some cooperativity; for example, a few MCAKsper end may be required before any significant depoly- definition in Smith, 1997). However, the reaction need
not be in equilibrium because MCAK could be in a differ-merization occurs. At high MCAK concentrations, de-polymerization increased to an extrapolated maximum ent state when it associates with its binding site than
Molecular Cell448
when it dissociates. For example, MCAK could dissoci-ate from the MT in a complex with a tubulin dimer or itcould change its nucleotide state after binding to theMT. In what follows, and in the supplemental data athttp://www.molecule.org/cgi/content/full/11/2/445/DC1 where the model is solved, we assume only thatthe association-dissociation reaction is at steady state(i.e., that the fraction of free and bound MCAKs doesnot change with time).
According to the model, the half-maximal depolymeri-zation rate occurs when the total concentration of MCAK(free and bound) is
M1⁄2 �1/2 P0 K � 1/2 N · [Mt] K (2)
(see the supplemental data at http://www.molecule.org/cgi/content/full/11/2/445/DC1). P0 is the total number ofbinding sites (free and occupied), [Mt] is the MT concen-tration, and N is the number of MCAK binding sites perMT. This equation makes intuitive sense. If the affinityis very high (K � 0), then the half-maximal rate occurswhen there is enough MCAK to fill half the sites. Con-versely, if the affinity is very low (K �� P0), then the half-maximal depolymerization rate occurs when the MCAKconcentration is equal to the constant K.
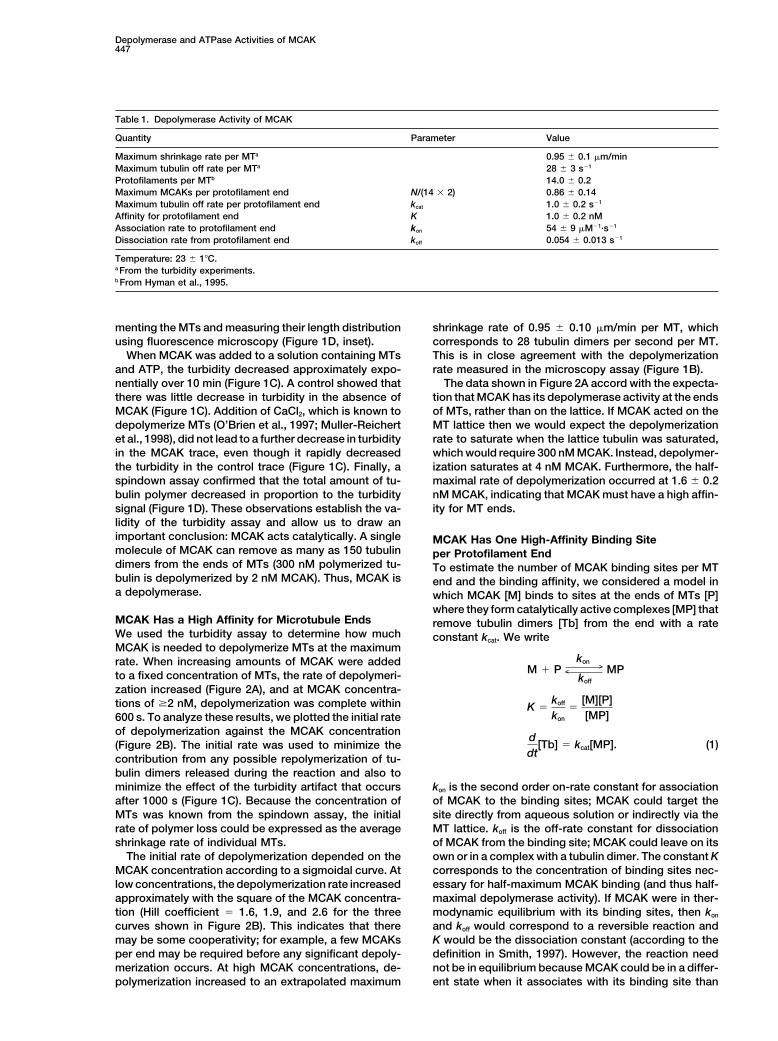
Depolymerization data were obtained at two other MTconcentrations: 0.033 and 0.50 nM (Figure 2B). The half-maximum depolymerization rates occurred at 1.8 � 0.2nM and 8.1 � 0.9 nM MCAK, respectively. Fitting Equa-tion 2 to a plot of the MCAK concentration required forhalf-maximal depolymerization versus the MT concen-tration (Figure 2B, inset) gave a correlation coefficientof r � 0.93 when the data were weighted by their uncer-tainties and yielded K � 1.0 � 0.2 nM and N � 24 � 4.The latter number corresponds to 12 � 2 binding sitesper MT end. Because the MTs used in this study have14 protofilaments, the number of binding sites corre-sponds to approximately one MCAK per protofilamentend (12 � 14). Assuming one MCAK per protofilamentend, the maximum catalytic activity of MCAK, kcat, themaximum rate at which one MCAK dimer can removeone tubulin dimer from the end of a MT, is 1 s�1 (� 28tubulin dimers per MT per second � 28 protofilamentends per MT; Table 1). The low level of cooperativity—as
Figure 2. Kinetics of MCAK-Mediated Microtubule Depolymeri- few as two MCAKs at an end are sufficient for depoly-zation
merization—indicates that MCAK can probably switch(A) Turbidity traces show the loss of 300 nM GMP-CPP-tubulin poly-
between protofilaments.mer (0.086 nM MTs) over time in the presence of various amountsFrom this analysis, we also conclude that the affinityof MCAK.
of MCAK for the tubulin dimers in the lattice must be(B) Initial rates of depolymerization measured by turbidity or lightscattering as a function of MCAK concentration at three different very low. If MCAK had even a modest affinity for theMT concentrations (�, 0.033 nM; �, 0.086 nM from the data in [A]; surface of a MT, then the lattice would act as a sinkand �, 0.50 nM). The solid curves correspond to the Hill equation because the tubulin dimers in the lattice outnumber thosef(x ) � Vmaxxn/(KM
n xn) where Vmax is the maximum value, KM is theat the ends �100:1. Thus the dissociation constant forx value at which a half-maximum value is obtained, and n is the Hilltubulin in the lattice must be �100 nM (100 � 1 nM).coefficient (n � 1.6, �; 2.6, �; 1.9, �). The open circles (�) corre-
spond to the depolymerization rate measured in the microscopyassay (MT concentration �0.01 nM). The inset graph shows the MCAK Finds Microtubule Ends Very RapidlyMCAK concentration required for a half-maximal depolymerization To measure how quickly MCAK targets MT ends, we usedrate plotted against the MT number concentration. The line is the
a stopped flow apparatus to measure the association ratefit to Equation 2 and corresponds to there being 24 binding sitesper MT, K � 1 nM.(C) The initial rate of depolymerization measured by stopped flow.MCAK (at various concentrations) and MTs (800 nM GMP-CPP-tubulin polymer) were rapidly mixed, and the amount of polymer http://www.molecule.org/cgi/content/full/11/2/445/DC1) with pa-was assayed by the intensity of scattered light. The black curves rameters kon � 0.05 nM�1·s�1, koff � 0.05 s�1, K � 1 nM, k 2 � 1 s�1
correspond to the processive model (see the supplemental data at with cooperativity (Hill coefficient of 2).
Depolymerase and ATPase Activities of MCAK449
constant kon. If the total MCAK concentration (M0) is inexcess of the binding constant (i.e., K ) and the totalconcentration of binding sites (P0) then the delay, �t,between the addition of MCAK and the attainment ofthe steady-state depolymerization rate is
�t � [kon · (M0 � P0)]�1 M0�� K (3)
(see the supplemental data at http://www.molecule.org/cgi/content/full/11/2/445/DC1). To measure the delay,MCAK and ATP in one syringe were rapidly mixed withMTs in the other, and the depolymerization was moni-tored by the intensity of light scattered 90 in the mixingchamber. The onset of depolymerization is very rapid,with delays of only a few seconds at the highest MCAKconcentration (Figure 2C). The delay was measured byextrapolating back the steady-state depolymerization towhere it intercepts the initial polymer concentration. Sixmeasurements of the delay at MCAK concentrations �5nM obtained in three independent experiments gave asecond order association rate of MCAK binding to protofil-ament ends of kon � 54 � 9 � 106 M�1·s�1 (mean � SE).
The Catalytic Activity of MCAK RequiresATP HydrolysisThe experiments described so far were all performed inthe presence of ATP. However, the hydrolysis of ATPis not required for MCAK to disassemble GMP-CPP-stabilized MTs. When 315 nM tubulin polymer was mixedwith 150 nM MCAK in the presence of 2.5 mM of thenonhydrolyzable ATP analog AMP-PNP, there was 60%disassembly after 10 min and 70% disassembly after 50min. Given that in the absence of MCAK, GMP-CPP MTsdepolymerize �10% after 10 min (Figure 2A), we canpositively conclude that MCAK accelerates depolymeri-zation, as opposed to inhibiting polymerization. Thisconfirms the finding of Moores et al. (2002) showing thatthe motor domain of the Kin I from P. falciparum can Figure 3. ATPase Activity of MCAKdisassemble taxol-stabilized MTs in the presence of (A) The time course of Pi release from ATP following the addition of
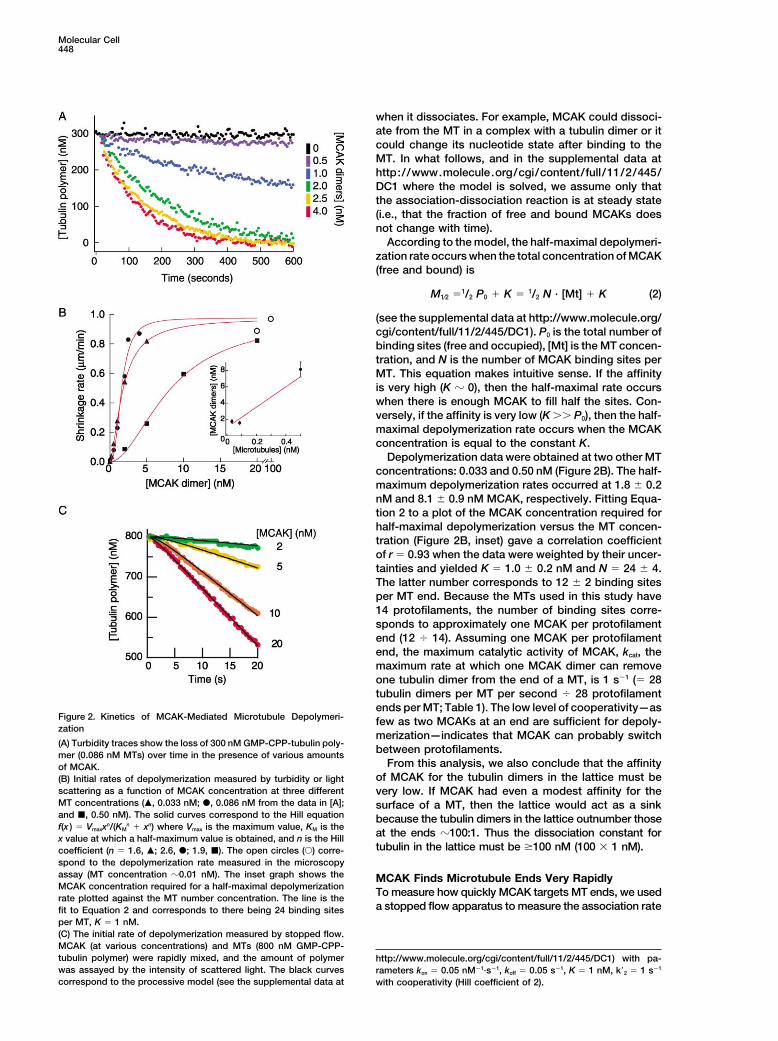
2 nM MCAK to 300 nM GMP-CPP-tubulin polymer. The solid line isAMP-PNP.a fit to the slower phase of phosphate release and corresponds toATP hydrolysis, however, is necessary for catalytic0.06 Pi per second per MCAK. We attribute this slow phase todepolymerization. When 315 nM tubulin polymer wasstimulation of the ATPase by free tubulin.mixed with 25 nM MCAK in the absence of ATP, there (B) The initial phase of Pi release (squares, data from A) has the
was �10% disassembly after 10 min, as measured by same time course as the release of tubulin dimers from MTs (circles).the spindown assay. By contrast, 20 nM MCAK was Both are fit well by a model in which the MTs shrink at a rate of 0.5
�m/min (solid line) appropriate for 2 nM MCAK. Superimposition ofsufficient to completely depolymerize 800 nM GMP-the Pi and tubulin curves requires 5 Pi released per tubulin dimerCPP-tubulin polymer within 1 min in the presence of 2released.mM ATP as determined by turbidity assays (data not(C) The initial ATPase rate (the initial slope of the Pi release curveshown). divided by the MCAK concentration, 20 nM) as a function of thepolymerized tubulin concentration. The solid curve is the Michaelis-
MCAK Has a Microtubule-Stimulated ATPase Activity Menten equation with a maximum ATPase rate of 3.4 s�1 and a half-maximum rate occurring at 7 �M tubulin.Given that ATP hydrolysis is necessary for MCAK’s en-(D) The ATPase rate of MCAK as a function of unpolymerized GDP-zyme activity, we measured the rate at which MCAKtubulin. The solid curve is the Michaelis-Menten equation with ahydrolyzes ATP to its products ADP and inorganic phos-maximum ATPase rate of 0.15 s�1 and a half-maximum rate oc-phate (Pi). Following the addition of 2 nM MCAK to 300 curring at 0.49 �M tubulin.
nM of GMP-CPP-tubulin polymer in 250 �M ATP, weobserved a fast initial rate of Pi release (�6 nM·s�1) ofduration �1000 s, followed a slower steady-state rate that depolymerization was �90% complete after 600 s
and �99% complete after 3000 s. Because the initialof Pi release (�0.13 nM·s�1) (Figure 3A). The time courseof the initial phase closely matched the time course of phase depended on there being MTs present, we believe
that it corresponds to MT-stimulated ATPase activity.depolymerization (Figure 3B); when appropriately scaled,the amount of phosphate released from ATP (large This is further supported by the observation that when
the concentration of polymerized tubulin was increased,squares) could be superimposed on the amount of tu-bulin released from MTs. A spindown assay confirmed the ATPase rate also increased (Figure 3C).
Molecular Cell450
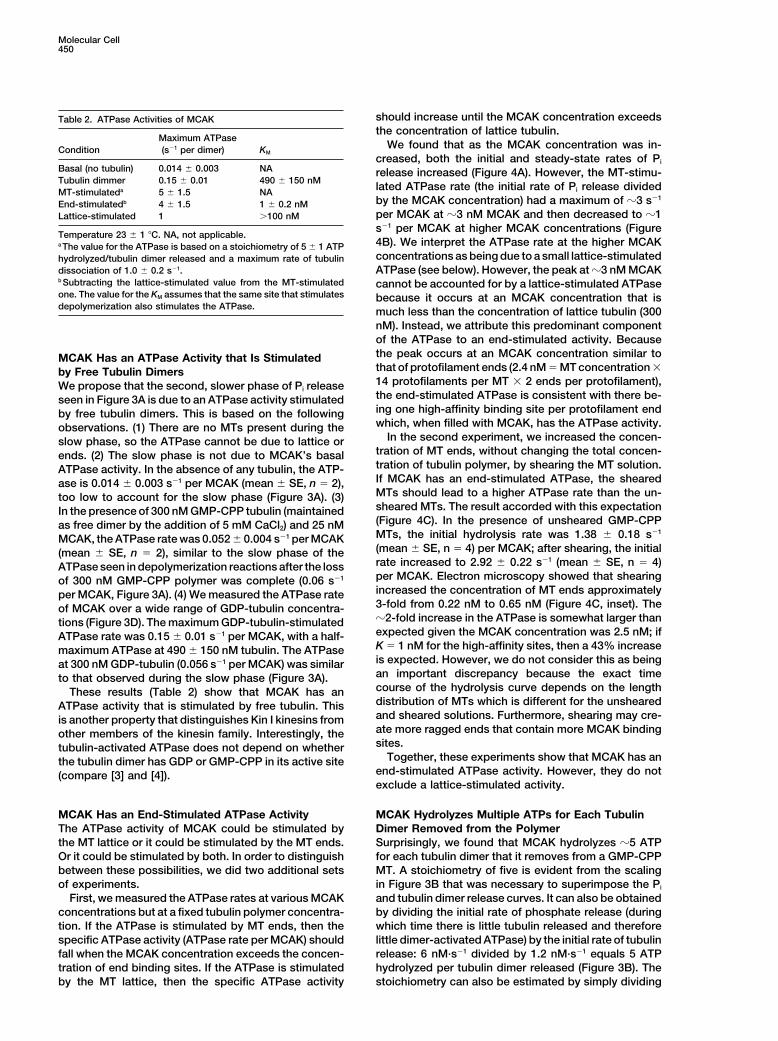
should increase until the MCAK concentration exceedsTable 2. ATPase Activities of MCAKthe concentration of lattice tubulin.
Maximum ATPaseWe found that as the MCAK concentration was in-Condition (s�1 per dimer) KM
creased, both the initial and steady-state rates of PiBasal (no tubulin) 0.014 � 0.003 NA release increased (Figure 4A). However, the MT-stimu-Tubulin dimmer 0.15 � 0.01 490 � 150 nM
lated ATPase rate (the initial rate of Pi release dividedMT-stimulateda 5 � 1.5 NAby the MCAK concentration) had a maximum of �3 s�1
End-stimulatedb 4 � 1.5 1 � 0.2 nMper MCAK at �3 nM MCAK and then decreased to �1Lattice-stimulated 1 �100 nMs�1 per MCAK at higher MCAK concentrations (Figure
Temperature 23 � 1 C. NA, not applicable.4B). We interpret the ATPase rate at the higher MCAKa The value for the ATPase is based on a stoichiometry of 5 � 1 ATPconcentrations as being due to a small lattice-stimulatedhydrolyzed/tubulin dimer released and a maximum rate of tubulin
dissociation of 1.0 � 0.2 s�1. ATPase (see below). However, the peak at �3 nM MCAKb Subtracting the lattice-stimulated value from the MT-stimulated cannot be accounted for by a lattice-stimulated ATPaseone. The value for the KM assumes that the same site that stimulates because it occurs at an MCAK concentration that isdepolymerization also stimulates the ATPase. much less than the concentration of lattice tubulin (300
nM). Instead, we attribute this predominant componentof the ATPase to an end-stimulated activity. Becausethe peak occurs at an MCAK concentration similar toMCAK Has an ATPase Activity that Is Stimulatedthat of protofilament ends (2.4 nM � MT concentration �by Free Tubulin Dimers14 protofilaments per MT � 2 ends per protofilament),We propose that the second, slower phase of Pi releasethe end-stimulated ATPase is consistent with there be-seen in Figure 3A is due to an ATPase activity stimulateding one high-affinity binding site per protofilament endby free tubulin dimers. This is based on the followingwhich, when filled with MCAK, has the ATPase activity.observations. (1) There are no MTs present during the
In the second experiment, we increased the concen-slow phase, so the ATPase cannot be due to lattice ortration of MT ends, without changing the total concen-ends. (2) The slow phase is not due to MCAK’s basaltration of tubulin polymer, by shearing the MT solution.ATPase activity. In the absence of any tubulin, the ATP-If MCAK has an end-stimulated ATPase, the shearedase is 0.014 � 0.003 s�1 per MCAK (mean � SE, n � 2),MTs should lead to a higher ATPase rate than the un-too low to account for the slow phase (Figure 3A). (3)sheared MTs. The result accorded with this expectationIn the presence of 300 nM GMP-CPP tubulin (maintained(Figure 4C). In the presence of unsheared GMP-CPPas free dimer by the addition of 5 mM CaCl2) and 25 nMMTs, the initial hydrolysis rate was 1.38 � 0.18 s�1
MCAK, the ATPase rate was 0.052 � 0.004 s�1 per MCAK(mean � SE, n � 4) per MCAK; after shearing, the initial(mean � SE, n � 2), similar to the slow phase of therate increased to 2.92 � 0.22 s�1 (mean � SE, n � 4)ATPase seen in depolymerization reactions after the lossper MCAK. Electron microscopy showed that shearingof 300 nM GMP-CPP polymer was complete (0.06 s�1
increased the concentration of MT ends approximatelyper MCAK, Figure 3A). (4) We measured the ATPase rate3-fold from 0.22 nM to 0.65 nM (Figure 4C, inset). Theof MCAK over a wide range of GDP-tubulin concentra-�2-fold increase in the ATPase is somewhat larger thantions (Figure 3D). The maximum GDP-tubulin-stimulatedexpected given the MCAK concentration was 2.5 nM; ifATPase rate was 0.15 � 0.01 s�1 per MCAK, with a half-K � 1 nM for the high-affinity sites, then a 43% increasemaximum ATPase at 490 � 150 nM tubulin. The ATPaseis expected. However, we do not consider this as beingat 300 nM GDP-tubulin (0.056 s�1 per MCAK) was similaran important discrepancy because the exact timeto that observed during the slow phase (Figure 3A).course of the hydrolysis curve depends on the lengthThese results (Table 2) show that MCAK has andistribution of MTs which is different for the unshearedATPase activity that is stimulated by free tubulin. Thisand sheared solutions. Furthermore, shearing may cre-is another property that distinguishes Kin I kinesins fromate more ragged ends that contain more MCAK bindingother members of the kinesin family. Interestingly, thesites.tubulin-activated ATPase does not depend on whether
Together, these experiments show that MCAK has anthe tubulin dimer has GDP or GMP-CPP in its active siteend-stimulated ATPase activity. However, they do not(compare [3] and [4]).exclude a lattice-stimulated activity.
MCAK Hydrolyzes Multiple ATPs for Each TubulinMCAK Has an End-Stimulated ATPase ActivityThe ATPase activity of MCAK could be stimulated by Dimer Removed from the Polymer
Surprisingly, we found that MCAK hydrolyzes �5 ATPthe MT lattice or it could be stimulated by the MT ends.Or it could be stimulated by both. In order to distinguish for each tubulin dimer that it removes from a GMP-CPP
MT. A stoichiometry of five is evident from the scalingbetween these possibilities, we did two additional setsof experiments. in Figure 3B that was necessary to superimpose the Pi
and tubulin dimer release curves. It can also be obtainedFirst, we measured the ATPase rates at various MCAKconcentrations but at a fixed tubulin polymer concentra- by dividing the initial rate of phosphate release (during
which time there is little tubulin released and thereforetion. If the ATPase is stimulated by MT ends, then thespecific ATPase activity (ATPase rate per MCAK) should little dimer-activated ATPase) by the initial rate of tubulin
release: 6 nM·s�1 divided by 1.2 nM·s�1 equals 5 ATPfall when the MCAK concentration exceeds the concen-tration of end binding sites. If the ATPase is stimulated hydrolyzed per tubulin dimer released (Figure 3B). The
stoichiometry can also be estimated by simply dividingby the MT lattice, then the specific ATPase activity
Depolymerase and ATPase Activities of MCAK451
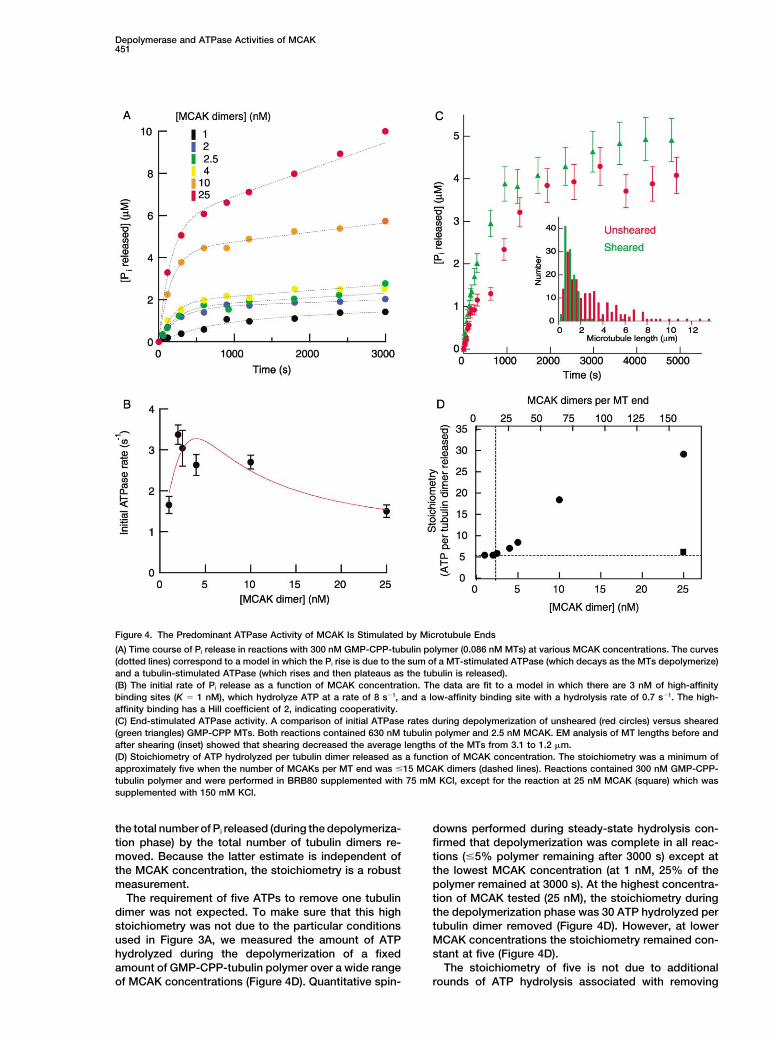
Figure 4. The Predominant ATPase Activity of MCAK Is Stimulated by Microtubule Ends
(A) Time course of Pi release in reactions with 300 nM GMP-CPP-tubulin polymer (0.086 nM MTs) at various MCAK concentrations. The curves(dotted lines) correspond to a model in which the Pi rise is due to the sum of a MT-stimulated ATPase (which decays as the MTs depolymerize)and a tubulin-stimulated ATPase (which rises and then plateaus as the tubulin is released).(B) The initial rate of Pi release as a function of MCAK concentration. The data are fit to a model in which there are 3 nM of high-affinitybinding sites (K � 1 nM), which hydrolyze ATP at a rate of 8 s�1, and a low-affinity binding site with a hydrolysis rate of 0.7 s�1. The high-affinity binding has a Hill coefficient of 2, indicating cooperativity.(C) End-stimulated ATPase activity. A comparison of initial ATPase rates during depolymerization of unsheared (red circles) versus sheared(green triangles) GMP-CPP MTs. Both reactions contained 630 nM tubulin polymer and 2.5 nM MCAK. EM analysis of MT lengths before andafter shearing (inset) showed that shearing decreased the average lengths of the MTs from 3.1 to 1.2 �m.(D) Stoichiometry of ATP hydrolyzed per tubulin dimer released as a function of MCAK concentration. The stoichiometry was a minimum ofapproximately five when the number of MCAKs per MT end was �15 MCAK dimers (dashed lines). Reactions contained 300 nM GMP-CPP-tubulin polymer and were performed in BRB80 supplemented with 75 mM KCl, except for the reaction at 25 nM MCAK (square) which wassupplemented with 150 mM KCl.
the total number of Pi released (during the depolymeriza- downs performed during steady-state hydrolysis con-firmed that depolymerization was complete in all reac-tion phase) by the total number of tubulin dimers re-
moved. Because the latter estimate is independent of tions (�5% polymer remaining after 3000 s) except atthe lowest MCAK concentration (at 1 nM, 25% of thethe MCAK concentration, the stoichiometry is a robust
measurement. polymer remained at 3000 s). At the highest concentra-tion of MCAK tested (25 nM), the stoichiometry duringThe requirement of five ATPs to remove one tubulin
dimer was not expected. To make sure that this high the depolymerization phase was 30 ATP hydrolyzed pertubulin dimer removed (Figure 4D). However, at lowerstoichiometry was not due to the particular conditions
used in Figure 3A, we measured the amount of ATP MCAK concentrations the stoichiometry remained con-stant at five (Figure 4D).hydrolyzed during the depolymerization of a fixed
amount of GMP-CPP-tubulin polymer over a wide range The stoichiometry of five is not due to additionalrounds of ATP hydrolysis associated with removingof MCAK concentrations (Figure 4D). Quantitative spin-
Molecular Cell452
GMP-CPP dimers that reassociated with the MTs aftertheir initial removal. When such reassociation wasblocked by adding 20 �M GDP, a condition in whichpolymerization is strongly inhibited because GDP dis-places GMP-CPP from the free dimer (Caplow et al.,1994), a high stoichiometry was still observed (data notshown).
Combining the maximum tubulin dimer dissociationrate of 1 s�1 per MCAK with the stoichiometry of fiveATPs hydrolyzed per tubulin removed, we deduce amaximum GMP-CPP-MT stimulated ATPase rate of 5 s�1
per MCAK (Table 2). This is similar to the maximum ATPaserate of 3.4 s�1 estimated from the data in Figure 3C. Be-cause the former estimate of the maximum ATPase rate isindependent of the MCAK concentration, the agreementwith the latter estimate confirms that the MCAK concen-tration was correctly measured.
Effect of Ionic Strength on the ATPaseand Depolymerase Activities of MCAKIn addition to an end-stimulated ATPase activity, MCAKhas an additional MT-stimulated ATPase that we attri-bute to stimulation by the MT lattice. This ATPase isobserved when the MCAK concentration is in excess ofthe concentration of end binding sites (Figures 4A and4B). When the lattice-stimulated ATPase is high, thestoichiometry is high (��5) showing that this ATPaseis not tightly coupled to depolymerization (Figure 4D).The lattice-stimulated ATPase rate can be estimatedfrom the data in Figures 4A and 4B; at 25 nM MCAK theATPase rate is 1.5 s�1 and if the component due to theend-stimulated ATPase is subtracted, we obtain a valueof 1 s�1 per MCAK for the lattice-stimulated ATPase.
Adding salt decreased the lattice-stimulated ATPase.In buffer that is optimal for depolymerase activity(BRB80 plus 75 mM KCl), 25 nM MCAK has a largelattice-stimulated ATPase (Figure 4A) and the stoichiom-etry is equal to 30 (Figure 4D). However, when the saltwas increased (BRB80 plus 150 mM KCl), the amplitudeof the initial phase of phosphate release decreased to a
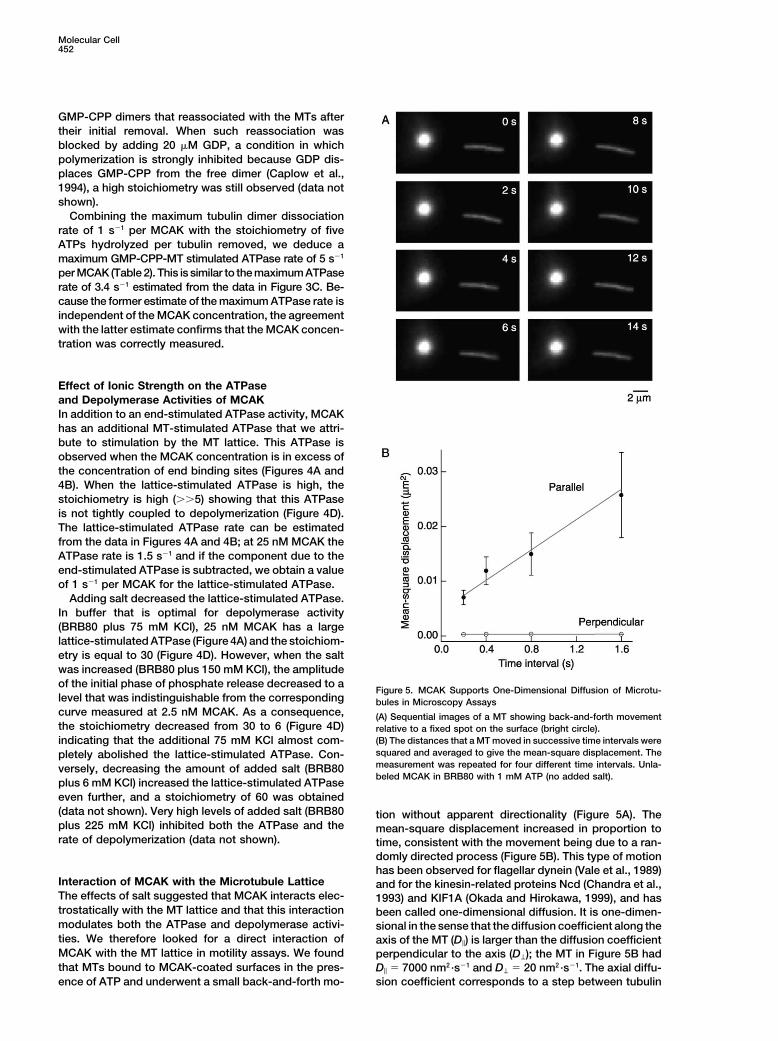
Figure 5. MCAK Supports One-Dimensional Diffusion of Microtu-level that was indistinguishable from the corresponding bules in Microscopy Assayscurve measured at 2.5 nM MCAK. As a consequence, (A) Sequential images of a MT showing back-and-forth movementthe stoichiometry decreased from 30 to 6 (Figure 4D) relative to a fixed spot on the surface (bright circle).
(B) The distances that a MT moved in successive time intervals wereindicating that the additional 75 mM KCl almost com-squared and averaged to give the mean-square displacement. Thepletely abolished the lattice-stimulated ATPase. Con-measurement was repeated for four different time intervals. Unla-versely, decreasing the amount of added salt (BRB80beled MCAK in BRB80 with 1 mM ATP (no added salt).
plus 6 mM KCl) increased the lattice-stimulated ATPaseeven further, and a stoichiometry of 60 was obtained(data not shown). Very high levels of added salt (BRB80 tion without apparent directionality (Figure 5A). Theplus 225 mM KCl) inhibited both the ATPase and the mean-square displacement increased in proportion torate of depolymerization (data not shown). time, consistent with the movement being due to a ran-
domly directed process (Figure 5B). This type of motionhas been observed for flagellar dynein (Vale et al., 1989)
Interaction of MCAK with the Microtubule Lattice and for the kinesin-related proteins Ncd (Chandra et al.,The effects of salt suggested that MCAK interacts elec- 1993) and KIF1A (Okada and Hirokawa, 1999), and hastrostatically with the MT lattice and that this interaction been called one-dimensional diffusion. It is one-dimen-modulates both the ATPase and depolymerase activi- sional in the sense that the diffusion coefficient along theties. We therefore looked for a direct interaction of axis of the MT (D‖) is larger than the diffusion coefficientMCAK with the MT lattice in motility assays. We found perpendicular to the axis (D⊥); the MT in Figure 5B hadthat MTs bound to MCAK-coated surfaces in the pres- D‖ � 7000 nm2 ·s�1 and D⊥ � 20 nm2 ·s�1. The axial diffu-
sion coefficient corresponds to a step between tubulinence of ATP and underwent a small back-and-forth mo-
Depolymerase and ATPase Activities of MCAK453
dimers every �5 ms (� (8 nm)2 /2D ). Note that if a MT Under physiological conditions, MTs can shorten atrates up to 20 �m/min, much faster than the rates re-were constrained to diffuse in a plane parallel to a sur-
face the axial diffusion coefficient would only be twice ported here. But such rapid shortening is thought to betriggered by loss of a stable cap of GTP-tubulin dimers,the orthogonal diffusion coefficient (Howard, 2001). The
finding that the ratio D‖/D⊥ � 2 indicates that MCAK which exposes the underlying unstable GDP-tubulin di-mers (Mitchison and Kirschner, 1984; Walker et al.,constrains the perpendicular motion more than the par-
allel motion. One-dimensional diffusion was also seen 1988). Because MCAK can depolymerize a 1 �m longGMP-CPP MT (analogous to a GTP cap) in 1 min,in the presence of ADP but never in the absence of
nucleotides. MCAK’s depolymerase activity is high enough to ac-count for the measured rates of catastrophe in cells (1–2min�1; Tournebize et al., 2000; Kinoshita et al., 2001).DiscussionFurthermore, the high association rate of MCAK to pro-tofilament ends (Table 1) ensures that MCAK will reachKin I Kinesins Have One High-Affinity Binding Sitethe cap quickly, within 0.2 to 2 s given the measuredper Protofilament Endon-rate and assuming a cellular MCAK concentration ofEarlier work in vitro using fluorescence microscopy10 to 100 nM.showed that Kin I kinesins bind to the ends of MTs in
Assuming an off-rate of 0.05 s�1, MCAK is expectedAMP-PNP (Desai et al., 1999; our unpublished data). Theto remain bound to the end of a MT during the depoly-present work extends these observations by measuringmerization of a GTP cap up to 160 nm in length. Thethe affinity and the number of binding sites per MT endsize of the GTP cap is not known; it is no larger than 1in ATP. The saturation of the depolymerization rate indi-�m (Walker et al., 1991) and could be as small as onecates that the binding sites are high-affinity ones (K �layer of GTP-tubulin dimers (Caplow and Shanks, 1996;1 nM in ATP) and that there are approximately 28 perDrechsel and Kirschner, 1994). A shorter cap will takeMT. The ATPase measurements provide additional sup-less time to depolymerize, and if the GTP cap of a dy-port for this number of MCAK binding sites per MT;namic MT is only one or two dimers long, then it is notthe ATPase rate peaks when there is �1 MCAK perclear what advantage there is to MCAK being processiveprotofilament end (Figure 4B), and there is a constantbecause, after uncapping a dynamic MT, MCAK mayratio of ATPs hydrolyzed per tubulin released providedbe released from the end as the MT transits to rapidthat the MCAK concentration does not exceed the con-shortening. However, it is possible that the high-affinitycentration of protofilament ends (Figure 4D). If the MCAKinteraction that manifests itself in our experiments asbinding sites are evenly distributed between the twoprocessivity may serve a different function in cells. Theends of the MTs and between the protofilaments, thenattachment of MCAK to the centromere is mediated viathere is one binding site at the end of each protofilament.nonmotor domains (Maney et al., 1998). Assuming thatWe propose that this site, when filled by MCAK, hasthe binding of MCAK to protofilament ends is mediatedboth the depolymerase and ATPase activities.by the motor domain, then the point of the multiple,At physiological MCAK concentrations (10–100high-affinity interactions between the MCAK complexnM �� 1 nM; L.W., unpublished data), the binding sitesand the MT end may be to create a link to the kinetochorewill be occupied, and each MT end is expected to havethat is both dynamic and robust; i.e., the connectiona complex of 12–14 MCAK dimers at its end (dependingremains intact even when tubulin dimers dissociate fromon the number of protofilaments). The failure to detectthe end and when the whole structure is under tensionMCAK at the ends of cytoplasmic MTs (Wordeman and(Nicklas, 1988; Coue et al., 1991). One interpretation ofMitchison, 1995) might be explained by the lack of sensi-the similarity of the MCAK-mediated rate of depolymeri-tivity of conventional fluorescence microscopy. On thezation to the rate of chromosome movement during ana-other hand, MCAK has been localized to the spindlephase A (Skibbens et al., 1993) is that the MCAK complexpoles and the midbodies in mitotic cells (Maney et al.,is regulating the MT shortening speed.1998), both of which contain high densities of MT ends.
Evidence that MCAK Is a Processive Enzyme Rapid Targeting of MCAK to Microtubule EndsThe targeting of MCAK to the ends of MTs is extraordi-Knowledge of the on-rate (kon � 0.054 nM�1·s�1 mea-
sured by stopped flow) and the affinity (K � 1 nM mea- narily rapid. The on-rate to protofilament ends, 54 � 106
M�1·s�1, far exceeds the fastest protein-protein interac-sured from the half-saturation of the depolymerizationrate) allows us to estimate the off-rate, koff, of MCAK tions. It is 20 times the on-rate for kinesin to the MT
lattice (Hackney, 1995), and it corresponds to an on-from the protofilament end using Equation 1. This yieldskoff � 0.054 � 0.013 s�1 (the 95% confidence range rate of 760 � 106 M�1·s�1 for MCAK binding to MT ends,
over 100 times the rate at which tubulin dimers bind tois 0.027 to 0.10 s�1, when the errors are propagatedmultiplicatively). Because the MCAK off-rate is one nine- MT ends during polymerization (2 to 5 � 106 M�1·s�1,
Drechsel et al., 1992; Caplow et al., 1994). This arguesteenth the tubulin dimer off-rate from the protofilamentend (1 s�1), we can rule out the possibility that MCAK strongly against a targeting mechanism based solely on
the direct diffusion of MCAK to MT ends. How, then,dissociates from the ends of the MT each time it removesa tubulin dimer. Instead, MCAK removes on average 20 does MCAK reach the ends so quickly?
One obvious possibility is that MCAK finds the ends ofdimers before it dissociates from an end (�10 dimersat the 97.5% confidence level). This implies that MCAK MTs by walking along the lattice. However, our ATPase
measurements provide positive evidence against MCAKis processive like conventional kinesin (Howard et al.,1989). being a motor protein in the traditional sense. MCAK
Molecular Cell454
must move an average distance of 1 �m from its initialbinding site on the lattice to get to the end of a 2 �mlong MT. If translocation occurred via directed motility,then MCAK would have to take 125 eight nanometersteps to reach the end of the MT, and if MCAK werelike kinesin, which uses one ATP per step (Coy et al.,1999), this would cost 125 ATPs. While at the end, MCAKremoves some 20 tubulin dimers before dissociating. Ifthe coupling of hydrolysis to tubulin removal was 1:1,then a further 20 ATP would be consumed. The totalcost would be 145 ATPs for 20 tubulin dimers or sevenATPs per tubulin dimer removed. Because the maximumdimer off-rate is 1 s�1, the maximum ATPase rate wouldbe �7 s�1 (assuming that it takes only a few seconds forthe MCAK to motor to the end of the MT). This calculationshows that the stoichiometry and the ATP rate are notinconsistent with motor activity. Instead, it is the shear-ing experiment that provides the strong argumentagainst MCAK being a motor. After shearing, the MTsare shorter and therefore it should take less, not more,ATP for a motor to reach the end. If MCAK were a motor,we would expect a 2.5-fold decrease in the total ATPhydrolyzed when the MTs are reduced in length from 3to 1 �m; instead, the total Pi released increases (Fig-ure 4C).
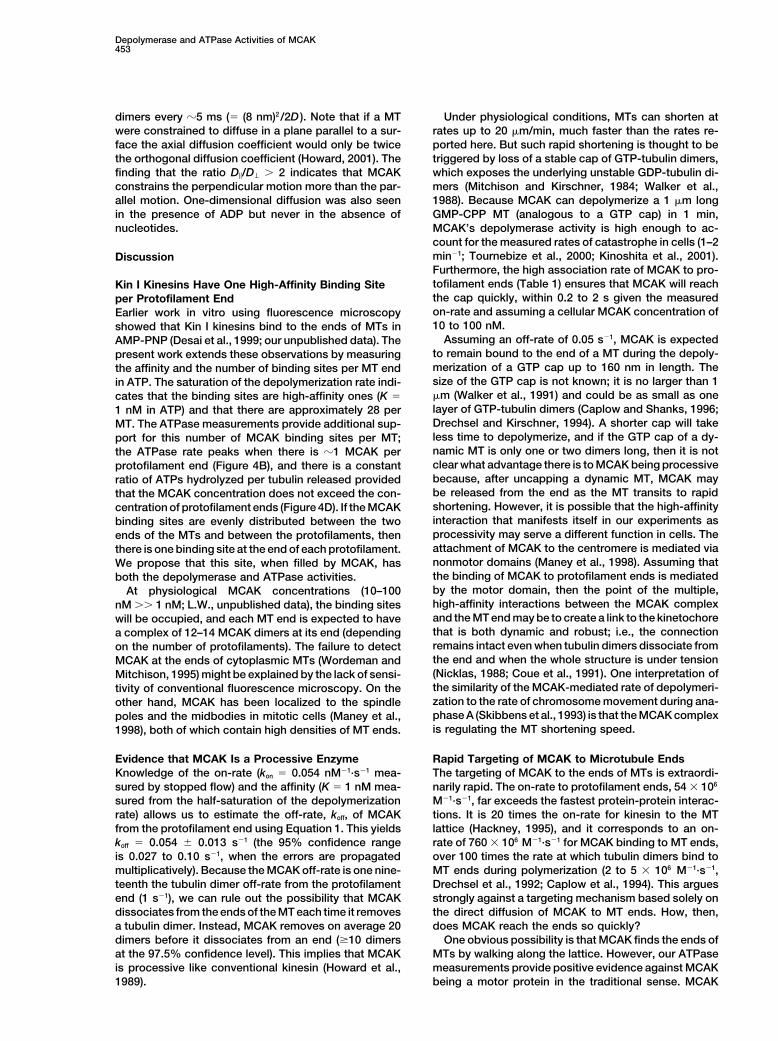
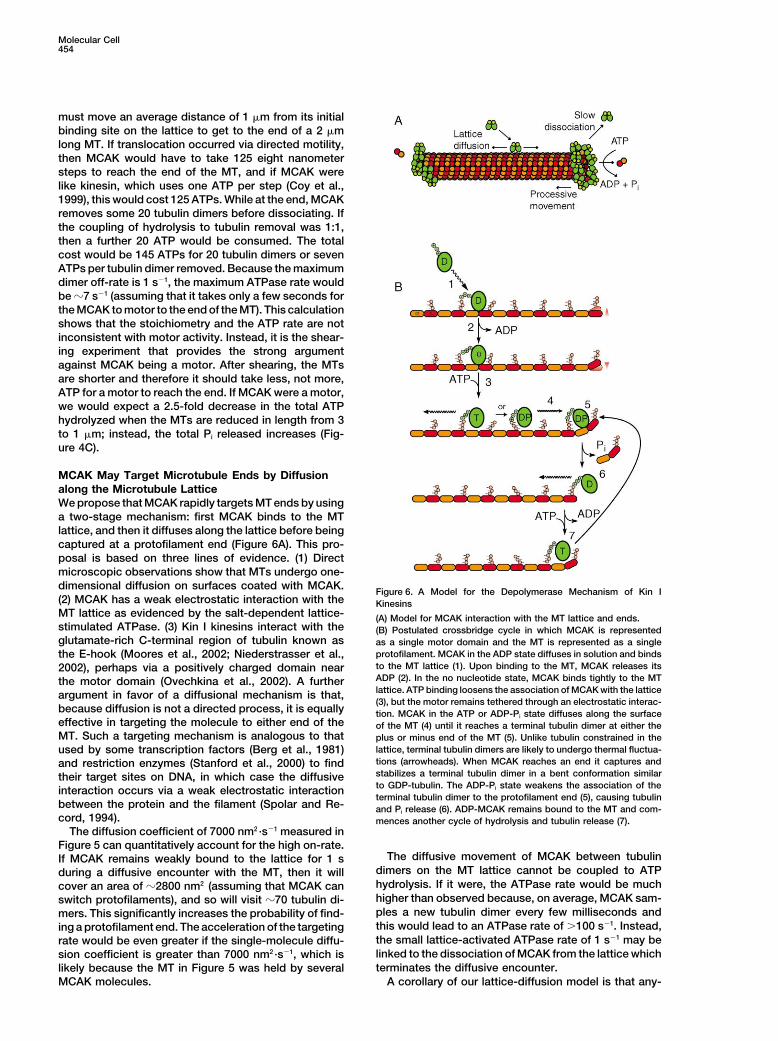
MCAK May Target Microtubule Ends by Diffusionalong the Microtubule LatticeWe propose that MCAK rapidly targets MT ends by usinga two-stage mechanism: first MCAK binds to the MTlattice, and then it diffuses along the lattice before beingcaptured at a protofilament end (Figure 6A). This pro-posal is based on three lines of evidence. (1) Directmicroscopic observations show that MTs undergo one-dimensional diffusion on surfaces coated with MCAK.
Figure 6. A Model for the Depolymerase Mechanism of Kin I(2) MCAK has a weak electrostatic interaction with the KinesinsMT lattice as evidenced by the salt-dependent lattice- (A) Model for MCAK interaction with the MT lattice and ends.stimulated ATPase. (3) Kin I kinesins interact with the (B) Postulated crossbridge cycle in which MCAK is representedglutamate-rich C-terminal region of tubulin known as as a single motor domain and the MT is represented as a single
protofilament. MCAK in the ADP state diffuses in solution and bindsthe E-hook (Moores et al., 2002; Niederstrasser et al.,to the MT lattice (1). Upon binding to the MT, MCAK releases its2002), perhaps via a positively charged domain nearADP (2). In the no nucleotide state, MCAK binds tightly to the MTthe motor domain (Ovechkina et al., 2002). A furtherlattice. ATP binding loosens the association of MCAK with the latticeargument in favor of a diffusional mechanism is that,(3), but the motor remains tethered through an electrostatic interac-
because diffusion is not a directed process, it is equally tion. MCAK in the ATP or ADP-Pi state diffuses along the surfaceeffective in targeting the molecule to either end of the of the MT (4) until it reaches a terminal tubulin dimer at either theMT. Such a targeting mechanism is analogous to that plus or minus end of the MT (5). Unlike tubulin constrained in the
lattice, terminal tubulin dimers are likely to undergo thermal fluctua-used by some transcription factors (Berg et al., 1981)tions (arrowheads). When MCAK reaches an end it captures andand restriction enzymes (Stanford et al., 2000) to findstabilizes a terminal tubulin dimer in a bent conformation similartheir target sites on DNA, in which case the diffusiveto GDP-tubulin. The ADP-Pi state weakens the association of theinteraction occurs via a weak electrostatic interactionterminal tubulin dimer to the protofilament end (5), causing tubulin
between the protein and the filament (Spolar and Re- and Pi release (6). ADP-MCAK remains bound to the MT and com-cord, 1994). mences another cycle of hydrolysis and tubulin release (7).
The diffusion coefficient of 7000 nm2 ·s�1 measured inFigure 5 can quantitatively account for the high on-rate.
The diffusive movement of MCAK between tubulinIf MCAK remains weakly bound to the lattice for 1 sdimers on the MT lattice cannot be coupled to ATPduring a diffusive encounter with the MT, then it willhydrolysis. If it were, the ATPase rate would be muchcover an area of �2800 nm2 (assuming that MCAK canhigher than observed because, on average, MCAK sam-switch protofilaments), and so will visit �70 tubulin di-ples a new tubulin dimer every few milliseconds andmers. This significantly increases the probability of find-this would lead to an ATPase rate of �100 s�1. Instead,ing a protofilament end. The acceleration of the targetingthe small lattice-activated ATPase rate of 1 s�1 may berate would be even greater if the single-molecule diffu-linked to the dissociation of MCAK from the lattice whichsion coefficient is greater than 7000 nm2 ·s�1, which isterminates the diffusive encounter.likely because the MT in Figure 5 was held by several
MCAK molecules. A corollary of our lattice-diffusion model is that any-
Depolymerase and ATPase Activities of MCAK455
thing that impedes the interaction of MCAK with the MT binding of MCAK to MT ends in the presence of AMP-PNP (Desai et al., 1999; our unpublished data) meanswill decrease the affinity of MCAK for ends and will
therefore inhibit MCAK depolymerase activity. This that Kin I kinesins bind weakly to the MT lattice in theATP state (in which AMP-PNP traps the enzyme); other-could explain the inhibition of depolymerization by high
salt; if salt disrupts the electrostatic interaction between wise, if the ATP state were a strongly bound state, thenAMP-PNP-MCAK would uniformly decorate the latticethe motor and the lattice, it will reduce the time that
MCAK spends in the diffusive stage and therefore lower as is the case for conventional kinesin (Crevel et al.,1996). Weak binding in the ATP state is another featurethe rate of end targeting. Likewise, if the E-hook of tu-
bulin is necessary to maintain contact between MCAK that distinguishes MCAK from all other kinesins studiedso far (Crevel et al., 1996). One possibility is that theand the MT lattice during diffusion, then its removal
by proteolysis would inhibit end targeting and lead to electrostatic interaction between the E-hook and posi-tive charges in the neck of the motor domain providesinhibition of depolymerization (Moores et al., 2002; Nie-
derstrasser et al., 2002). the tether during lattice diffusion (Ovechkina and Worde-man, 2002).
To complete the cycle, we postulate that the dissocia-Where Is the ATP Hydrolyzed?tion of the terminal tubulin dimer is triggered by eitherDesai et al. (1999) proposed that ATP binds to a Kin IATP hydrolysis or Pi release. This is consistent withkinesin when it is at the end of the MT but that the actualthe observation that in the presence of AMP-PNP Kin Ihydrolysis and completion of the cycle takes place inkinesins stabilize protofilament peels and rings (Desaisolution after the Kin I-tubulin dimer complex has disso-et al., 1999; Moores et al., 2002; Niederstrasser et al.,ciated from the MT. However, the following observations2002) but do not remove individual tubulin dimers fromindicate that the hydrolysis actually takes place at MTthe protofilament. The disassembly observed in AMP-ends. First, MCAK dissociates from the ends of MTs atPNP is therefore different from the true depolymerizationa rate of 0.05 s�1. Because this is much slower than thethat is observed in ATP. Thus, in the ATP state, Kin Imaximum end-stimulated ATPase rate of 4 s�1 (Tablekinesins bind to the bent conformation of tubulin and2), MCAK hydrolyzes �80 ATPs while at the end of theform a stable complex. Only after hydrolysis does theMT. By analogy to conventional kinesin, MCAK is chemi-terminal tubulin dimer separate from the MT. One possi-cally processive. And second, the high stoichiometry ofbility is that binding in the ADP-Pi state strains even morefive cannot be due to multiple ATP hydrolysis cyclesthe link between the ultimate and penultimate tubulintaking place on the release tubulin dimer. If this weredimers. After dislodging the terminal tubulin, the Kin Ithe case, we would expect that high concentrations ofprotein remains attached to the MT, perhaps throughtubulin should maximally activate the ATPase. But, thean electrostatic interaction. Alternatively, the tethermaximum tubulin-activated ATPase rate is only 0.15 s�1,could be the second head of a dimer, and Kin I kinesinsmuch lower than the maximum MT-activated ATPasemay operate by a hand-over-hand mechanism analo-rate of 5 s�1.gous to conventional kinesin (Schief and Howard, 2001).Though we do not agree with the Desai et al. (1999)
The simplest explanation for the stoichiometry of fivemodel, our results are quite consistent with their findingATPs hydrolyzed per GMP-CPP-tubulin removed is thatthat the Kin I kinesin, XKIF2, forms a stable complexMCAK slips; if it releases Pi before the tubulin dimer haswith tubulin dimer in the presence of AMP-PNP (Desaidissociated, then MCAK finds itself still bound to theet al., 1999). The fact that MCAK has a tubulin-stimulatedMT in the ADP state. The ADP would be rapidly released,ATPase implies that MCAK physically associates withATP would bind and be hydrolyzed, and a futile roundtubulin dimers, and the KM of 0.5 �M tubulin is sufficientlyof hydrolysis would have occurred. In this view, the lowlow to account for their observations that were made inefficiency is due to a kinetic partitioning of the cycle;10 �M tubulin. The failure of Desai et al. to detect aonly 20% of the hydrolysis cycles are productive. MCAKcomplex in the presence of ATP can be reconciled withis more efficient at removing taxol-bound dimers thanour results if ATP hydrolysis and dissociation of the KinGMP-CPP dimmers; the minimum stoichiometry mea-I-tubulin complex is rapid (��0.15 s�1).sured for taxol-stabilized MTs was only two (data notshown), as might be expected from the lower stabilityA Crossbridge Model for Kin I Kinesinsof taxol-MTs over GMP-CPP MTs. It is even possibleOur data suggest that MCAK interacts with the MT latticethat MCAK requires only one ATP to remove a GTP-and ends as shown in Figure 6A. We propose that thesedimer from the end of a dynamic MT.interactions are coupled to the ATP hydrolysis cycle
Our proposed ATP hydrolysis cycle is meant to serveaccording to the model shown in Figure 6B. First, weas a working model that illustrates how a hydrolysispostulate that Kin I kinesins, like other kinesins, releasescheme that drives a motor might be turned into oneADP upon binding to the MT. Though there is no directthat drives a depolymerase.evidence for this, it is supported by the observation
that MCAK binds uniformly to the MT lattice, and notpreferentially at the ends, in the absence of nucleotides Experimental Procedures
(Maney et al., 1998; Wordeman et al., 1999; our unpub-Protein Purificationlished data). If MCAK diffused to ends in the ADP stateRecombinant 6� histidine-tagged MCAK was expressed in Sf9 cellsand released its ADP at ends, then we would expect to(Pharmingen, San Diego, CA) and purified on a Ni-NTA-agarose
see end binding in the absence of nucleotide. column (Qiagen Inc., Chatsworth, CA) according to Maney et al.We postulate that diffusion on the lattice occurs either (1998). Because MCAK is a dimer (Maney et al., 1998), the concentra-
tion refers to dimers and was determined as half the concentrationin the ATP state or the ADP-Pi state. The preferential
Molecular Cell456
of nucleotide binding sites, which were measured radiometrically 25.2 � 0.1C. The light scattering signal (excitation and emission at350 nm) scattered at 90 was measured at 0.2–0.5 s intervals. Be-(Coy et al., 1999). Bovine brain tubulin was purified to �95% purity
(Mickey and Howard, 1995). Aliquots in BRB80 buffer (80 mM potas- cause MTs break during rapid mixing, we used the maximum initialdepolymerization rate measured in the microscopy and turbiditysium PIPES [pH 6.9], 1 mM EGTA, 1 mM MgCl2) were frozen in liquid
nitrogen and stored at �80C. Tubulin concentrations, expressed assays (0.95 �m/min) to estimate the MT (and end) concentration.in terms of 110 kDa tubulin heterodimers, were measured by ab-sorbance at 276 nm in 6 M guanidine HCl using an extinction coeffi- ATPase Assayscient of 1.03 ml/mg·cm. ATPase rates were determined using two different methods to assay
Pi release over time. A malachite green assay (Coy et al., 1999) wasMicrotubules used for experiments to determine ATPase activity stimulated byFor microscopy assays, MTs were assembled in BRB80 plus 1 mM variable amounts of either GMP-CPP MTs or GDP-tubulin. A radio-MgGMP-CPP from a mixture of 6 �M rhodamine-labeled tubulin metric assay was used for all other experiments. Three or five micro-(Hyman et al., 1991) and 18 �M unlabeled tubulin. For turbidity, liters of the reaction mixture (BRB80 supplemented with 250 �Mstopped-flow, and ATPase assays, MTs were prepared by two cy- [�-32P]ATP [NEN Life Sciences Products Inc., Boston, MA], 75 mMcles of assembly in GMP-CPP to deplete the GDP-tubulin dimers KCl, 1 mM DTT, 100–200 �g/ml BSA, and a variable amount ofin the lattice (Caplow and Shanks, 1996). Because MCAK depolym- MCAK or GMP-CPP MT) was quenched in 500 �l cold solutionerase and ATPase activities are sensitive to the concentration of containing 1 M hydrochloric acid, 4% perchloric acid, 180 �M Pi,MT ends, it was necessary to freeze the cycled GMP-CPP MTs to and 10 mM ammonium molybdate. The phosphate concentrationprevent end-to-end annealing. Long GMP-CPP MTs for the end- was determined by adding 1 ml organic reagent (cyclohexane, iso-stimulated ATPase assays (Mickey and Howard, 1995) were sheared butyl alcohol, acetone, quench solution, mixed at ratio of 50:50:10:1),using a 30 gauge needle. The length distributions were determined vortexing for 50 s, then allowing the phases to separate for 10 minby negative stain electron microscopy (Desai et al., 1999). on ice. After phase separation was complete, 63% or 65% of the
organic phase containing radiolabeled Pi (complexed with molyb-date) was recovered, mixed with 3 ml scintillation fluid, and read inMicroscopy Assays
Depolymerization reactions were performed with 20 nM MCAK in a Beckman scintillation counter.BRB80 buffer supplemented with 2 mM MgATP, 75 mM KCl, 1 mg/ml BSA, 0.8% methylcellulose (to slow diffusion, Uyeda et al., 1990; AcknowledgmentsHunt et al., 1994), and an oxygen scavenging mix (20 mM D-glucose,20 �g/ml glucose oxidase, 8 �g/ml catalase, 0.5% �ME) at 23 � We thank Mr. T. Sapra and Drs. A. Desai, A. Hyman, M. Landolfa,1C. Purified MCAK was rapidly mixed with rhodamine-labeled and E. Schaffer for comments on an earlier version of this manu-GMP-CPP MTs (40 nM tubulin polymer) while vortexing, and then script. Mr. Sapra assisted with the motility assays. GMP-CPP was�120 �l of a 200 �l reaction was loaded into a custom-made thick kindly provided by Drs. A. Desai and L. Amos. This work was sup-flowcell followed by immediate observation (�45 s after mixing). For ported by grants to A.W.H. (NIH, T326M07270), M.C. (NIH,the diffusion studies, the surfaces of a 10 �l flowcell were coated GM59231), L.W. (NIH, GM53654A), and J.H. (NIH, AR40593; HFSP;with MCAK by perfusing in 500 nM MCAK in BRB80 buffer. MTs and the Max Planck Society).were images by fluorescence microscopy (Howard et al., 1993).Analysis of the depolymerization rates and mean-square displace-
Received: August 23, 2002ment were performed in IGOR Pro (Wavemetrics, Lake Oswego,
Revised: November 14, 2002OR). The diffusion coefficients were calculated according to Huntand Howard (1993).
References
Turbidity AssayBerg, O.G., Winter, R.B., and von Hippel, P.H. (1981). Diffusion-Aliquots of cycled GMP-CPP MTs were thawed and diluted to 300driven mechanisms of protein translocation on nucleic acids. 1.nM tubulin polymer in BRB80 buffer supplemented with 250 �MModels and theory. Biochemistry 20, 6929–6948.MgATP, 75 mM KCl, 1 mM DTT, and 200 �g/ml BSA. Prior to the
addition of motor, the MT solution was equilibrated to 23 � 1C in Berne, B.J. (1974). Interpretation of the light scattering from longrods. J. Mol. Biol. 89, 755–758.a quartz cuvette. The turbidity was measured at 5 s intervals using
a Hewlett-Packard 8452A spectrophotometer and converted to tu- Bost-Usinger, L., Chen, R.J., Hillman, D., Park, H., and Burnside, B.bulin polymer concentration using a standard curve. (1997). Multiple kinesin family members expressed in teleost retina
and RPE include a novel C-terminal kinesin. Exp. Eye Res. 64,Spindown Assay 781–794.The amount of tubulin polymer was also measured by sedimenting Caplow, M., and Shanks, J. (1996). Evidence that a single monolayergluteraldehyde-fixed MTs (1% gluteraldehyde in BRB80 for 3 min) tubulin-GTP cap is both necessary and sufficient to stabilize micro-onto glass coverslips coated with 10–100 �g/ml poly-L-lysine using tubules. Mol. Biol. Cell 7, 663–675.the Airfuge EM-90 rotor (28 psi, 8 min, 23C). Coverslips were post-
Caplow, M., Ruhlen, R.L., and Shanks, J. (1994). The free energyfixed in methanol, rehydrated, blocked with 20% normal donkeyfor hydrolysis of a microtubule-bound nucleotide triphosphate isserum, processed for immunofluorescence using DMI� monoclonalnear zero: all of the free energy for hydrolysis is stored in the microtu-anti-tubulin primary antibody (Sigma Chemical Co., St. Louis, MO)bule lattice. J. Cell Biol. 127, 779–788.and TRITC-conjugated donkey anti-mouse secondary antibodyChandra, R., Endow, S.A., and Salmon, E.D. (1993). An N-terminal(Jackson ImmunoResearch Laboratories Inc., West Grove, PA), andtruncation of the ncd motor protein supports diffusional movementmounted in Vectashield mounting medium (Vector Laboratories Inc.,of microtubules in motility assays. J. Cell Sci. 104, 899–906.Burlingame, CA). The MT number concentration was determined
from the number of MTs per field and appropriate scaling to account Coue, M., Lombillo, V.A., and McIntosh, J.R. (1991). Microtubulefor the magnification, dilution, and the geometry of the EM-90 rotor. depolymerization promotes particle and chromosome movement in
vitro. J. Cell Biol. 112, 1165–1175.Stopped Flow Assay Coy, D.L., Wagenbach, M., and Howard, J. (1999). Kinesin takesAliquots of GMP-CPP MTs were thawed and diluted to 1.6 �M one 8-nm step for each ATP that it hydrolyzes. J. Biol. Chem. 274,tubulin polymer in BRB80 buffer plus 1 mM DTT. Purified MCAK 3667–3671.was diluted to various concentrations in BRB80 buffer supple-
Crevel, I.M., Lockhart, A., and Cross, R.A. (1996). Weak and strongmented with 4 mM MgATP, 150 mM KCl, and 1 mM DTT. The MTstates of kinesin and ncd. J. Mol. Biol. 257, 66–76.and MCAK solutions (both at 2� reaction concentration) were rap-
idly mixed in a stopped flow apparatus (SpectraKinetic Workstation, Desai, A., Verma, S., Mitchison, T.J., and Walczak, C.E. (1999). KinI kinesins are microtubule-destabilizing enzymes. Cell 96, 69–78.Applied Photophysics Ltd., Surrey, United Kingdom) maintained at
Depolymerase and ATPase Activities of MCAK457
Drechsel, D.N., and Kirschner, M.W. (1994). The minimum GTP cap Nicklas, R.B. (1988). The forces that move chromosomes in mitosis.Annu. Rev. Biophys. Biophys. Chem. 17, 431–449.required to stabilize microtubules. Curr. Biol. 4, 1053–1061.
Niederstrasser, H., Salehi-Had, H., Gan, E.C., Walczak, C., and No-Drechsel, D.N., Hyman, A.A., Cobb, M.H., and Kirschner, M.W.gales, E. (2002). XKCM1 acts on a single protofilament and requires(1992). Modulation of the dynamic instability of tubulin assembly bythe C terminus of tubulin. J. Mol. Biol. 316, 817–828.the microtubule-associated protein tau. Mol. Biol. Cell 3, 1141–1154.
Noda, Y., Sato-Yoshitake, R., Kondo, S., Nangaku, M., and Hirokawa,Hackney, D.D. (1995). Highly processive microtubule-stimulatedN. (1995). KIF2 is a new microtubule-based anterograde motor thatATP hydrolysis by dimeric kinesin head domains. Nature 377,transports membranous organelles distinct from those carried by448–450.kinesin heavy chain or KIF3A/B. J. Cell Biol. 129, 157–167.Howard, J. (2001). Mechanics of Motor Proteins and the Cytoskele-O’Brien, E.T., Salmon, E.D., and Erickson, H.P. (1997). How calciumton (Sunderland, MA: Sinauer Associates).causes microtubule depolymerization. Cell Motil. Cytoskeleton 36,
Howard, J., Hudspeth, A.J., and Vale, R.D. (1989). Movement of125–135.
microtubules by single kinesin molecules. Nature 342, 154–158.Okada, Y., and Hirokawa, N. (1999). A processive single-headed
Howard, J., Hunt, A.J., and Baek, S. (1993). Assay of microtubule motor: kinesin superfamily protein KIF1A. Science 283, 1152–1157.movement driven by single kinesin molecules. Methods Cell Biol.
Ovechkina, Y., Wagenbach, M., and Wordeman, L. (2002). K-loop39, 137–147.insertion restores microtubule depolymerizing activity of a “neck-
Hunt, A.J., and Howard, J. (1993). Kinesin swivels to permit microtu- less” MCAK mutant. J. Cell Biol. 159, 557–562.bule movement in any direction. Proc. Natl. Acad. Sci. USA 90,
Santama, N., Krijnse-Locker, J., Griffiths, G., Noda, Y., Hirokawa, N.,11653–11657.
and Dotti, C.G. (1998). KIF2beta, a new kinesin superfamily proteinHunt, A.J., Gittes, F., and Howard, J. (1994). The force exerted by in non-neuronal cells, is associated with lysosomes and may bea single kinesin molecule against a viscous load. Biophys. J. 67, implicated in their centrifugal translocation. EMBO J. 17, 5855–5867.766–781. Schief, W.R., and Howard, J. (2001). Conformational changes duringHunter, A.W., and Wordeman, L. (2000). How motor proteins influ- kinesin motility. Curr. Opin. Cell Biol. 13, 19–28.ence microtubule polymerization dynamics. J. Cell Sci. 113, 4379– Skibbens, R.V., Skeen, V.P., and Salmon, E.D. (1993). Directional4389. instability of kinetochore motility during chromosome congressionHyman, A., Drechsel, D., Kellogg, D., Salser, S., Sawin, K., Steffen, and segregation in mitotic newt lung cells: a push-pull mechanism.P., Wordeman, L., and Mitchison, T. (1991). Preparation of modified J. Cell Biol. 122, 859–875.tubulins. Methods Enzymol. 196, 478–485. Smith, A.D. (1997). Oxford Dictionary of Biochemistry and Molecular
Biology (Oxford: Oxford University Press).Hyman, A.A., Salser, S., Drechsel, D.N., Unwin, N., and Mitchison,T.J. (1992). Role of GTP hydrolysis in microtubule dynamics: infor- Spolar, R.S., and Record, M.T., Jr. (1994). Coupling of local foldingmation from a slowly hydrolyzable analogue, GMPCPP. Mol. Biol. to site-specific binding of proteins to DNA. Science 263, 777–784.Cell 3, 1155–1167. Stanford, N.P., Szczelkun, M.D., Marko, J.F., and Halford, S.E.Hyman, A.A., Chretien, D., Arnal, I., and Wade, R.H. (1995). Structural (2000). One- and three-dimensional pathways for proteins to reachchanges accompanying GTP hydrolysis in microtubules: information specific DNA sites. EMBO J. 19, 6546–6557.from a slowly hydrolyzable analogue guanylyl-(alpha,beta)-methyl- Tournebize, R., Popov, A., Kinoshita, K., Ashford, A.J., Rybina, S.,ene-diphosphonate. J. Cell Biol. 128, 117–125. Pozniakovsky, A., Mayer, T.U., Walczak, C.E., Karsenti, E., and Hy-Kim, A.J., and Endow, S.A. (2000). A kinesin family tree. J. Cell Sci. man, A.A. (2000). Control of microtubule dynamics by the antagonis-113, 3681–3682. tic activities of XMAP215 and XKCM1 in Xenopus egg extracts. Nat.
Cell Biol. 2, 13–19.Kinoshita, K., Arnal, I., Desai, A., Drechsel, D.N., and Hyman, A.A.Uyeda, T.Q., Kron, S.J., and Spudich, J.A. (1990). Myosin step size.(2001). Reconstitution of physiological microtubule dynamics usingEstimation from slow sliding movement of actin over low densitiespurified components. Science 294, 1340–1343.of heavy meromyosin. J. Mol. Biol. 214, 699–710.Lawrence, C.J., Malmberg, R.L., Muszynski, M.G., and Dawe, R.K.Vale, R.D., Soll, D.R., and Gibbons, I.R. (1989). One-dimensional(2002). Maximum likelihood methods reveal conservation of functiondiffusion of microtubules bound to flagellar dynein. Cell 59, 915–925.among closely related kinesin families. J. Mol. Evol. 54, 42–53.Walczak, C.E., Mitchison, T.J., and Desai, A. (1996). XKCM1: a Xeno-Lombillo, V.A., Stewart, R.J., and McIntosh, J.R. (1995). Minus-end-pus kinesin-related protein that regulates microtubule dynamicsdirected motion of kinesin-coated microspheres driven by microtu-during mitotic spindle assembly. Cell 84, 37–47.bule depolymerization. Nature 373, 161–164.Walker, R.A., O’Brien, E.T., Pryer, N.K., Soboeiro, M.F., Voter, W.A.,Mandelkow, E.M., Mandelkow, E., and Milligan, R.A. (1991). Microtu-Erickson, H.P., and Salmon, E.D. (1988). Dynamic instability of indi-bule dynamics and microtubule caps: a time-resolved cryo-electronvidual microtubules analyzed by video light microscopy: rate con-microscopy study. J. Cell Biol. 114, 977–991.stants and transition frequencies. J. Cell Biol. 107, 1437–1448.
Maney, T., Hunter, A.W., Wagenbach, M., and Wordeman, L. (1998).Walker, R.A., Pryer, N.K., and Salmon, E.D. (1991). Dilution of individ-Mitotic centromere-associated kinesin is important for anaphaseual microtubules observed in real time in vitro: evidence that capchromosome segregation. J. Cell Biol. 142, 787–801.size is small and independent of elongation rate. J. Cell Biol. 114,
Maney, T., Wagenbach, M., and Wordeman, L. (2001). Molecular 73–81.dissection of the microtubule depolymerizing activity of mitotic cen-
Waterman-Storer, C.M., and Salmon, E.D. (1998). How microtubulestromere-associated kinesin. J. Biol. Chem. 276, 34753–34758.get fluorescent speckles. Biophys. J. 75, 2059–2069.
Mickey, B., and Howard, J. (1995). Rigidity of microtubules is in-Wordeman, L., and Mitchison, T.J. (1995). Identification and partial
creased by stabilizing agents. J. Cell Biol. 130, 909–917.characterization of mitotic centromere-associated kinesin, a
Mitchison, T., and Kirschner, M. (1984). Dynamic instability of micro- kinesin-related protein that associates with centromeres during mi-tubule growth. Nature 312, 237–242. tosis. J. Cell Biol. 128, 95–104.Moores, C.A., Yu, M., Guo, J., Beraud, C., Sakowicz, R., and Milligan, Wordeman, L., Wagenbach, M., and Maney, T. (1999). Mutations inR.A. (2002). A mechanism for microtubule depolymerization by KinI the ATP-binding domain affect the subcellular distribution of mitotickinesins. Mol. Cell 9, 903–909. centromere-associated kinesin (MCAK). Cell Biol. Int. 23, 275–286.
Muller-Reichert, T., Chretien, D., Severin, F., and Hyman, A.A. (1998).Structural changes at microtubule ends accompanying GTP hydro-lysis: information from a slowly hydrolyzable analogue of GTP, gua-nylyl (alpha,beta)methylenediphosphonate. Proc. Natl. Acad. Sci.USA 95, 3661–3666.