Embed Size (px)
Citation preview
MOLECULAR BASIS OF LIFE-HISTORY EVOLUTION: A TALE OF TWO INSECTS
BY
SILVIA C. REMOLINA
DISSERTATION
Submitted in partial fulfillment of the requirements
for the degree of Doctor of Philosophy in Biology
with a concentration in Ecology, Ethology, and Evolution
in the Graduate College of the
University of Illinois at Urbana-Champaign, 2011
Urbana, Illinois
Doctoral Committee:
Associate Professor Andrew V. Suarez, Chair
Associate Professor Carla E. Cáceres, Director of Research
Professor Kimberly A. Hughes, Co-Director of Research
Professor Ken N. Paige
Associate Professor Charles W. Whitfield
ii
ABSTRACT
The field of life-history evolution is aimed at understanding the diversity of fertility and
longevity patterns observed in nature. These patterns are influenced by the interplay of traits that
directly affect the fitness of individuals, including age at first reproduction, growth rate, age-
specific fecundity, and age-specific survival. Variation in life-history strategies occurs because
of phylogenetic constraints on organisms, influence of extrinsic factors on mortality (i.e.
predation), and tradeoffs in energy allocation between competing physiological processes.
Differences in life-history strategies have been well documented at the phenotypic level but their
causal genetic mechanisms remain largely unknown.
At the genetic level, tradeoffs between lifespan and reproduction have been hypothesized
to arise because the force of natural selection decreases with advancing age and favors
pleiotropic alleles that have beneficial effects on reproduction early in life even at the cost of
survival later in life. Experimental evolution studies in Drosophila have highlighted the
existence of tradeoffs between lifespan and reproduction that seem to be consistent with the
concept of antagonistic pleiotropy. Selection for increased age at first reproduction, as well as
selection for lifespan led to increases in lifespan and reduced early life fecundity in these flies.
The underlying physiological cause of tradeoffs has been difficult to study because of the
diversity of processes that influence life-history traits. Given that increases in lifespan have
widespread influence on reproductive output, molecular geneticists interested in aging have
documented survival costs of reproduction in long-lived individuals. Mutations in signaling
pathways that couple environmental signals to key physiological processes affect growth,
reproduction and lifespan. These studies have provided molecular mechanisms that are excellent
iii
candidates for regulating life history traits. However, whether natural variation in any of these
genes is important in life history evolution remains an open question.
My dissertation research focused on understanding differences in life histories in one
eusocial and one non-social insect. Eusocial insects are good candidates to study mechanisms of
tradeoffs between fecundity and survival. Eusocial insect queens enjoy a long lifespan that does
not come at the cost of reduced fecundity, whereas workers are usually short lived and non-
reproductive. Both queens and workers can potentially develop from larvae with identical
genotypes but yet show strikingly different phenotypes as adults. My work on honey bee aging
established the importance of intrinsic physiological factors in regulating differences in lifespan
between queen and worker bees, and provided a potential mechanism for such differences.
For the second part of my dissertation, I generated fruit fly strains with divergent life-
histories to study the molecular underpinnings of life-history evolution. These studies were
designed to investigate how phenotypic tradeoffs are regulated at the molecular level. I used a
candidate gene approach to evaluate the role of insulin signaling in differential survival and
reproduction. Results from this study do not support the involvement of genes in this pathway in
life history divergence. A genome-wide screen was also employed to evaluate if other genes
were involved in regulating the tradeoff between reproduction and lifespan in my fly strains.
Genes involved in nutrient reservoir activity, stress response, and detoxification were
differentially expressed between strains. This suggests that life history divergence in my fly
lines was possible through differential energy allocation to competing processes (i.e. somatic
maintenance vs. reproduction).
Understanding variation among organisms in patterns of longevity and reproduction is a
key goal of evolutionary biology. Research on the molecular mechanisms that regulate the

iv
evolution of life history traits will allow us to link the genetic architecture of these traits to the
ecological factors that shape them and this will ultimately help us understand how organisms
adapt to their environment. The study of the mechanistic basis of tradeoffs between lifespan and
reproduction is also fundamental given the relationship between aging and other life-history
traits.
Dissertation Objectives
Objective 1: Evaluate the influence of intrinsic mortality factors in determining lifespan of
worker honey bees.
Worker honey bees of different age classes (10, 30, and 50 days of age) were exposed to
three physiological stress treatments: starvation, heat, and oxidative stress. I compared survival
curves of bees under each stressful treatment to investigate if younger bees tolerated
physiological stress better than older bees. Differences in lifespan between queen and worker
bees had previously been attributed to risks associated with foraging behavior in workers (i.e.
wear and tear, accident, hazardous weather conditions). I found that worker bees prevented from
foraging, show an age-related physiological deterioration in performance. This suggests that
differences in lifespan between queens and workers are influenced by intrinsic physiological
mechanisms.
Objective 2: Examine the involvement of the insulin-signaling pathway in the regulation of
tradeoffs between lifespan and reproduction.
I used experimental evolution to generate fly lines with divergent life histories: high early
life fecundity/short lifespan vs. low early life fecundity/long lifespan. Using quantitative real
time PCR, I measured differences in mRNA expression between my fly lines at three different

v
age classes (14, 44, and 60 days of age) for five genes in the insulin-signaling pathway.
Candidate genes were chosen based on previous studies where mutations in these genes were
shown to alter lifespan and fecundity. I did not find significant differences in expression,
suggesting that this pathway is not involved in the evolution of divergent life histories in these
flies.
Objective 3: Use a genome-wide screen to identify previously characterized and novel genes
involved in the evolution of divergent life-histories in fruit flies.
Previous results did not suggest a role for the insulin-signaling pathway in the divergence
of life histories in my fly lines. Therefore, I used microarray analysis to find candidate genes
associated with the regulation of tradeoffs between lifespan and reproduction. I found a total of
468 genes show differential expression between my fly lines. These genes are involved in
nutrient reservoir activities, response to stimuli (i.e. stress, detoxification, immunity), and in the
regulation of transcription and translation. Functional tests need to be implemented in future
studies to directly test the association of these genes with differences in lifespan and
reproduction in female flies.

vi
To My Family

vii
ACKNOWLEDGEMENTS
This long-term project would not have been made possible without the help and support
of several people. I would like to thank my advisors Dr. Kim Hughes and Dr. Carla Caceres for
believing in me and supporting me throughout my career. Thanks to the members of my
dissertation committee Dr. Ken Paige, Dr. Andy Suarez, and Dr. Charles Whitfield for helpful
discussions that contributed to improve my research projects and writing skills. Thanks to Dr.
Gene Robinson for his advice and to Daniel M. Hafez, Karen Pruiett, Dr. Miguel Corona, Dr.
Amy Toth and former undergraduate research assistants in the Robinson lab for their help with
research projects conducted on honey bees. Thanks to Dr. Thomas Newman for teaching me how
to perform molecular techniques and also for sharing products from his garden and grill with me.
I would like to thank Melissa Reedy, Dr. Jenny Drnevich, Dr. Elizabeth Ruedi, and Dr. Rose
Reynolds for their support and mentorship conducting fly research and also for their friendship.
To my dear friends Katelyn Michelini and Emma Berdan many thanks for your patience,
advise, and support. I would not have survived graduate school without such great friends.
Thanks to Dr. Scott Kreher, Trang Vu, and Katelyn Michelini for making my stay at the IGB
enjoyable. We had a great time working long hours and encouraging each other to keep going.
To the members of the Caceres team Christopher Bertram and Dr. Jelena Pantel many thanks for
coffee breaks, fun lunches, and great advice. Thanks to Jessica Heinrichs and Dr. Steven Miller
with their help on the microarray experiment conducted at FSU.
Most importantly, thank you to my family. To my uncle Pablo Molina and my aunt Maria
Teresa Acosta who have always been very supportive of my education and personal growth. To
their children Paula, Carmen and Daniel for their love and the fun times we have together. To my
parents Vicky Molina and Pedro Remolina for their love, support and especially for making

viii
learning fun. Thanks to my brother Diego Remolina, my sister Angelica Remolina, my niece and
nephew Anja and Andres, and Angelica’s mom Luz for always being there for me, and for
celebrating my small successes. Thanks to all of my Colombian friends in Urbana: Laura
Atuesta, Juan Carlos Medina, Camilo Guaqueta, Camilo Phillips, Andres Montana, Juan E.
Velasquez, Catalina Londono, Ana Maria Duque, Nano Tellez, Juan Pablo Gutierrez and
Francina Dominguez. We had a great time together and you are definitely my second family.
Finally, thanks to my husband Juan Santiago Mejia for his patience and for being a great listener.
Your advice and support really helped me grow as a person and overcome many challenges.
ix
TABLE OF CONTENTS
Chapter 1: SENESCENCE IN THE WORKER HONEY BEE Apis mellifera …….……….....1
Chapter 2: ROLE OF THE INSULIN/INSULIN-LIKE SIGNALING PATHWAY (IIS) IN
THE EVOLUTION OF LIFE-HISTORY DIVERGENCE IN THE FRUIT FLY
D. melanogaster …………………...………………………………………….…..22
Chapter 3: IDENTIFICATION OF MOLECULARLY CHARACTERIZED AND NOVEL
BIOCHEMICAL PATHWAYS INVOLVED IN LIFE-HISTORY
DIVERGENCE IN FLIES SELECTED ON AGE AT REPRODUCTION .……..48
Appendix A: HEAT MAP REPRESENTATION OF DIFFERENTIALLY EXPRESSED
GENES BETWEEN S AND C LINES ACROSS AGE AND GENERATION
FOR ABDOMEN AND HEAD TISSUE …………………………………………86
Appendix B: GENES WITH SIGNIFICANTLY DIFFERENT EXPRESSION BETWEEN S
AND C LINES ACROSS AGE AND GENERATION (LINE*AGE*GEN)
INTERACTION IN ABDOMEN TISSUE ……….…………................................87
Appendix C: GENES WITH SIGNIFICANTLY DIFFERENT EXPRESSION BETWEEN S
AND C LINES ACROSS AGE AND GENERATION (LINE*AGE*GEN)
INTERACTION IN HEAD TISSUE ……………………………………………..95
Appendix D: GENE EXPRESSION PROFILES FOR GENES DIFFERENTIALLY
EXPRESSED BETWEEN S AND C LINES WITH AGE AND GENERATION
(LINE*AGE*GEN) IN ABDOMEN AND HEAD TISSUE…..………………….96

1
CHAPTER 1
SENESCENCE IN THE WORKER HONEY BEE Apis mellifera
* This chapter includes previously published material: (Remolina et al. 2007). Permission has
been granted by El Sevier for inclusion in the publication of this dissertation.
1.1. Introduction
Senescence is defined as an age-related decline in physiological function, performance,
survival, or reproduction (Finch, 1990). Senescence (often referred to simply as “aging”) is a
nearly universal feature of multicellular organisms, and appears to occur even in unicellular yeast
and bacteria (Lithgow and Kirkwood, 1996; Kirkwood and Austad, 2000). Understanding the
biological processes that lead to senescence, and why different organisms senesce at dramatically
different rates, is a long-standing problem in both molecular and evolutionary biology (Lithgow
and Kirkwood, 1996; Finch, 1990; Rose, 1991; Partridge, 1993; Kirkwood and Austad, 2000).
In some eusocial insects (ants, bees, wasps, and termites), queens and workers of the
same species sometimes show a 100-fold difference in lifespan, with reproductive queens having
longer lifespans than the non-reproductive workers (Winston, 1987; Keller and Genoud, 1997;
Page and Peng, 2001). Strikingly, the long life of social insect queens does not come at the cost
of low reproduction: queens of many social insects lay hundreds or thousands of eggs per day
throughout their adult life. Their ability to sustain both high reproductive effort and long life
makes social insects particularly promising model systems for studies of aging (Parker et al.,
2004; Seehuus et al., 2006; Corona et al., 2005; Corona et al., 2007).
In the honey bee, Apis mellifera, queens have an average lifespan of 1–2 years and
workers have an average lifespan of 15–38 days in the summer and 140 days in the winter
(Winston, 1987). Queens and workers are not genetically distinct, so biological differences
2
between castes are due to gene expression differences that depend on social and dietary cues that
individuals experience during development (Corona et al., 2005). Therefore, studying the
comparative physiology and molecular biology of queens and workers is an attractive paradigm
for investigating proximate mechanisms of lifespan differences (Parker et al., 2004; Corona et
al., 2005). However, there is a potential serious flaw in this paradigm: it is currently not known
whether caste-specific lifespan differences result from inherent physiological differences in the
rate of senescence or, alternately, from caste-related differences in exposure to risk.
In nature, queen bees leave the protected environment of the hive only to take mating
flights at 1–2 weeks of age, and possibly once more later in their life, during colony fission. In
contrast, workers spend the first 2–3 weeks of adult life mostly in the hive performing tasks such
as brood care (“nursing”) before shifting to foraging outside the hive for nectar and pollen,
making over 10 trips a day, sometimes at distances of up to 2 km (Winston, 1987). Foragers thus
experience risks from predation, thermal stress, and physical exhaustion; risks that queens (and
pre-foragers, such as nurse bees) do not experience to the same extent. Thus, a plausible
hypothesis for the difference in queen and worker lifespan is that workers, once they become
foragers, experience high extrinsic mortality, and therefore have a much shorter mean lifespan
than queens.
Only a few studies have addressed the question of whether worker bee lifespan is
determined by senescence or exposure to extrinsic risk. Neukirch (1982) compared lifespans of
foragers with different amounts of flight experience and found that lifespan was inversely related
to daily flight experience. She argued that foragers have fixed energy reserves, and, once the
reserve is depleted, foragers cannot fly and fail to return to the hive. This idea does not require
physiological senescence. In contrast, later studies found patterns consistent with senescence.

3
Schmid-Hempel and Wolf (1988) found that workers had fixed lifespans regardless of energy
expenditure, and Visscher and Dukas (1997) found that behavioral and foraging performance
declined after 10 days of foraging (see also Tofilski, 2000). A limitation of all these studies is
that age-specific survival data were collected on foragers, and so were possibly confounded by
the cumulative effects of energy expenditure and foraging activity. Because of the lifestyle of the
forager, age-related increases in mortality rates could be due to accumulation of injuries or
exhaustion of energy reserves, which are not necessarily due to intrinsic physiological
deterioration.
We exploited the honey bee's strong plasticity for division of labor (Robinson, 1992) to
remove the confounding effects of energy expenditure and risks associated with foraging.
Worker bees respond to changing social conditions by accelerating, delaying, or reversing their
typical pattern of behavioral maturation. For example, if there is a shortage of foragers or large
numbers of young larvae in the hive, some bees delay their transition to foraging and become
“overage” nurses (Robinson et al., 1989). We studied age-specific stress resistance in overage
nurses that did not experience the extrinsic risk factors associated with foraging. We predicted
that if there is worker senescence, then older bees should have lower survival under each stress
treatment than younger bees.
1.2. Materials and methods
1.2.1. Experimental colonies
We set up five single-cohort colonies (Robinson et al., 1989), each initially composed of
ca. 10,000 1-day-old bees. We obtained 1-day-old worker bees by removing frames of pupae
from typical field colonies (headed by naturally mated queens) and placing them in an incubator
4
(34 °C and 80% relative humidity). The bees were marked with a paint dot on the dorsal thorax,
color coded according to day of emergence and source colony. This process was continued over
a 5-day period for each colony to obtain the 10,000 bees. Each single-cohort colony was then
given a (naturally mated) queen, 4 frames of honey and pollen, and 2 frames for the queen to lay
eggs in. We encouraged the development of overage nurses by removing frames of brood prior to
the emergence of new adult bees, and replacing them with frames of younger brood.
1.2.2. Collections of bees
At each collection date, we collected 300 bees from each age class (10, 30, and 50 days
old) that was available at that date. We collected bees that were displaying typical nursing
behavior (head in cell containing a larva; see Huang and Robinson (1996)). Collections were
made when foragers were out of the hive during times of active foraging to minimize the chances
of misidentification. The five single-cohort colonies were set up in a time-staggered design, so
that bees of different age classes were available on the same day (Fig. 1). We were thus able to
evaluate the effects of age on stress resistance, and decouple these effects from the effects of
source colony and date of collection (seasonality). Bees were held individually in cages within a
plexiglass tray, provided with 50% sucrose solution ad lib, and kept at constant temperature
(34 °C) for 24 h, prior to the start of the stress tests. After 24 h, the surviving bees were
randomly assigned to the three treatment groups. Total sample sizes for each age class and
treatment group are given in Table 1.
1.2.3. Stress tests
To detect senescence, we measured the effects of oxidative stress, heat stress, and
starvation on bees from each age class. Resistance to these stressors typically declines in
senescing insects, causing increased mortality (Luckinbill et al., 1984; Rose, 1984; Nghiem et
5
al., 2000). After the collections were made, during the next 24 h, bees were housed in an
incubator at 34 °C and were provided a 50% sucrose solution so that they could feed freely.
After that, bees of the same age class that were still alive were randomly assigned to three
different trays and one of the three trays was assigned to each one of the treatments (starvation,
heat stress, or hydrogen peroxide). Treatment details are as follows. Hydrogen peroxide: Bees
were given a 50% sucrose solution that contained 20% hydrogen peroxide. This dose was based
on results from Drosophila melanogaster that showed that a dose of 5% hydrogen peroxide
produced high mortality (Sun and Tower, 1999), adjusting for differences in body mass between
honey bees and fruit flies. Heat stress: We exposed bees to 42 °C in an incubator; colonies
typically maintain their hives at approximately 34 °C by behavioral thermoregulation, and it has
been reported (Mardan and Kevan, 2002) that bees kept at 42 °C showed decreased longevity.
Bees were kept at 42 °C until they died. Starvation: Bees were maintained in an incubator
without any food at 34 °C, and were provided with water to prevent desiccation. In all
treatments, bees were housed in individual cages within a plexiglass tray. With the exception of
the starvation treatment, food was provided in the tray, and bees were allowed to feed freely.
Food in the trays was replaced every 6 h, and water was replenished for the bees in the starvation
treatment. Food replacement was of special importance for the hydrogen peroxide treatment,
since hydrogen peroxide degrades in water. Bees in all incubators were maintained in a 24-hour
dark cycle; the hive is naturally dark, except for whatever light penetrates from the hive entrance.
1.2.4. Censusing mortality
Bees were censused at 0:00, 6:00, 12:00, and 18:00 h until all were dead. Information on
age and source colony was obtained from the thorax markings. Six bees escaped during the
experiment (3 in the heat stress and 3 in the starvation treatment) the escape time of these bees

6
was treated as a right-censored observation in the data analysis.
1.2.5. Lipid analysis
Because the most striking differences in age-specific stress resistance were observed in
the starvation test (see Results), we explored whether the results could be explained by
differences in lipid reserves. We measured the abdominal lipid levels of young and overage
nurses, using foragers as a comparison group, since foragers have the lowest lipid levels among
worker bees (Toth and Robinson, 2005). We used young nurses less than 7 days of age (n=23),
50-day-old nurses (n=23) and 50-day-old foragers (n=22). Each abdomen was dissected and the
digestive tract and sting apparatus removed; abdomens were then freeze-dried, homogenized in a
2:1 chloroform:methanol solution, and dried down to a constant volume of 2 ml. The lipid assay
was performed using 100 µl of each sample, following the procedures in Toth et al. (2005). We
measured the absorbance of each sample using a SpectraMax 190 spectrophotometer (Molecular
Devices, CA), with readings at 525 nm. Absorbance readings were converted to milligrams of
lipid using a cholesterol standard. The lipid assay was performed twice on each sample.
1.2.6. Data analysis
We calculated Kaplan–Meier (product-limit) survival estimates for the 10-, 30-, and 50-
day-old workers for each stress treatment. We tested for differences in survival among age
classes within a treatment using the log-rank and Wilcoxon tests produced by SAS Proc Lifetest
(SAS System v.9.1). Wilcoxon tests are more sensitive to differences in survival occurring
earlier in the trials, while log-rank tests are more sensitive to differences that occur later (Allison,
1995). Results of both tests were consistent in every case, so we report only the log-rank test
results. We also tested for significant differences between age classes using Cox proportional
hazards models as implemented in SAS Proc Phreg. This test allowed direct comparison of the

7
hazard rate (risk of death per unit time) for each age class within a treatment group, and formal
statistical tests for pairwise differences in hazard rates between age classes (Allison, 1995). In
this analysis, a hazard ratio >1 indicates a higher hazard for the older bees, and a value <1
indicates a lower hazard for the older bees. We repeated the pairwise contrast analysis after
removing data for colonies 4 and 5; because these colonies are represented by two (or one) age
classes, there is a possibility of confounding age and colony effects. For the analysis of lipid
data, we treated the replicate measures for each sample as repeated measures in a general linear
model (repeated measures ANOVA) using SAS Proc Mixed (Littell et al., 2002).
1.3. Results
Mean survival times for 10-day-old bees were longer than for older bees in all three stress
tests (Table 1). Survival curves show that 10-day-old bees had higher survival at each time point
than did 50-day-old bees (Fig. 2). Log-rank tests of survival times indicated that age classes
differed significantly for the starvation (!2=202.6, p<0.0001) and heat stress treatments (!
2=20.9,
p<0.0001), but not for the hydrogen peroxide treatment (!2=2.6, p=0.27). However, the semi-
parametric tests of the proportional hazards model indicated that differences in hazard rates
between age classes were significant for all three treatments: starvation (!2=102.2, p<0.0001),
heat stress (!2=50.82, p<0.0001), and hydrogen peroxide (!
2=7.8, p=0.0205).
Similarly, pairwise contrasts of the hazard rates within treatments indicated that 10-day-
old bees had significantly lower mortality per unit time than did 50-day olds in each treatment
(Table 2). All hazard ratio estimates were >1, indicating higher mortality rates for older bees in
each comparison; comparisons were significant in 6 out of 9 pairwise tests, and marginally non-
significant at P=0.05 in one additional comparison (Table 2). Limiting the analysis to colonies

8
1–3 produced qualitatively identical results. In this analysis, 10-day-old bees had significantly
lower mortality than 50-day-old bees in all three stress treatments (Appendix 1).
Hazard ratios for each pairwise comparison between age classes (ratio of older to
younger bees); degrees of freedom=1 in every case. Results in bold indicate significant
differences. There were no significant differences in stored lipid in young and old nurses
(F[1,64]=2.6, P=0.12, Fig. 3). Both young and old nurses had significantly higher lipid content than
foragers (young nurses vs. foragers, F[1,64]=52.3, P<0.0001; old nurses vs. foragers, F[1,64]=31.9,
P<0.0001). These results indicate that results of the starvation test are not attributable to
differences in stored lipids between young and old nurse bees; overage nurses have lipid levels
characteristic of nurses, and not of foragers. These results are consistent with findings from Toth
et al., 2005.
1.4. Discussion
Our results provide the first clear demonstration of worker honey bee senescence. In our
experiments, this physiological decline began between 10 and 30 days of age and continued
through 50 days of age. These results indicate that honey bee workers experience an intrinsic
physiological decline at an age that is consistent with their observed maximal lifespan in the
summer and their longevity does not depend solely on extrinsic mortality factors.
Our results are unlikely to be due to differences in physical activity because we used overage
nurses rather than foragers. It is unlikely that our results, especially for the starvation treatment,
can be attributed to older nurses having lower nutritional reserves than younger nurses. Our lipid
analysis showed no difference between lipid stores in young and overage nurses, but other
nutritional indicators such as glycogen content were not measured. We conclude that the marked

9
decline in stress resistance in 30- and 50-day-old bees strongly suggests physiological
senescence.
Results from the heat stress assay indicated that 30- and 50-day-old bees were more
likely to die than 10-day-old bees. Although the differences were highly significant, they were
less extreme than in the starvation assay. Perhaps, this is because the treatment was relatively
less extreme. Honey bees can tolerate temperatures up to 45 °C for at least 2 h, and humidity is
an important factor in their ability to tolerate high temperatures (Free and Spencer-Booth, 1962).
Perhaps our treatment was not as stressful as it could have been, because bees were provided
with an unlimited source of sugar syrup and full water containers were kept in the incubator at all
times.
Differences between age classes in the hydrogen peroxide treatment were relatively small
(though statistically significant) compared with the starvation and heat treatments. It seems
unlikely that bees in the hydrogen peroxide treatment were not feeding, since the median lifespan
of bees of all age classes surpassed that of bees in the starvation treatment. It is possible that the
concentration of hydrogen peroxide we used was too weak to induce much oxidative stress or
stress-related mortality in our bees. This speculation is supported by the observation that
paraquat (another free radical-inducing agent) caused greater mortality in a comparable
experiment (Corona et al., 2007). In that experiment, the median lifespan for worker bees 30
days of age was 33 h, compared with 66 h in our experiment. This observation is further
supported by another experiment comparing paraquat-induced oxidative stress resistance in
worker bees where complete mortality was reached within 60 h of paraquat injection (Seehuus et
al., 2006).
Hydrogen peroxide is an oxidizing agent that slowly decomposes into water and oxygen

10
at room temperature. The decomposition of hydrogen peroxide can be accelerated in the presence
of light and at high temperatures, increasing by a factor of 2.2 for every 10 °C rise in
temperature. Such decomposition is also catalyzed by dissolved ions of metals, and suspended
oxides and hydroxides (Goor et al., 1992). Even though we replaced the hydrogen peroxide and
sugar solution in the trays every 6 h, there is a possibility that the decomposition of hydrogen
peroxide into water and oxygen may have caused failure to induce mortality in our bees.
Rueppell et al. (2005) found that age-specific mortality increased exponentially in drones after
about the 10th day of flying activity, consistent with either senescence, non-replenishment of
resources, or ‘wear and tear’. They also reported that lifespan after the initiation of flying activity
was negatively correlated with age at first flight, and suggested that this pattern was due to the
onset of senescence even before the initiation of flight. This suggestion is consistent with our
experimental results for workers.
Senescence of honey bee hemocytic cells has been reported by (Amdam et al., 2004) and
(Amdam et al., 2005). Amdam et al. (2004) found that foragers had low zinc concentrations
compared with nurses, which in turn resulted in decreased hemocyte counts in the hemolymph;
foragers also possessed a higher number of pycnotic cells than nurses. Working with reverted
nurses, Amdam et al. (2005) showed that these changes were related to both age and behavioral
role; reverted nurses had a higher hemocyte count relative to similarly aged bees that continued
to forage, but reverted nurses had lower counts relative to normal-age (young) nurses. The
authors assumed that hemocyte count and cell pycnosis are measures of senescence at the
cellular level. There are no data on the relationship between hemocyte count and immune
response or mortality rate, so it is not clear in this case that cellular senescence leads to
organismal senescence.

11
Our results show that worker bees show senescence. In contrast, in a recent study
Rueppell et al. (2007) assessed age-dependent behavioral performance of foragers using a battery
of behavioral tests that included light sensitivity, sucrose responsiveness, learning of olfactory
cues, and walking velocity. In that study, the authors concluded that worker bees did not exhibit
an age-dependent decline in performance but showed an increase in mortality with chronological
age. The discrepancies between our results and those of Ruepell et al. may be attributed to the
nature of the behavioral tests employed. Although the behavioral tests employed are related to
foraging activity they may not prove demanding to the bees, and thus not allow the possibility
for a decline to be manifest. Previous studies in D. melanogaster show that age-related declines
in behavior differ, depending on the nature of the behavior being tested, the genotype, and the
gender of the flies (Fernandez et al., 1999; Martin and Grotewiel, 2006; Simon et al., 2006).
We have shown here that limited worker lifespan is due at least in part to intrinsic senescence
and not solely to extrinsic mortality factors. Of interest would be to determine if honey bee
queens also show senescence. Studying senescence in queens is a more difficult question to
address than in workers, given their extended lifespan. In addition, conducting such tests in a
eusocial species presents special challenges since queens are fed and groomed by workers.
Although we did not directly study queen senescence, queens are known to lay up to 2000 eggs
per day and the laying rate does not appear to decline at least through the first year of life
(Winston, 1987), suggesting negligible senescence during this period. In contrast, we have
shown that senescence in workers begins before 50 days of age. This comparison suggests that
the extended lifespan of queens is due to slower senescence, and not just to lower extrinsic
mortality.

12
1.5. Acknowledgements
We thank Karen Pruiett for field assistance; Charles Nye, Sara Kantarovich, Spencer
Beard, Gabriel Fuenzalida, Aaron Bergman, and Adam Escalante for assistance with nurse bee
collections; Amy Toth and James Bilof for assistance with lipid assays, and members of the
Hughes and Robinson laboratories for comments that improved the manuscript. Supported by
NIH-NIA grant AG022824 (GER and KAH).
1.6. References
Allison, 1995 P.D. Allison, Survival Analysis Using SAS: A Practical Guide, SAS Institute,
Cary, NC.
Amdam et al., 2004 G.V. Amdam, Z.L.P. Simões, A. Hagen, K. Norberg, K. Schrøder, O.
Mikkelsen, T.B.L. Kirkwood and S.W. Omholt, Hormonal control of the yolk precursor
vitellogenin regulates immune function and longevity in honeybees, Experimental Gerontology
39: 767–773.
Amdam et al., 2005 G.V. Amdam, A.L.T.O. Aase, S.C. Seehuus, M.K. Fondrk, K. Norberg and
K. Hartfelder, Social reversal of immunosenescence in honey bee workers, Experimental
Gerontology 40: 939–947.
Corona et al., 2005 M. Corona, K.A. Hughes, D.B. Weaver and G.E. Robinson, Gene expression
patterns associated with queen honey bee longevity, Mechanisms of Ageing and Development
126: 1230–1238.
Corona et al., 2007 M. Corona, R.V. Velarde, S. Remolina, A. Moran-Lauter, K.A. Hughes and
G.E. Robinson, Vitellogenin, juvenile hormone, insulin signaling and queen honey bee
longevity, Proceedings of the National Academy of Sciences of the United States of America
104: 7128–7133.
Fernandez, 1999 J.R. Fernandez, N.M. Grant, L.M. Tulli and G.E. McClearn, Differences in
locomotor activity across the lifespan of Drosophila melanogaster, Experimental Gerontology
34: 621–631.
Finch, 1990 C.E. Finch, Longevity, Senescence, and the Genome, The University of Chicago
Press, Chicago (1990).
Free and Spencer-Booth, 1962 J.B. Free and Y. Spencer-Booth, The upper lethal temperatures of
honeybees, Entomologia Experimentalis et Applicata 5: 249–254.
Goor et al., 1992 G. Goor, J. Glenneberg and S. Jacobi, Hydrogen Peroxide. Ullmann's
Encyclopedia of Industrial Chemistry, Wiley-VHC, India (1992).

13
Huang and Robinson, 1996 Z.-Y. Huang and G.E. Robinson, Regulation of honey bee division of
labor by colony age demography, Behavioral Ecology and Sociobiology 39: 147–158.
Keller and Genoud, 1997 L. Keller and M. Genoud, Extraordinary lifespans in ants: a test of
evolutionary theories of ageing, Nature 389: 958–960.
Kirkwood and Austad, 2000 T.B.L. Kirkwood and S. Austad, Why do we age?, Nature 408:
233–238.
Lithgow and Kirkwood, 1996 G.J. Lithgow and T.B.L. Kirkwood, Mechanisms and evolution of
aging, Science 273: 5271–5280.
Littell et al., 2002 R.C. Littell, W.W. Stroup and R.J. Freund, SAS for Linear Models, SAS
Institute, Cary, N.C.
Luckinbill et al., 1984 L.S. Luckinbill, R. Arking, M.J. Clare, W.C. Cirocco and S.A. Buck,
Selection for delayed senescence in Drosophila melanogaster, Evolution 38: 996–1003.
Mardan and Kevan, 2002 M. Mardan and P.G. Kevan, Critical temperatures for survival of brood
and adult workers of the giant honeybee, Apis dorsata (Hymenoptera: Apidae), Apidologie 33:
295–301.
Martin and Grotewiel, 2006 I. Martin and M.S. Grotewiel, Distinct genetic influences on
locomotor senescence in Drosophila revealed by a series of metrical analyses, Experimental
Gerontology 41: 877–881.
Neukirch, 1982 A. Neukirch, Dependence of the lifespan of the Honeybee (Apis mellifica) upon
flight performance and energy consumption, Journal of Comparative Physiology B146: 35–40.
Nghiem et al., 2000 D. Nghiem, A.G. Gibbs, M.R. Rose and T.J. Bradley, Postponed aging and
desiccation resistance in Drosophila melanogaster, Experimental Gerontology 35: 957–969.
Page and Peng, 2001 R.E. Page and C.Y.S. Peng, Aging and development in social insects with
emphasis on the honey bee, Apis mellifera L, Experimental Gerontology 36: 695–711.
Parker et al., 2004 J.D. Parker, K.M. Parker, B.H. Sohal, R.S. Sohal and L. Keller, Decreased
expression of Cu–Zn superoxide dismutase 1 in ants with extreme life-span, Proceedings of the
National Academy of Sciences of the United States of America 101: 3486–3489.
Partridge, 1993 L. Partridge, Evolution of aging: testing the theory using Drosophila, Genetica
91: 89–98.
Robinson, 1992 G.E. Robinson, Regulation of division of labor in insect societies, Annual
Review of Entomology 37: 637–665.

14
Robinson et al., 1989 G.E. Robinson, R.E. Page, C. Strambi and A. Strambi, Hormonal and
genetic control of behavioral integration in honeybee colonies, Science 246: 109–112.
Rose, 1984 M. Rose, Laboratory evolution of postponed senescence in Drosophila melanogaster,
Evolution 38: 1004–1010.
Rose, 1991 M. Rose, Evolutionary Biology of Aging, Oxford University Press, New York.
Rueppell et al., 2005 O. Rueppell, K. Fondrk and R. Page, Biodemographic analysis of male
honey bee mortality, Aging Cell 4: 13–19.
Rueppell et al., 2007 O. Rueppell, S. Christine, C. Mulcrone and L. Groves, Aging without
functional senescence in honey bee workers, Current Biology 17: R274–R275.
Schmid-Hempel and Wolf, 1988 P. Schmid-Hempel and T. Wolf, Foraging effort and lifespan of
workers in a social insect, The Journal of Animal Ecology 57: 509–521.
Seehuus et al., 2006 S.C. Seehuus, K. Norberg, U. Gimsa, T. Krekling and G.V. Amdam,
Reproductive protein protects functionally sterile honey bee workers from oxidative stress,
Proceedings of the National Academy of Sciences of the United States of America 103: 962–
967.
Simon et al., 2006 A.F. Simon, D.T. Liang and D.E. Krantz, Differential decline in behavioral
performance of Drosophila melanogaster with age, Mechanisms of Ageing and Development
127: 647–651.
Sun and Tower, 1999 J. Sun and J. Tower, FLP recombinase-mediated induction of Cu/Zn-
superoxide dismutase transgene expression can extend the life span of adult Drosophila
melanogaster flies, Molecular and Cellular Biology 19: 216–228.
Tofilski, 2000 A. Tofilski, Senescence and learning in honeybee (Apis mellifera) workers, Acta
Neurobiologiae Experimentalis 60: 35–39.
Toth and Robinson, 2005 A.L. Toth and G.E. Robinson, Worker nutrition and division of labour
in honeybees, Animal Behaviour 69: 427–435.
Toth et al., 2005 A.L. Toth, S. Kantarovich, A.F. Meisel and G.E. Robinson, Nutritional status
influences socially regulated foraging ontogeny in honey bees, The Journal of Experimental
Biology 208: 4641–4649.
Visscher and Dukas, 1997 P.K. Visscher and R. Dukas, Survivorship of foraging honeybees,
Insectes Sociaux 44: 1–5.
Winston, 1987 M.L. Winston, The Biology of the Honey Bee, Harvard University Press,
Cambridge, MA (1987).

15
Table 1. Effects of starvation, heat, and hydrogen peroxide (oxidative stress) on lifespan for
nurse honey bees 10, 30, and 50 days of age. Mean and median lifespan (h).
Treatment Age class Mean (S.E) Median Sample Size
Starvation 10 91 (5.0) 42 478
30 46 (1.4) 36 375
50 31 (0.9) 24 287
Heat 10 120 (2.2) 120 484
30 107 (2.5) 102 371
50 106 (2.6) 102 288
Hydrogen Peroxide 10 82 (2.5) 75 479
30 81 (2.8) 66 371
50 75 (2.5) 66 287

16
Table 2. Effects of starvation, heat, and hydrogen peroxide (peroxide) on lifespan for nurse
honey bees 10, 30, and 50 days of age. Hazard ratios for each pairwise comparison between age
classes (ratio of older to younger bees); degrees of freedom = 1 in every case. Results in bold
indicate significant differences.
Treatment Contrast Hazard ratio Confidence limits !2 P
Starvation 10 vs. 30 1.514 1.280 1.791 23.4 <.0001
Starvation 10 vs. 50 2.637 2.183 3.184 101.4 <.0001
Starvation 30 vs. 50 1.741 1.469 2.064 40.9 <.0001
Heat 10 vs. 30 1.506 1.3 1.744 29.7 <.0001
Heat 10 vs. 50 1.739 1.475 2.049 43.5 <.0001
Heat 30 vs. 50 1.155 0.982 1.358 3.0 0.08
Peroxide 10 vs. 30 1.073 0.927 1.241 0.9 0.34
Peroxide 10 vs. 50 1.257 1.069 1.478 7.6 0.006
Peroxide 30 vs. 50 1.172 0.998 1.376 3.7 0.05
17
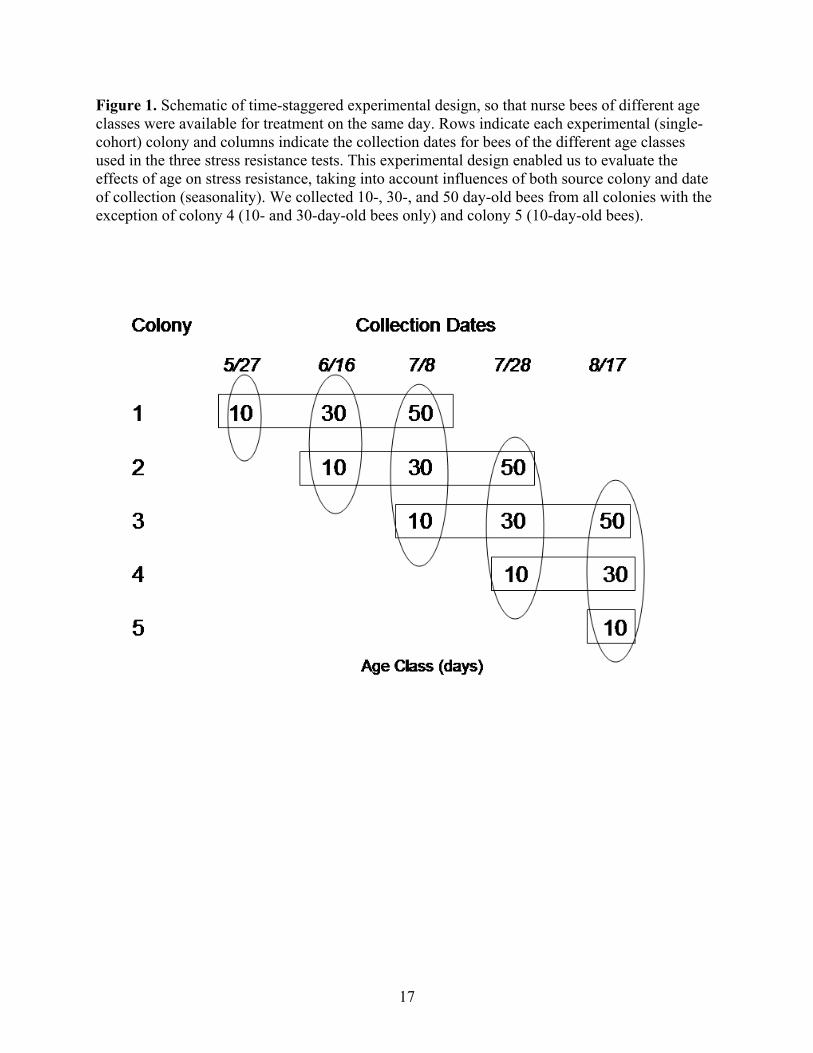
Figure 1. Schematic of time-staggered experimental design, so that nurse bees of different age
classes were available for treatment on the same day. Rows indicate each experimental (single-
cohort) colony and columns indicate the collection dates for bees of the different age classes
used in the three stress resistance tests. This experimental design enabled us to evaluate the
effects of age on stress resistance, taking into account influences of both source colony and date
of collection (seasonality). We collected 10-, 30-, and 50 day-old bees from all colonies with the
exception of colony 4 (10- and 30-day-old bees only) and colony 5 (10-day-old bees).

18
Figure 2. Age-related differences in resistance to: (a) starvation; (b) heat, and (c) hydrogen peroxide in nurse honey bees. Cumulative hazard function (-
Log(Survival), bottom) and Survival distribution function (top) of 10- (red) 30- (blue) and 50-day-old (black) nurse bees. Bees were censused every 6 h. Note
difference in scale for treatments. Eighteen 10-day-old bees were alive in the starvation treatment; one 10-day-old bee and one 30-day-old bee were alive in the
hydrogen peroxide treatment after 350 h of exposure to stress.
2A Starvation

19
Figure 2 (cont.)
2B Heat

20
Figure 2 (cont.)
2C Hydrogen Peroxide

21
Figure 3. Abdominal lipid content for 7-day-old nurses, 50-day-old nurses, and 50-day-old
foragers. Letters indicate groups that differ significantly in mean lipid content by pair-wise
contrasts. Numbers at bottom of bars indicate sample size.

22
CHAPTER 2
ROLE OF THE INSULIN/INSULIN-LIKE SIGNALING PATHWAY (IIS) IN THE
EVOLUTION OF LIFE HISTORY DIVERGENCE IN THE FRUIT FLY D. melanogaster
2.1. Introduction
The best-known example of a molecular mechanism that can regulate life history traits is
a conserved signal transduction pathway involving insulin and insulin-like molecules. The
Insulin/insulin-like signaling pathway (IIS) is a component of an evolutionarily conserved
neurosecretory pathway that regulates development and aging in response to environmental cues
such as food availability (Gems and Partridge, 2001). The IIS pathway is involved in the
coordination of growth, metabolism, development, reproduction, and lifespan in Caenorhabditis
elegans, Drosophila melanogaster, and mammals (Reviewed in Kenyon, 2001; Gems and
Partridge, 2001; Taguchi and White, 2008). Genetic manipulation of the pathway can lead to
lifespan extension in worms, flies and mice, and recent studies have linked genetic variation in
components of the insulin-signaling pathway to long lifespan in humans (Van Heemst et al.,
2005; Pawlikowska et al., 2009; Kojima, et al., 2004; Suh et al., 2008). The IIS pathway is
hypothesized to be a mechanism used to tune the life history of an organism to the prevailing
environment because it signals the availability of nutrients and it can potentially coordinate the
allocation of energy between reproduction and body maintenance (Kenyon, 2001; Partridge and
Gems, 2002; Gems and Partridge, 2001). Genes in this pathway are therefore obvious candidates
for regulating life history patterns. Nevertheless, it has not been demonstrated that these genes
actually do control natural variation in lifespan or reproduction in any organism.
Dissection of IIS pathway function first occurred in C. elegans. In the roundworm, the
IIS pathway is characterized by a cell surface receptor (daf-2) that is activated by insulin-like

23
ligands. Thirty-seven such ligands have been identified in the nematode worm. The IIS signaling
cascade ultimately deactivates a fork-head transcription factor (daf-16), which is inactivated by
its translocation outside of the nucleus. The daf-2 pathway also regulates the formation of a
quiescent state know as the dauer which enables worms to survive adverse conditions such as
food shortage or crowding. Worms in the dauer state are developmentally arrested, highly stress
resistant, and non-reproductive. Once signaling through the daf-2 pathway resumes, worms
become reproductive and their lifespan is restored to that of the wildtype (Guarente and Kenyon,
2000). Daf-2 regulates dauer formation and lifespan in a cell non-autonomous fashion (Apfeld
and Kenyon, 1998). Secondary signals downstream of daf-16, hormonal signals in the germline
and somatic gonad tissue also act to influence lifespan and reproduction (Hsin and Kenyon,
1999; Arantes-Oliveira et al., 2002).
A similar pathway operates in the fruit fly D. melanogaster (Figure 4). In flies, the
insulin receptor (InR) transduces the signal from the insulin-like peptides (dilp’s 1-7) to the
phosphatidyl inositol-3-OH-kinase (PI3K) either directly or through the insulin receptor substrate
(chico). PI3K phosphorylates phosphatidyl inositol-(4,5)-biphosphate (PIP2) to phosphatidyl
inositol-(3,4,5)-triphosphate (PIP3). This activity is antagonized by the PTEN phosphatase. High
levels of PIP3 recruit PKB to the plasma membrane where it can be further activated by the
phosphoinositide-dependent kinase (PKD). Activated PKB levels are associated with the
phosphorylation and inactivation of the fly forkhead transcription factor (FOXO) and its
exclusion from the nucleus. Elevation of IIS signaling results in decreased FOXO transcriptional
activity in the nucleus and decreased IIS signaling leads to increased transcriptional regulation
by FOXO (Giannakou and Partridge, 2005). FOXO serves as a transcription factor that can up-
regulate genes involved in lifespan extension, such as antioxidant and detoxification genes.

24
Interventions known to increase lifespan in fruit flies include mutations in the insulin
receptor (InR) (Tatar et al., 2001), insulin receptor substrate (chico) (Clancy et al., 2001), over-
expression of FOXO in the head and abdomen fat body (Hwangbo et al., 2004, Giannakou et al.,
2004), over-expression of PTEN in head fat body (Hwangbo et al., 2004), and decreased
expression of insulin-like ligands (dilp’s) (Broughton et al., 2005). The phenotypes seen in long-
lived Drosophila with decreased IIS signaling are similar to those seen in long-lived worms:
reduced or delayed fecundity, increased stress resistance, and increased fat storage (Giannakou
and Partridge, 2007).
In flies, as in worms, lifespan and reproduction are coordinated by endocrine signals.
Insects produce a sequisterpenoid hormone known as juvenile hormone (JH). JH is involved in
complex processes such as development, reproduction, diapause, migration, and division of labor
in social insects. During reproduction, JH regulates germline maturation, vitellogenesis,
courtship behavior, and pheromone production (Klowden, 2002). InR and Chico mutants have
reduced JH synthesis (Tu et al, 2005). Addition of JH to diapausing flies restores vitellogenesis
and shortens lifespan (Tatar et al, 2001). Other hormones involved in metamorphosis and
reproduction are ecdysteroids. InR mutants show reduced synthesis of ecdysteroids in the ovary
(Tu et al, 2002). Mutations on the ecdysone receptor (EcR) have been shown to increase lifespan
in flies (Simon et al, 2003). From these observations, JH and ecdysteroids have been
hypothesized to serve as secondary pro aging signals downstream of the IIS pathway. JH and
ecdysteroids promote reproduction and shorten lifespan (Tu et al, 2006).
To determine whether genes in the IIS pathway are responsible for natural variation in
lifespan and reproduction, I combined experimental evolution and gene expression analysis.
First, I created strains of flies that differ in their life histories and show a genetically based

25
tradeoff between early and late life performance. I then used quantitative real-time PCR (qRT-
PCR) to measure mRNA expression of five genes in the IIS pathway (dilp2, InR, chico, pkb,
foxo) that have been shown to cause lifespan extension in D. melanogaster.
In addition, I measured mRNA expression of two yolk protein genes. I included the yolk
protein genes YP1 and CG31150 because recent experiments have implicated a yolk protein in
the extended longevity and high late-life fertility of queen honey bees. In honey bees, the protein
vitellogenin (Vg) is involved in yolk deposition in eggs, and has other pleiotropic functions. It
regulates division of labor and serves as an antioxidant that scavenges free radicals that cause
oxidative stress (Seehuus et al., 2006; Munch et al., 2008). Long-lived and highly fertile queen
honey bees have higher vitellogenin titers in the head, thorax, and abdomen than female honey
bees of the worker caste (Corona et al., 2007). To test the hypothesis that evolution of long life
and high late-life fertility in my selection lines exploited the same mechanism that has been
postulated to confer these traits in social insect queens (which have the longest-lived adult stages
known in insects), I evaluated the fly ortholog of honey bee Vg (CG31150) and YP1, which is the
most abundant yolk protein in female fruit flies.
2.2. Methods
2.2.1. Selection on Life History
To study the effects of the IIS pathway on life-history divergence I created 3 paired and
replicated fly lines with divergent life histories: flies in the Control (C) lines have increased early
fecundity and a short lifespan, whereas flies in the Selection (S) lines have high late life
fecundity and increased lifespan. The S and C lines within a pair were initiated from the same
320 male and 320 female flies, so that the lines started with the same genetic composition. The

26
three different S-C pairs were started from three different sets of parents to create independent
draws from the same ancestral population. The ancestral population was derived from
approximately 8000 offspring of 400 wild caught females collected in New Jersey in 1998 and
maintained in the lab at large population size (>5000 individuals) with overlapping generations.
Flies in the ancestral population were transferred to new media every 2 weeks.
Each generation, S and C lines were propagated from 320 single-pair matings. Equal
numbers of virgin offspring were collected from each pair and allowed to age in single sex vials
at a density of 25 flies per vial. In S lines, only flies that survive and are fertile at >44 days of age
can contribute to the next generation, while in C lines, flies that survive and are fertile at 14 days
will contribute to the next generation. C lines were thus maintained in a similar fashion
compared to flies in the ancestral population. To avoid differential selection on developmental
time, we collected newly eclosed virgin adults at a fixed time after egg-laying (10-12 days post-
mating).
After virgin flies from the S and C lines reached the appropriate age, single virgin
females and virgin males were paired to produce 320 single pair matings. Flies were paired at
random to minimize inbreeding. Only flies that survived and were fertile at the time of mating
were able to contribute to the next generation (C lines: 14 days of age, S lines: 44 days of age).
2.2.2. Lifespan Assays
We collected 1,600 virgin female flies from each control and selection line to assay adult
survival. Flies were lightly anesthetized using CO2 and 6 female flies were placed into 8-dram
vials with cornmeal media. We established 100 vials each with 6 virgin females per S and C line.
Flies were kept in an incubator at 25C on a 12L:12D light cycle. Flies were transferred to fresh

27
media every week. At the time of transfer I recorded the number of flies that were alive. Flies
that escaped the vial at the time of transfer were recorded as censored.
2.2.3. Age-specific Fecundity Assay
Fecundity was measured at 7, 14, 35, 44, and 60 days of age for all S and C lines. For
every assay, three virgin females and three virgin males of the appropriate age class were
allowed to mate in a single vial. Trials for every age class included fifty vials each with three
mating pairs of flies. Flies were allowed to mate for twenty-four hours and were discarded after
this time period. Before discarding flies, I recorded the number of females that were alive.
Offspring were allowed to develop to adulthood and after 17 days of the initial mating between
the parents; offspring that had emerged were frozen and counted.
2.2.4. Age-specific Gene Expression
To determine if S and C lines differed in a consistent way with respect to expression of
IIS genes and yolk protein genes, I collected newly-emerged female flies from two S-C pairs and
allowed them to age for 14, 44, and 60 Days. C flies were collected and frozen at 14 and 44 days
of age; S flies were collected and frozen at 14, 44, and 60 days of age. Flies were transferred to
fresh media every week. Once flies reached the appropriate age, they were lightly anesthetized
using CO2 and frozen on dry ice. All flies were frozen at 9 a.m. to avoid circadian effects on
gene expression. For each line-age-tissue combination, I assessed gene expression in 10
independent (biological) replicates, and pooled tissue from 10 individual females for each
replicate. Flies were stored at -80C for later dissection. I extracted RNA from pooled heads and
abdomens using TRIzol (Invitrogen) and the manufacturer’s protocol. RNA was quantified using
a spectrophotometer (Nanodrop) at 260 nm, and checked for purity by examining the 260/280
28
nm ratio. All samples had a ratio > 1.8. RNA samples were treated with Turbo DNAse (Ambion)
to eliminate any remaining genomic DNA following the manufacturer’s instructions.
For cDNA synthesis, 200 ng of RNA were reverse transcribed using a mixture of 2µl
10X first strand ArrayScript buffer (Ambion), 1µl 10mM dNTP mix (Applied Biosystems), 0.2
µl RNase inhibitor (Applied Biosystems), and 0.2 µl 200U/ul ArrayScript (Ambion). I spiked in
0.1µl of RCP1 (root cap protein) cRNA into each reaction as an exogenous control. Gene
quantity values of each sample were normalized to corresponding RCP1 quantity values to
account for variation in cDNA synthesis reactions. Reactions were incubated at 42ºC for 60
minutes then at 95ºC for 5 minutes.
I used quantitative real-time polymerase chain reaction (qRT-PCR) to measure mRNA
abundance levels of dilp2, InR, chico, pkb, foxo, fly yolk protein, and CG31150 in two body
segments (head and abdomen). dilp2 mRNA abundance levels were assayed only in head tissue
because this ligand is produced in insulin producing cells (IPC’s) in the brain and is not
expressed in the abdomen. I assayed separate tissues (head and abdomen) because expression
profiles can vary between tissues (Girardot et al., 2006; Zhan et al., 2007) and also because
levels of dilp2 and foxo in the fly head can serve as global regulators of IIS signaling in other
tissues of the body (Hwangbo et al., 2004). Different physiological activities occur in head and
abdomen tissue. For example, nutrient absorption and reproductive activities can have an
influence on gene expression profiles of abdomen tissue.
qRT-PCR was performed with a TaqMan 7900 Cycler, using SYBR Green Master Mix
(Applied Biosystems). I designed forward and reverse primer sets for each of the 7 genes using
Primer Express software v2.0 (Applied Biosystems) (Table 3). I checked primer sets for
specificity using NCBI BLAST to insure that they matched only the target gene and that they

29
would not amplify another region of the Drosophila genome. I quantified the amount of initial
mRNA by using the standard-curve absolute-quantification method. A standard curve was
generated for each gene using serial dilutions of Drosophila genomic DNA (0.001 ng, 0.01 ng,
0.1 ng, 1.0 ng, and 10.0 ng). I quantified the initial amount of mRNA for RCP1 in each sample
using a standard curve made of serial dilutions of RCP1 cDNA. The starting amount of mRNA
from each sample was determined using the appropriate standard curve for each gene. qRT-PCR
reactions were conducted using the default PCR cycle settings for 40 cycles. A dissociation
curve was added to the final cycle to confirm the absence of primer-dimers for each gene.
2.2.5. Data Analysis.
Statistical analysis was conducted using SAS software, version 9.2 of the SAS system for
Windows (Copyright, SAS Institute Inc). Survival data was analyzed using SAS Proc Lifetest.
This is a nonparametric test that estimates the survival function. Kaplan-Meier survival
estimates were used to graph the percent survival versus time in weeks. I conducted two rank
tests, Log-rank and Wilcoxon, which test for homogeneity of survival functions between S and C
lines. The log-rank test places more weight on larger survival times and the Wilcoxon test places
more weight on shorter survival times. Log-rank and Wilcoxon P-values were the same for both
analyses; therefore, I only reported the log-rank test values in the results.
Fecundity data was analyzed using the Wilcoxon-Mann-Whitney test, a non-parametric
version of the t-test. The mean number of offspring per female was the dependent variable.
Comparisons were made between S and C lines for each replicate at each age. qRT-PCR data
was analyzed using parametric analyses because the data were normally distributed and
approximately homoscedastic. Head and abdomen tissues were analyzed separately for each
gene. Expression values with studentized residuals greater than 2 were considered outliers and
30
deleted at the level of technical replicates. I calculated mean expression values at the biological
replicate level and deleted outliers using the same criterion. Data analysis was conducted
separately for each of the S-C pairs. Table 4 shows the number of biological replicates included
in the final analysis. To account for differences in cDNA synthesis, I normalized the remaining
quantity values by dividing each mean quantity value by its corresponding mean RCP quantity
value. I used SAS PROC MIXED to fit the model: y = µ + B + A + L + A*L + e where y is
RNA expression level, B is the random effect of cDNA synthesis batch, A is the fixed effect of
age, L is the fixed effect of line, and e is the residual error. Least-square means and standard
errors were used to produce bar graphs of the normalized expression quantity versus each age
and line.
2.3. Results
2.3.1. Lifespan and Age-specific Fecundity
All S-C pairs diverged significantly in lifespan in the expected direction (S>C: !2 64.12,
d.f. 1, P<0.0001). Flies in the selection lines lived longer than flies in the control lines (Fig 5).
Early life fecundity was higher for C line females than for S line females (Kruskal-Wallis,
p<0.0001 for Set 1S; p<0.0001 for Set 2S; and p <0.0183 for Set 3S). In lines 1 and 3 this
difference was observed at 7 days of age, in line 2 it was observed at 14 days of age. Late-life
fecundity was higher for S line females than for C line females in all lines (Kruskal-Wallis, all
p<0.0001 for all S-C comparisons on Day 44) (Table 5, Figure 6).
2.3.2.Age-specific Gene Expression
There were no significant differences in IIS gene expression between S and C lines for
either the head or abdomen tissues (Table 6 reports P values for each test of the model for each

31
gene). These data suggest that differential gene expression in the IIS pathway is not involved in
the regulation of divergent life-histories between the S and C lines. Age-related changes in gene
expression showed variation between fly sets in both head and abdomen tissue. Overall there
were more significant changes in gene expression with age for set 2 than set 3 and these changes
might have been more pronounced in set 2 because there is a sharp decrease in gene expression
with age when comparing younger to older flies whereas there seems to be little change in
expression patterns with age in set 3. This general trend was observed for both head and
abdomen tissue (Figure 7 and Figure 8).
2.4. Discussion
I successfully generated fly lines that show a genetically based tradeoff between lifespan
and reproduction. Flies in the selection line live longer than flies in the control line. Furthermore,
flies in the selection line show reduced early life fecundity and increased late life fecundity
whereas the opposite pattern is true for flies in the control line. My main goal in this study was to
investigate the involvement of genes in the IIS pathway in the evolution of divergent life
histories observed in our fly lines. Our working hypothesis was that flies selected for increased
lifespan and late-life fecundity would exhibit lower IIS signaling. However, our gene expression
data do not support a role for the IIS pathway in lifespan extension of our fly lines.
Flies in the S lines were expected to show low expression of the genes dilp2, InR, chico,
and PKB and higher levels of foxo early in life compared to C lines, because resource allocation
is devoted to somatic maintenance and not to reproduction. Levels of these genes would increase
later in life in S lines once resources are shifted to reproduction. Higher levels of foxo expression
in the S lines would suggest that this transcription factor would up-regulate the expression of

32
longevity-enhancing genes such as oxidative stress resistance genes and detoxification genes
(Murphy et al., 2003) allowing the S lines to live longer and have higher fecundity late in life.
Variation in the IIS pathway, particularly at the InR locus, has been implicated as a cause
for variation in lifespan in natural populations of Drosophila. Geiger-Thornsberry and Mackay
(2004) used quantitative complementation tests to identify genes that contribute to naturally
occurring variation in Drosophila lifespan. One of the genes they found to affect variation in
lifespan using this method was the InR gene. A recent study by Paaby et al. (2010) identified
polymorphisms at the InR locus that are associated with variation in life history patterns
observed in natural populations of flies that show a latitudinal cline both in North America and
Australia. The authors also found evidence of positive selection on the InR locus. It is possible
that changes to the IIS pathway are involved in differences observed in S vs. C lines, but that
those changes are not reflected in measures of mRNA abundance.
In a previous study, Williams et al. (2006) used two natural D. melanogaster diapause
variants from Canada and the Southern U.S. to identify genes involved in the regulation of
diapause. The authors were able to map genes involved in the variant diapause phenotypes to
chromosome III and identified PI3K as a candidate gene for diapause control in flies. Over-
expression of this gene in fly heads resulted in a significant reduction in diapause leading the
authors to measure differences in gene expression in fly heads and bodies. Findings from this
study showed no differences in PI3K gene expression between the diapause variants. However,
the variants showed differences in DNA sequence within non-coding regions of the gene
pointing to the involvement of PI3K in diapause regulation through a mechanism other than
differential gene expression. Post-transcriptional changes to genes involved in the IIS pathway
may regulate lifespan differences. There might be consistent differences in other regulatory

33
mechanisms (phosphorylation or glycation of proteins) that could influence lifespan and
reproduction, which would not be revealed by qRT-PCR analysis.
An alternative explanation to our results is that variation in other signaling pathways or at
particular loci is responsible for the evolution of divergent life histories in our fly lines. Several
studies have uncovered genes that increase lifespan in fruit flies including stress resistance genes
such as heat shock proteins, and antioxidants such as MnSOD (Sun and Tower, 1999; Ruan et.
al., 2002; Chavous et. al., 2001; Arking, 1998; Arking et. al., 2000; Arking, 2001; Mockett et.
al., 1999; Orr and Sohal, 1994; Khazaeli et. al., 1997; Orr and Sohal, 1993). Histone deacetylases
such as Sir2 and Rpd3 have been implicated in yeast lifespan extension although their role in
lifespan extension in fruit flies is not well understood (Chang and Min, 2002; Kaeberlein et. al.,
1999; Kim et. al., 1999; Guarente, 2000; Rogina et. el., 2002). Mutation screens and QTL studies
have identified genes that extend lifespan such as the membrane protein Methuselah (mth) (Lin
et al., 1998), dopa decarboxylase (Ddc) and catecholamines up (catsup) (De Luca et al., 2003;
Carbone et al., 2006). An alternative approach to uncover the molecular mechanisms involved in
mediating life history divergence in our fly lines is the use of unbiased genomic profiles to assess
sequence and/or expression changes that are consistently associated with life history evolution.
This will allow us to uncover previously characterized/novel genes that could be implicated in
regulating tradeoffs between lifespan and reproduction in our fly lines.
Another goal of this study was to explore the involvement of yolk proteins in extending
lifespan in Drosophila. The yolk protein vitellogenin acts as an antioxidant in honey bees
(Seehuus et al., 2006; Munch et al., 2008). Long-lived queen honey bees have higher titers of
this protein than sterile workers and they can tolerate oxidative stress better (Corona et. al.,
2007). We evaluated the expression of YP1 and the honey bee Vg ortholog CG31150 in our fly

34
lines. We did not find differences in gene expression between the S and C lines suggesting that
the Vg ortholog CG31150 is not involved in the lifespan differences observed for our lines. It is
possible that the honey bee Vg ortholog plays a role in antioxidant stress resistance in flies, but in
order to establish this one would need to evaluate oxidative stress resistance in flies with normal
and increased levels of gene expression. Testing the role of honey bee Vg as an antioxidant
would require the use of transgenic constructs in order to manipulate expression of this gene in
flies exposed to oxidative stress resistance. Overall, I did not find significant differences in
transcript abundance of genes involved in IIS signaling or yolk proteins involved in antioxidant
resistance in honey bees to influence the contrasting patterns of lifespan and reproduction
observed in S vs. C lines.
2.5 References
Apfeld, J., Kenyon, C. 1998. Cell nonautonomy of C. elegans daf-2 function in the regulation of
diapause and life span. Cell 95: 199-210.
Arantes-Oliveira, N., Apfeld, J., Dillin, A., and Kenyon, C. 2002. Regulation of Life-Span by
Germ-Line Stem Cells in C. elegans. Science 295: 502-505.
Arking, R. 1998. Molecular basis of extended longevity in selected Drosophila strains. Current
Science 74: 859- 864.
Arking, R., Burde, V., Graves, K., Hari, R., Soliman, S., Saraiya, A., Sathrasala, K., Buck, S.,
Wehr, N., Levine, R. 2000. Selection for longevity specifically alters antioxidant gene expression
and oxidative damage patterns in Drosophila. Journal of Experimental Gerontology 35: 167-185.
Arking, R. 2001. Gene expression and regulation in the extended longevity phenotypes of
Drosophila. Annals of the New York Academy of Sciences 928: 157-167.
Broughton, S.J., Piper, M.D., Ikeya, T., Bass, T.M., Jacobson, J., Driege, Y., Martinez, P., Hafen
E, Withers, D.J., Leevers, S.J., Partridge, L. 2005. Longer lifespan, altered metabolism and stress
resistance in Drosophila from ablation of cells making insulin-like ligands. Proceedings of the
National Academy of Sciences U.S.A 102: 3105–3110.

35
Carbone M. A., Jordan K. W., Lyman R. F., Harbison S. T., Leips J., Morgan T. J., de Luca M.,
Awadalla P., Mackay, T. F. C. 2006. Phenotypic variation and natural selection at Catsup, a
pleiotropic quantitative trait gene in Drosphila. Current Biology. 16 912–919.
Chang, K., Min, K.T. 2002. Regulation of lifespan by histone deacetylase. Ageing Research
Reviews 1: 313–26.
Chavous, D.A., Jackson, F.R., O'Connor, C.M. 2001. Extension of the Drosophila lifespan by
overexpression of a protein repair methyltransferase. Proceedings of the National Academy of
Sciences U.S.A 98: 14814-14818.
Clancy, D.J., Gems, D., Harshman, L.G., Oldham, S., Stocker, H., Hafen, E., Leevers, S.J.,
Partridge, L. 2001. Extension of Life-Span by Loss of CHICO, a Drosophila Insulin Receptor
Substrate Protein. Science 292: 104-106.
Corona, M., Velarde, R.A., Remolina, S., Moran-Lauter, A., Wang, Y., Hughes, K.A., Robinson,
G.E. 2007. Vitellogenin, juvenile hormone, insulin signaling, and queen honey bee longevity.
Proceedings of the National Academy of Sciences U.S.A. 104: 7128–33.
De Luca, M., Roshina, N.V., Geiger-Thornsberry, G.L., Lyman, R.F., Pasyukova, E.G., Mackay,
T.F. 2003. Dopa decarboxylase (Ddc) affects variation in Drosophila longevity. Nature Genetics
34: 429-433.
Geiger-Thornsberry, G.L. and Mackay, T.F. 2004. Quantitative trait loci affecting natural
variation in Drosophila longevity. Mechanisms of Ageing and Development 125: 179-189.
Gems, D. and Partridge, L. 2001. Insulin/IGF signaling and ageing: seeing the bigger picture.
Current Opinion in Genetics & Development 11: 287-292.
Giannakou, M.E., Goss, M., Jünger, M.A., Hafen, E., Leevers, S.J., Partridge, L. 2004. Long-
Lived Drosophila with Overexpressed dFOXO in Adult Fat Body. Science 305: 361.
Giannakou, M.E., Partridge, L. 2007. Role of insulin-like signalling in Drosophila lifespan.
Trends in Biochemical Sciences 32: 180-188.
Girardot, F., Lasbleiz, C., Monnier, V., Tricoire, H. 2006. Specific age-related signatures in
Drosophila body parts transcriptome. BMC Genomics 7: 69.
Guarente, L., and Kenyon, C. 2000. Genetic pathways that regulate ageing in model organisms.
Nature 408: 25-32.
Guarente, L. 2000. Sir2 links chromatin silencing, metabolism, and aging. Genes and
Development 14: 1021-1026.
Hsin, H., and Kenyon, C., 1999. Signals from the reproductive system regulate the lifespan of C.
elegans. Nature 399: 362-366.

36
Hwangbo, D.S., Gersham, B., Tu, M.P., Palmer, M., Tatar, M. 2004. Drosophila dFOXO
controls lifespan and regulates insulin signalling in brain and fat body. Nature 429 562-566.
Kaeberlein, M., McVey, M., Guarente, L. 1999. The SIR2/3/4 complex and SIR2 alone promote
longevity in Saccharomyces cerevisiae by two different mechanisms. Genes & Development 13:
2570–80.
Kenyon, C. 2001. A conserved regulatory system for aging. Cell 105: 165-168.
Khazaeli, A.A., Tatar, M., Pletcher, S.D., Curtsinger, J.W. 1997. Heat-induced longevity
extension in Drosophila. I. Heat treatment, mortality and thermotolerance. Journal of
Gerontology. 52A: B48-B52.
Kim, S., Benguria, A., Lai, C.Y., Jazwinski, S.M. 1999. Modulation of Life-span by Histone
Deacetylase Genes in Saccharomyces cerevisiae. Molecular Biology of the cell 10: 3125-3136.
Klowden, M.J. Physiological Systems in Insects, (Elsevier, San Diego, CA, U.S.A, 2002).
Kojima, T., Kamei, H., Aizu, T., Arai, Y., Takayama, M., Nakazawa, S., Ebihara, Y., Inagaki,
H., Masui, Y., Gondo, Y., Sakaki, Y., Hirose, N. 2004. Association analysis between longevity
in the Japanese population and polymorphic variants of genes involved in insulin and insulin-like
growth factor 1 signaling pathways. Journal of Experimental Gerontology 39: 1595-1598.
Landis, G.N., Abdueva, D., Skvortsov, D., Yang, J., Rabin, B.E., Carrick, J., Tavaré, S., Tower,
J. 2004. Similar gene expression patterns characterize aging and oxidative stress in Drosophila
melanogaster. Proceedings of the National Academy of Sciences U.S.A 101: 7663-7668.
Lin, Y.J, Seroude, L., Benzer, S. 1998. Extended Life-Span and Stress Resistance in the
Drosophila Mutant Methuselah. Science 282: 943-946.
Mockett, R. J., Orr, W. C., Rahmandar, J. J., Benes, J. J., Radyuk, S. N., Klichko, V. I. and
Sohal, R. S. 1999. Overexpression of Mn-containing superoxide dismutase in transgenic
Drosophila melanogaster. Archives of Biochemistry and Biophysics. 371: 260-269.
Münch, D., Amdam, G.V., Wolschin, F. 2008. Ageing in a eusocial insect: molecular and
physiological characteristics of life span plasticity in the honey bee. Functional Ecology 22: 407-
421.
Murphy, C.T., McCarroll, S.A., Bargmann, C.I., Fraser, A., Kamath, R.S., Ahringer, J., Li, H.,
Kenyon, C. 2003. Genes that act downstream of DAF-16 to influence the lifespan of
Caenorhabditis elegans. Nature 424: 277-283.
Orr, W.C. & Sohal, R.S. 1993. Effects of overexpression of Cu-Zn superoxide dismutase on life
span and response to oxidative stress in Drosophila melanogaster. Archives of Biochemistry and
Biophysics. 301: 34-40.

37
Orr, W.C. & Sohal, R.S. 1994. Extension of life span by overexpression of superoxide dismutase
and catalase in Drosophila melanogaster. Science 263, 1128-1130.
Paaby, A.B., Blacket, M.J., Hoffmann, A.A., Schmidt, P.S. 2010. Identification of a candidate
adaptive polymorphism for Drosophila life history by parallel independent clines on two
continents. Molecular Ecology 19: 760-774.
Partridge L., and Gems D. 2002. Mechanisms of ageing: public or private? Nature Reviews
Genetics 3: 165–175.
Pawlikowska, L., Hu, D., Huntsman, S., Sung, A., Chu, C., Chen, J., Joyner, A.H., Schork, N.J.,
Hsueh, W.C., Reiner, A.P., Psaty, B.M., Atzmon, G., Barzilai, N., Cummings, S.R., Browner,
W.S., Kwok, P.Y., Ziv, E. 2009. Association of common genetic variation in the insulin/IGF1
signaling pathway with human longevity. Aging Cell 8: 460-472.
Pletcher, S.D., Macdonald, S.J., Marguerie, R., Certa, U., Stearns, S.C., Goldstein, D.B.,
Partridge, L. 2002. Genome-wide transcript profiles in aging and calorically restricted
Drosophila melanogaster. Current Biology 12: 712-723.
Rogina, B., Helfand, S.L., Frankel, S. 2002. Longevity Regulation by Drosophila Rpd3
Deacetylase and Caloric Restriction. Science 298: 1745.
Ruan, H., Tang, X. D., Chen, M. -L., Joiner, M.A., Sun, G., Brot, N., Weissbach, H.,
Heinemann, S. H., Iverson, L., Wu, C. -F., Hoshi, T. 2002. High-quality life extension by the
enzyme peptide methionine sulfoxide reductase. Proceedings of the National Academy of
Sciences U.S.A 99: 2748-2753.
Seehuus, S.C., Norberg, K., Gimsa, U., Krekling, T., Amdam, G.V. 2006. Reproductive protein
protects functionally sterile honey bee workers from oxidative stress. Proceedings of the
National Academy of Sciences U.S.A 103: 962-967.
Simon, A.F., Shih, C., Mack, A., Benzer, S. 2003. Steroid Control of Longevity in Drosophila
melanogaster. Science 5611: 1407-1410.
Suh, Y., Atzmon, G., Cho, M.O., Hwang, D., Liu, B., Leahy, D.J., Barzilai, N., Cohen, P. 2008.
Functionally significant insulin-like growth factor I receptor mutations in centenarians.
Proceedings of the National Academy of Sciences U.S.A 105: 3438–42.
Sun, J., and Tower, J. 1999. FLP recombinase-mediated induction of Cu/Zn-superoxide
dismutase transgene expression can extend the life span of adult Drosophila melanogaster flies.
Molecular and Cellular Biology 19: 216–228.
Taguchi, A., and White, M. F. 2008. Insulin-like signaling, nutrient homeostasis, and life span.
Annual Review of Physiology 70: 191–212.

38
Tatar, M., Kopelman, A., Epstein D., Tu M.P., Yin C.M., Garofalo, R. S. 2001. A mutant
Drosophila insulin receptor homolog that extends life-span and impairs neuroendocrine function.
Science 292: 107.
Tatar, M., Bartke, A., Antebi, A. 2003. The endocrine regulation of aging by insulin-like signals.
Science 299: 1346–1351.
Tu, M.P., Yin, C.M., Tatar, M. 2002. Impaired ovarian ecdysone synthesis of Drosophila
melanogaster insulin receptor mutants. Aging Cell 1: 158-160.
Tu, M.P., Yin, C.M., Tatar, M. 2005. Mutations in insulin signaling pathway alter juvenile
hormone synthesis in Drosophila melanogaster. General and Comparative Endocrinology 142:
347-356.
Tu, M.P., Flatt, T., Tatar, M. 2006. Juvenile and steroid hormones in Drosophila melanogaster
longevity. Chapter 16 (pp. 415-448) in Handbook of the Biology of Aging, 6th Edition (Editors:
Edward J. Masoro and Steven N. Austad), Academic Press (Elsevier), San Diego.
van Heemst, D., Beekman, M., Mooijaart, S.P., Heijmans, B.T., Brandt, B.W., Zwaan, B.J.,
Slagboom, P.E., Westendorp, R.G. 2005. Reduced insulin/IGF-1 signalling and human
longevity. Aging Cell 2: 79-85.
Williams, K.D., Busto, M., Suster, M.L., So, A.K., Ben-Shahar, Y., Leevers, S.J., Sokolowski,
M.B. 2006. Natural variation in Drosophila melanogaster diapause due to the insulin-regulated
PI3-kinase. Proceedings of the National Academy of Sciences U.S.A 103: 15911-15915.
Zhan, M., Yamaza, H., Sun, Y., Sinclair, J., Li, H., Zou, S. 2007. Temporal and spatial
transcriptional profiles of aging in Drosophila melanogaster. Genome Research 17: 1236-1243.
Zou, S., Meadows, S., Sharp, L., Jan, L.Y., Jan, Y.N. 2000. Genome-wide study of aging and
oxidative stress response in Drosophila melanogaster. Proceedings of the National Academy of
Sciences U.S.A 25: 13726-1373.
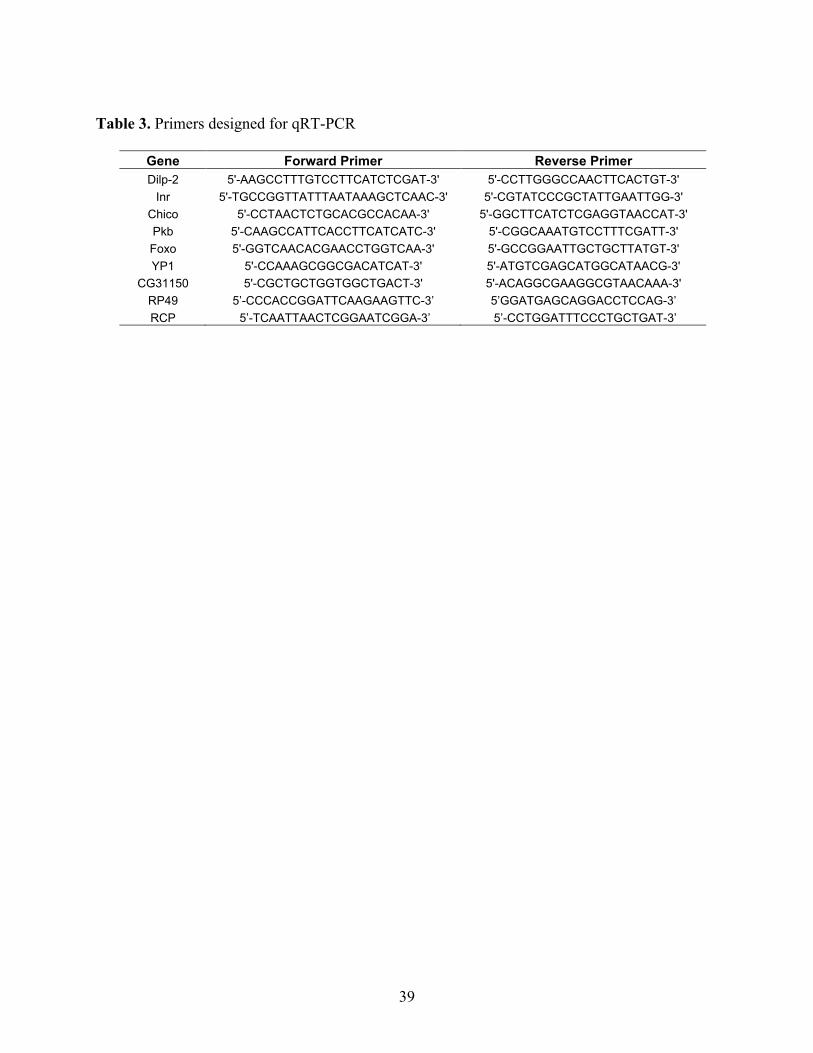
39
Table 3. Primers designed for qRT-PCR
Gene Forward Primer Reverse Primer
Dilp-2 5'-AAGCCTTTGTCCTTCATCTCGAT-3' 5'-CCTTGGGCCAACTTCACTGT-3'
Inr 5'-TGCCGGTTATTTAATAAAGCTCAAC-3' 5'-CGTATCCCGCTATTGAATTGG-3'
Chico 5'-CCTAACTCTGCACGCCACAA-3' 5'-GGCTTCATCTCGAGGTAACCAT-3'
Pkb 5'-CAAGCCATTCACCTTCATCATC-3' 5'-CGGCAAATGTCCTTTCGATT-3'
Foxo 5'-GGTCAACACGAACCTGGTCAA-3' 5'-GCCGGAATTGCTGCTTATGT-3'
YP1 5'-CCAAAGCGGCGACATCAT-3' 5'-ATGTCGAGCATGGCATAACG-3'
CG31150 5'-CGCTGCTGGTGGCTGACT-3' 5'-ACAGGCGAAGGCGTAACAAA-3'
RP49 5’-CCCACCGGATTCAAGAAGTTC-3’ 5’GGATGAGCAGGACCTCCAG-3’
RCP 5’-TCAATTAACTCGGAATCGGA-3’ 5’-CCTGGATTTCCCTGCTGAT-3’

40
Table 4. Number of biological replicates used in qRT-PCR analysis for abdomen and head tissue
Set 2 Set 3
Gene Line Age Abd Head Gene Line Age Abd Head
Dilp-2 C 14 8 Dilp-2 C 14 8 C 44 8 C 44 10 S 14 9 S 14 9 S 44 10 S 44 9 S 60 8 S 60 10
Inr C 14 9 7 Inr C 14 10 7 C 44 9 7 C 44 9 7 S 14 10 8 S 14 9 8 S 44 9 9 S 44 10 7 S 60 10 8 S 60 9 8
Chico C 14 8 6 Chico C 14 9 8 C 44 10 7 C 44 9 9 S 14 9 8 S 14 7 8 S 44 9 10 S 44 10 8 S 60 9 9 S 60 9 8
PKB C 14 9 7 PKB C 14 9 7 C 44 9 7 C 44 9 7 S 14 10 8 S 14 8 8 S 44 9 7 S 44 10 8 S 60 10 8 S 60 9 8
Foxo C 14 9 6 Foxo C 14 9 6 C 44 10 7 C 44 9 7 S 14 9 7 S 14 9 9 S 44 9 8 S 44 9 8 S 60 10 8 S 60 9 7
CG31150 C 14 9 8 CG31150 C 14 10 6 C 44 10 7 C 44 9 7 S 14 9 8 S 14 8 9 S 44 9 10 S 44 10 8 S 60 10 9 S 60 9 8
YP1 C 14 9 6 YP1 C 14 9 7 C 44 10 7 C 44 8 8 S 14 9 8 S 14 8 8 S 44 9 10 S 44 10 8 S 60 9 9 S 60 9 9

41
Table 5. Mean number of offspring per female and Wilcoxon p-values for flies in the control (C)
and selection lines (S).
Set/Line Age N Mean number of offspring
per female Wilcoxon-Mann-Whitney Z
(df=1) p-value
1C 7 50 20.77 (0.98) 7.1053 <.0001
1S 7 50 9.0067 (0.71)
1C 14 50 15.594 (0.65) 0.4414 0.6589
1S 14 50 14.9788 (0.74)
1C 35 50 7.3674 (0.88) 0.2276 0.8199
1S 35 50 5.948 (0.54)
1C 44 50 0 -8.9212 <.0001
1S 44 50 5.8033 (0.61)
1C 60 34 0 -2.7463 0.006
1S 60 50 0.516 (0.18)
2C 7 50 10.6527 (0.84) 7.46 <.0001
2S 7 45 24.6956 (1.01)
2C 14 49 18.8422 (1.23) 5.44 <.0001
2S 14 50 9.9067 (0.85)
2C 35 50 10.0233 (0.74) -1.98 0.048
2S 35 50 13.362 (1.14)
2C 44 50 5.688 (0.5) -4.01 <.0001
2S 44 50 10.0247 (0.75)
2C 60 13 0.1795 (0.12) 1.16 0.24
2S 60 26 0.1346 (0.13)
3C 7 50 24.6133 (1.26) -2.35 0.02
3S 7 49 20.1633 (1.12)
3C 14 50 10.3713 (0.6) -2.63 0.009
3S 14 50 13.7167 (1.0)
3C 35 50 1.5167 (0.32) -4.74 <.0001
3S 35 50 5.6933 (0.7)
3C 44 50 0.3067 (0.13) -7.49 <.0001
3S 44 50 3.1433 (0.35)
3C 60 50 0 (0) -3.3 0.001
3S 60 50 0.33 (0.12)

42
Table 6. Effects of life history divergence on age-specific gene expression. Results are shown
for abdomen and head tissue separately.
Abdomen Tissue
Gene Set Age Line Age*Line
F-Value P-value F-Value P-value F-Value P-value
CG31150 2 1.439 0.249 0.202 0.655 0.048 0.826
3 8.091 0.001 1.266 0.267 0.089 0.766
Chico 2 7.423 0.001 0.050 0.823 0.611 0.438
3 2.769 0.076 1.623 0.210 0.999 0.324
FOXO 2 7.519 0.001 0.564 0.456 0.020 0.887
3 0.677 0.514 0.364 0.549 1.309 0.259
INR 2 3.076 0.057 0.146 0.703 0.011 0.915
3 13.913 3.1208E-05 0.180 0.673 0.036 0.848
PKB 2 10.308 0.0002 0.019 0.889 0.808 0.374
3 1.458 0.245 0.937 0.339 2.769 0.104
YP1 2 3.188 0.0521 0.431 0.515 0.293 0.590
3 7.102 0.0024 3.707 0.061 0.002 0.959
Head Tissue
Gene Set Age Line Age*Line
F-Value P-value F-Value P-value F-Value P-value
CG31150 2 6.589 0.003 2.045 0.160 2.478 0.123
3 1.897 0.163 1.101 0.300 0.129 0.720
Chico 2 5.230 0.009 4.283 0.045 5.282 0.027
3 1.047 0.360 1.429 0.239 0.827 0.368
DILP2 2 9.981 0.0003 0.643 0.427 1.590 0.215
3 4.358 0.019 0.405 0.527 0.055 0.814
FOXO 2 7.206 0.002 2.575 0.116 2.473 0.124
3 3.704 0.034 0.907 0.346 0.091 0.763
INR 2 4.089 0.025 2.211 0.145 1.957 0.170
3 1.527 0.229 1.269 0.266 2.065 0.158
PKB 2 8.444 0.0009 1.759 0.193 1.580 0.216
3 0.767 0.470 1.570 0.217 1.019 0.318
YP1 2 7.696 0.001 1.314 0.258 4.129 0.048
3 0.810 0.451 0.141 0.708 0.772 0.384

43
Figure 4. Insulin signaling pathway (IIS) in Drosophila melanogaster.

44
Figure 5. Survival curves for flies in the Selection (S) and Control (C) lines. S lines are shown in
solid lines and C lines in dashed lines. Survival curves are shown in blue for set 1, black for set 2
and red for set 3.

45
Figure 6. Mean adult offspring number for flies in the Selection (S) and Control (C) lines.
Results are shown in blue for set 1, black for set 2 and red for set 3.

46
Figure 7. Relative mRNA expression levels in fly head tissue. Letters indicate RNA expression
levels for genes in the IIS pathway and vitellogenins (YP1 and CG31150). mRNA levels are
shown on the y-axis and Line/Age combinations are shown on the x-axis. Expression bars for set
2 fly lines are coded in blue and set 3 fly lines in grey.
A. Dilp2 B. InR
C. Chico D. PKB
E. Foxo
F. CG31150 G. YP1
!"
#"
$"
%"
&"
#&'" &&'" #&(" &&(" )!("
!"
!*+"
#"
#*+"
#&'" &&'" #&(" &&(" )!("
!"
$"
&"
)"
#&'" &&'" #&(" &&(" )!("
!"
#"
$"
%"
#&'" &&'" #&(" &&(" )!("
!"
#"
$"
%"
#&'" &&'" #&(" &&(" )!("
!"
$"
&"
)"
#&'" &&'" #&(" &&(" )!("
!"
$!!!"
&!!!"
)!!!"
#&'" #&(" &&'" &&(" )!("
x-axis: Age/Line combination
y-a
xis
: m
RN
A e
xp
ress
ion
lev
els
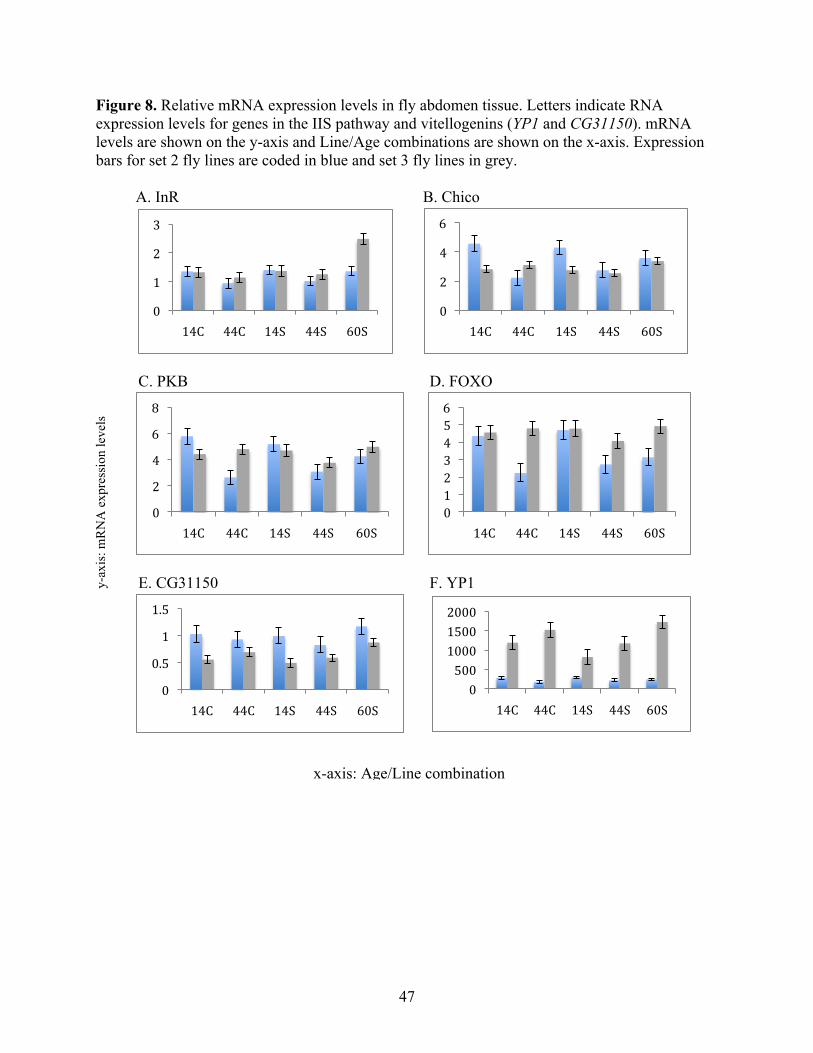
47
Figure 8. Relative mRNA expression levels in fly abdomen tissue. Letters indicate RNA
expression levels for genes in the IIS pathway and vitellogenins (YP1 and CG31150). mRNA
levels are shown on the y-axis and Line/Age combinations are shown on the x-axis. Expression
bars for set 2 fly lines are coded in blue and set 3 fly lines in grey.
A. InR B. Chico
C. PKB D. FOXO
E. CG31150 F. YP1
!"
#"
$"
%"
#&'" &&'" #&(" &&(" )!("
!"
$"
&"
)"
#&'" &&'" #&(" &&(" )!("
!"
$"
&"
)"
,"
#&'" &&'" #&(" &&(" )!("
!"
#"
$"
%"
&"
+"
)"
#&'" &&'" #&(" &&(" )!("
!"
!*+"
#"
#*+"
#&'" &&'" #&(" &&(" )!("
!"
+!!"
#!!!"
#+!!"
$!!!"
#&'" &&'" #&(" &&(" )!("
x-axis: Age/Line combination
y-a
xis
: m
RN
A e
xp
ress
ion
lev
els
48
CHAPTER 3
IDENTIFICATION OF MOLECULARLY CHARACTERIZED AND NOVEL
BIOCHEMICAL PATHWAYS INVOLVED IN LIFE-HISTORY DIVERGENCE IN
FLIES SELECTED ON AGE AT REPRODUCTION
3.1. Introduction
Phenotypic variation in life history strategies within and between species has been
extensively documented at the whole-organism level (Stearns, 1992; Roff, 2002). Variation in
reproductive strategies arises in part because to maximize fitness, organisms need to perceive
and integrate environmental signals (i.e. nutrient availability, temperature, light, presence of
pathogens) to correctly allocate limiting resources between life history-traits. Differential
allocation of resources leads to negative correlations between these traits. One of the most
widely documented tradeoffs occurs between reproduction and lifespan. In insect species,
research on energy allocation budgets has shown that resources used in reproduction cannot
simultaneously be used in somatic repair and maintenance (Zera and Larsen, 2001; Zhao and
Zera, 2002; Min et al., 2006; Judd et al., 2010). Given that life-history traits directly influence
fitness of individuals, understanding the molecular mechanisms that regulate their evolutionary
history will allow us to link the genetic architecture of these traits to the ecological factors that
shape them. This will ultimately help us understand how organisms adapt to their environment
(Ferea et al., 1999; Bochdanovits et al, 2003; Townsend et al., 2003; Olesiak et al, 2005; Matzkin
et al., 2006; Laayouni et al., 2007; St-Cyr et al., 2008; Burke and Rose, 2009; Stapley et al, 2010;
Wang et al, 2011).
Research on the physiological basis of life-history tradeoffs has implicated changes in
metabolism and stress resistance as important factors in the determination of reproductive
schedules (Service et al., 1985; Service et al., 1987; Rose et al., 1992; Djawdan et al., 1996;

49
Harshman et al., 1999; Arking et al., 2000; Arking et al., 2002). However, the genetic
mechanisms that have been acted upon by natural selection to modify life-history traits remain
poorly understood (Stearns and Magwene, 2003; Roff, 2007). Phenotypic variation within and
between populations has been associated with variation in genome-wide transcript abundance
(Olesiak et al., 2002). Because organisms need to perform coordinated physiological processes to
ensure proper functioning, genome-wide scans can allow us to globally investigate how energy
allocation patterns lead to tradeoffs between life-history traits at the molecular level (Olesiak et
al., 2002; Bochdanovits and de Jong, 2004; Aubin-Horth et al., 2005; Giger et al., 2006; Giger et
al., 2008).
To investigate potential molecular mechanisms that accompany the evolution of
divergent life-histories, I coupled experimental evolution in D. melanogaster with microarray
technology. Specifically, I compared changes in gene expression across five ages and two
generations in replicated fly lines selected on age at first reproduction relative to their paired
control lines. Previous experiments that have tracked changes in gene expression with age in
fruit flies have shown that older flies show a decline in expression of genes involved in
metabolism of sugars, reproductive system (i.e. oogenesis), energy metabolism (i.e. oxidative
phosphorylation, TCA cycle), electron transport chain, and protein synthesis. Genes involved in
immune response, heat shock proteins, and antioxidant genes generally increase expression with
age (Zou et al., 2000; Landis et al., 2004; Girardot et al., 2006; Pletcher et al., 2002). By limiting
energy acquisition through caloric restriction, Pletcher et al (2002) showed that flies under this
dietary regime had reduced expression of genes involved in protein metabolism, oogenesis, DNA
replication and DNA repair proteins. Caloric restriction also leads to increased oxidative stress
resistance (Tettweiler et al., 2005).

50
Given that organisms experience changes in metabolism, reproductive ability, and
tolerance to environmentally imposed stress with age, evolutionary changes in life histories
should be associated with changes in energy allocation contingent upon molecular pathways
whose end products contribute to reproduction, and somatic maintenance (i.e. energy storage,
stress resistance and immunity). I used genome-wide scans to uncover potential molecular
pathways involved in the evolution of life-history divergence between selection and control
lines. Evaluating genome-wide changes in transcript abundance also allowed me to observe
whether genes that have previously been shown to regulate tradeoffs in model organisms (i.e. IIS
and TOR pathways) such as roundworms, fruit flies, and mice are involved in life history
divergence in flies derived from natural populations. In other words, does the evolution of
divergent life-histories always occur through differences in conserved nutrient signal
transduction pathways? Alternatively, can we identify novel genes/pathways that contribute to
life-history divergence in nature?
3.2. Methods
I used a whole-genome expression assay to identify molecularly characterized and/or
novel gene pathways that mediate life history evolution in the paired S-C lines described in
chapter 2, section 2.2. Expression changes were monitored across generations of selection, and
throughout the life span of the fly, so time-course data in two dimensions were collected. The
goal of this experiment was to detect genes and molecular pathways that consistently diverge in
expression between lines.
3.2.1. Generation- and age-specific sample collection

51
Unmated female flies from all three S-C pairs of fly lines were collected at generations
20 and 35 of selection for increased age at reproduction. They were aged in 8-dram vials with
cornmeal media for a period of 1, 5, 15, 30, and 50 days of age. During this period, flies were
maintained on an incubator at 25C on a 12L:12D light cycle and transferred to fresh media every
week. Once they reached the pertinent age, they were lightly anesthetized with CO2 and frozen in
1.5 ml eppendorf tubes already placed on dry ice. All flies were frozen at 9 a.m. to avoid
circadian effects on gene expression. Eppendorf tubes containing frozen flies were stored in the -
80C freezer for later dissection. Flies were dissected on dry ice to obtain two tissues: Heads and
Abdomens. I generated 240 experimental samples from two generations of selection (20 and 35),
three fly sets (1, 2, and 3), two lines (S and C), 2 tissues (head and abdomen), 5 age classes (1, 5,
15, 30, and 50 days), and two biological replicates (1 and 2). Twenty-four samples were missing
at time of dissection: twenty from generation 20 set 3C, and four from generation 20 set 1S Day
50.
3.2.2. Generation- and age-specific gene expression
Total RNA was extracted from two independent pools of seven virgin female flies for
each population/age/tissue combination using the PicoPure RNA isolation kit (Arcturus). RNA
was amplified using Ambion’s MessageAmpII aRNA Amplification Kit (Applied Biosystems),
and reverse transcribed to cDNA using the SuperScript III protocol (Invitrogen Life
Technologies). Quality of total RNA, amplified RNA, and cDNA was assessed using the
Experion bioanalyzer (Bio-Rad).
Samples were labeled using Roche-Nimblegen’s One Color DNA Labeling Kit and
hybridized to one partition of Roche-Nimblegen’s D. melanogaster 12x135K expression arrays.
Each array contains 16,637 target genes with eight probes per gene (DM5.7 genome build).

52
Arrays were scanned using GenePix 4000B Scanner and Roche NimbleScan software. Four
samples were removed from the analysis due to poor labeling, leaving 212 arrays in the analysis.
All samples were labeled, hybridized, and scanned at the Roche-Nimblegen approved facility
located on the Florida State University campus.
3.2.3 Microarray Data Analysis
Statistical analysis was conducted using SAS software, version 9.2 of the SAS system for
Windows (SAS Institute Inc, 2010). Gene expression levels underwent RMA normalization
(Irizarry et al., 2003) as implemented in NimbleScan software. Normalized expression levels for
each gene were analyzed using a general linear model ANOVA with set, line, age, and
generation as fixed effects and replicate arrays as random effects. To correct for multiple testing,
I used a Q < 0.05 false-discovery rate criterion for significance of any of the terms in the
ANOVA model (Benjamini and Hochberg, 1995).
Functional annotation of genes was performed using the batch download function in
FlyBase to generate tables with each gene name/symbol, chromosome location, and molecular
function of genes differentially expressed at FDR Q < 0.05 (Tweedie et al., 2009). Gene
ontology (GO) enrichment analyses for the categories of biological process and molecular
function, were conducted using DAVID bioinformatics resources (Dennis et al., 2003; Huang et
al., 2009).
Changes in transcription levels were calculated as an S/C ratio using normalized log-
transformed transcript data, where the least square mean value in C individuals was subtracted
from the least square mean value in S individuals for each effect or interaction under study.
Hierarchical clustering was conducted using the Euclidean distance method and average-linkage
agglomerative algorithm implemented in Genesis software (Sturn et al., 2002). Dendograms

53
were combined with heat maps to represent color-coded expression intensities of genes. Profile
plots depicting changes in expression patterns over time within a cluster were also generated
using Genesis software.
3.3 Results
3.3.1 Patterns of differential expression
Four hundred and sixty eight genes showed differential expression between selection and
control lines. Of these, 277 were differentially expressed in abdomens and 168 were
differentially expressed in heads. The overlap between genes differentially expressed in both
tissues was sixteen. A large number of genes showed differential expression with age: 7472 in
abdomen tissue and 4076 in head tissue (Table 7).
3.3.2. Enrichment of functional groups associated with life-history divergence
Table 8 lists genes that were differentially expressed between S and C lines (line effect)
or that showed differences between lines with age (line*age interaction) in abdomen tissue.
Genes are grouped by cluster, and their name, location in the genome, and molecular function are
provided. Gene ontology analysis revealed a significant enrichment of the biological process of
oxidation-reduction (29 genes) in the list of genes differentially expressed between S and C lines
in abdomen tissue (Table 9). This is a metabolic process that results in the removal or addition of
electrons to or from a substance. Child terms of this biological process are electron transport
chain, lipid oxidation, NADPH oxidation, among others. Although only the molecular function
of the genes is provided in Table 8, this table shows that several genes are involved in electron
carrier activities, and oxido-reductase activities (i.e. Cyt-b, coI, coIII, ND4, ND5). Cytochrome c
oxidases are part of the electron transport chain in mitochondria and are hypothesized to regulate

54
the rate of electron flow through the electron transport chain. This suggests that there could be a
difference between S and C lines in efficiency of energy production.
In the molecular function category, genes differentially expressed between S and C lines
in abdomen tissue were enriched for the categories of oxygen transporter and nutrient reservoir
activity (Table 9). The latter category is of particular interest because it implies that S and C lines
are using resources in a different way. This suggests that S lines store nutrients when they are not
investing them in reproduction.
The list of genes differentially expressed between S and C lines across age classes and
generations (line*age*generation interaction) in abdomen tissue, was significantly enriched for
the molecular function of Glucuronosyltransferase activity (Table 9). Proteins with this
molecular function perform detoxification functions and have been implicated in DDT resistance
in fruit flies.
In head tissue, after correction for multiple comparisons there were no significantly
enriched gene ontology terms for genes differentially expressed between S and C lines (line
effect), genes showing differential expression between lines with age (line*age interaction), or
genes showing differential expression between lines across age and generation
(line*age*generation interaction).
3.3.3 Clustering Analysis
A primary goal of this study was to identify genes that differ in expression between fly
lines with divergent life histories and to understand their implication in the regulation of
tradeoffs between reproduction and lifespan. Hierarchical clustering allowed me to group
together genes that showed similar age-specific expression profiles for abdomen and head tissue
(Figures 9A, 9B). On these heat maps, ratios of transcript levels between selection and control

55
lines are color coded in red and blue. Red represents an increase in transcript level (S higher than
C) and blue represents a decrease (S lower than C).
To investigate how trends in differential expression between S and C lines relate to
phenotypic differences in lifespan and reproduction, I plotted changes in expression over time for
groups of genes identified by the hierarchical clustering analysis. This analysis identified genes
with similar patterns of gene expression between lines and ages. For example, cluster 5 depicts
changes in expression of seven genes that exhibit similar behavior: higher expression in S vs. C
lines from day 1 until day 30 (Figure 10A). Six of these genes (Fbp1, Fbp2, Lsp1alpha,
Lsp1beta, Lsp1gamma, Lsp2) are involved in nutrient reservoir activity.
Cluster 8 shows genes with small differences in expression between S and C lines from
days 1 through 15, increased expression in S relative to C lines at day 30 and a decrease in
expression at day 50 (Figure 10A). Some of the genes that belong to this cluster include genes
involved in oogenesis and germ cell development (mdy, bsk, CG7194, 14-3-3zeta, Tm1). Four
genes that previously have been implicated in regulation of lifespan and reproduction in model
organisms were found in this cluster. They are Pten, il-6, sug, and JNK. The first three are
involved in insulin signaling, whereas JNK interacts with insulin signaling and is involved in
immune response in Drosophila.
Patterns of gene expression for genes involved in stress resistance and immune response
activities varied. For example, CG4009 is involved in response to oxidative stress and showed
higher expression in S vs. C lines with a sharp increase in expression at day 30 (Figure 10A,
Cluster 1). TotA is involved in response to stress (heat, cold, bacteria, UV, oxidative stress, and
desiccation), and shows high expression in S vs. C lines throughout life (Figure 10A, Cluster 6).
CG10211 and CG5873 both involved in oxidative stress response showed higher expression in S

56
vs. C lines early in life but no differential expression at later age classes (Figure 10A, Cluster 7).
Four genes involved in immune response (JNK, GNBP1, CG3829, PARP) show higher
expression in S lines later in life (Figure 10A, Cluster 8). In head tissue, three genes involved in
immune response (CG3088, CG8329, CG9676) show increased expression with age in S vs. C
lines (Figure 10B, Cluster 1).
Clustering analysis of genes with significant line or line*age interaction effects in head
tissue, showed five groups of genes with similar expression. Profile expression plots for these
genes are shown in figure 10B. Cluster 2 shows genes that are expressed more highly in S than
in C lines particularly earlier in life. These include G-protein coupled receptors involved in
sensory perception of light (Rh2, Rh3, endoA), and odors (or49b). This cluster also contains
serotonin receptors 5HT2 and 5HT1B and the Fork head transcription factor FoxP. Cluster 4
contains many genes involved in translation such as mRpL17, mRpL39, mRpS34, mRpL24, RpL7,
RpL24, mRpS10, translation initiation such as CG31957, and translation elongation such as
eEF1delta (Figure 10B). Genes in this cluster show overall low expression throughout lifespan in
S relative to C lines suggesting a role for differential translation in the heads of S lines vs. C
lines.
Analysis of genes with significant line*age*generation interaction effects was expected
to reveal signatures of selection across generations. My expectation was that these genes would
show: patterns of higher constitutive expression, faster or greater expression, or delayed
expression across ages. There were 304 genes that were significantly differentially expressed
between lines, across age and generations for abdomen tissue, and only 26 genes for head tissue
(Appendix A, B, C). Patterns of expression across ages and generations were less interpretable
than those for line and line*age effects (Appendix D).

57
3.4. Discussion
Differential energy allocation patterns between physiological processes that regulate
lifespan and reproduction are considered a primary cause of the widely documented tradeoff
observed between these two life-history traits. Using genome-wide scans to compare changes in
gene expression between flies with divergent life-histories, I successfully identified 468
candidate genes associated with the regulation of tradeoffs between lifespan and reproduction.
This number is comparable to the one found by Sarup et al. (2010) in an experiment of selection
for increased lifespan in male flies. My results identified potential differences in energy
metabolism and storage as main contributors to life-history divergence. This is consistent with
the idea that energy allocation patterns influence the evolution of life-history traits.
Genes identified in the significantly enriched biological process of oxidation-reduction in
abdomen tissue, are involved in ATP production, electron transfer in the respiratory chain,
electron carrier activities, ubiquinone biosynthesis and NADP-binding activities. Mutations in
genes involved in the electron transport chain (i.e. cytochrome oxidase genes) have been shown
to reduce lifespan in fruit flies (Liu et al., 2007). Additionally, mutations in cox genes in fruit fly
cells lead to reduced ATP production (Mandal et al., 2005). Genes involved in the transport of
oxygen were also significantly enriched in abdomen tissue. For example, globin-1 is expressed in
tracheal cells and in the fat body. This gene is thought to control oxygen flow from the tracheal
system to cells. Taken together, these results suggest that there are differences in energy
production between S and C lines. These differences seem to be influenced by electron flow in
mitochondria and oxygen transport to cells.

58
Energy storage also contributes to differences between S and C lines. This is evidenced
by the enrichment of genes involved in nutrient reservoir activity. Genes in this category are
involved in amino acid storage. These genes are up-regulated earlier in life in S lines, whereas
genes that participate in energy metabolism and reproduction are up-regulated later in life in S
lines. This pattern suggests that when reproduction occurs S lines increase energy production
geared towards this energetically costly process. This pattern could also be consistent with a
signature of delayed aging in S lines.
Organisms need to detect and translate environmental signals to coordinate metabolism
and growth. Sensory perception has been implicated in the regulation of lifespan and
reproduction in C. elegans and D. melanogaster (Apfeld and Kenyon, 1998; Libert et al., 2007).
Although there was no enrichment of differentially expressed genes involved in sensory
perception in my study, I did observe genes involved in light and odor perception that were
differentially expressed in head tissue of S and C lines. In an experiment by Sarup et al. (2010)
where flies were selected for increased lifespan, there was an enrichment of genes involved in
light detection. Moreover, a recent experiment using p-element insertions to identify genes that
influence lifespan found an over-representation of genes affecting detection of light and abiotic
stimuli in female flies (Magwire et al., 2010).
Immunity and oxidative stress resistance are physiological processes that influence
lifespan and reproduction (Landis et al., 2004; Libert et al., 2006; DiAngelo et al., 2009). In the
current study, I found genes involved in oxidative stress resistance and in the immune response
to be differentially expressed between S and C lines. Because these genes have different
expression profiles (i.e. constitutive up-regulation, higher expression earlier in life, or higher
59
expression late in life), at this time it is not possible to conclude how they contribute to observed
differences in lifespan and reproduction between my fly lines.
Another goal of this study was to examine differences in gene expression that occur in S
vs. C lines across ages and generations. This would allow me to see how the behavior of genes
that differ between lines changed across generations and examine the contribution of these genes
to life-history divergence. My expectation was to observe some genes in which differences in
expression at generation 20 became more exaggerated at generation 35. However, changes in
gene expression patterns across generations were generally different from this expected pattern,
and sometimes showed opposite trends across generations. This pattern is more consistent with
genetic drift than directional selection. Given that I only studied changes in expression across
only two generations of selection on age at reproduction at the present time I cannot conclude if
genes that are significantly different for the line*age*gen interaction are the ones that cause
divergence in life histories. To answer this question it would be helpful to screen the genome for
changes in gene expression at the starting and earlier generations of selection. Additionally, a
sequencing approach would allow me to track changes at the DNA sequence level to see how
these have influenced the evolution of life-history divergence throughout different generations.
QTL mapping studies in flies derived from natural populations have been employed to
investigate the molecular underpinnings of variation in life-histories (Nuzdhin et al., 1997;
DeLuca et al., 2003; Geiger-Thornsberry et al., 2004; Carbone et al., 2006). These studies have
reported that novel candidate genes and previously characterized genes such as FOXO influence
lifespan (Magwire et al., 2010). Sarup et al. (2010) reached a similar conclusion based on their
experiment using male flies selected for increased lifespan. My findings are in agreement with
those from QTL studies and Sarup et al. (2010). I was able to identify both novel and previously

60
characterized genes (i.e. JNK, Pten) that contribute to the evolution of divergent life-histories in
female fruit flies. These results suggest that the evolution of divergent-life histories occurs
through changes in conserved signal transduction pathways but also through changes in other
pathways. It also provides support for the use of both candidate gene and unbiased genome-wide
scan approaches to fully understand the genetic mechanisms of life-history tradeoffs.
3.5 References
Apfeld, J., Kenyon, C. 1998. Cell nonautonomy of C. elegans daf-2 function in the regulation of
diapause and life span. Cell 95: 199-210.
Arking, R., Burde, V., Graves, K., Hari, R., Soliman, S., Saraiya, A., Sathrasala, K., Buck, S.,
Wehr, N., Levine, R. 2000. Selection for longevity specifically alters antioxidant gene expression
and oxidative damage patterns in Drosophila. Journal of Experimental Gerontology 35: 167-185.
Arking, R., Buck, S., Novoseltev, V.N., Hwangbo, D.S., Lane, M. 2002. Genomic plasticity,
energy allocations, and the extended longevity phenotypes of Drosophila. Ageing Research 1:
209-228.
Aubin-Horth, N., Landry, C.R., Letcher, B.H., Hofmann, H.A. 2005. Alternative life histories
shape brain gene expression profiles in males of the same population. Proceedings of the Royal
Society B 272: 1655-1662.
Benjamini, Y., Hochberg, Y. 1995. Controlling the false discovery rate: a practical and powerful
approach to multiple testing. Journal of the Royal Statistical Society Series B 57: 289-300.
Bochdanovits, Z., van der Klis, H., de Jong, G. 2003. Co-variation of larval gene expression and
adult body size in natural populations of Drosophila melanogaster. Molecular Biology and
Evolution 20.
Bochdanovits, Z., de Jong, G. 2004. Antagonistic pleiotropy for life-history traits at the gene
expression level. Proceedings of the Royal Society B: Biological Sciences Supplement 271:
S75–S78.
Burke, M.K., Dunham, J.P., Shahrestani, P., Thornton, K.R., Rose, M.R., Long, A.D. 2010.
Genome-wide analysis of a long-term evolution experiment with Drosophila. Nature 467: 587-
590.

61
Carbone M. A., Jordan K. W., Lyman R. F., Harbison S. T., Leips J., Morgan T. J., de Luca M.,
Awadalla P., Mackay, T. F. C. 2006. Phenotypic variation and natural selection at Catsup, a
pleiotropic quantitative trait gene in Drosphila. Current Biology. 16 912–919.
De Luca, M., Roshina, N.V., Geiger-Thornsberry, G.L., Lyman, R.F., Pasyukova, E.G., Mackay,
T.F. 2003. Dopa decarboxylase (Ddc) affects variation in Drosophila longevity. Nature Genetics
34: 429-433.
Dennis, G., Sherman, B.T., Hosack, D.A., Yang, J., Gao, W., Lane, H.C., Lempicki, R.A. 2003.
DAVID: Database for Annotation, Visualization, and Integrated Discovery. Genome Biology 4:
P3.
DiAngelo, J.R., Bland, M.L., Bambina, S., Cherry, S., Birnbaum, M.J. 2009. The immune
response attenuates growth and nutrient storage in Drosophila by reducing insulin signaling.
Proceedings of the National Academy of Sciences U.S.A. 106: 20853-20858.
Djawdan, M., Sugiyama, T., Schlaeger, L., Bradley, T.J. Rose, M.R. 1996. Metabolic aspects of
the trade-off between fecundity and longevity in Drosophila melanogaster. Physiological
Zoology 69:1175-1195.
Ferea, T.L., Botstein, D., Brown, P.O., Rosenzweig, R.F. 1999. Systematic changes in gene
expression patterns following adaptive evolution in yeast. Proceedings of the National Academy
of Sciences U.S.A 96: 9721-9726.
Geiger-Thornsberry, G.L. and Mackay, T.F. 2004. Quantitative trait loci affecting natural
variation in Drosophila longevity. Mechanisms of Ageing and Development 125: 179-189.
Giger, T., Excoffier, L., Day, P.J., Champigneulle, A., Hansen, M.M., Powell, R., Largiadèr,
C.R. 2006. Life history shapes genes expression in salmonids. Current Biology 16: R281-282.
Giger, T., Excoffier, L., Amstutz, U., Day, P.J., Champigneulle, A., Hansen, M.M., Kelso, J.,
Largiadèr, C.R. 2008. Population transcriptomics of life-history variation in the genus Salmo.
Molecular Ecology 17: 3095-3108.
Girardot, F., Lasbleiz, C., Monnier, V., Tricoire, H. 2006. Specific age-related signatures in
Drosophila body parts transcriptome. BMC Genomics 7: 69.
Harshman, L.G., K.M. Moore, M.A. Sty and M.M. Magwire. 1999. Stress resistance and
longevity in selected lines of Drosophila melanogaster. Neurobiology of Aging 20: 521-
529.
Huang, D.W., Sherman, B.T., Lempicki, R.A. 2009. Systematic and integrative analysis of large
gene lists using DAVID Bioinformatics Resources. Nature Protocols 4: 44-57.

62
Irizarry, R.A., Hobbs, B., Collin, F., Beazer-Barclay, Y.D., Antonellis, K.J., Scherf, U., Speed,
T.P. 2003. Exploration, normalization, and summaries of high density oligonucleotide array
probe level data. Biostatistics 4: 249-264.
Judd, E.T., Hatle, J.D., Drewry, M.D., Wessels, F.J., Hahn, D.A. 2010. Allocation of nutrients to
somatic tissues in young ovariectomized grasshoppers. Integrative and Comparative Biology 50:
818-828.
Laayouni, H., Garcia-Franco, F., Chavez-Sandoval, B.E., Trotta, V., Beltran, S., Corominas, M.,
Santos, M. 2007. Thermal evolution of gene expression profiles in Drosophila subobscura. BMC
Evolutionary Biology 7:42.
Landis, G.N., Abdueva, D., Skvortsov, D., Yang, J., Rabin, B.E., Carrick, J., Tavaré, S., Tower,
J. 2004. Similar gene expression patterns characterize aging and oxidative stress in Drosophila
melanogaster. Proceedings of the National Academy of Sciences U.S.A 101: 7663-7668.
Libert, S., Chao, Y., Chu, X., Pletcher, S.D. 2006. Trade-offs between longevity and pathogen
resistance in Drosophila melanogaster are mediated by NFkappaB signaling. Aging Cell 5: 533-
543.
Libert, S., Zwiener, J., Chu, X., Vanvoorhies, W., Roman, G., Pletcher, S.D. 2007. Regulation of
Drosophila life span by olfaction and food-derived odors. Science 315: 1133-1137.
Liu, W., Gnanasambandam, J., Benjamin, G., Kaur, P.B., Siegel, A.J., Shortridge, R.D., Singh,
S. 2007. Mutations in cytochrome c oxidase subunit VIa cause neurodegeneration and motor
dysfunction in Drosophila. Genetics 176: 937-946.
Mandal, S., Guptan, P., Owusu-Ansah, E., Banerjee, U. 2005. Mitochondrial regulation through
cell cycle progression during development as revealed by the tenured mutation in Drosophila.
Developmental Cell 9: 843-854.
Magwire, M.M., Yamamoto, A., Carbone, M.A., Roshina, N.V., Symonenko, A.V., Pasyukova,
E.G., Morozova, T.V., Mackay, T.F. 2010. Quantitative and molecular genetic analyses of
mutations increasing Drosophila life span. PLoS Genetics 6: e1001037.
Nuzdhin, S.V., Pasyukova, E.G., Dilda, C.L., Zeng, Z-B., Mackay, T.F. 1997. Sex-specific
quantitative trait loci affecting longevity in Drosophila melanogaster. Proceedings of the
National Academy of Sciences U.S.A. 94: 9734-9739.
Matzkin, L.M., Watts, T.D., Bitler, B.G., Machado, C.A., Markow, T.A. 2006. Functional
genomics of host shifts in Drosophila mojavensis. Molecular Ecology 15: 4635-4643.
Min, K.J., Hogan, M.F., Tatar, M., O’Brien, D.M. 2006. Resource allocation to reproduction and
soma in Drosophila: A stable isotope analysis of carbon from dietary sugar. Journal of Insect
Physiology 52: 763–770.

63
Olesiak, M.F., Churchill, G.A., Crawford, D.L. 2002. Variation in gene expression within and
among natural populations. Nature Genetics 32: 261–266.
Olesiak, M.F., Roach, J.L., Crawford, D. 2005. Natural variation in cardiac metabolism and gene
expression in Fundulus heteroclitus. Nature Genetics 37 67–72.
Pletcher, S.D., Macdonald, S.J., Marguerie, R., Certa, U., Stearns, S.C., Goldstein, D.B.,
Partridge, L. 2002. Genome-wide transcript profiles in aging and calorically restricted
Drosophila melanogaster. Current Biology 12: 712-723.
Roff, D.A. Life History Evolution, (Sinauer Associates, Sunderland, MA., 2002).
Roff, D.A. 2007. Contributions of genomics to life-history theory. Nature Reviews Genetics 8:
116–125.
Rose, M.R., Vu, L.N., Park, S.U., Graves, J.L. 1992. Selection for stress resistance increases
longevity in Drosophila melanogaster. Experimental Gerontology 27: 241-250.
Sarup, P., Sørensen, P., Loeschcke, V. 2010. Flies selected for longevity retain a younger
expression profile. AGE Epub 2010 Jul 7.
Service, P.M., Hutchinson, E.W., MacKinley, M.D., Rose, M.R. 1985. Resistance to
environmental stress in Drosophila melanogaster selected forpostponed senescence.
Physiological Zoology 58: 380–389.
Service, P. M. 1987. Physiological mechanisms of increased stress resistance in Drosophila
melanogaster selected for postponed senescence. Physiological Zoology 60: 321–326.
Stapley, J., Reger, J., Feulner, P.G.D., Smadja, C., Galindo, J., Ekblom, R., Bennison, C., Ball,
A.D., Beckerman, A.P., Slate, J. Adaptation genomics: the next generation. Trends in Ecology
and Evolution 25: 705-712.
Stearns, S.C. The Evolution of Life Histories, (Oxford University Press, Oxford, U.K., 1992).
Stearns, S.C., Magwene, P. 2003. The naturalist in a world of genomics. American Naturalist
161: 171.
Sturn, A., Quackenbush, J., Trajanoski, Z. 2002. Genesis: Cluster analysis of microarray data.
Bioinformatics 18: 207-208.
St-Cyr, J., Derome, N., Bernatchez, L. 2008. The transcriptomics of life-history trade-offs in
whitefish species pairs (Coregonus sp.). Molecular Ecology 17: 1850-1870.
Tettweiler, G., Miron, M., Jenkins, M., Sonenberg, N., Lasko, P.F. 2005. Starvation and
oxidative stress resistance in Drosophila are mediated through the eIF4E-binding protein, d4E-
BP. Genes and Development 19: 1840-1843.
64
Townsend, J.P., Cavalieri, D., Hartl, D.L. 2003. Population genetic variation in genome-wide
gene expression. Molecular Biology and Evolution 20: 955-963.
Tweedie, S., Ashburner, M., Falls, K., Leyland, P., McQuilton, P., Marygold, S., Millburn, G.,
Osumi-Sutherland, D., Schroeder, A., Seal, R., Chang, H., and The FlyBase Consortium. 2009.
FlyBase: enhancing Drosophila Gene ontology annotations. Nucleic Acids Research 37: D555-
D559.
Wang, S., Spor, A., Nidelet, T., Montalet, P., Dillmann, C., deVienne, D., Sicard, D.
2011. Switch between life history strategies due to changes in glycolytic enzyme gene dosage in
Saccharomyces cerevisiae. Applied and Environmental Microbiology 77: 452-459.
Zera, A.J., Larsen, A. 2001. The metabolic basis of life history variation: genetic and phenotypic
differences in lipid reserves among life history morphs of the wing-polymorphic cricket, Gryllus
firmus. Journal of Insect Physiology 47: 1147-1160.
Zhao, Z., Zera, A.J. 2002. Differential lipid biosynthesis underlies a trade-off between
reproduction and flight-capability in a wing-polymorphic cricket. Proceedings of the National
Academy of Sciences U.S.A. 99: 16829-16834.
Zou, S., Meadows, S., Sharp, L., Jan, L.Y., Jan, Y.N. 2000. Genome-wide study of aging and
oxidative stress response in Drosophila melanogaster. Proceedings of the National Academy of
Sciences U.S.A 25: 13726-1373.

65
Table 7. Number of differentially expressed genes for Abdomen and Head tissue at FDR
<.05
Effect Abdomen Head
Age 7472 4076
Line 228 166
Generation 3072 704
Age*Line 72 20
Age*Generation 4517 579
Line*Generation 22 25
Age*Line*Generation 304 26

66
Table 8. Genes with significantly different expression between S and C lines (line effect) and between lines with age (line*age) interaction in Abdomen tissue.
Cluster Gene Name/Symbol Location Molecular Function
Cluster 1 yellow-g2 3L 62D5-62D5 None available
Cluster 1 CG4009 3R 89E10-89E10 peroxidase activity
Cluster 2 CG5756 2R 55B5-55B5 chitin binding
Cluster 2 HP1b X 8C4-8C4 chromatin binding
Cluster 2 His4:CG33891 2L 39D5-39D5 DNA binding
Cluster 2 geminin 2R 42C2-42C2 DNA binding
Cluster 2 RfC3 2L 31E1-31E1 DNA binding; ATP binding
Cluster 2 CG4594 2L 30E4-30F1 dodecenoyl-CoA delta-isomerase activity
Cluster 2 ferrochelatase 3R 100D2-100D2 ferrochelatase activity
Cluster 2 CG33635 2L 21B3-21B3 identical protein binding
Cluster 2 Ilp6 X 3A1-3A1 insulin receptor binding
Cluster 2 CG3570 2R 60D9-60D9 None available
Cluster 2 CG11137 3L 80B1-80B1 None available
Cluster 2 msd1 3L 61F6-61F6 None available
Cluster 2 CG14985 3L 64A3-64A3 None available
Cluster 2 msd5 3L 61F6-61F6 None available
Cluster 2 CG5194 3L 66F1-66F1 None available
Cluster 2 CG11999 3R 82F10-82F10 None available
Cluster 2 CG34035 3R 90A6-90A6 None available
Cluster 2 CG5359 3R 85F5-85F5 None available
Cluster 2 CG42557 3R 99C7-99C7 None available
Cluster 2 CG10038 3R 87B7-87B7 None available
Cluster 2 CG41457-RA Unknown Unknown None available
Cluster 2 CG12056 Unknown Unknown None available
Cluster 2 Putative proteasome inhibitor Unknown Unknown None available
Cluster 2 CG11164 X 12B2-12B2 None available
Cluster 2 CG13373 X 1B4-1B4 None available
Cluster 2 CG1678 X 20A1-20A1 None available
Cluster 2 Kmn1 X 10C6-10C7 None available

67
Table 8 (Cont.) Genes with significantly different expression between S and C lines (line effect) and between lines with age (line*age) interaction in Abdomen
tissue.
Cluster Gene Name/Symbol Location Molecular Function
Cluster 2 CG10907 3L 68D6-68D6 peptidyl-prolyl cis-trans isomerase activity
Cluster 2 CG6182 3R 95E6-95E6 Rab GTPase activator activity
Cluster 2 dbe 2L 21E2-21E2 RNA binding
Cluster 2 MED8 2R 56F16-56F16 RNA polymerase II transcription mediator activity
Cluster 2 CG16997 2L 33C4-33C4 serine-type endopeptidase activity
Cluster 2 Fad2 3L 68A1-68A1 stearoyl-CoA 9-desaturase activity
Cluster 2 eIF2B-beta X 3B2-3B2 translation initiation factor activity
Cluster 2 CG13163 2R 48F7-48F8 translational initiation factor activity
Cluster 2 CG17359 3L 70C11-70C11 zinc ion binding
Cluster 2 CG31457 3R 94E1-94E1 zinc ion binding
Cluster 2 CG8319 3R 85E1-85E1 zinc ion binding
Cluster 3 CG10877 3R 92F1-92F2 catalytic activity
Cluster 3 CG10694 3R 95E1-95E1 damaged DNA binding
Cluster 3 CG30401 2R 58B1-58B1 DNA binding
Cluster 3 Cyp318a1 X 11A2-11A2 electron carrier activity
Cluster 3 O-fut2 X 2A4-2A4 fucosyltransferase activity
Cluster 3 CG33156 2R 50B1-50B1 NAD+ kinase activity
Cluster 3 CG13947 2L 21E2-21E2 None available
Cluster 3 CG14346 2L 22A1-22A1 None available
Cluster 3 CG14346 2L 22A1-22A1 None available
Cluster 3 CG15824 2L 21E2-21E2 None available
Cluster 3 CG3104 2L 23B5-23B5 None available
Cluster 3 CG33003 2L 24F1-24F1 None available
Cluster 3 CG4785 2L 21F1-21F1 None available
Cluster 3 slmo 2L 26B3-26B3 None available
Cluster 3 Fsn 2R 49F10-49F10 None available
Cluster 3 CG13923 3L 62B4-62B4 None available
Cluster 3 dro4 3L 63D1-63D1 None available
Cluster 3 CG11550 3R 100D1-100D1 None available
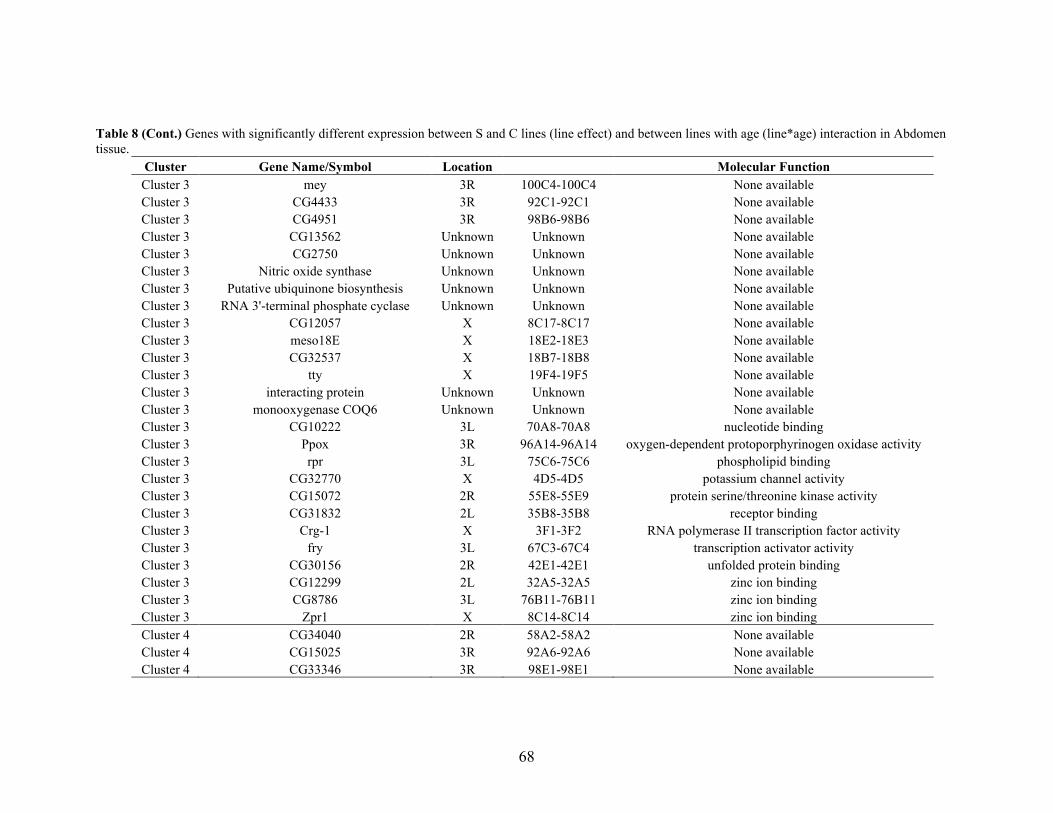
68
Table 8 (Cont.) Genes with significantly different expression between S and C lines (line effect) and between lines with age (line*age) interaction in Abdomen
tissue.
Cluster Gene Name/Symbol Location Molecular Function
Cluster 3 mey 3R 100C4-100C4 None available
Cluster 3 CG4433 3R 92C1-92C1 None available
Cluster 3 CG4951 3R 98B6-98B6 None available
Cluster 3 CG13562 Unknown Unknown None available
Cluster 3 CG2750 Unknown Unknown None available
Cluster 3 Nitric oxide synthase Unknown Unknown None available
Cluster 3 Putative ubiquinone biosynthesis Unknown Unknown None available
Cluster 3 RNA 3'-terminal phosphate cyclase Unknown Unknown None available
Cluster 3 CG12057 X 8C17-8C17 None available
Cluster 3 meso18E X 18E2-18E3 None available
Cluster 3 CG32537 X 18B7-18B8 None available
Cluster 3 tty X 19F4-19F5 None available
Cluster 3 interacting protein Unknown Unknown None available
Cluster 3 monooxygenase COQ6 Unknown Unknown None available
Cluster 3 CG10222 3L 70A8-70A8 nucleotide binding
Cluster 3 Ppox 3R 96A14-96A14 oxygen-dependent protoporphyrinogen oxidase activity
Cluster 3 rpr 3L 75C6-75C6 phospholipid binding
Cluster 3 CG32770 X 4D5-4D5 potassium channel activity
Cluster 3 CG15072 2R 55E8-55E9 protein serine/threonine kinase activity
Cluster 3 CG31832 2L 35B8-35B8 receptor binding
Cluster 3 Crg-1 X 3F1-3F2 RNA polymerase II transcription factor activity
Cluster 3 fry 3L 67C3-67C4 transcription activator activity
Cluster 3 CG30156 2R 42E1-42E1 unfolded protein binding
Cluster 3 CG12299 2L 32A5-32A5 zinc ion binding
Cluster 3 CG8786 3L 76B11-76B11 zinc ion binding
Cluster 3 Zpr1 X 8C14-8C14 zinc ion binding
Cluster 4 CG34040 2R 58A2-58A2 None available
Cluster 4 CG15025 3R 92A6-92A6 None available
Cluster 4 CG33346 3R 98E1-98E1 None available

69
Table 8 (Cont.) Genes with significantly different expression between S and C lines (line effect) and between lines with age (line*age) interaction in Abdomen
tissue.
Cluster Gene Name/Symbol Location Molecular Function
Cluster 4 CG17751 3R 92A10-92A10 secondary active organic cation transmembrane transporter activity
Cluster 5 CG11538-RA Unknown Unknown None available
Cluster 5 Fbp2 2L 30B3-30B3 nutrient reservoir activity
Cluster 5 Lsp1alpha X 11A12-11A12 nutrient reservoir activity
Cluster 5 Lsp1beta 2L 21E2-21E2 nutrient reservoir activity
Cluster 5 Lsp1gamma 3L 61A6-61A6 nutrient reservoir activity
Cluster 5 Lsp2 3L 68F5-68F5 nutrient reservoir activity
Cluster 5 Fbp1 3L 70D2-70D2 protein transporter activity; oxygen transporter activity
Cluster 6 CG11034 2L 25F5-25F5 dipeptidyl-peptidase activity
Cluster 6 TotA 3R 93A2-93A2 None available
Cluster 6 CG31668 2L 22D1-22D4 transporter activity
Cluster 7 CG9541 2L 29F6-29F6 adenylate kinase activity
Cluster 7 Ama 3R 84A5-84A5 antigen binding
Cluster 7 Dscam 2R 43A4-43B1 axon guidance receptor activity; protein homodimerization activity
Cluster 7 e 3R 93C7-93D1 beta-alanyl-dopamine synthase activity
Cluster 7 Ect3 3R 87A7-87A7 beta-galactosidase activity
Cluster 7 CG1090 3R 82A4-82A4 calcium, potassium:sodium antiporter activity
Cluster 7 Gasp 3R 83D4-83D4 chitin binding; structural constituent of peritrophic membrane
Cluster 7 CG1869 3L 63B1-63B1 chitinase activity
Cluster 7 CG9519 X 12F6-12F6 choline dehydrogenase activity
Cluster 7 tw X 1C4-1D4 dolichyl-phosphate-mannose-protein mannosyltransferase activity
Cluster 7 Cyp316a1 3L 66A2-66A2 electron carrier activity
Cluster 7 GATAe 3R 89A12-89A12 general RNA polymerase II transcription factor activity
Cluster 7 CG3961 3L 75E3-75E4 long-chain fatty acid-CoA ligase activity
Cluster 7 verm 3L 76C2-76C3 low-density lipoprotein receptor activity
Cluster 7 CG4500 2L 34F1-34F1 None available
Cluster 7 nimC2 2L 34E5-34E5 None available
Cluster 7 CG34199 2R 56F16-56F16 None available
Cluster 7 CG12488 Unknown Unknown None available

70
Table 8 (Cont.) Genes with significantly different expression between S and C lines (line effect) and between lines with age (line*age) interaction in Abdomen
tissue.
Cluster Gene Name/Symbol Location Molecular Function
Cluster 7 Cda4 X 20C3-20D1 None available
Cluster 7 CG33082 X 1E1-1E1 None available
Cluster 7 CG8100 3L 70D2-70D2 oxygen transporter activity
Cluster 7 CG10211 2L 36F6-36F6 peroxidase activity
Cluster 7 CG5873 3R 90A6-90B1 peroxidase activity
Cluster 7 comm 3L 71F2-71F2 protein binding
Cluster 7 CG4650 2L 35B5-35B5 serine-type endopeptidase activity
Cluster 7 CG10764 2R 54B16-54B16 serine-type endopeptidase activity
Cluster 7 CG30286 2R 57E9-57E10 serine-type endopeptidase activity
Cluster 7 Cpr49Ac 2R 49A2-49A2 structural constituent of chitin-based larval cuticle
Cluster 7 Gr8a X 8D2-8D2 taste receptor activity
Cluster 8 alpha-catenin-related 2R 60A14-60A14 actin binding
Cluster 8 Hip1 3L 69E2-69E2 actin binding
Cluster 8 Tm1 3R 88E12-88E13 actin binding
Cluster 8 wupA X 16F7-16F7 actin binding
Cluster 8 CG2767 3R 84E8-84E8 alcohol dehydrogenase (NADP+) activity
Cluster 8 CG10863 3L 64A1-64A1 aldehyde reductase activity
Cluster 8 CG5361 3R 85F9-85F9 alkaline phosphatase activity
Cluster 8 Mal-B1 2L 33A3-33A4 alpha-glucosidase activity
Cluster 8 CG5322 2L 31E4-31E4 alpha-mannosidase activity
Cluster 8 CG6465 3R 86C4-86C4 aminoacylase activity
Cluster 8 CG6071 3L 68D1-68D1 aminopeptidase activity
Cluster 8 CG31445 3R 99A1-99A4 aminopeptidase activity
Cluster 8 CG18473 3R 85D11-85D12 aryldialkylphosphatase activity
Cluster 8 CG15547 3R 100A6-100A6 ATP binding
Cluster 8 CG4511 3R 86C7-86C7 ATP binding
Cluster 8 ATPCL 2R 52D9-52D11 ATP citrate synthase activity
Cluster 8 CG3164 2L 21B2-21B2 ATPase activity
Cluster 8 CG4822 2L 21B2-21B2 ATPase activity

71
Table 8 (Cont.) Genes with significantly different expression between S and C lines (line effect) and between lines with age (line*age) interaction in Abdomen
tissue.
Cluster Gene Name/Symbol Location Molecular Function
Cluster 8 CG5853 2L 30F1-30F1 ATPase activity
Cluster 8 cals 4 102F8-102F8 calcium ion binding
Cluster 8 CG31999 4 102A8-102B1 calcium ion binding
Cluster 8 Glt 2L 29E3-29E3 calcium ion binding
Cluster 8 PMCA 4 102B5-102B5 calcium-transporting ATPase activity
Cluster 8 CG32698 X 9A2-9A2 carbonate dehydratase activity
Cluster 8 alpha-Est7 3R 84D9-84D9 carboxylesterase activity
Cluster 8 CG9509 X 13A1-13A1 choline dehydrogenase activity
Cluster 8 mt:CoI mt cytochrome-c oxidase activity
Cluster 8 mt:CoIII mt cytochrome-c oxidase activity
Cluster 8 mdy 2L 36B1-36B2 diacylglycerol O-acyltransferase activity
Cluster 8 Cyp4ac1 2L 25D2-25D2 electron carrier activity
Cluster 8 Cyp12c1 3L 75D6-75D6 electron carrier activity
Cluster 8 Cyp12e1 3R 86B4-86B4 electron carrier activity
Cluster 8 Cyp6d4 3R 94C1-94C1 electron carrier activity
Cluster 8 CG9649 3R 88A12-88A12 endopeptidase activity
Cluster 8 Pect 2L 34A9-34A9 ethanolamine-phosphate cytidylyltransferase activity
Cluster 8 NtR 2R 58B10-58C1 excitatory extracellular ligand-gated ion channel activity
Cluster 8 Fer1HCH 3R 99F2-99F2 ferrous iron binding
Cluster 8 mthl14 3L 61B3-61B3 G-protein coupled receptor activity
Cluster 8 lectin-28C 2L 28D2-28D2 galactose binding
Cluster 8 CG4335 3R 92E7-92E7 gamma-butyrobetaine dioxygenase activity
Cluster 8 CG32196 3L 75C7-75C7 gamma-glutamylcyclotransferase activity
Cluster 8 CG4302 2R 57D1-57D2 glucuronosyltransferase activity
Cluster 8 Ugt86Dd 3R 86D4-86D4 glucuronosyltransferase activity
Cluster 8 Ugt35a 3R 86D5-86D5 glucuronosyltransferase activity
Cluster 8 CG5976 3L 77C4-77C4 glutaminyl-peptide cyclotransferase activity
Cluster 8 CG6776 3L 66D5-66D5 glutathione transferase activity
Cluster 8 G-salpha60A 2R 60A12-60A13 GTPase activity

72
Table 8 (Cont.) Genes with significantly different expression between S and C lines (line effect) and between lines with age (line*age) interaction in Abdomen
tissue.
Cluster Gene Name/Symbol Location Molecular Function
Cluster 8 Rab7 3R 95D5-95D5 GTPase activity
Cluster 8 Rab39 X 7B7-7B7 GTPase activity
Cluster 8 Cda4 X 20C3-20D1 hydrolase activity
Cluster 8 bsk 2L 31B1-31B1 JUN kinase activity
Cluster 8 LBR 2R 57F10-57F11 lamin binding
Cluster 8 Mlc1 3R 98A14-98A15 microfilament motor activity
Cluster 8 CG17838 3R 92F12-93A1 mRNA binding
Cluster 8 Parp 3R 81F-81F NAD+ ADP-ribosyltransferase activity
Cluster 8 mt:ND4 mt NADH dehydrogenase (ubiquinone) activity
Cluster 8 mt:ND5 mt NADH dehydrogenase (ubiquinone) activity
Cluster 8 CCHa2 3R 87E8-87E8 neuropeptide hormone activity
Cluster 8 CCHa2 3R 87E8-87E8 neuropeptide hormone activity
Cluster 8 CG13794 2L 28C2-28C2 neurotransmitter transporter activity
Cluster 8 CG13795 2L 28C2-28C2 neurotransmitter transporter activity
Cluster 8 cpx 3R 82A1-82A3 neurotransmitter transporter activity
Cluster 8 Pten 2L 31B1-31B1 non-membrane spanning protein tyrosine phosphatase activity
Cluster 8 Pten 2L 31B1-31B1 non-membrane spanning protein tyrosine phosphatase activity
Cluster 8 CG1674 4 102B1-102B1 None available
Cluster 8 CG10283 2L 36F5-36F5 None available
Cluster 8 CG11592 2L 21B7-21B7 None available
Cluster 8 CG18095 2L 34F1-34F2 None available
Cluster 8 CG31769 2L 34F4-34F5 None available
Cluster 8 CG31886 2L 29F5-29F5 None available
Cluster 8 Lamp1 2L 39E2-39E2 None available
Cluster 8 CG8852 2L 23F6-24A1 None available
Cluster 8 CG17665 2R h44-h46 None available
Cluster 8 CG18609 2R 55E11-55E11 None available
Cluster 8 Vps13 2R 43D7-43E1 None available
Cluster 8 CG3907 2R 60B3-60B4 None available

73
Table 8 (Cont.) Genes with significantly different expression between S and C lines (line effect) and between lines with age (line*age) interaction in Abdomen
tissue.
Cluster Gene Name/Symbol Location Molecular Function
Cluster 8 l(2)05510 2R 57A5-57A6 None available
Cluster 8 Tsp42Ea 2R 42E4-42E4 None available
Cluster 8 CG13032 3L 73B6-73B6 None available
Cluster 8 CG32195 3L 75B10-75B10 None available
Cluster 8 CG33274-RB 3L 66C3-66C4 None available
Cluster 8 cp309 3L 71B2-71B4 None available
Cluster 8 nvd 3L Unknown None available
Cluster 8 CG40351 3L Unknown None available
Cluster 8 CG7194 3L 66C5-66C5 None available
Cluster 8 gk 3L 75B11-75B12 None available
Cluster 8 Sug 3L 68D2-68D2 None available
Cluster 8 CG10560 3R 96D1-96D1 None available
Cluster 8 CG14245 3R 97C5-97C5 None available
Cluster 8 CG14280 3R 91F13-91F13 None available
Cluster 8 CG14292 3R 91D4-91D4 None available
Cluster 8 CG33330 3R 88D3-88D3 None available
Cluster 8 c(3)G 3R 89A5-89A5 None available
Cluster 8 CG31106 Unknown Unknown None available
Cluster 8 CG31189 Unknown Unknown None available
Cluster 8 CG32712-RA Unknown Unknown None available
Cluster 8 CG40769 Unknown Unknown None available
Cluster 8 CG41243 Unknown Unknown None available
Cluster 8 CG41581 Unknown Unknown None available
Cluster 8 Unknown Unknown Unknown None available
Cluster 8 Probable insulin-like peptide 6 Unknown Unknown None available
Cluster 8 Protein KRI1 homolog Unknown Unknown None available
Cluster 8 CG12470 X 1A1-1A1 None available
Cluster 8 CG1572 X 10C5-10C5 None available
Cluster 8 CG34325 X 15A3-15A3 None available
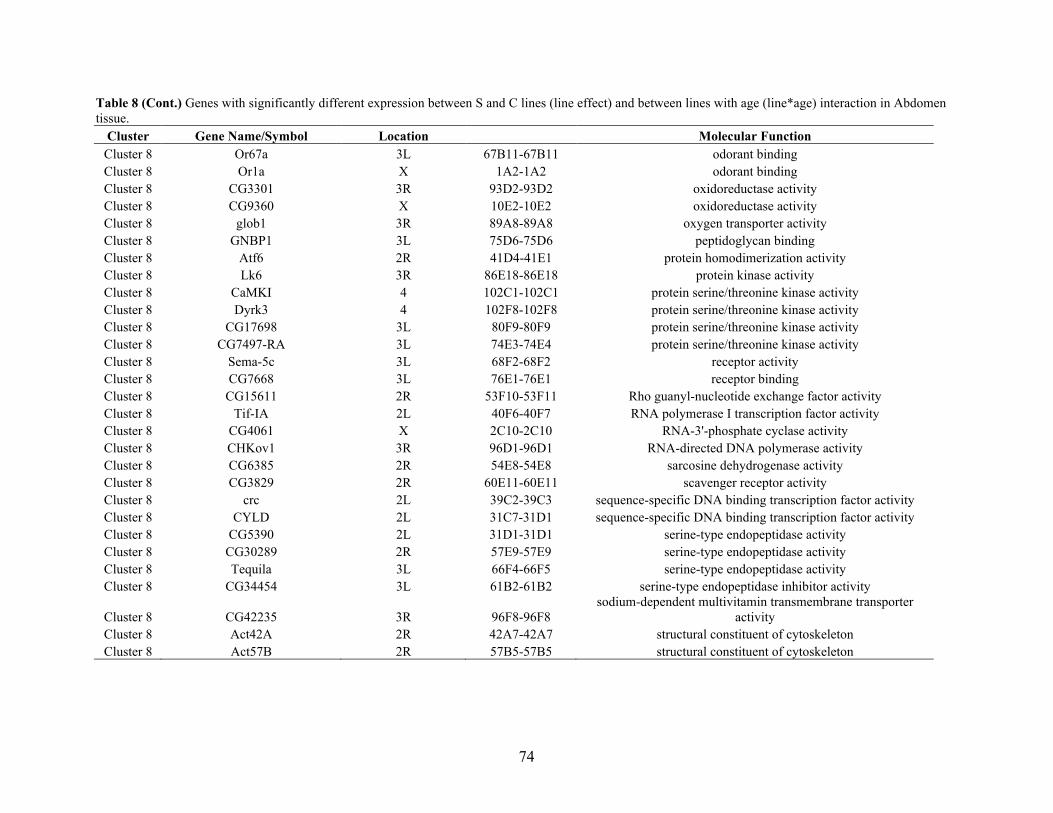
74
Table 8 (Cont.) Genes with significantly different expression between S and C lines (line effect) and between lines with age (line*age) interaction in Abdomen
tissue.
Cluster Gene Name/Symbol Location Molecular Function
Cluster 8 Or67a 3L 67B11-67B11 odorant binding
Cluster 8 Or1a X 1A2-1A2 odorant binding
Cluster 8 CG3301 3R 93D2-93D2 oxidoreductase activity
Cluster 8 CG9360 X 10E2-10E2 oxidoreductase activity
Cluster 8 glob1 3R 89A8-89A8 oxygen transporter activity
Cluster 8 GNBP1 3L 75D6-75D6 peptidoglycan binding
Cluster 8 Atf6 2R 41D4-41E1 protein homodimerization activity
Cluster 8 Lk6 3R 86E18-86E18 protein kinase activity
Cluster 8 CaMKI 4 102C1-102C1 protein serine/threonine kinase activity
Cluster 8 Dyrk3 4 102F8-102F8 protein serine/threonine kinase activity
Cluster 8 CG17698 3L 80F9-80F9 protein serine/threonine kinase activity
Cluster 8 CG7497-RA 3L 74E3-74E4 protein serine/threonine kinase activity
Cluster 8 Sema-5c 3L 68F2-68F2 receptor activity
Cluster 8 CG7668 3L 76E1-76E1 receptor binding
Cluster 8 CG15611 2R 53F10-53F11 Rho guanyl-nucleotide exchange factor activity
Cluster 8 Tif-IA 2L 40F6-40F7 RNA polymerase I transcription factor activity
Cluster 8 CG4061 X 2C10-2C10 RNA-3'-phosphate cyclase activity
Cluster 8 CHKov1 3R 96D1-96D1 RNA-directed DNA polymerase activity
Cluster 8 CG6385 2R 54E8-54E8 sarcosine dehydrogenase activity
Cluster 8 CG3829 2R 60E11-60E11 scavenger receptor activity
Cluster 8 crc 2L 39C2-39C3 sequence-specific DNA binding transcription factor activity
Cluster 8 CYLD 2L 31C7-31D1 sequence-specific DNA binding transcription factor activity
Cluster 8 CG5390 2L 31D1-31D1 serine-type endopeptidase activity
Cluster 8 CG30289 2R 57E9-57E9 serine-type endopeptidase activity
Cluster 8 Tequila 3L 66F4-66F5 serine-type endopeptidase activity
Cluster 8 CG34454 3L 61B2-61B2 serine-type endopeptidase inhibitor activity
Cluster 8 CG42235 3R 96F8-96F8
sodium-dependent multivitamin transmembrane transporter
activity
Cluster 8 Act42A 2R 42A7-42A7 structural constituent of cytoskeleton
Cluster 8 Act57B 2R 57B5-57B5 structural constituent of cytoskeleton

75
Table 8 (Cont.) Genes with significantly different expression between S and C lines (line effect) and between lines with age (line*age) interaction in Abdomen
tissue.
Cluster Gene Name/Symbol Location Molecular Function
Cluster 8 Act87E 3R 87E11-87E11 structural constituent of cytoskeleton
Cluster 8 CG34417 X 6B3-6C1 structural constituent of cytoskeleton
Cluster 8 mRpS5 3L Unknown structural constituent of ribosome
Cluster 8 mRpS5 3L Unknown structural constituent of ribosome
Cluster 8 RpL7A X 6B1-6B1 structural constituent of ribosome
Cluster 8 e(r) X 8B7-8B7 transcription regulator activity
Cluster 8 Eph 4 102D1-102D1 transmembrane receptor protein tyrosine kinase activity
Cluster 8 CG3285 2L 23E4-23E4 transmembrane transporter activity
Cluster 8 CG5973 2L 27F4-27F4 transporter activity
Cluster 8 CG30344 2R 45A12-45A13 transporter activity
Cluster 8 CG31272 3R 86C5-86C5 transporter activity
Cluster 8 CG3091 X 2F2-2F2 transporter activity
Cluster 8 CG6277 3R 97D14-97D14 triglyceride lipase activity
Cluster 8 14-3-3zeta 2R 46E6-46E8 tryptophan hydroxylase activator activity
Cluster 8 mt:Cyt-b mt ubiquinol-cytochrome-c reductase activity
Cluster 8 UGP 3L 67B1-67B2 UTP:glucose-1-phosphate uridylyltransferase activity
Cluster 8 CG6045 3R 88F7-88F7 xanthine dehydrogenase activity
Cluster 8 CG4080 3L 67B3-67B4 zinc ion binding
Cluster 8 Unc-115b 3R 85E4-85E4 zinc ion binding
Cluster 8 CG32581 X 13F1-13F1 zinc ion binding
Cluster 8 CG8974 X 13E18-13F1 zinc ion binding
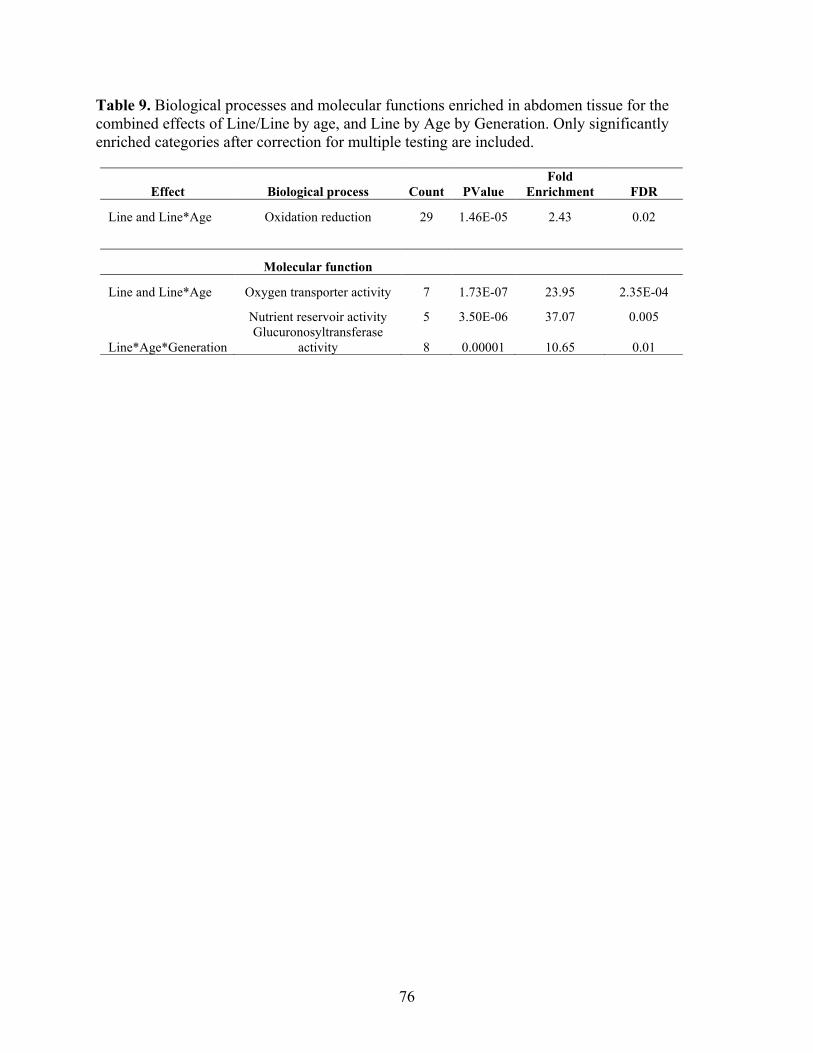
76
Table 9. Biological processes and molecular functions enriched in abdomen tissue for the
combined effects of Line/Line by age, and Line by Age by Generation. Only significantly
enriched categories after correction for multiple testing are included.
Effect Biological process Count PValue
Fold
Enrichment FDR
Line and Line*Age Oxidation reduction 29 1.46E-05 2.43 0.02
Molecular function
Line and Line*Age Oxygen transporter activity 7 1.73E-07 23.95 2.35E-04
Nutrient reservoir activity 5 3.50E-06 37.07 0.005
Line*Age*Generation
Glucuronosyltransferase
activity 8 0.00001 10.65 0.01

77
Table 10. Genes with significantly different expression between S and C lines (line effect) and between lines with age (line*age) interaction in Head tissue.
Cluster
Gene
Name/Symbol Location Molecular Function
Cluster 1 CG8343 2R 42A13-42A13 mannose binding
Cluster 1 CG3088 3L 67C2-67C2 serine-type endopeptidase activity
Cluster 1 CG8329 3L 67C3-67C3 serine-type endopeptidase activity
Cluster 1 CG9676 X 15A1-15A1 serine-type endopeptidase activity
Cluster 2 CG6071 3L 68D1-68D1 aminopeptidase activity
Cluster 2 CG4511 3R 86C7-86C7 ATP binding
Cluster 2 Atet 2L 24E1-24E1 ATPase activity, coupled to transmembrane movement of substances
Cluster 2 CG14709 3R 86E11-86E11 ATPase activity, coupled to transmembrane movement of substances
Cluster 2 CG2256 X 7D5-7D6 calcium ion binding
Cluster 2 Est-P 3L 69A1-69A1 carboxylesterase activity
Cluster 2 CG5316 3R 92A3-92A3 damaged DNA binding
Cluster 2 CG34365 2R 52A3-52A4 diacylglycerol binding
Cluster 2 Cyp316a1 3L 66A2-66A2 electron carrier activity
Cluster 2 5-HT1B 2R 56B1-56B1 G-protein coupled amine receptor activity; serotonin receptor activity
Cluster 2 Rh2 3R 91D4-91D4 G-protein coupled photoreceptor activity
Cluster 2 Rh3 3R 92C5-92C5 G-protein coupled photoreceptor activity
Cluster 2 pollux 3R 83B9-83C1 integrin binding
Cluster 2 endoA 3R 91D4-91D4 lysophosphatidic acid acyltransferase activity
Cluster 2 CG31427 3R 99A1-99A1 metallopeptidase activity
Cluster 2 CG31427 3R 99A1-99A1 metallopeptidase activity
Cluster 2 Rb97D 3R 97D3-97D3 mRNA binding
Cluster 2 DmsR-1 3L 62D6-62D6 myosuppressin receptor activity; neuropeptide receptor activity
Cluster 2 CG7408 3L 75A7-75A8 N-acetylgalactosamine-4-sulfatase activity
Cluster 2 tutl 2L 24E1-24E1 None available
Cluster 2 CG3588 X 3C3-3C3 None available
Cluster 2 CG15270 2L 35C1-35C2 None available
Cluster 2 CG10283 2L 36F5-36F5 None available
Cluster 2 CG8008 2R 45B1-45B1 None available
Cluster 2 CG13870 2R 56F17-56F17 None available

78
Table 10 (Cont.) Genes with significantly different expression between S and C lines (line effect) and between lines with age (line*age) interaction in Head
tissue.
Cluster Gene Name/Symbol Location Molecular Function
Cluster 2 CG16742 2R 57A8-57A8 None available
Cluster 2 CG13917 3L 62A7-62A7 None available
Cluster 2 CG14995 3L 64A5-64A6 None available
Cluster 2 CG14995 3L 64A5-64A6 None available
Cluster 2 CG14995 3L 64A5-64A6 None available
Cluster 2 CG14177 3L 67C2-67C2 None available
Cluster 2 CG14450 3L 80A1-80A1 None available
Cluster 2 CG12947 3R 85E8-85E8 None available
Cluster 2 Osi22 3R 87E4-87E4 None available
Cluster 2 CG15025 3R 92A6-92A6 None available
Cluster 2 CG10883 Unknown None available
Cluster 2 dpr 2R 57B1-57B2 None available
Cluster 2 MESK2 2R 57E8-57E9 None available
Cluster 2 CG33702 3L 67B11-67B11 None available
Cluster 2 CG33995 2L 25C1-25C1 None available
Cluster 2 Ir10a X 10B2-10B2 None available
Cluster 2 CG40973 Unknown None available
Cluster 2 Or49b 2R 49D4-49D4 olfactory receptor activity
Cluster 2 CG15684 3R 92E2-92E2 oxysterol binding
Cluster 2 ced-6 2R 45D7-45D8 protein binding
Cluster 2 PKD 3R 91A2-91A2 protein serine/threonine kinase activity
Cluster 2 CG4030 2R 57B19-57B19 Rab GTPase binding
Cluster 2 Sur-8 3R 90A5-90A5 Ras GTPase binding
Cluster 2 apt 2R 59F1-59F4 RNA polymerase II transcription factor activity
Cluster 2 CG11835 2L 21E2-21E2 sequence-specific DNA binding transcription factor activity
Cluster 2 FoxP 3R 85E5-85E5 sequence-specific DNA binding transcription factor activity
Cluster 2 5-HT2 3R 82C3-82D5 serotonin receptor activity
Cluster 2 CG32082 3L 68A8-68A9 signal transducer activity
Cluster 2 cbt 2L 21D1-21D1 transcription activator activity

79
Table 10 (Cont.) Genes with significantly different expression between S and C lines (line effect) and between lines with age (line*age) interaction in Head
tissue.
Cluster Gene Name/Symbol Location Molecular Function
Cluster 2 CG11891 3R 96C8-96C8 transferase activity, transferring phosphorus-containing groups
Cluster 2 CG31668 2L 22D1-22D4 transporter activity
Cluster 2 CG4080 3L 67B3-67B4 zinc ion binding
Cluster 3 Fbp2 2L 30B3-30B3 nutrient reservoir activity
Cluster 3 Fbp1 3L 70D2-70D2 protein transporter activity
Cluster 4 CG5567 3L 75A4-75A4 4-nitrophenylphosphatase activity
Cluster 4 rasp 3L 63B8-63B8 acyltransferase activity
Cluster 4 Aprt 3L 62B9-62B9 adenine phosphoribosyltransferase activity
Cluster 4 Ada 3R 85C4-85C4 adenosine deaminase activity
Cluster 4 SamDC 2L 31D9-31D9 adenosylmethionine decarboxylase activity
Cluster 4 CG31343 3R 93F8-93F8 aminopeptidase activity
Cluster 4 CG13692 2L 21C2-21C2 ARF GTPase activator activity
Cluster 4 CG10973 3L 69E1-69E1 binding
Cluster 4 Nrg X 7F2-7F4 calcium ion binding
Cluster 4 CG14512 3R 98F12-98F12 carbohydrate binding
Cluster 4 CG10877 3R 92F1-92F2 catalytic activity
Cluster 4 CG15220 X 10D1-10D1 DNA binding
Cluster 4 CG6870 2L 36D1-36D1 electron carrier activity
Cluster 4 fbp 2L 38A2-38A3 fructose 1,6-bisphosphate 1-phosphatase activity
Cluster 4 CG1969 3R 99B9-99B9 glucosamine 6-phosphate N-acetyltransferase activity
Cluster 4 CG12056 X 8C17-8C17 heme binding
Cluster 4 CG18643 3R 86E5-86E5 hydrolase activity, acting on ester bonds
Cluster 4 fh X 8C14-8C14 iron chaperone activity
Cluster 4 Jheh3 2R 55F8-55F8 juvenile hormone epoxide hydrolase activity
Cluster 4 CG8067 2R 50C23-50C23 methyltransferase activity
Cluster 4 CG11342 3L 64B2-64B2 methyltransferase activity
Cluster 4 CG10466 2L 38A3-38A3 mRNA binding
Cluster 4 CG14291 3R 91D4-91D4 N-sulfoglucosamine sulfohydrolase activity
Cluster 4 CG3683 2R 60D13-60D13 NADH dehydrogenase (ubiquinone) activity

80
Table 10 (Cont.) Genes with significantly different expression between S and C lines (line effect) and between lines with age (line*age) interaction in Head
tissue.
Cluster Gene Name/Symbol Location Molecular Function
Cluster 4 l(3)neo18 3L 68F5-68F5 NADH dehydrogenase (ubiquinone) activity
Cluster 4 CG3714 2L 24D8-24D8 nicotinate phosphoribosyltransferase activity
Cluster 4 ImpL1 3L 70A7-70A7 None available
Cluster 4 CG14270 X 3D4-3D4 None available
Cluster 4 CG14430 X 6E4-6E4 None available
Cluster 4 CG7267 X 8C4-8C4 None available
Cluster 4 CG9689 X 9A3-9A3 None available
Cluster 4 kek5 X 18C3-18C7 None available
Cluster 4 CG14229 X 18E1-18E1 None available
Cluster 4 CG3652 2L 24E5-24E5 None available
Cluster 4 CG7224 2L 28D3-28D3 None available
Cluster 4 CG6583 2L 33D2-33D2 None available
Cluster 4 CG2611 2L 38D2-38D2 None available
Cluster 4 CG15650 2R 57B5-57B5 None available
Cluster 4 CG13562 2R 60A9-60A9 None available
Cluster 4 CG3894 2R 60E1-60E1 None available
Cluster 4 CG14107 3L 70A7-70A7 None available
Cluster 4 CG10171 3L 70A7-70A8 None available
Cluster 4 CG10171 3L 70A7-70A8 None available
Cluster 4 CG5969 3L 77C4-77C4 None available
Cluster 4 CG10584 3L 78A2-78A5 None available
Cluster 4 CG1142 3R 84D8-84D8 None available
Cluster 4 CG9396 3R 85D25-85D25 None available
Cluster 4 CG7713 3R 90C5-90C5 None available
Cluster 4 CG30005 2R 45F6-45F6 None available
Cluster 4 CG31126 3R 96A14-96A14 None available
Cluster 4 CG32442 3L 78D5-78D5 None available
Cluster 4 CG41541 Unknown None available
Cluster 4 CG41586 Unknown None available
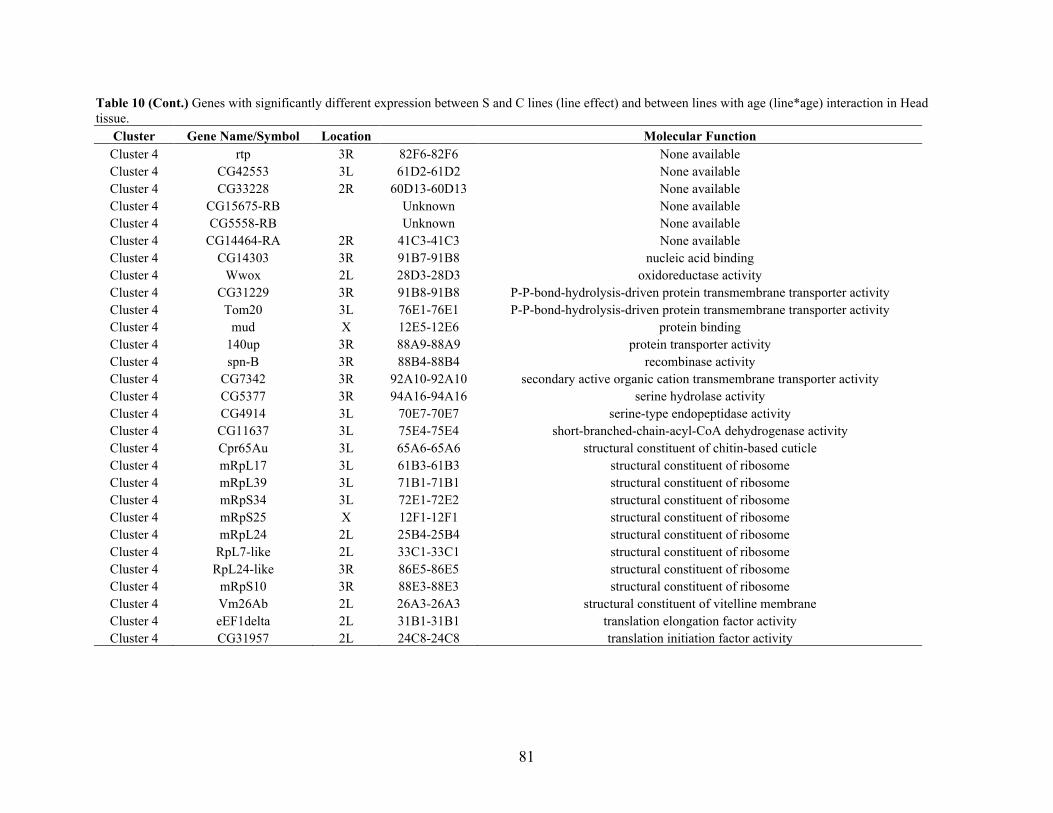
81
Table 10 (Cont.) Genes with significantly different expression between S and C lines (line effect) and between lines with age (line*age) interaction in Head
tissue.
Cluster Gene Name/Symbol Location Molecular Function
Cluster 4 rtp 3R 82F6-82F6 None available
Cluster 4 CG42553 3L 61D2-61D2 None available
Cluster 4 CG33228 2R 60D13-60D13 None available
Cluster 4 CG15675-RB Unknown None available
Cluster 4 CG5558-RB Unknown None available
Cluster 4 CG14464-RA 2R 41C3-41C3 None available
Cluster 4 CG14303 3R 91B7-91B8 nucleic acid binding
Cluster 4 Wwox 2L 28D3-28D3 oxidoreductase activity
Cluster 4 CG31229 3R 91B8-91B8 P-P-bond-hydrolysis-driven protein transmembrane transporter activity
Cluster 4 Tom20 3L 76E1-76E1 P-P-bond-hydrolysis-driven protein transmembrane transporter activity
Cluster 4 mud X 12E5-12E6 protein binding
Cluster 4 140up 3R 88A9-88A9 protein transporter activity
Cluster 4 spn-B 3R 88B4-88B4 recombinase activity
Cluster 4 CG7342 3R 92A10-92A10 secondary active organic cation transmembrane transporter activity
Cluster 4 CG5377 3R 94A16-94A16 serine hydrolase activity
Cluster 4 CG4914 3L 70E7-70E7 serine-type endopeptidase activity
Cluster 4 CG11637 3L 75E4-75E4 short-branched-chain-acyl-CoA dehydrogenase activity
Cluster 4 Cpr65Au 3L 65A6-65A6 structural constituent of chitin-based cuticle
Cluster 4 mRpL17 3L 61B3-61B3 structural constituent of ribosome
Cluster 4 mRpL39 3L 71B1-71B1 structural constituent of ribosome
Cluster 4 mRpS34 3L 72E1-72E2 structural constituent of ribosome
Cluster 4 mRpS25 X 12F1-12F1 structural constituent of ribosome
Cluster 4 mRpL24 2L 25B4-25B4 structural constituent of ribosome
Cluster 4 RpL7-like 2L 33C1-33C1 structural constituent of ribosome
Cluster 4 RpL24-like 3R 86E5-86E5 structural constituent of ribosome
Cluster 4 mRpS10 3R 88E3-88E3 structural constituent of ribosome
Cluster 4 Vm26Ab 2L 26A3-26A3 structural constituent of vitelline membrane
Cluster 4 eEF1delta 2L 31B1-31B1 translation elongation factor activity
Cluster 4 CG31957 2L 24C8-24C8 translation initiation factor activity

82
Table 10 (Cont.) Genes with significantly different expression between S and C lines (line effect) and between lines with age (line*age) interaction in Head
tissue.
Cluster Gene Name/Symbol Location Molecular Function
Cluster 4 CG17930 3R 89B12-89B12 transmembrane transporter activity
Cluster 4 CG13993 2L 26B4-26B4 unfolded protein binding
Cluster 5 Chd64 3L 64A6-64A7 actin binding; juvenile hormone response element binding
Cluster 5 CG18809 X 18E5-18E5 cytochrome-c oxidase activity
Cluster 5 Ir21a 2L 21A5-21B1 extracellular-glutamate-gated ion channel activity
Cluster 5 inx7 X 6E4-6E4 gap junction channel activity
Cluster 5 CG17364 3L 70C9-70C9 GTP binding
Cluster 5 NTPase 2L 23C1-23C1 guanosine-diphosphatase activity
Cluster 5 Gyc-89Db 3R 89B18-89B18 guanylate cyclase activity
Cluster 5 Art4 3R 85F4-85F4 histone methyltransferase activity
Cluster 5 Su(z)12 3L 76D4-76D4 histone methyltransferase activity
Cluster 5 Cirl 2R 44D4-44D5 latrotoxin receptor activity; sugar binding
Cluster 5 CG11412 X 1F3-1F4 N-acetyltransferase activity
Cluster 5 CG9866 2L 22E1-22E1 None available
Cluster 5 CG15626 2L 25A8-25A8 None available
Cluster 5 CG8964 2R 48D7-48D7 None available
Cluster 5 CG11242 2R 56D11-56D12 None available
Cluster 5 CG6652 3L 73E4-73E4 None available
Cluster 5 CG14852 3R 88C6-88C6 None available
Cluster 5 CR32027 3L 75E2-75E2 None available
Cluster 5 CG34269 3L 61C3-61C3 None available
Cluster 5 Pmm45A 2R 45A6-45A7 phosphomannomutase activity
Cluster 5 cnk 2R 54B7-54B7 protein binding
Cluster 5 CG12229 3L 74C1-74C1 pyruvate kinase activity
Cluster 5 Sema-5c 3L 68F2-68F2 receptor activity
Cluster 5 HGTX 3L 70E3-70E3 sequence-specific DNA binding transcription factor activity
Cluster 5 ham 2L 37A2-37A4 sequence-specific DNA binding transcription factor activity
Cluster 5 pnr 3R 89A13-89B1 sequence-specific DNA binding transcription factor activity
Cluster 5 Takr86C 3R 86C5-86C5 tachykinin receptor activity

83
Table 10 (Cont.) Genes with significantly different expression between S and C lines (line effect) and between lines with age (line*age) interaction in Head
tissue.
Cluster Gene Name/Symbol Location Molecular Function
Cluster 5 CR31054 3R 98B6-98B6 translation elongation factor activity
Cluster 5 ref(2)P 2L 37F1-37F1 zinc ion binding
No Cluster CG33346 3R 98E1-98E1 hydrolase activity
No Cluster CG31775 2L 35B5-35B5 None available
No Cluster CG3770 2R 60E8-60E8 None available

84
Figure 9. Heat map representation of differentially expressed genes between S and C lines for
(A) Abdomen and (B) Head tissue. Each column represents an age-class and each row represents
the expression pattern of a gene across all age-classes. The ratios of transcript levels between
selection and control lines are color coded in red and blue. Red represents an increase in
transcript level and blue represents a decrease. Genes in each tissue/effect combination are
grouped in three to eight clusters (C1-C8) obtained by hierarchical clustering analysis based on
similarities in expression profiles.
(A) Abdomen (B) Head

85
Figure 10. Gene expression profiles for genes differentially expressed between S and C lines in
(A) Abdomen and (B) Head tissue. Clusters correspond to heat maps displayed on figure 9.
(A) Abdomen
(B) Head

86
Appendix A. Heat map representation of differentially expressed genes between S and C lines
across age and generation for (A) Abdomen and (B) Head tissue. Each column represents an age-
class and each row represents the expression pattern of a gene across all age-classes. The ratios
of transcript levels between selection and control lines are color coded in red and blue. Red
represents an increase in transcript level and blue represents a decrease. Genes in each
tissue/effect combination are grouped in two to four clusters (C1-C4) obtained by hierarchical
clustering analysis based on similarities in expression profiles.
(A) Abdomen (B) Head

87
Appendix B. Genes with significantly different expression between S and C lines across age and generation (line*age*gen) interaction in Abdomen tissue.
Cluster Gene Name/Symbol Location Molecular Function
Cluster 1 Mur2B X 2B2-2B4 chitin binding
Cluster 1 CG14834 3L 65F5-65F5 None available
Cluster 1 yellow-g2 3L 62D5-62D5 None available
Cluster 1 CG32774 X 4B4-4B4 None available
Cluster 1 CG32972 Unknown Unknown None available
Cluster 1 CG4009 3R 89E10-89E10 peroxidase activity
Cluster 1 Defective Chorion 1 X 7C1-7C1 structural constituent of chorion
Cluster 2 CG3209 2R 60B8-60B8 1-acylglycerol-3-phosphate O-acyltransferase activity
Cluster 2 CG10168 3R 95A1-95A1 2-hydroxyacylsphingosine 1-beta-galactosyltransferase activity
Cluster 2 CG10170 3R 95A1-95A1 2-hydroxyacylsphingosine 1-beta-galactosyltransferase activity
Cluster 2 veil 2R 54B16-54B17 5'-nucleotidase activity
Cluster 2 Tm2 3R 88E13-88E13 actin binding
Cluster 2 Tm1 3R 88E12-88E13 actin binding
Cluster 2 wupA X 16F7-16F7 actin binding
Cluster 2 Adgf-D 3R 87F11-87F11 adenosine deaminase activity
Cluster 2 Adgf-A 3L 75A1-75A1 adenosine deaminase activity; growth factor activity
Cluster 2 CG2767 3R 84E8-84E8 alcohol dehydrogenase (NADP+) activity
Cluster 2 CG8785 2R 49B10-49B11 amino acid transmembrane transporter activity
Cluster 2 CG7888 3L 68A3-68A3 amino acid transmembrane transporter activity
Cluster 2 CG17110 3R 94D13-94D13 aminoacylase activity
Cluster 2 CG8774 3R 87E4-87E5 aminopeptidase activity
Cluster 2 CG31343 3R 93F8-93F8 aminopeptidase activity
Cluster 2 CG31233 3R 93F8-93F8 aminopeptidase activity
Cluster 2 pcl X 1B2-1B2 aspartic-type endopeptidase activity
Cluster 2 CG4562 3R 92B4-92B4 ATPase activity
Cluster 2 CG33970 3R 97A8-97A10 ATPase activity
Cluster 2 Mlc2 3R 99E1-99E1 ATPase activity
Cluster 2 CG14709 3R 86E11-86E11 ATPase activity
Cluster 2 CG11147 2L 25F4-25F4 ATPase activity, coupled to transmembrane movement of substances
Cluster 2 CG13124 2L 30E1-30E1 binding
Cluster 2 Eip63F-1 3L 63F6-64A1 calcium ion binding
Cluster 2 CG7526 3L 66A5-66A5 calcium ion binding
Cluster 2 Mp20 2R 49F13-49F13 calcium ion binding
Cluster 2 TpnC73F 3L 73E5-73E5 calcium ion binding
Cluster 2 CG4301 X 14C4-14C4 calcium-transporting ATPase activity

88
Appendix B (Cont.) Genes with significantly different expression between S and C lines across age and generation (line*age*gen) interaction in Abdomen
tissue.
Cluster Gene Name/Symbol Location Molecular Function
Cluster 2 Pka-C3 3L 72B1-72B2 cAMP-dependent protein kinase activity
Cluster 2 CG3841 2L 30B12-30C1 carboxylesterase activity
Cluster 2 Est-6 3L 69A1-69A1 carboxylesterase activity
Cluster 2 alpha-Est5 3R 84D4-84D5 carboxylesterase activity
Cluster 2 alpha-Est8 3R 84D9-84D9 carboxylesterase activity
Cluster 2 CG15879 3L 62D1-62D1 catalytic activity
Cluster 2 Gasp 3R 83D4-83D4 chitin binding
Cluster 2 ClC-a 3R 86F8-86F8 chloride channel activity
Cluster 2 CG5946 3L 68E1-68E1 cytochrome-b5 reductase activity
Cluster 2 CG8790 3R 87E8-87E8 dicarboxylic acid transmembrane transporter activity
Cluster 2 ome-RA 3L 70E7-70F4 dipeptidyl-peptidase activity
Cluster 2 Zfrp8 2R 60B11-60B12 DNA binding
Cluster 2 Cyp4e1 2R 44D1-44D1 electron carrier activity
Cluster 2 Cyp12a4 3R 91F3-91F3 electron carrier activity
Cluster 2 Cyp6a8 2R 51D1-51D1 electron carrier activity
Cluster 2 Cyp313a3 3R 87B3-87B3 electron carrier activity; oxidoreductase activity
Cluster 2 Cyp4d2 X 2E1-2E1 electron carrier activity; oxidoreductase activity
Cluster 2 Cyp4d14 X 2E1-2E1 electron carrier activity; oxidoreductase activity
Cluster 2 Ir7c X 7C1-7C1 extracellular-glutamate-gated ion channel activity
Cluster 2 CG7589 3L 74C3-74C3 extracellular-glycine-gated ion channel activity
Cluster 2 CG7910 3R 84E10-84E10 fatty acid amide hydrolase activity
Cluster 2 Fmo-2 2R 42B2-42B2 flavin-containing monooxygenase activity
Cluster 2 mthl3 2R 54B16-54B16 G-protein coupled receptor activity
Cluster 2 Ugt36Ba 2L 36B1-36B1 glucuronosyltransferase activity
Cluster 2 CG11289 2L 27D7-27E1 glucuronosyltransferase activity
Cluster 2 Ugt36Bc 2L 36B1-36B1 glucuronosyltransferase activity
Cluster 2 CG4302 2R 57D1-57D2 glucuronosyltransferase activity
Cluster 2 Ugt58Fa 2R 58F3-58F3 glucuronosyltransferase activity
Cluster 2 Ugt35b 3R 86D5-86D5 glucuronosyltransferase activity
Cluster 2 CG5999 3R 87C8-87C8 glucuronosyltransferase activity
Cluster 2 Ugt86Dg 3R 86D5-86D5 glucuronosyltransferase activity
Cluster 2 Gs2 X 10B11-10B11 glutamate-ammonia ligase activity
Cluster 2 Gyk 3L 61B2-61B2 glycerol kinase activity
Cluster 2 Gpo-1 2R 52C8-52C8 glycerol-3-phosphate dehydrogenase activity
Cluster 2 Glycogenin 2R 57D1-57D1 glycogenin glucosyltransferase activity
Cluster 2 Rab5 2L 22E1-22E1 GTPase activity
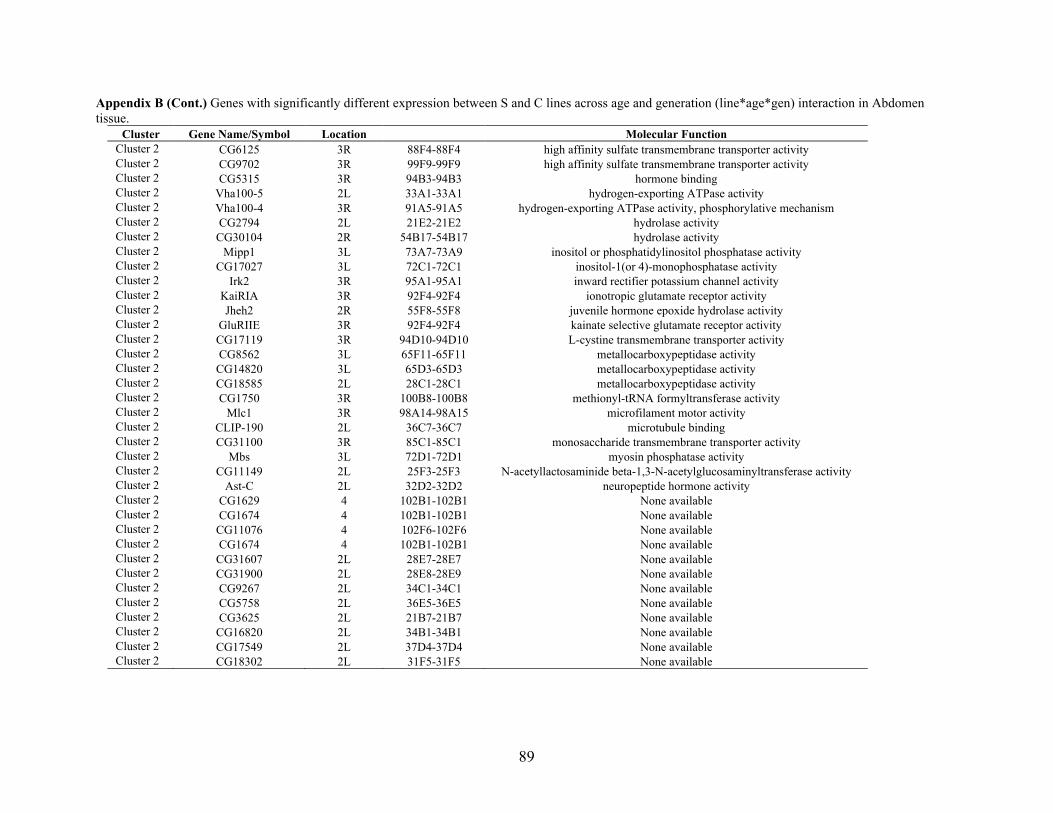
89
Appendix B (Cont.) Genes with significantly different expression between S and C lines across age and generation (line*age*gen) interaction in Abdomen
tissue.
Cluster Gene Name/Symbol Location Molecular Function
Cluster 2 CG6125 3R 88F4-88F4 high affinity sulfate transmembrane transporter activity
Cluster 2 CG9702 3R 99F9-99F9 high affinity sulfate transmembrane transporter activity
Cluster 2 CG5315 3R 94B3-94B3 hormone binding
Cluster 2 Vha100-5 2L 33A1-33A1 hydrogen-exporting ATPase activity
Cluster 2 Vha100-4 3R 91A5-91A5 hydrogen-exporting ATPase activity, phosphorylative mechanism
Cluster 2 CG2794 2L 21E2-21E2 hydrolase activity
Cluster 2 CG30104 2R 54B17-54B17 hydrolase activity
Cluster 2 Mipp1 3L 73A7-73A9 inositol or phosphatidylinositol phosphatase activity
Cluster 2 CG17027 3L 72C1-72C1 inositol-1(or 4)-monophosphatase activity
Cluster 2 Irk2 3R 95A1-95A1 inward rectifier potassium channel activity
Cluster 2 KaiRIA 3R 92F4-92F4 ionotropic glutamate receptor activity
Cluster 2 Jheh2 2R 55F8-55F8 juvenile hormone epoxide hydrolase activity
Cluster 2 GluRIIE 3R 92F4-92F4 kainate selective glutamate receptor activity
Cluster 2 CG17119 3R 94D10-94D10 L-cystine transmembrane transporter activity
Cluster 2 CG8562 3L 65F11-65F11 metallocarboxypeptidase activity
Cluster 2 CG14820 3L 65D3-65D3 metallocarboxypeptidase activity
Cluster 2 CG18585 2L 28C1-28C1 metallocarboxypeptidase activity
Cluster 2 CG1750 3R 100B8-100B8 methionyl-tRNA formyltransferase activity
Cluster 2 Mlc1 3R 98A14-98A15 microfilament motor activity
Cluster 2 CLIP-190 2L 36C7-36C7 microtubule binding
Cluster 2 CG31100 3R 85C1-85C1 monosaccharide transmembrane transporter activity
Cluster 2 Mbs 3L 72D1-72D1 myosin phosphatase activity
Cluster 2 CG11149 2L 25F3-25F3 N-acetyllactosaminide beta-1,3-N-acetylglucosaminyltransferase activity
Cluster 2 Ast-C 2L 32D2-32D2 neuropeptide hormone activity
Cluster 2 CG1629 4 102B1-102B1 None available
Cluster 2 CG1674 4 102B1-102B1 None available
Cluster 2 CG11076 4 102F6-102F6 None available
Cluster 2 CG1674 4 102B1-102B1 None available
Cluster 2 CG31607 2L 28E7-28E7 None available
Cluster 2 CG31900 2L 28E8-28E9 None available
Cluster 2 CG9267 2L 34C1-34C1 None available
Cluster 2 CG5758 2L 36E5-36E5 None available
Cluster 2 CG3625 2L 21B7-21B7 None available
Cluster 2 CG16820 2L 34B1-34B1 None available
Cluster 2 CG17549 2L 37D4-37D4 None available
Cluster 2 CG18302 2L 31F5-31F5 None available

90
Appendix B (Cont.) Genes with significantly different expression between S and C lines across age and generation (line*age*gen) interaction in Abdomen
tissue.
Cluster Gene Name/Symbol Location Molecular Function
Cluster 2 CG7778 2L 29B1-29B1 None available
Cluster 2 RIC-3 2R 57B9-57B12 None available
Cluster 2 CG10307 2R 57F8-57F8 None available
Cluster 2 CG3907 2R 60B3-60B4 None available
Cluster 2 CG7461-RA 2R 56C9-56C10 None available
Cluster 2 swi2 2R 54D5-54D6 None available
Cluster 2 JhI-26 2R 53B1-53B1 None available
Cluster 2 CG33012 2R 49A1-49A1 None available
Cluster 2 CG8008 2R 45B1-45B1 None available
Cluster 2 CG6845 3L 61B1-61B1 None available
Cluster 2 Fie 3L 63F5-63F5 None available
Cluster 2 CG6409 3L 67F1-67F1 None available
Cluster 2 CG7194 3L 66C5-66C5 None available
Cluster 2 CG5059 3L 77C6-77C6 None available
Cluster 2 Zasp66 3L 66D9-66D9 None available
Cluster 2 pst 3L 65F6-65F7 None available
Cluster 2 CG13024 3L 73D1-73D1 None available
Cluster 2 CG31259 3R 85A2-85A2 None available
Cluster 2 fau 3R 86C6-86C6 None available
Cluster 2 Mf 3R 88E2-88E2 None available
Cluster 2 CG8907 3R 89E8-89E8 None available
Cluster 2 CG6921 3R 94B4-94B4 None available
Cluster 2 Tm1 3R 88E12-88E13 None available
Cluster 2 CG18747 3R 84E1-84E1 None available
Cluster 2 CG9400 X 12E7-12E8 None available
Cluster 2 CG12057 X 8C17-8C17 None available
Cluster 2 CG15209 X 9F5-9F5 None available
Cluster 2 CG14439 X 6C11-6C12 None available
Cluster 2 Transporter Unknown Unknown None available
Cluster 2 Probable tRNA(His)
guanylyltransferase Unknown Unknown None available
Cluster 2 CG17571 Unknown Unknown None available
Cluster 2 FBtr0089969 Unknown Unknown None available
Cluster 2 CG30190; CG30193 Unknown Unknown None available
Cluster 2 Oatp58Da 2R 58D2-58D2 organic anion transmembrane transporter activity
Cluster 2 vanin-like X 5E1-5E1 pantetheine hydrolase activity
Cluster 2 GNBP2 3L 75D6-75D6 Gram-negative bacterial cell surface binding

91
Appendix B (Cont.) Genes with significantly different expression between S and C lines across age and generation (line*age*gen) interaction in Abdomen
tissue.
Cluster Gene Name/Symbol Location Molecular Function
Cluster 2 CG13160 2R 49A1-49A1 peptidase activity
Cluster 2 CG10051 2R 56D2-56D2 peptidase activity
Cluster 2 CG10062 2R 56D2-56D2 peptidase activity
Cluster 2 CG30043 2R 49A1-49A1 peptidase activity
Cluster 2 CG10211 2L 36F6-36F6 peroxidase activity
Cluster 2 Eb1-RC 2R 42C8-42C8 protein binding
Cluster 2 Pif1B 3R 85B1-85B1 protein binding
Cluster 2 Zasp52 2R 52C4-52C7 protein binding
Cluster 2 tim 2L 23F6-23F6 protein heterodimerization activity
Cluster 2 CkIIbeta X 10E3-10E3 protein kinase activity
Cluster 2 CG2930 X 3F4-3F4 proton-dependent oligopeptide secondary active transmembrane transporter activity
Cluster 2 CG1889 X 9A3-9A3 receptor binding
Cluster 2 CG6574 3R 86C7-86C7 reduced folate carrier activity
Cluster 2 CG5973 2L 27F4-27F4 retinal binding
Cluster 2 CG10026 2L 37E1-37E1 retinal binding
Cluster 2 CG15611 2R 53F10-53F11 Rho guanyl-nucleotide exchange factor activity
Cluster 2 crc 2L 39C2-39C3 sequence-specific DNA binding transcription factor activity
Cluster 2 CG17475 3R 89F1-89F1 serine-type endopeptidase activity
Cluster 2 CG11911 2L 21B8-21B8 serine-type endopeptidase activity
Cluster 2 CG9372 3L 76B9-76B9 serine-type peptidase activity
Cluster 2 nrv2 2L 27B1-27B2 sodium:potassium-exchanging ATPase activity
Cluster 2 CG15534 3R 99F4-99F4 sphingomyelin phosphodiesterase activity
Cluster 2 CG15531 3R 99E2-99E2 stearoyl-CoA 9-desaturase activity
Cluster 2 Fad2 3L 68A1-68A1 stearoyl-CoA 9-desaturase activity
Cluster 2 CG13284 2L 36B2-36B2 steroid dehydrogenase activity
Cluster 2 Ssl2 3R 98F5-98F5 strictosidine synthase activity
Cluster 2 Cpr62Bb 3L 62B6-62B6 structural constituent of chitin-based cuticle
Cluster 2 Defective Chorion 1 X 7C1-7C1 structural constituent of chorion
Cluster 2 zormin 3L 62C4-62D1 structural constituent of cytoskeleton
Cluster 2 Act87E 3R 87E11-87E11 structural constituent of cytoskeleton
Cluster 2 Scgalpha 2L 29A3-29A3 structural constituent of muscle
Cluster 2 mRpL45 3R 94B6-94B6 structural constituent of ribosome
Cluster 2 Gr59f 2R 59E3-59E3 taste receptor activity
Cluster 2 Vdup1 3L 61B2-61B2 transcription repressor activity
Cluster 2 CG31974 2L 21B3-21B3 transferase activity
Cluster 2 CG33301 2L 31A1-31A1 transferase activity
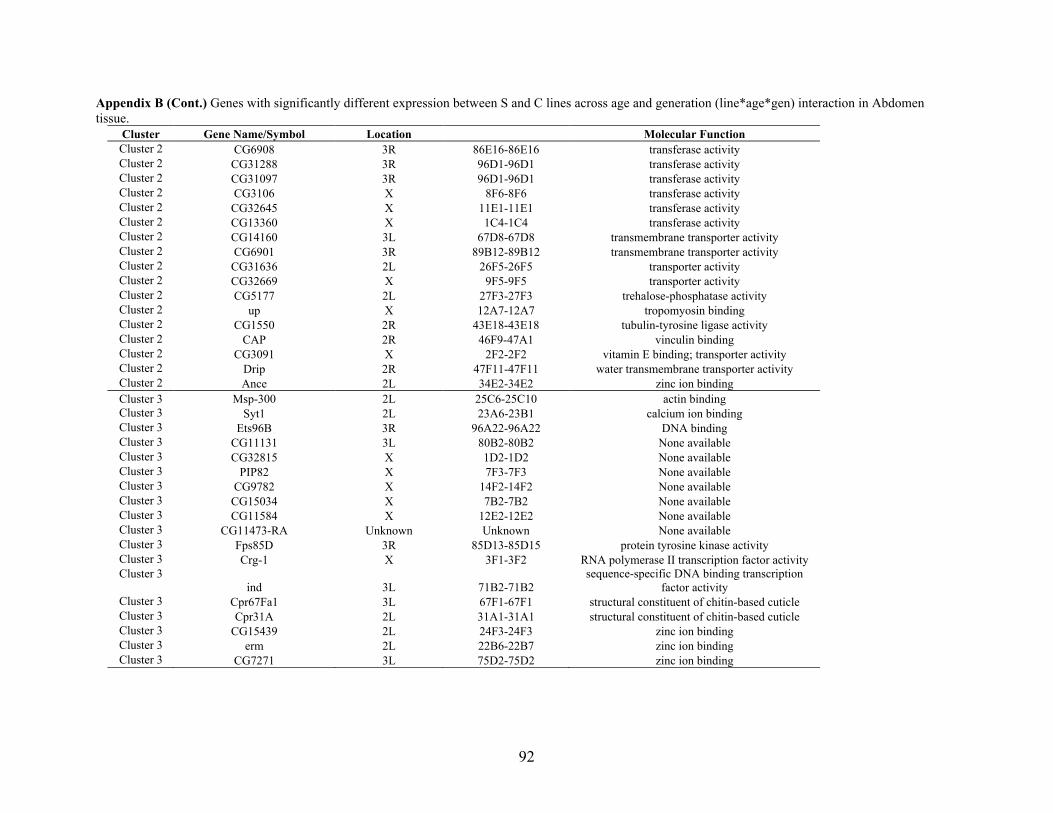
92
Appendix B (Cont.) Genes with significantly different expression between S and C lines across age and generation (line*age*gen) interaction in Abdomen
tissue.
Cluster Gene Name/Symbol Location Molecular Function
Cluster 2 CG6908 3R 86E16-86E16 transferase activity
Cluster 2 CG31288 3R 96D1-96D1 transferase activity
Cluster 2 CG31097 3R 96D1-96D1 transferase activity
Cluster 2 CG3106 X 8F6-8F6 transferase activity
Cluster 2 CG32645 X 11E1-11E1 transferase activity
Cluster 2 CG13360 X 1C4-1C4 transferase activity
Cluster 2 CG14160 3L 67D8-67D8 transmembrane transporter activity
Cluster 2 CG6901 3R 89B12-89B12 transmembrane transporter activity
Cluster 2 CG31636 2L 26F5-26F5 transporter activity
Cluster 2 CG32669 X 9F5-9F5 transporter activity
Cluster 2 CG5177 2L 27F3-27F3 trehalose-phosphatase activity
Cluster 2 up X 12A7-12A7 tropomyosin binding
Cluster 2 CG1550 2R 43E18-43E18 tubulin-tyrosine ligase activity
Cluster 2 CAP 2R 46F9-47A1 vinculin binding
Cluster 2 CG3091 X 2F2-2F2 vitamin E binding; transporter activity
Cluster 2 Drip 2R 47F11-47F11 water transmembrane transporter activity
Cluster 2 Ance 2L 34E2-34E2 zinc ion binding
Cluster 3 Msp-300 2L 25C6-25C10 actin binding
Cluster 3 Syt1 2L 23A6-23B1 calcium ion binding
Cluster 3 Ets96B 3R 96A22-96A22 DNA binding
Cluster 3 CG11131 3L 80B2-80B2 None available
Cluster 3 CG32815 X 1D2-1D2 None available
Cluster 3 PIP82 X 7F3-7F3 None available
Cluster 3 CG9782 X 14F2-14F2 None available
Cluster 3 CG15034 X 7B2-7B2 None available
Cluster 3 CG11584 X 12E2-12E2 None available
Cluster 3 CG11473-RA Unknown Unknown None available
Cluster 3 Fps85D 3R 85D13-85D15 protein tyrosine kinase activity
Cluster 3 Crg-1 X 3F1-3F2 RNA polymerase II transcription factor activity
Cluster 3 ind 3L 71B2-71B2
sequence-specific DNA binding transcription
factor activity
Cluster 3 Cpr67Fa1 3L 67F1-67F1 structural constituent of chitin-based cuticle
Cluster 3 Cpr31A 2L 31A1-31A1 structural constituent of chitin-based cuticle
Cluster 3 CG15439 2L 24F3-24F3 zinc ion binding
Cluster 3 erm 2L 22B6-22B7 zinc ion binding
Cluster 3 CG7271 3L 75D2-75D2 zinc ion binding

93
Appendix B (Cont.) Genes with significantly different expression between S and C lines across age and generation (line*age*gen) interaction in Abdomen
tissue.
Cluster Gene Name/Symbol Location Molecular Function
Cluster 4 kel 2L 36E5-36E6 actin binding
Cluster 4 bif X 10D4-10D5 actin binding
Cluster 4 Ama 3R 84A5-84A5 antigen binding
Cluster 4 CG31961 2L 24D8-24D8 binding
Cluster 4 CG15443 2L 24F3-24F3 binding
Cluster 4 CG5756 2R 55B5-55B5 chitin binding
Cluster 4 CG5611 3R 98A12-98A13 delta5-delta2,4-dienoyl-CoA isomerase activity
Cluster 4 dnk 3R 91E2-91E2 deoxynucleoside kinase activity
Cluster 4 Ada1-1 2L 33B5-33B5 DNA binding
Cluster 4 CG4570 3R 86C7-86C7 DNA binding
Cluster 4 Sry-beta 3R 99D3-99D3 DNA binding
Cluster 4 Ada1-2 2L 33B5-33B5 DNA binding
Cluster 4 CG14232 X 18E1-18E1 fatty-acyl-CoA binding
Cluster 4 CG32412 3L 64F4-64F5 glutaminyl-peptide cyclotransferase activity
Cluster 4 CG1271 3L 63A5-63A5 glycerol kinase activity
Cluster 4 Jheh2 2R 55F8-55F8 juvenile hormone epoxide hydrolase activity
Cluster 4 CG14656 3R 82D5-82D6 ligand-dependent nuclear receptor binding
Cluster 4 Las 3L 77C2-77C3 lipoic acid synthase activity
Cluster 4 CG33156 2R 50B1-50B1 NAD+ kinase activity
Cluster 4 CG4785 2L 21F1-21F1 None available
Cluster 4 CG3862 2L 21E2-21E2 None available
Cluster 4 CG13982 2L 26D1-26D1 None available
Cluster 4 CG5327 2R 55E2-55E2 None available
Cluster 4 CG7686 2R 47C3-47C3 None available
Cluster 4 CG8179; CG34318 2R 52A3-52A4 None available
Cluster 4 CG34219 2R 44F7-44F7 None available
Cluster 4 CG9186 3L 61F6-61F6 None available
Cluster 4 Rcd5 3L 64A4-64A4 None available
Cluster 4 CG5274 3L 77C2-77C2 None available
Cluster 4 CG7852 3L 62A3-62A3 None available
Cluster 4 CG9356 3R 85D15-85D15 None available
Cluster 4 beat-IIa 3R 90A2-90A3 None available
Cluster 4 CG7175 3R 90F7-90F8 None available
Cluster 4 CG8031 3R 87D8-87D8 None available
Cluster 4 CG17003 X 19A4-19A4 None available
Cluster 4 CG32779 X 3F2-3F2 None available

94
Appendix B (Cont.) Genes with significantly different expression between S and C lines across age and generation (line*age*gen) interaction in Abdomen
tissue.
Cluster Gene Name/Symbol Location Molecular Function
Cluster 4 CG4068 X 4D6-4D7 None available
Cluster 4 CG9053 X 13A8-13A8 None available
Cluster 4 CG6506 X 16E1-16E1 None available
Cluster 4 CG13373 X 1B4-1B4 None available
Cluster 4 CG14220 X 18D3-18D3 None available
Cluster 4 CG7206 X 16F6-16F6 None available
Cluster 4 CG33224 X 8C4-8C4 None available
Cluster 4 CG41457-RA Unknown Unknown None available
Cluster 4 Semaphorin-1A Unknown Unknown None available
Cluster 4 dsh X 10B4-10B5 Notch binding
Cluster 4 CG7914 X 18A7-18A7 oxidoreductase activity
Cluster 4 CG9531 2L 26D7-26D7 oxygen-dependent protoporphyrinogen oxidase activity
Cluster 4 CG1236 3R 83C1-83C1 phosphoglycerate dehydrogenase activity
Cluster 4 CG30184 2R 59F1-59F1 phosphotransferase activity
Cluster 4 ial 2L 32B2-32B2 protein serine/threonine kinase activity
Cluster 4 CG17746 3L 63C1-63C1 protein serine/threonine phosphatase activity
Cluster 4 CG7024 X 4C14-4C14 pyruvate dehydrogenase (acetyl-transferring) activity
Cluster 4 Snr1 3R 83A4-83A4 RNA polymerase II transcription factor activity
Cluster 4 D 3L 70D3-70D3 sequence-specific DNA binding transcription factor activity
Cluster 4 Doc1 3L 66F2-66F3 sequence-specific DNA binding transcription factor activity
Cluster 4 CG30286 2R 57E9-57E10 serine-type endopeptidase activity
Cluster 4 CG31200 3R 92F10-92F10 serine-type endopeptidase activity
Cluster 4 CG1295 3L 64A10-64A10 sphingomyelin phosphodiesterase activator activity
Cluster 4 mam 2R 50C23-50D3 transcription coactivator activity
Cluster 4 CG5366 2L 31D10-31D10 transcription factor binding
Cluster 4 jing 2R 42C1-42B2 transcription repressor activity
Cluster 4 CG12714 X 11D11-11E1 transferase activity
Cluster 4 Uch 2L 22D4-22D4 ubiquitin thiolesterase activity
Cluster 4 CG15439 2L 24F3-24F3 zinc ion binding
Cluster 4 CG8003 3L 67E6-67E6 zinc ion binding
Cluster 4 CG31457 3R 94E1-94E1 zinc ion binding

95
Appendix C. Genes with significantly different expression between S and C lines across age and generation (line*age*gen) interaction in Head tissue.
Cluster Gene Name/Symbol Location Molecular Function
Cluster 1 betaggt-II 2L 23C1-23C1 CAAX-protein geranylgeranyltransferase activity
Cluster 1 CG17712 2L 22B2-22B2 oxidoreductase activity
Cluster 1 CG9150 2L 26B4-26B4 oxidoreductase activity
Cluster 1 Tg 2L 28D3-28D3 protein-glutamine gamma-glutamyltransferase activity
Cluster 1 Spn28D 2L 28D3-28D3 serine-type endopeptidase inhibitor activity
Cluster 1 CG13090 2L 29D4-29D4 Mo-molybdopterin cofactor sulfurase activity
Cluster 1 bl 2R 57A6-57A7 mRNA binding
Cluster 1 CG15611 2R 53F10-53F11 Rho guanyl-nucleotide exchange factor activity
Cluster 1 CG9149 3L 61F5-61F5 acetyl-CoA C-acetyltransferase activity
Cluster 1 CG1275 3L 62D4-62D4 electron carrier activity
Cluster 1 Faa 3L 64A5-64A5 fumarylacetoacetase activity
Cluster 1 CG4484 3L 67A3-67A3 sucrose:hydrogen symporter activity
Cluster 1 CG11796 3L 77C3-77C3 4-hydroxyphenylpyruvate dioxygenase activity
Cluster 1 CG1213 3R 83C5-83C5 glucose transmembrane transporter activity
Cluster 1 CG1115 3R 82F6-82F6 None available
Cluster 1 CG1092 3R 82A1-82A1 None available
Cluster 1 CG3940 3R 85F12-85F12 carbonate dehydratase activity
Cluster 1 Spn5 3R 88E3-88E3 serine-type endopeptidase inhibitor activity
Cluster 1 CG2003 3R 100E1-100E1 high affinity inorganic phosphate:sodium symporter activity
Cluster 1 Dsor1 X 8D2-8D3 MAP kinase kinase activity
Cluster 1 CG14215 X 18D13-18D13 None available
Cluster 2 CG17374 3L Unknown fatty acid synthase activity
Cluster 2 net 2L 21B1-21B1 RNA polymerase II transcription factor activity
No cluster Hsp68 3R 95D11-95D11 unfolded protein binding
No cluster CG14545 3R 96F3-96F3 None available

96
Appendix D. Gene expression profiles for genes differentially expressed between S and C lines
with age and generation (line*age*gen) in (A) Abdomen and (B) Head tissue. Clusters
correspond to heat maps displayed on Appendix A.
(A) Abdomen
(B) Head