Embed Size (px)
Citation preview

Louisiana State UniversityLSU Digital Commons
LSU Historical Dissertations and Theses Graduate School
2001
Molding Large Area Plastic Parts Covered WithHARMs.Mircea Stefan DespaLouisiana State University and Agricultural & Mechanical College
Follow this and additional works at: https://digitalcommons.lsu.edu/gradschool_disstheses
This Dissertation is brought to you for free and open access by the Graduate School at LSU Digital Commons. It has been accepted for inclusion inLSU Historical Dissertations and Theses by an authorized administrator of LSU Digital Commons. For more information, please [email protected].
Recommended CitationDespa, Mircea Stefan, "Molding Large Area Plastic Parts Covered With HARMs." (2001). LSU Historical Dissertations and Theses. 277.https://digitalcommons.lsu.edu/gradschool_disstheses/277

INFORMATION TO USERS
This manuscript has been reproduced from the microfilm master. UMI films
the text directly from the original or copy submitted. Thus, some thesis and
dissertation copies are in typewriter face, while others may be from any type of
computer printer.
The quality of this reproduction is dependent upon the quality of the
copy submitted. Broken or indistinct print, colored or poor quality illustrations and photographs, print bfeedthrough, substandard margins, and improper
alignment can adversely affect reproduction.
In the unlikely event that the author did not send UMI a complete manuscript
and there are missing pages, these will be noted. Also, if unauthorized
copyright material had to be removed, a note will indicate the deletion.
Oversize materials (e.g., maps, drawings, charts) are reproduced by
sectioning the original, beginning at the upper left-hand comer and continuing
from left to right in equal sections with small overlaps.
Photographs included in the original manuscript have been reproduced
xerographically in this copy. Higher quality 6” x 9" black and white
photographic prints are available for any photographs or illustrations appearing
in this copy for an additional charge. Contact UMI directly to order.
ProQuest Information and Learning 300 North Zeeb Road, Ann Arbor, Ml 48106-1346 USA
800-521-0600
Reproduced with permission of the copyright owner. Further reproduction prohibited without permission.

Reproduced with permission of the copyright owner. Further reproduction prohibited without permission.
MOLDING LARGE AREA PLASTIC PARTS COVERED WITH HARMS
A Dissertation
Submitted to the Graduate Faculty of Louisiana State University and
Agricultural and Mechanical College In partial fulfillment of the
requirements for the degree of Doctor of Philosophy
in
The Interdepartmental Program in Engineering
byMirceaS. Despa
B.S. in Chemical Engineering, UPB Bucharest, Romania, 1994 M.S. in Chemical Engineering, LSU, May 1998
May 2001
Reproduced with permission of the copyright owner. Further reproduction prohibited without permission.

UMI Number 3016540
UMI*UMI Microform 3016540
Copyright 2001 by Bell & Howell Information and Learning Company. All rights reserved. This microform edition is protected against
unauthorized copying under Title 17, United States Code.
Bell & Howell Information and Learning Company 300 North Zeeb Road
P.O. Box 1346 Ann Arbor, Ml 48106-1346
Reproduced with permission of the copyright owner. Further reproduction prohibited without permission.

To the memory of my mother
ii
Reproduced with permission of the copyright owner. Further reproduction prohibited without permission.

ACKNOWLEDGEMENTSm u
I wish to express my gratitude to Dr. Kevin Kelly for his help and guidance. I
thank him for his advice and for his continuous challenge; I became a better person
through both. Also, I want to thank my wife, Simona, for her advice with statistical
issues, and more important, for her immense support and patience. Paul Rodriguez and
Ron Bouchard were instrumental with their input in the design, manufacture, and imaging
of devices and parts.
iii
Reproduced with permission of the copyright owner. Further reproduction prohibited without permission.
TABLE OF CONTENTS
ACKNOWLEDGEMENTS.......................................................................................... i ii
ABSTRACT.................................................................................................................... v
CHAPTER 1. INTRODUCTION.................................................................................... 1
CHAPTER 2. INJECTION MOLDING......................... ................................................ 62.1 Injection Molding Techniques for Molding Microstructures................................... 622 Injection Molding Equipment................................................................................ 102.3 Injection Molding Experiments.............................................................................. 162.4 Results and Discussion.......................................................................................... 222.5 Examples of Injection Molding Results.................................................................272.6 Repeatability Reproducibility Study for LIGA Micromolding...............................372.7 Conclusions Injection Molding..............................................................................49
CHAPTER 3. HOT EMBOSSING................................................................................523.1 Survey of Embossing Techniques.......................................................................... 523.2 Theoretical Considerations.....................................................................................533.3 Hot Embossing Equipment.....................................................................................583.4 Hot Embossing Experiments.................................................................................. 633.5 Conclusions Hot Embossing..................................................................................75
CHAPTER 4. COMPARATIVE STUDY HOT EMBOSSING VS. INJECTIONMOLDING.................................................................................................................... 774.1 Design of Experiments........................................................................................ 774 2 Mold Insert Making................................................................................................804.3 Molding Experiments.............................................................................................824.4 Conclusions on Comparison between Injection Molding and Hot Embossing 90
CHAPTER 5. FINAL CONCLUSIONS AND RECOMMENDATIONS.....................92
REFERENCES............................................................................................................. 97
VITA............................................................................................................................100
iv
Reproduced with permission of the copyright owner. Further reproduction prohibited without permission.

ABSTRACT
Injection molding and hot embossing proved to be suitable for use to reproduce
layouts of micropatterns manufactured by LIGA. The research work was based on two
commercially available machines. Preliminary experiments with both machines indicated
that several modifications and additions were necessary to adapt the injection machine
and the embossing press for microreplication. For the injection machine, a mold
geometry was designed to ensure minimal pressure loss upstream from the entrance into
the mold cavity,.and optimal shape for molding and demolding. For the hot embossing
press, a vacuum chamber was designed containing the embossing sandwich, with the
temperatures of the mold insert and of the substrate controlled through the press’
heating/cooling system.
Experiments were performed to identify the important process parameters in
injection molding of HARMs. It was established that mold insert temperature is of
primary importance for the process, followed by melt flow rate. In hot embossing, it was
argued that temperature of the polymer has most evident effects on the process, followed
by variations in embossing force and embossing time. It was shown that the embossing
time should preferably be long, to allow for relaxation of the macromolecular chains
resulting in stress-free moldings.
Compared to HDPE, it was shown that PMMA is heat-sensitive, and that it
requires special care including drying before dosage, and dosage under controlled
temperature and shear conditions. When used in hot embossing, PMMA is advantageous
compared with polycarbonate- PC, because it allows embossing at lower temperatures.
v
Reproduced with permission of the copyright owner. Further reproduction prohibited without permission.

Three micro heat exchanger geometries were molded (and fabricated for testing),
one stacked pattern and two cross flow patterns. Also, several DNA sequencing chips
were microreplicated, using both injection molding and hot embossing. Also, a test
pattern was designed for comparison between molding techniques. Molding was
performed into two inserts of different heights (200 and 500 microns) using the same
material (PMMA). An overall mean value of 1.25 % was reported for shrinkage of the
plastic compared to the mold insert Qualitative interpretation of the molding results
showed differences in the demolding success rate between the two molding techniques
combined with the two mold insert heights
vi
Reproduced with permission of the copyright owner. Further reproduction prohibited without permission.

CHAPTER 1. INTRODUCTION
The LIGA process involves three processing steps: X-ray Lithography,
Galvanoformung (electroplating) and Abformung (molding) [1]. The LIGA process, as
used at LSU, is based on bonding a sheet of poly(methyl-methacrylate) (PMMA) resist
to an electrically conductive metal substrate, as shown in Figure 1.1. The resulting
PMMA/metal substrate laminate is positioned behind an X-ray mask containing a
pattern to be reproduced, and exposed to collimated radiation emitted from a
synchrotron storage ring. During exposure, the molecular weight of the PMMA
decreases in the irradiated areas due to bond breaking in the macromolecular chain.
After the PMMA sheet is exposed, it is immersed in a developer and the irradiated areas
are completely removed.
The resulting PMMA template is used to electroplate microstructures onto the
substrate. After the electroplating process is completed, the remaining PMMA is
stripped, resulting in a metal substrate covered with microstructures. The
microstructure-covered substrate can represent the final product. Alternatively, it may
PMMA
Nickel Substrate
L U
HARMs
figure 1.1 Schematic of LIGA
Reproduced with permission of the copyright owner. Further reproduction prohibited without permission.
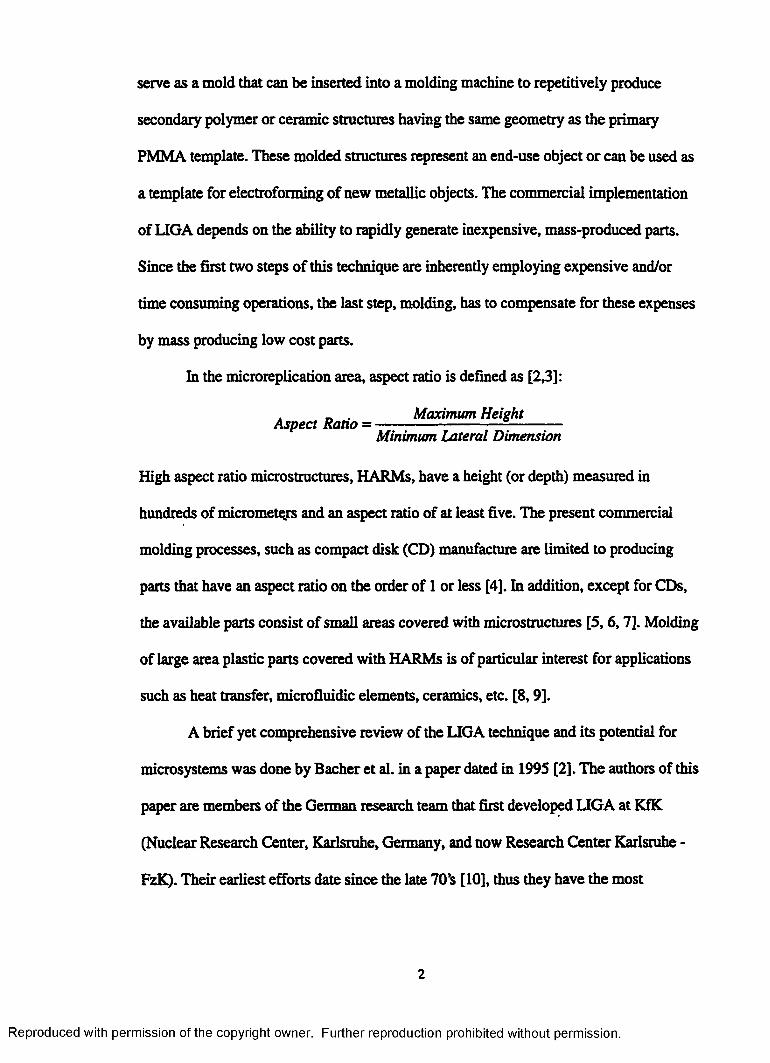
serve as a mold that can be inserted into a molding machine to repetitively produce
secondary polymer or ceramic structures having the same geometry as the primary
PMMA template. These molded structures represent an end-use object or can be used as
a template for electroforming of new metallic objects. The commercial implementation
of LIGA depends on the ability to rapidly generate inexpensive, mass-produced parts.
Since the first two steps of this technique are inherently employing expensive and/or
time consuming operations, the last step, molding, has to compensate for these expenses
by mass producing low cost parts.
In the microreplication area, aspect ratio is defined as [2,3]:
_ . Maximum, HeightAspect Ratio = -----------------------------------Minimum Lateral Dimension
High aspect ratio microstructures, HARMs, have a height (or depth) measured in
hundreds of micrometers and an aspect ratio of at least five. The present commercial
molding processes, such as compact disk (CD) manufacture are limited to producing
parts that have an aspect ratio on the order of 1 or less [4]. In addition, except for CDs,
the available parts consist of small areas covered with microstructures [5,6,7]. Molding
of large area plastic parts covered with HARMs is of particular interest for applications
such as heat transfer, microfluidic elements, ceramics, etc. [8,9].
A brief yet comprehensive review of the LIGA technique and its potential for
microsystems was done by Bacher et al. in a paper dated in 1993 [2]. The authors of this
paper are members of the German research team that first developed LIGA at KfK
(Nuclear Research Center, Karlsruhe, Germany, and now Research Center Karlsruhe -
FzK). Their earliest efforts date since the late 70’s [10], thus they have the most
2
Reproduced with permission of the copyright owner. Further reproduction prohibited without permission.
significant experience in the field. In this paper, Bacher and his coworkers present all
the aspects of LIGA, including the modifications and extensions added to the technique.
Madou’s review of LIGA [10] is also a comprehensive study. However, he bases
his text on the experimental work and on the results of the same aforementioned
German team, especially when presenting the molding step (also referred to as
micromolding). Madou also briefly mentions the early efforts initiated at LSU in the
field of molding, efforts that represent the beginning of the work hereby presented.
From his knowledge, these are the first attempts to systematically approach the field of
molding of LIGA microstructures in the United States. Harmening et al. [11] and
Ruprecht et al. [1,12] also part of the German team, give a condensed description of the
molding techniques used in LIGA, briefly mentioning the principles of operation.
Referring to the work of the German research team at KfK, the representation in
Figure 1.2 is an excerpt from Bacher’s et al. paper showing a schematic classification of
the molding methods used in LIGA. Gassical molding methods were used, in principle,
but several, sometimes severe, adaptations were made to fit the specific requirements
presented by micromolding. The classical methods employed were reaction injection
molding (RIM, figure 1.2 a), thermoplastic injection molding (figure 1.2 b) and
compression molding (figure 1.2 c) also known as hot embossing. Independent of which
method is used for molding, the final purpose is to produce a part that reproduces the
geometrical shape and dimensions of the micropattem on the metallic mold insert hi
order to achieve that the material for molding has to completely fill up the microvoids
on the insert it then has to solidify sufficiently for separation (demolding), and it has to
preserve its original geometrical definition over the period of usage.
3
Reproduced with permission of the copyright owner. Further reproduction prohibited without permission.

(a)screw
(b)
I f1 J;S hs s s
(C)
Mold Insert
Mold Insert
ThermoplasticPolymer
Figure 1.2 Classification of LIGA Molding Techniques: a- RIM, b- Injection Molding, c- Hot Embossing [2]
These requirements are also applicable in the case of larger molded parts, but they
become much more significant in the case of micromolding, since micromolding is
performed on a small size scale on the order of micrometers. At this scale, the
penetration into the narrow gaps is more difficult and the flow and thermal issues
become more stringent For instance, a high viscosity of the plastic melt or solution will
make the filling step more difficult Also, demolding can become a problem if the
forces required to separate the plastic part from the metallic insert are on the same order
as the structural strength of the microstructures.
4
Reproduced with permission of the copyright owner. Further reproduction prohibited without permission.
Ehrfeld et al. [6] compiled a list of materials used in the LIGA process. A wide
variety of thermoplastic polymers have been tried and applied for molding of LIGA
microstructures, including polyoxymethylene, polystyrene, PMMA, polycarbonates,
polyamides, and polyvinylidenefluoride. These polymers are suitable for specific
applications, and the list of materials will continue to expand as new applications
requiring new types of polymers are developed. The morphological structure of a
certain polymer, its degree of crystallinity, the intermediate changes the polymer
undergoes when changing phases, are all expected to affect the behavior of the polymer
throughout the molding process and during the period of usage of the final product.
5
Reproduced with permission of the copyright owner. Further reproduction prohibited without permission.
CHAPTER 2. INJECTION MOLDING
2.1 Iqjection Molding Techniques for Molding M icrostructures
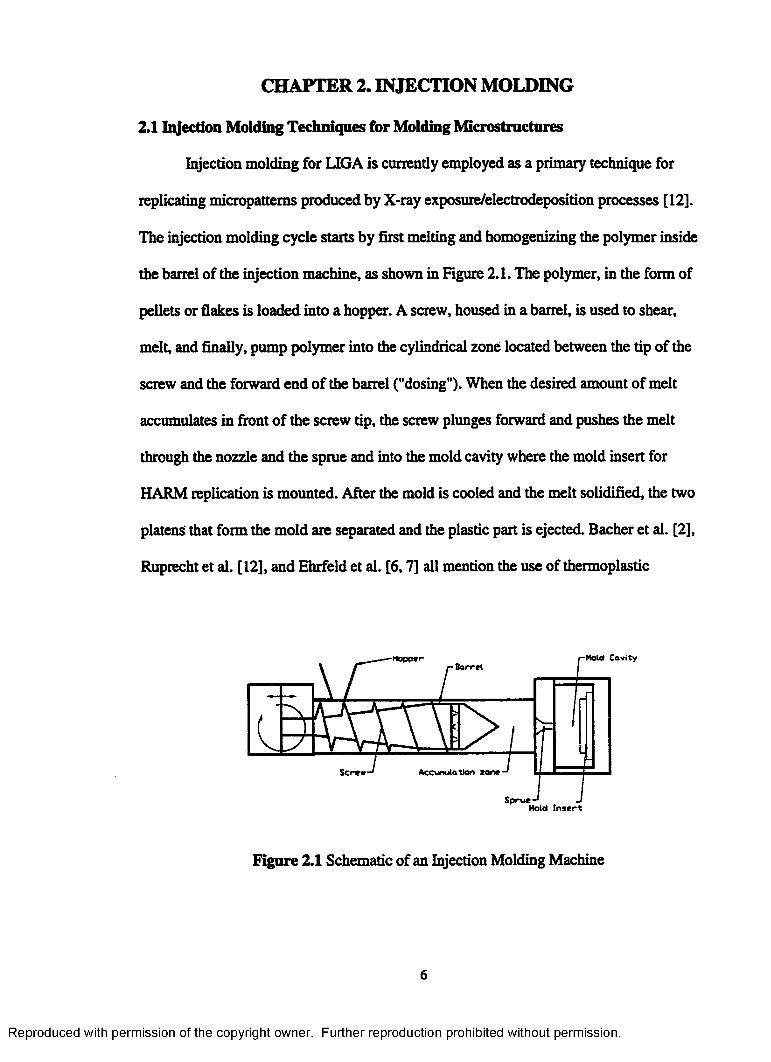
Injection molding for LIGA is currently employed as a primary technique for
replicating micropattems produced by X-ray exposure/electrodeposition processes [12].
The injection molding cycle starts by first melting and homogenizing the polymer inside
the barrel of the injection machine, as shown in Figure 2.1. The polymer, in the form of
pellets or flakes is loaded into a hopper. A screw, housed in a barrel, is used to shear,
melt, and finally, pump polymer into the cylindrical zone located between the tip of the
screw and the forward end of the barrel ("dosing"). When the desired amount of melt
accumulates in front of the screw tip, the screw plunges forward and pushes the melt
through the nozzle and the sprue and into the mold cavity where the mold insert for
HARM replication is mounted. After the mold is cooled and the melt solidified, the two
platens that form the mold are separated and the plastic part is ejected. Bacher et al. [2],
Ruprecht et al. [12], and Ehrfeld et al. [6,7] all mention the use of thermoplastic
-Mold CavityHopperBarrel
Mold In s e r t
Figure 2.1 Schematic of an Injection Molding Machine
6
Reproduced with permission of the copyright owner. Further reproduction prohibited without permission.
injection molding as one of the techniques for replicating LIGA microstructures. They
mention the injection molding of compact disks (CD) as a method for molding
microstructures. However, they also mention that the pits imprinted on the CD’s surface
have an aspect ratio of about one, which makes the technique unsuitable for direct
application for molding HARMs. Ruprecht indicates, without going into any details,
that a conventional injection molding machine as those used for CD fabrication can be
used for molding of microstructures. The machine needs to be "expanded with special
devices allowing the evacuation and temperature control of the tool for the complete
filling of the mold"[12]. When describing this technique, the authors limit themselves to
listing the main factors influencing the process, without showing actual values for any
experimental parameters. The list of important parameters includes the tool temperature
and the temperature of the melt, both of which have to be higher than in the
conventional injection molding to prevent incomplete filling [7,12]. They also indicate
that "too high injection pressures or injection speeds lead to damages of the mold insert
in an extreme case" [7]. Evacuation of the mold cavity is also mentioned as a critical
factor for a successful injection [12].
2.1.1 Related ejection molding applications
The small nature of the LIGA mold inserts makes the molding step more
challenging than the classical injection molding processes. However, some industrial
applications of injection molding of macroscopic objects can be compared to injection
molding of HARMs, because similar fundamental flow and heat transfer principles
govern the process both at macro and at micro scale. For instance, molding of thin wall
parts also involves filling of mold patterns having high aspect ratios. As the thickness of
7
Reproduced with permission of the copyright owner. Further reproduction prohibited without permission.

the wall is decreased, incomplete filling (short shot) can become a problem due to
premature solidification of the melt. Typical applications of thin wall parts include
cellular phone components, laptop and notebook computer components, disposable
containers and cups, medical equipment components, etc [4]. Fasset [4] indicates that
increasing the injection speed coupled with using a smaller injection machine leads to a
more efficient and safe production of such thin wall molded parts, hi order to achieve
complete filling of a high aspect ratio mold, the polymer melt has to be as fluid as
possible, therefore its viscosity must be kept minimal. To decrease the viscosity, the
polymer melt is heated to higher temperatures, thus increasing the potential for thermal
degradation. Using increased injection speeds rather than elevated temperatures results
in a decrease of the degree of degradation of the polymer. This is due to the shear
thinning character of the polymer that leads to a lower viscosity without thermal
degradation of the polymer. Fasset reports that an increase of the injection speed from
10 cm/sec to 36 cm/sec led to a decrease by a factor of about 3.3 in polymer degradation
as measured by percent decrease in melt viscosity. Also beneficial was the selection of
an injection machine with a smaller barrel, because a shorter residence time was
imposed to the polymer melt, thus less time for the thermal degradation to occur. The
melt viscosity of the degraded polymer decreased 300% as compared to that of a
polymer that was used in a barrel four times smaller.
Breuer takes the comparison between CD manufacture and microinjection
molding one step further and shows that producing free standing miniature parts is more
challenging than molding CD storage media because the overall size of a CD is much
larger than that of a LIGA part [13]. hi the case of micromolding individual parts, the
8
Reproduced with permission of the copyright owner. Further reproduction prohibited without permission.
runner system dwarfs the actual microparts, leading to a complicated design and an
uneconomical production. He proposes a few modifications of the classical plasticizing
unit such as eliminating or reducing the runner system, or the introduction of open hot-
runner systems such that the molded part can be reached without a runner. Moreover,
he suggests that given the very small shot weight (on the order of a few grams or less) a
reciprocating plasticizing screw is not suitable anymore. A reduction of the plasticizing
unit cannot be done past a certain limit dimension of the screw diameter because of the
increased probability of a break and because the positive plasticizing characteristics are
reduced with a low screw stroke. Breuer presents an alternative to using a machine with
reciprocating screw plastication by using an injection unit where the melt is prepared
into a separate plastication unit, and then sent into an injection unit used to fill the mold.
Such a machine is now commercially available, being produced by Battenfeld
Kunstatoffmachinen [14]. The machine offers the advantage of a more accurate control
of the shot size and a more efficient usage of the material to be injected (a ratio of 60/40
part/sprue+runners as opposed to 34/66 for older systems). Cycle times are also reduced
by minimizing cooling time and handling time.
Summarizing the information with respect to thermoplastic injection molding, it
can be concluded that the most important process parameters are melt and mold
temperatures, coupled with the injection pressure/ injection speed. The experience
gathered from related molding processes indicates that selection of the injection
machine, combined with a proper design of the mold (runner-gate system and cavity)
and evacuation of the mold prior to injection are essential for a successful injection
molding of HARMs, as those produced by LIGA.
9
Reproduced with permission of the copyright owner. Further reproduction prohibited without permission.

23 Injection Molding Equipment
The |iSET group at LSU is currently developing injection molding methods for
producing large area plastic parts covered with HARMs. The work has been centered on
using a standard injection molding machine for a nonstandard application such as
micromolding. Immediately, one should notice that the equipment costs are much lower
if a standard, commercially available molding machine is used for micromolding
instead of a complicated, non-standard application-specific machine. The injection
machine, type Arburg Allrounder® 170 CMD 150-45 [15], is designed with a
reciprocating screw that both melts and injects the polymer into the mold cavity. The
reciprocating screw is capable of two types of motion: it can rotate around the
longitudinal axis of the barrel and it can translate along the same axis. Inside the barrel,
the material is melted by thermal input from the electrical heating jackets (bands) and
by the shearing action of the rotating screw. As stated above, the work done throughout
this study was based on using a commercially available, general-purpose injection
molding machine. Thus, given the differences between a classical injection molding
process and the more special process of micromolding, a few adaptations had to be
made to the equipment, none of which was cost-intensive.
First, a new mold, composed of two halves, was designed to hold the micro
mold insert The two mold halves were designed such that when closed together they
form a cavity inside which the insert is placed and where the plastic melt is injected to
fill the micro-pattem onto the insert. The mold design was based on what was expected
to be specific requirements related to pushing the plastic melt into the high aspect ratio
microstructures. Because a high pressure drop was expected to occur within the
10
Reproduced with permission of the copyright owner. Further reproduction prohibited without permission.
microgaps on the mold insert, a runner/gate system was completely eliminated from the
mold design. This allowed for a direct access of the melt with minimal pressure loss
upstream from the mold cavity. The design resulted in a single cavity mold; given the
experimental nature of this work, together with the small capacity of the injection
machine, the purpose was not to design a multi-nested mold but one that could hold a
single mold insert. Knowing that complete filling of the microvoids will be influenced
by the temperature of the insert, the design included a heating/cooling system. The
system was mounted onto the mold platen holding the mold insert The heating system
consists of four heating cartridges (rods) mounted in channels running vertically into the
mold platen. Heating the mold is controlled from a temperature controller mounted on
the control panel of the injection machine and coupled with a thermocouple that senses
the mold platen temperature. The cooling system consists of three channels interplaced
between the heating elements. The heating/cooling channels were uniformly distributed
to cover the mold insert area of the mold cavity. The channels were drilled such that a
better uniformity of the temperature can be achieved.
Aluminum was used as the material for the mold platens because it provides
several advantages over the more classical solution using stainless steel. First,
aluminum is strong enough to resist the relatively small loads imposed by the clamping
system to the mold, given the relative small shot size. Also, aluminum has the
advantage of being easier to machine. Second, aluminum offers the advantage of a
lower thermal inertia than stainless steel. This is advantageous because the mold has to
be heated at the beginning of the cycle in order to prevent premature freezing of the
melt; it then has to be cooled down to the demolding temperature for the part to be
11
Reproduced with permission of the copyright owner. Further reproduction prohibited without permission.
ejected, and the low thermal inertia of aluminum shortens the portion of cycle time
dedicated to heating/cooling the mold.
Another requirement for micromolding, in addition to controlling the barrel
temperature, the injection rate, and the mold temperature, is to vent the micromold prior
to injection [12]. At macroscale, air entrapment inside molds is usually avoided by
venting the air through very fine slits. These slits are machined on the interior surfaces
of the two mold platens, in the parting line, and the air is expelled as the melt fills the
mold. In other cases, the clearance gaps around the ejector pins provide sufficient
volume to vent the mold, without the need for venting slits. In micromolding, a
complicated fluid front may lead to air entrapment if air is present inside the mold prior
to injection, i.e. if the mold cavity is not under vacuum before injection begins. Thus,
the injection machine has to be fitted with a vacuum system for venting the mold prior
to injection. A rotary vane vacuum pump was connected to the mold through a vacuum
port machined into the stationary mold plate. To prevent plastic melt from being sucked
into the vacuum line upon injection, the vacuum port is interfaced with the mold cavity
through a pill of sintered metal (stainless steel). The pill is held in place with a hex cap
screw whose core was drilled out along its longitudinal axis. A schematic drawing of
the setup is shown in figure 2.2.
Additional equipment was necessary for the heating/cooling system and for the
vacuum system. Thus, a general-purpose water pump was connected with the cooling
channels and a 25-gallon water tank was built to economically fit inside the space
available in the injection machine’s chassis. The water flow could be controlled with a
ball valve, and the temperature could be lowered by adding ice to the water.
12
Reproduced with permission of the copyright owner. Further reproduction prohibited without permission.
figure 2.2 Schematic Drawing of Vacuum Pott
The vacuum was achieved using a laboratory size pump capable of evacuating
the mold cavity down to SO mmHg in less than 1 second. A photograph of the mold
halves is shown in the next sub-chapter, together with mold design solutions chosen to
fit the specific requirements of the injection molding material.
2^.1 Characterization of Molding Materials
• Differential Scanning Calorimetry (DSC)
DSC was used to determine the softening region for the thermoplastic polymer used in
our molding experiments, namely high density polyethylene, HDPE. This calorimetric
technique, described in detail elsewhere [16] is based on the fact that a transition such
as crystallization or vitrification is associated with a change in thermal properties of the
sample under study. This change can be identified when comparing the sample with a
reference. By monitoring the temperature difference between the sample and the
reference, or by measuring the energy input necessary to maintain both the sample and
the reference at the same temperature, one can determine the location where the
transition occurs and also the type and magnitude of this transition. DSC analysis
13
Reproduced with permission of the copyright owner. Further reproduction prohibited without permission.
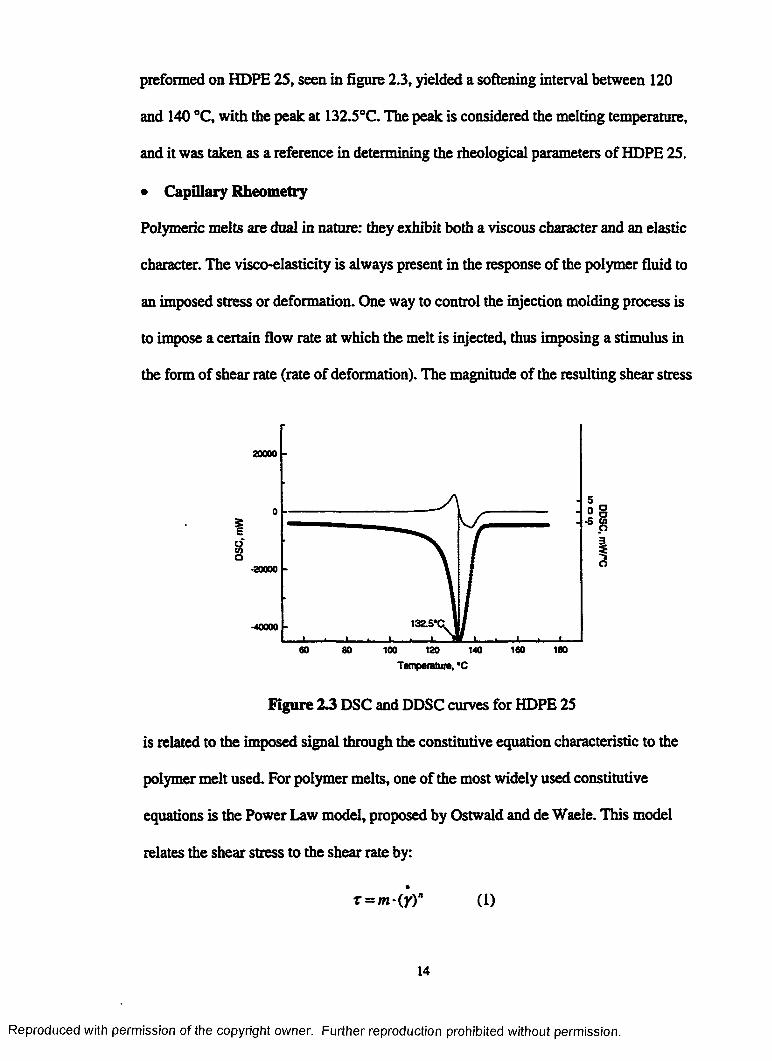
preformed on HDPE 25, seen in figure 2.3, yielded a softening interval between 120
and 140 °C, with the peak at 132.5°C. The peak is considered the melting temperature,
and it was taken as a reference in determining the rheological parameters of HDPE 25.
• Capillary Rheometry
Polymeric melts are dual in nature: they exhibit both a viscous character and an elastic
character. The visco-elasticity is always present in the response of the polymer fluid to
an imposed stress or deformation. One way to control the injection molding process is
to impose a certain flow rate at which the melt is injected, thus imposing a stimulus in
the form of shear rate (rate of deformation). The magnitude of the resulting shear stress
20000
•20000
-40000
160 18060 80 100 120 140
Temperature, *C
Figure 2 3 DSC and DDSC curves for HDPE 25
is related to the imposed signal through the constitutive equation characteristic to the
polymer melt used. For polymer melts, one of the most widely used constitutive
equations is the Power Law model, proposed by Ostwald and de Waele. This model
relates the shear stress to the shear rate by:
T = m-(y)" (1)
14
Reproduced with permission of the copyright owner. Further reproduction prohibited without permission.
where x (Pa) is the shear stress, y(sec'1) is the shear rate, m (Pa s“) is the consistency
and n (dimensionless) is the flow index. For n = 1 the Ostwald de Waele model reduces
to Newton’s law of viscosity with m being the viscosity. If an apparent viscosity is
defined as the local value corresponding to a Newtonian behavior
T = Tla - y (2)
then the Power Law equation can be written as:
TJa=m-(rr' O)
It is important to note that the consistency m is strongly dependent on temperature,
following an Aarhenius-type relationship:
m = m0exp[-a(r -T 0)] (4)
The determination of the pre-exponential factor mo and of the exponent a can be
done using capillary rheometry. The technique, involving the forced flow of a polymer
melt through a capillary die is described in detail elsewhere [16]. For the molding
material of choice, DOW high density polyethylene with Melt Index 25, the
determination of the Ostwald deWaele parameters was performed at three different
temperatures (190,210, and 230 °Q , corresponding to the processing temperatures
inside the injection molding machine. The results of these determinations are
summarized in Figure 2.4. The plot shows an exponential decay of the apparent
viscosity as a function of shear rate. From the fitting parameters of the data plotted in
figure 2.4, it can be noted that the value of consistency m (pre-exponential factor) varies
with temperature, while the value of the flow index n (exponent) can be considered
constant over the temperature range.
15
Reproduced with permission of the copyright owner. Further reproduction prohibited without permission.

♦ 190 °C5*200
■ 210 °C
230 °C> 160
a. 120
y = 1035.9x‘aj“ 8 R2 = 0.9964
y = 763.28x'aZ8S1 R*=0.9902
y=608.56x<12®0* R2 = 0.9954
100 300 500 700Shear rate, s’1
900
Figure 2.4 Apparent Viscosity vs. Shear rate at 190 °C, 210 °C, and 230 °C
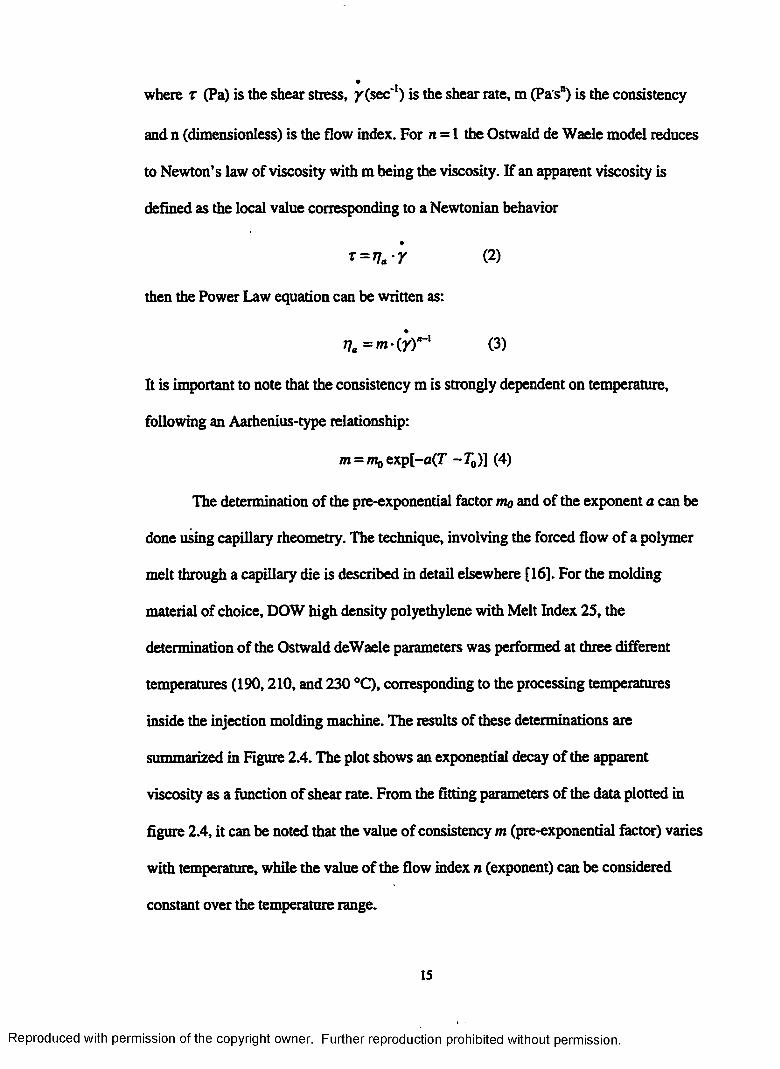
The temperature dependency of m is shown in the plot in Figure 2.5. The data plotted in
this figure represents the values of m at three different temperatures, as determined by
curve-fitting the data in figure 2.4. The Aarhenius-type fit in figure 2.5 yields:
m = 2196.3 • exp[-0.0133(r—70)] (5)
where To is the melting temperature of the polyethylene used in the injection molding
experiments. The determination of the value of To by DSC was shown previously. The
thermal analysis determined the To value of 132.5°C.
2 3 Injection Molding Experiments
The experimental work has been oriented in two main directions: first,
experiments were performed to investigate the influence of injection speed and mold
temperature as two main parameters for the process. Second, the replication of various
mold inserts was done using mold inserts with aspect ratios as high as 11:1, and
m in im u m lateral dimension as small as 2 0 fim.
16
Reproduced with permission of the copyright owner. Further reproduction prohibited without permission.
1100
1000
£E 800ae2
oo
♦ Consistency, m
m = 2196.3e'a0133<T'VR2 = 0.9927
Figure 2.5 Preexponential Factor and Exponent from m vs. T-To
Regarding the first research goal, six series of plastic injection experiments were
performed using the laboratory-scale injection molding machine Arburg Allrounder 170
CMD 150-45. Throughout the experiments, the temperature field across the barrel was
kept identical. In the first series of experiments, the temperature of the mold cavity at
the beginning of the injection cycle was equal to room temperature, while the injection
speed, expressed as melt flow rate, was varied from 10 to 80 cm3/s. In the five
subsequent series, the mold temperature was set at 60 °C, 80 °C, 100 °C, 120 °C, and
140 °C while the injection speed was varied as in the first series. The demolding
temperature was set at 50 °C. The evolution of the temperature of the mold during the
cycle time was continuously monitored with a thermocouple mounted in the movable
platen.
17
Reproduced with permission of the copyright owner. Further reproduction prohibited without permission.
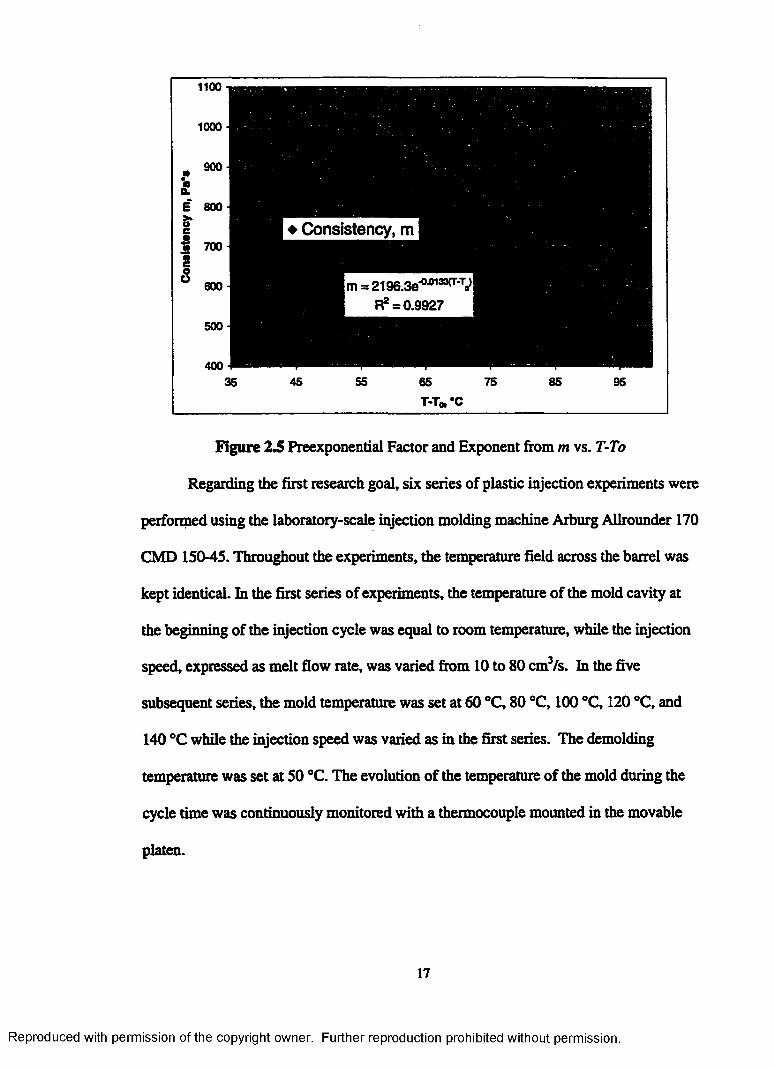
The mold insert is shown in Figure 2.6. The posts are made of nickel with
square cross-section, 180 Jim xl80 pm, and are approximately 750 pm high. The gap
between two adjacent posts is 90 pm. The results of the six series of experiments are
Figure 2.6 Insert Used for Molding: posts are 180x180 pm, 600 pm tall
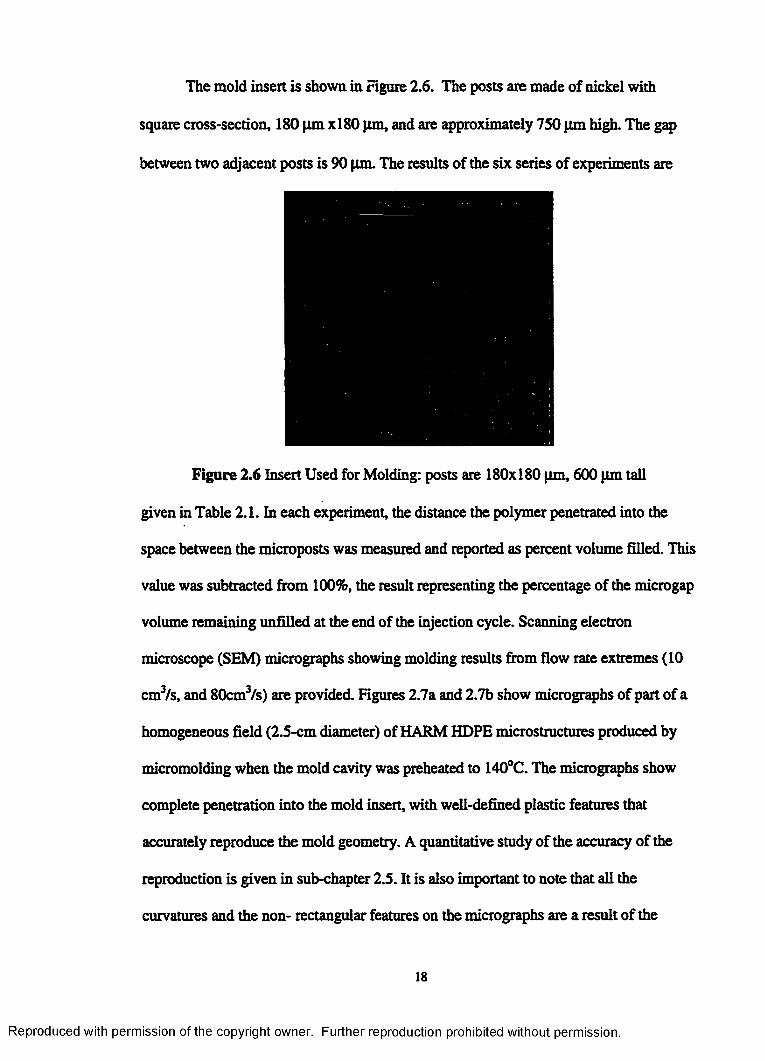
given in Table 2.1. In each experiment, the distance the polymer penetrated into the
space between the microposts was measured and reported as percent volume filled. This
value was subtracted from 100%, the result representing the percentage of the microgap
volume remaining unfilled at the end of the injection cycle. Scanning electron
microscope (SEM) micrographs showing molding results from flow rate extremes (10
cm3/s, and 80cm3/s) are provided. Figures 2.7a and 2.7b show micrographs of part of a
homogeneous field (2.5-cm diameter) of HARM HDPE microstructures produced by
micromolding when the mold cavity was preheated to 140°C. The micrographs show
complete penetration into the mold insert, with well-defined plastic features that
accurately reproduce the mold geometry. A quantitative study of the accuracy of the
reproduction is given in sub-chapter 2.5. It is also important to note that all the
curvatures and the non- rectangular features on the micrographs are a result of the
18
Reproduced with permission of the copyright owner. Further reproduction prohibited without permission.
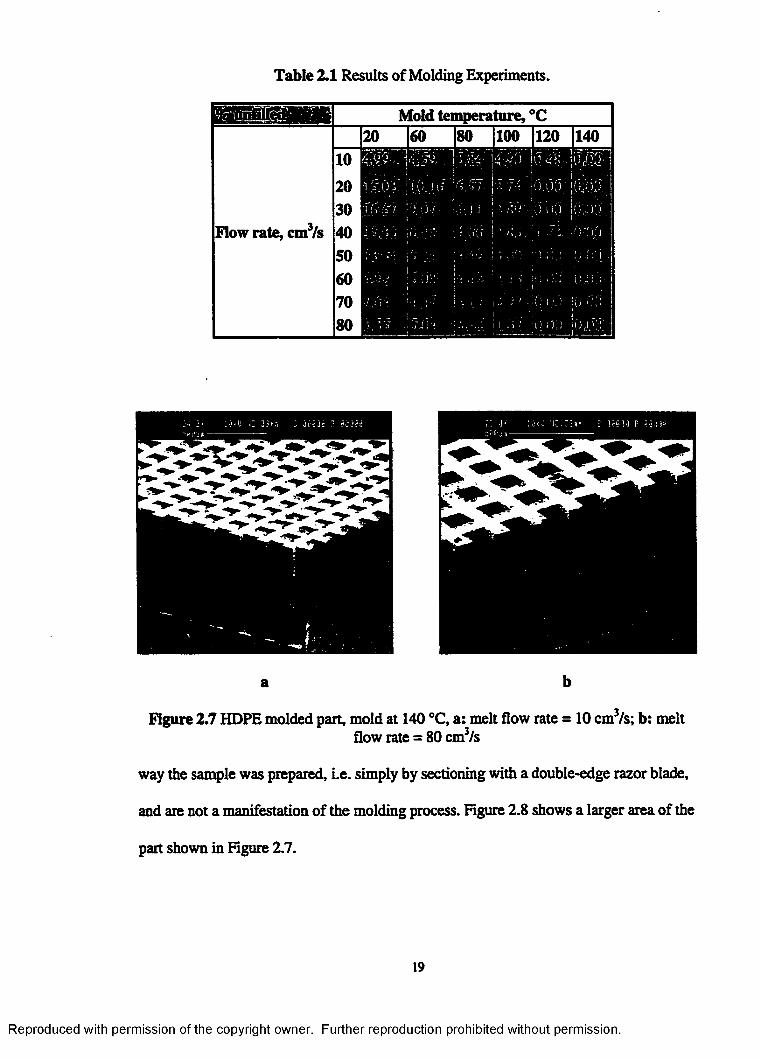
Table 2.1 Results of Molding Experiments.
Mold temperature, °C20 |60 [80 |100 |12Q |140 |
102030
Flow rate, cm3/s 4050607080
a b
Figure 2.7 HDPE molded part, mold at 140 °C, a: melt flow rate = 10 cm3/s; b: meltflow rate = 80 cm3/s
way the sample was prepared, i.e. simply by sectioning with a double-edge razor blade,
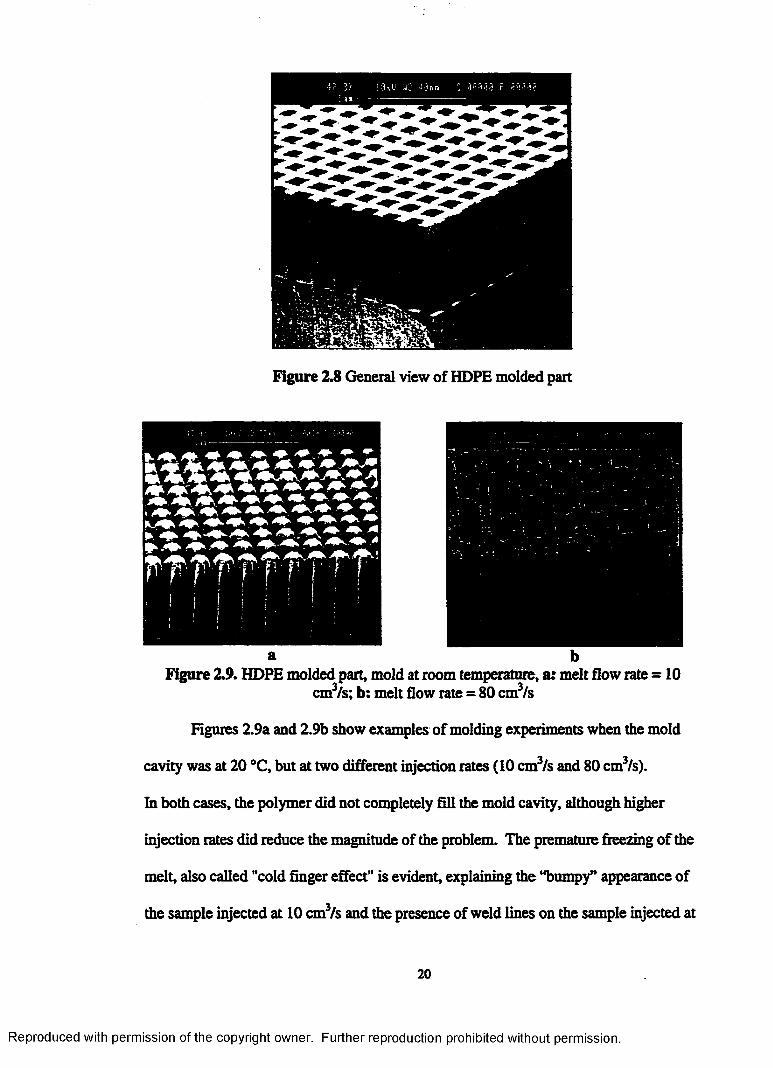
and are not a manifestation of the molding process. Figure 2.8 shows a larger area of the
part shown in Figure 2.7.
Reproduced with permission of the copyright owner. Further reproduction prohibited without permission.
2 Iy ; •}^U 4 j - 3 in ‘I 3999-3 P 3 2 0 3 9 : ■*» --------------
Figure 2.8 General view of HDPE molded part
a bFigure 2.9. HDPE molded part, mold at room temperature, a : melt flow rate = 10
cm3/s; b: melt flow rate = 80 cm3/s
Figures 2.9a and 2.9b show examples of molding experiments when the mold
cavity was at 20 °C, but at two different injection rates (10 cm3/s and 80 cm3/s).
Fa both cases, the polymer did not completely Ell the mold cavity, although higher
injection rates did reduce the magnitude of the problem. The premature freezing of the
melt, also called "cold finger effect" is evident, explaining the “bumpy” appearance of
the sample injected at 10 cm3/s and the presence of weld lines on the sample injected at
20
Reproduced with permission of the copyright owner. Further reproduction prohibited without permission.
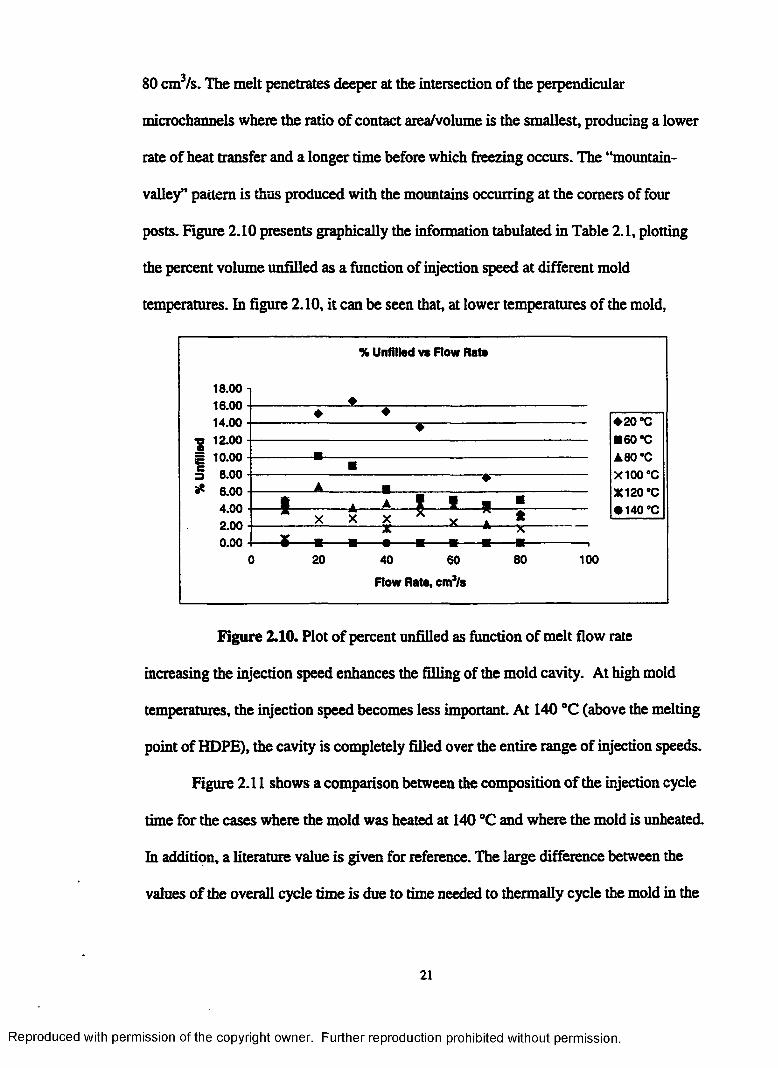
80 cm3/s. The melt penetrates deeper at the intersection of the perpendicular
microchannels where the ratio of contact area/volume is the smallest, producing a lower
rate of heat transfer and a longer time before which freezing occurs. The “mountain-
valley” pattern is thus produced with the mountains occurring at the comers of four
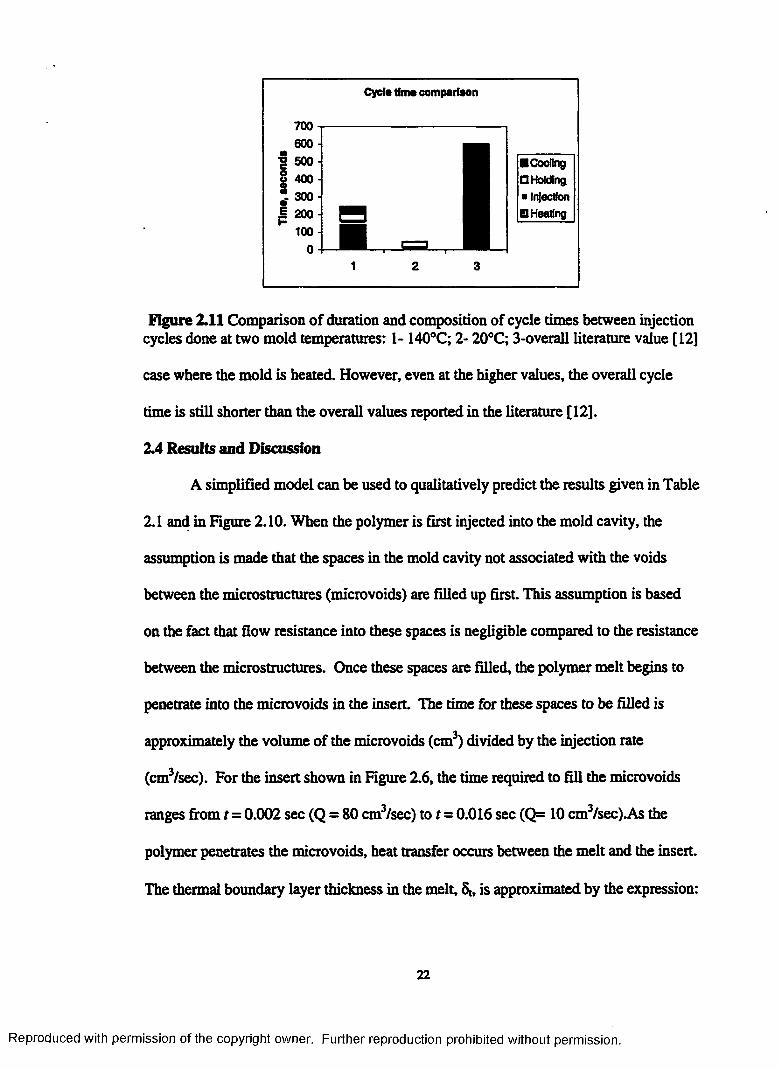
posts. Figure 2.10 presents graphically the information tabulated in Table 2.1, plotting
the percent volume unfilled as a function of injection speed at different mold
temperatures. In figure 2.10, it can be seen that, at lower temperatures of the mold,
18.00 i1R on .
% Unfilled vs Row Rate
♦
14 no . ♦ ♦♦ 2 0 °C ■ 60 °C A 80°C X100*C X120 *C • 140 *C
wm 19 HO •♦
£ a no . ■
a no ■ A * ...a no . f t * A I ! ■ ■
~ X X X A V ? *2.00 A AA .
■ - - X .......... . ' A ■■ X
<) 20 40 60 80 100
Row Rate, cma/s
figure 2.10. Plot of percent unfilled as function of melt flow rate
increasing the injection speed enhances the filling of the mold cavity. At high mold
temperatures, the injection speed becomes less important. At 140 °C (above the melting
point of HDPE), the cavity is completely filled over the entire range of injection speeds.
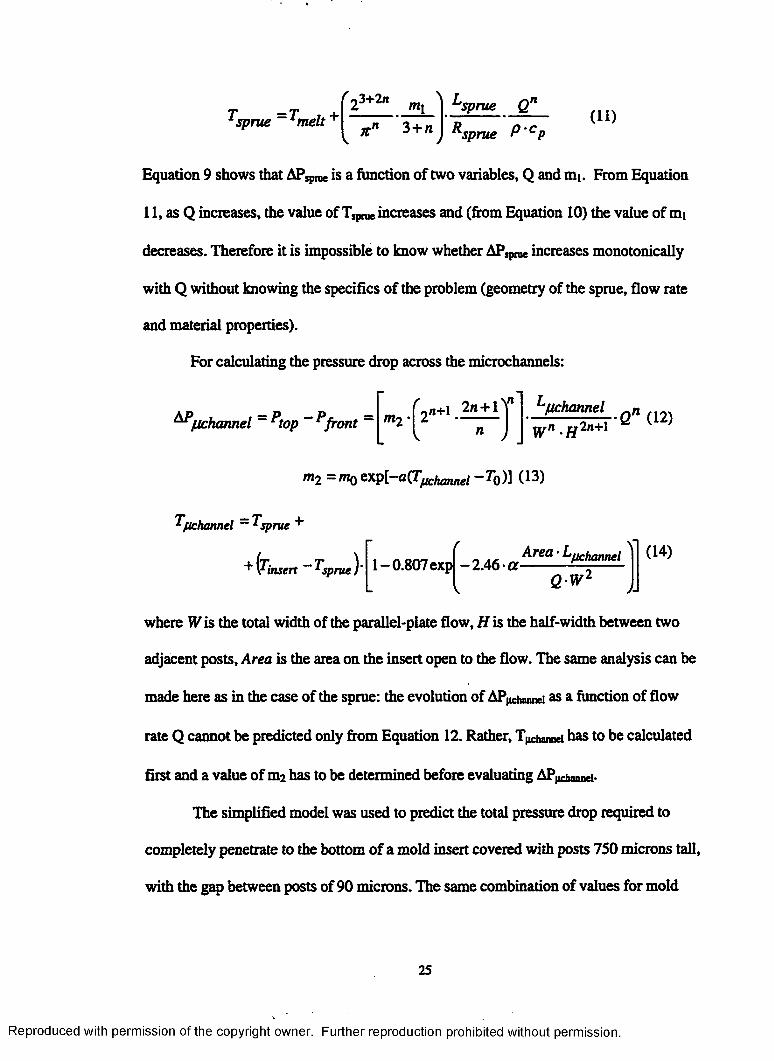
Figure 2.11 shows a comparison between the composition of the injection cycle
time for the cases where the mold was heated at 140 °C and where the mold is unheated,
hi addition, a literature value is given for reference. The large difference between the
values of the overall cycle time is due to time needed to thermally cycle the mold in the
21
Reproduced with permission of the copyright owner. Further reproduction prohibited without permission.
Cyela time comparison
700
■Cooling □Holding ■ Injection □ Heating
1 2 3
Figure 2.11 Comparison of duration and composition of cycle times between injection cycles done at two mold temperatures: 1- 140°C; 2- 20°C; 3-overall literature value [12]
case where the mold is heated. However, even at the higher values, the overall cycle
time is still shorter than the overall values reported in the literature [12].
2.4 Results and Discussion
A simplified model can be used to qualitatively predict the results given in Table
2.1 and in Figure 2.10. When the polymer is first injected into the mold cavity, the
assumption is made that the spaces in the mold cavity not associated with the voids
between the microstructures (microvoids) are filled up first. This assumption is based
on the fact that flow resistance into these spaces is negligible compared to the resistance
between the microstructures. Once these spaces are filled, the polymer melt begins to
penetrate into the microvoids in the insert. The time for these spaces to be filled is
approximately the volume of the microvoids (cm3) divided by the injection rate
(cm3/sec). For the insert shown in Figure 2.6, the time required to fill the microvoids
ranges from t = 0.002 sec (Q = 80 cm3/sec) to t = 0.016 sec (Q= 10 cm3/sec).As the
polymer penetrates the microvoids, heat transfer occurs between the melt and the insert
The thermal boundary layer thickness in the m elt 5t, is approximated by the expression:
22
Reproduced with permission of the copyright owner. Further reproduction prohibited without permission.

5' = Jnat (6)
where the thermal diffusivity, a , is approximately 0.3x1 O'6 cm2/s. For values of the time
f= 0.002 and 0.016 seconds, St equals 43 micrometers and 122 micrometers,
respectively. Since the width of the channel between parallel posts is approximately 90
micrometers, the thermal boundary layers growing from parallel post surfaces meet,
even at the fastest flow rate. Qualitatively, this means that the melt temperature is
dramatically reduced during the time required to penetrate the microvoids. A simple
model has been developed to predict whether the polymer will quench and solidify
before it completely fills the mold cavity. The model is based on the following
assumptions:
• The two main components of the total pressure drop between the barrel and the melt
front inside the microchannels are: i) the pressure drop across the sprue and, ii) the
pressure drop across the microchannels. Therefore,
bPtotal = sprue + &Pfichannel C7)
• Due to the existence of a vacuum inside the mold cavity, the pressure at the melt
front can be approximated to zero;
• As the injection pressure reaches the value 1300 bar, the injection stops. This value
represents the maximum pressure output deliverable by the hydraulic system;
• The flow through the sprue can be approximated as fully developed flow through a
cylindrical channel;
• The flow through the microchannels (between adjacent microposts) can be
approximated as unidirectional flow between parallel plates, in a direction
perpendicular to the substrate on which the posts are supported;
23
Reproduced with permission of the copyright owner. Further reproduction prohibited without permission.

• The polymer melt has a non-Newtonian, shear thinning nature that can be described
by the Ostwald-de Waele model. The melt index n is assumed constant, while the
consistency m is a function of temperature given by:
where mo, a, and To are constants specific to the HDPE used;
• Viscous dissipation due to shearing of the melt along the sprue determines the mean
temperature of the melt at the exit from the sprue;
• Heat transfer between the melt and the insert is approximated as follows:
o the insert temperature is constant
o the velocity profile of the melt within the insert is uniform,
o heat transfer within the polymer is one dimensional (normal to the
surface of the microstructures)
o the mean temperature of the melt within the microchannel is equal to the
mean temperature of the melt at the melt-vacuum interface,
o the temperature of the microposts remains constant during injection,
o the temperature profile across the polymer at the melt front is calculated
using analytic formulas for a plane wall with convection, Biot = <».
The model calculates the total pressure drop required for complete penetration into the
microchannels. Based on these assumptions, the following set of equations was used.
For calculating the pressure drop across the sprue:
m = m0 exp [-a(r - T0)] (8)
^sp ru e ~ ^injection ^sprue—exit 2/»l •I \ j \ s p r u e
ml =mQ exp [-a • (Tsprue -T 0)] (10)
24
Reproduced with permission of the copyright owner. Further reproduction prohibited without permission.
^sprue ^m elt+^03+2n m ̂Z m\
X•n 3+n^sprue Qn
(11)*sprue P ' cp
Equation 9 shows that APspme is a function of two variables, Q and mi. From Equation
11, as Q increases, the value of Tsptue increases and (from Equation 10) the value of mi
decreases. Therefore it is impossible to know whether APjpne increases monotonically
with Q without knowing the specifics of the problem (geometry of the sprue, flow rate
and material properties).
For calculating the pressure drop across the microchannels:
^/uchannel ^top ^front ~ m2 •f 2„+1 2n+ l)n
nLm h a n m l Q „ ( [2 )
Y / n - H 2/1+1
m2 = m 0 zxpi-aiTphemnel ~ To)] ( 1 3 )
Tfichannel ~ ̂ sprue "*■
(Tinsert ~ ̂ sprue )’ 1-0.807exp l M a Area' Lm>m“ ‘l \JJ
(14)
where W is the total width of the parallel-plate flow, H is the half-width between two
adjacent posts, Area is the area on the insert open to the flow. The same analysis can be
made here as in the case of the sprue: the evolution of APr hnn.»i as a function of flow
rate Q cannot be predicted only from Equation 12. Rather, T̂ hannei has to be calculated
first and a value of m2 has to be determined before evaluating APpdmnnd-
The simplified model was used to predict the total pressure drop required to
completely penetrate to the bottom of a mold insert covered with posts 750 microns tall,
with the gap between posts of 90 microns. The same combination of values for mold
25
Reproduced with permission of the copyright owner. Further reproduction prohibited without permission.

temperature and melt flow rate was used, as in the experimental part of our study. The
results plotted in Figure 2.12 indicate that, as the temperature of the mold increases, less
pressure is necessary to completely penetrate into the 750 microns deep gaps.
Total Pressura Drop vs. How Rate
3.0& 08
2.5E+08
2.0E+08
1.5E+08%
1.0E+08
5.0E+07
O.OE+OO0 20 40 60 80 100
Row Rato, cm’/fe
*— 2— i — I-- -A. - W -
♦20 ’C ■60 *C A 80 *C X100*C X 120’C • 140 *C
Figure 2.12 Predicted total pressure drop vs. flow rate, at different mold temperatures
The model predicts that combinations of mold temperature and melt flow rate
resulting in data points located above the 1300 bar line will correspond to incomplete
penetration of the plastic into the mold insert. This is due to the assumption that the
flow stops when the total pressure drop exceeds 1300 bar. Diversely, points located
below the 1300 bar line represent combinations of parameters that lead to complete
penetration into the mold insert hi summary, the model predicts that heating the mold
at temperatures above 100 °C leads to injection molding of high-quality polymer
HARMs at all flow rates, while temperatures of the mold below 100 °C do not ensure
complete penetration into the mold insert independent of the flow rate. These
predictions are in qualitative accordance with the experimental results given in Figure
2.10: in our experiments we found that injection cycles conducted at mold temperatures
26
Reproduced with permission of the copyright owner. Further reproduction prohibited without permission.
higher than 120 °C lead to complete penetration into the mold insert independent of the
melt flow rate. Below 120 °C, although a high injection speed improved the process,
penetration of the mold insert was incomplete in all cases. The experimental values of
120°C and 140 °C have a physical meaning related to the polymer used in our
experiments. A temperature of 120 °C corresponds to the onset of the melting process
for the HDPE used, as determined by DSC measurements. Also determined by DSC, a
temperature of 140 °C represents the upper limit of the melting interval (as mentioned
before, the melting interval is centered on 132.5 °Q . Qualitatively, the model predicts
the experimental results shown. However, the model gives 100 °C as the lower value of
the mold temperature at which injection is successful as opposed to the experimental
value of 120 °C. Given the simplifying assumptions for the model, such differences
between model and experiments are expected.
2.5 Examples of Injection Molding Results
23.1 Injection-molded Parts
The second avenue that has been pursued is molding plastic HARMs that
accurately reproduce the pattern on the mold insert. The challenge consisted in molding
large area HARMs covered with microstructures having aspect ratios of 10:1 or above.
An example is a pattern composed of rectangular posts 1000pm tall and 180pm on the
side, with the gap between posts of 90 pm. A micrograph of the molded part is shown in
Figure 2.13. The injection was carried out at 140 °C and with an injection rate of 70
cm3/s. After mold-filling, the mold was cooled down to the same demolding
temperature as in the case of the 600 pm insert (50°Q. Similarly to that previous case,
the demolding was achieved easily, preserving the structural integrity of the plastic part
27
Reproduced with permission of the copyright owner. Further reproduction prohibited without permission.

Figure 2.13 Micrograph of HDPE HARMs: Aspect Ratio 11:1
Another example of a successful molding experiment is that of a “lab-on-a-
chip”-type pattern, composed of small reservoirs interlinked by microchannels. A
portion of the pattern on the mold insert is shown in Figure 2.14. The material for
molding was HDPE, MI 25. The smallest lateral dimension on the pattern is 80 microns,
with a height of 500 microns. The challenge in molding this pattern consisted in
replicating the narrow, rather fragile microloops. The injection molding cycle was*
carried at a mold temperature of 130 °C and an injection speed of 30 cm /s.
Reproduced with permission of the copyright owner. Further reproduction prohibited without permission.
Figure 2.14 Lab-on-a-chip Mold Insert
28

The injection speed was lower than in the previous example, because of the fine walls
on the mold insert Lowering the injection speed reduced the probability that the
advancing melt front would damage the fine structures on the insert. SEM micrographs
of the molded structure are shown in Figure 2.15 a and b. Figure 2.15a shows proper
replication of the meandering microchannel, the piece missing from that area
corresponds to an imperfection that existed on the mold insert
1000 microns 500 microns
a b
Figure 2.15 Molded Lab-on-a-chip pattern: a- general view; b- close-up
Figure 2.15b is a close-up of the lower right area in Figure 2.15a. The image
shows that the top and bottom surfaces of the molded part have different roughness.
This is an indication of the ability of the molding step to intimately reproduce even the
finest geometrical characteristics existent on the mold insert One can say that after
optimizing the molding process, the molded part will be as good as the mold insert
2.5.2 Injection Molding of Polymethylmethacrylate (PMMA)
PMMA is a material widely used for its optical properties. It has excellent
transparency (optical absorption at 514.5 nm is 0.084 dB/m), it has a refractive index of
1.49 and the Abbe number is 58. Because of these properties, PMMA is often used as
glass replacement, thus its trade name “plexiglas”. For example, one area in which
29
Reproduced with permission of the copyright owner. Further reproduction prohibited without permission.
PMMA is increasingly used to replace glass is in microfluidic elements. Such systems,
for instance DNA sequencing microsystems have at their core a flow element consisting
of a long and narrow microchannel, used to separate macromolecular segments of
different lengths based on differential flow. The microchannel on such a “chip”, as
developed in the Chemistry Department at LSU, has typical dimensions of tens of
millimeters length, tens of microns depth, and tens of microns width, with vertical
aspect ratios up to 8:1. Bioseparation systems are traditionally made of glass, but
making DNA sequencing chips using PMMA offers a series of advantages over glass.
First, PMMA chips can be mass-produced by molding and can be made available as
relatively inexpensive disposable parts. Secondly, as for glass, the surface chemistry of
PMMA can be modified to enhance chemical compatibility, and work to improve the
properties of PMMA by means of chemical modifications of the surface is currently
carriedouL This, coupled with the fact that PMMA can be shaped by any of the
thermoforming methods used for thermoplastic polymers makes it a good choice for
biomedical applications. Also advantageous for PMMA is its machineability.
Research work was carried out to accurately replicate the DNA sequencing
microchannel patterns developed by the pSET group. It was found that, when injection
molding PMMA, several precautions have to be taken for the molded part to have
optimal characteristics. A description of these requirements is later summarized in
Table 2.2. PMMA is a temperature-sensitive material, which easily decomposes into
monomer above 300 °C. The decomposition mechanism consists of fast “un-zipping” of
the long macromolecular chain into short monomer molecules. By comparison, HDPE
starts to decompose at 300 °C, too, but the decomposition occurs at a much slower rate,
30
Reproduced with permission of the copyright owner. Further reproduction prohibited without permission.
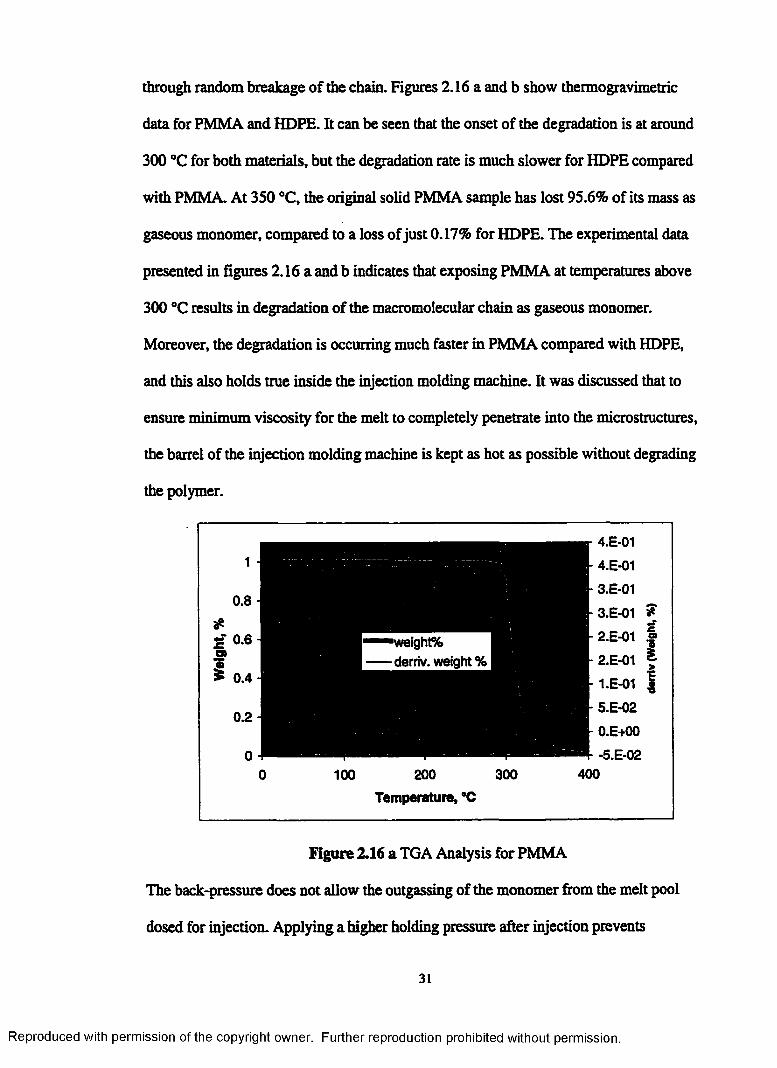
through random breakage of the chain. Figures 2.16 a and b show thermogravimetric
data for PMMA and HDPE. It can be seen that the onset of the degradation is at around
300 °C for both materials, but the degradation rate is much slower for HDPE compared
with PMMA. At 350 °C, the original solid PMMA sample has lost 95.6% of its mass as
gaseous monomer, compared to a loss of just 0.17% for HDPE. The experimental data
presented in figures 2.16 a and b indicates that exposing PMMA at temperatures above
300 °C results in degradation of the macromolecular chain as gaseous monomer.
Moreover, the degradation is occurring much faster in PMMA compared with HDPE,
and this also holds true inside the injection molding machine. It was discussed that to
ensure minimum viscosity for the melt to completely penetrate into the microstructures,
the barrel of the injection molding machine is kept as hot as possible without degrading
the polymer.
1 4
0.8-1
* I2 0.6-1o> I1 I> 0.4-1
0.2-1
0 I0
4.E-01
4.E-01
3.E-01
3.E-01 *
2.E-01 ®eight% derriv. weight % 2.E-01
100 200 300
Temperature, °C
1.E-01 |
5.E-02
O.E+00
-5.E-02400
figure 2.16 a TGA Analysis for PMMA
The back-pressure does not allow the outgassing of the monomer from the melt pool
dosed for injection. Applying a higher holding pressure after injection prevents
31
Reproduced with permission of the copyright owner. Further reproduction prohibited without permission.

shrinkage and also prevents the escape of the monomer from the part It is assumed that
the decomposition is slowed down under pressure, minimizing unzipping. However, too
high a holding pressure leads to overpacking, thus it leads to a stressed part and
difficulties in extracting the cooled-down part from the mold.
1.1
1.05
1*| 0.95
50.9
0.85
0.80 50 100 150 200 250 300 350 400
Temperature, °C
Figure 2.16 b TGA Analysis for HDPE
The same problems can also occur if the holding pressure is applied for an extended
time. The proper value for the holding time is correlated with the heat transfer between
the cooling part and the mold. Relieving the holding pressure too soon does not prevent
shrinkage, while applying pressure on a part that has already solidified leads to
overpacking and residual stress. The actual values for back-pressure, and for holding
pressure and time were determined empirically and are shown in table 2.2.
The design of the PMMA part and of the mold took into account the properties of
PMMA both as melt and as solid. The following design criteria were considered when
building the part/ mold:
32
[■"™wefght%| — demv. weight %
Reproduced with permission of the copyright owner. Further reproduction prohibited without permission.
• PMMA has a high melt viscosity. In order to minimize pressure loss upstream from
the mold cavity due to large viscous forces, the mold design requires a large cross-
section for the sprue. The sprue was built with an exit diameter of 10 mm;
• Also to preserve maximum melt pressure, a runner-less, gate-less design was chosen
where the exit from the sprue feeds directly into the entrance into the mold cavity.
This design avoids pressure losses along runners and gate, maximizing the pressure
available for forcing the melt into the microstructures;
• High holding pressures can lead to overpacking, and together with the uneven part
cross section it can cause sink marks at the sprue gate on the pattern side of the part.
To avoid problems in extracting the sprue due to overpacking, a wide taper angle
was used for the sprue, 3.57side. To avoid the sink marks in the pattern area, the
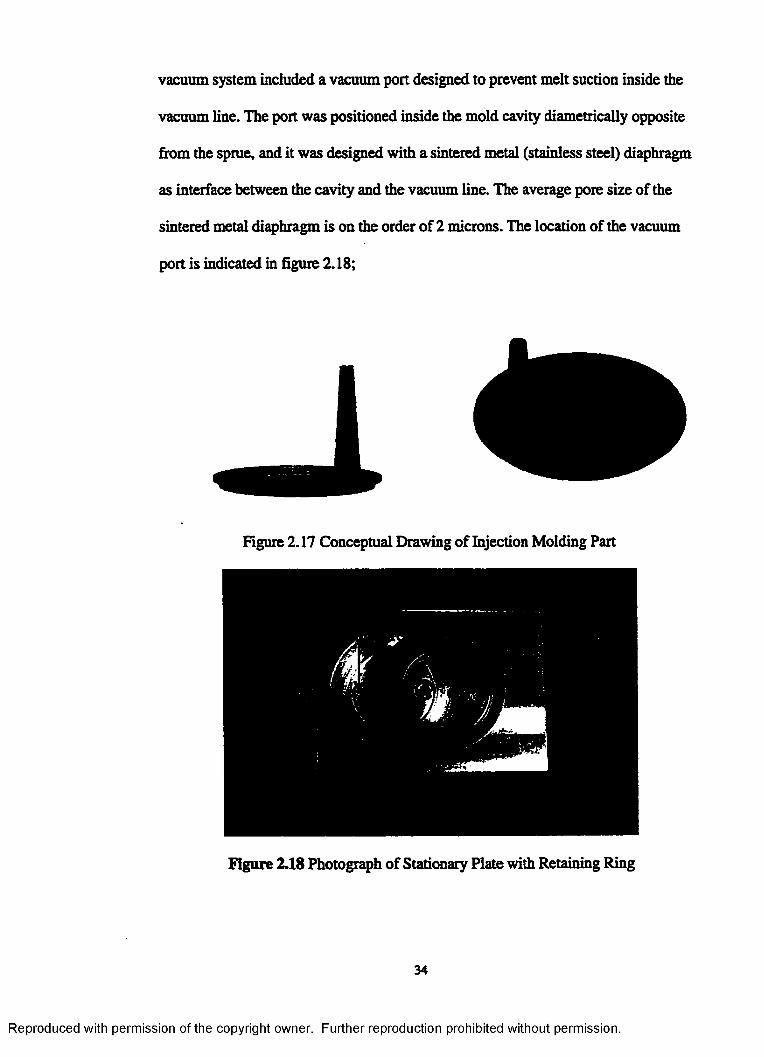
sprue was located on the side of the plastic part, close to the edge, as seen in figure
2.17;
• Simple and efficient separation of the molded part from the mold insert is desirable.
The separation is done by a translational movement of the two surfaces away from
each other, parallel at all times. A retention ring was designed to hold the part on the
stationary plate side upon demolding, and to easily detach to free the part when
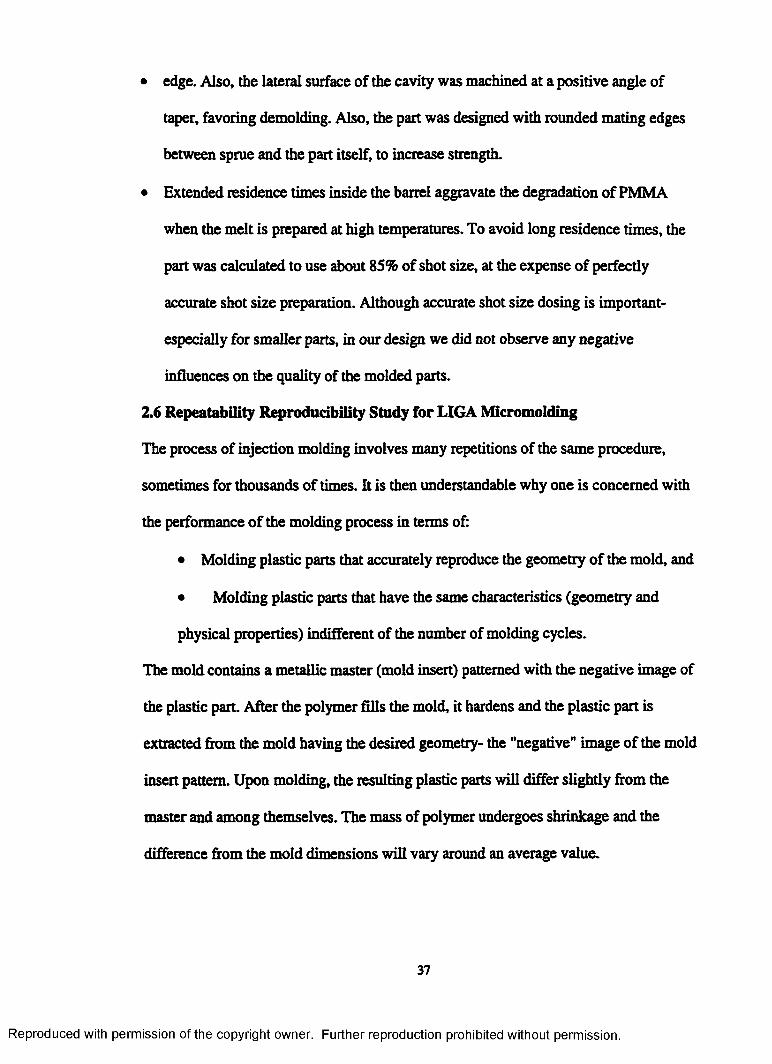
molding was complete. The retention ring is shown in figure 2.8, together with the
stationary mold plate;
• When molding into micropatterns, the advancing melt front will trap air inside the
microstructures causing incomplete penetration. Thus, the cavity has to be
evacuated prior to injection. The sealing of the cavity for vacuum application was
done using a high-temperature o-ring between the mating faces. In addition, the
33
Reproduced with permission of the copyright owner. Further reproduction prohibited without permission.
vacuum system included a vacuum port designed to prevent melt suction inside the
vacuum line. The port was positioned inside the mold cavity diametrically opposite
from the spme, and it was designed with a sintered metal (stainless steel) diaphragm
as interface between the cavity and the vacuum line. The average pore size of the
sintered metal diaphragm is on the order of 2 microns. The location of the vacuum
port is indicated in figure 2.18;
Figure 2.17 Conceptual Drawing of Injection Molding Part
Figure 2.18 Photograph of Stationary Plate with Retaining Ring
34
Reproduced with permission of the copyright owner. Further reproduction prohibited without permission.

• Because PMMA is rather brittle, undercuts in the part will break upon demolding.
Thus, the design of the part was done to avoid undercuts other than the retaining
Table 2.2 Summary of Requirements for Injection Molding of PMMA
Drying of the PMMA
pellets
PMMA absorbs about 0.4% water. Molded parts are
affected by high moisture content, which leads to streak
marks on the surface of the part A material with very
high moisture content will mold with bubbles inside the
part Drying is done in an air oven at 70-75 °C for 4 -8
hours. Also, a desiccant can be used to dry out the
pellets, but drying time is longer. The moisture content
should be below 0.1%
Melt preparation PMMA is rather sensitive to high shear forces. The heat
generated by shearing inside the barrel can degrade the
polymer and lead to decomposition into monomer
(methylmethacrylate). To prevent this, the dosing is at
low screw turning speeds, 5 m/min. Also, to prevent
volatiles from escaping the melt, a relatively high
backpressure is applied when dosing, 150 bar. A vented
barrel is recommended when generation of gaseous
compounds cannot be avoided. Holding pressure was
applied over 40 sec holding time. The pressure profile
was increasing linearly with time, from 50 to 300 bar
Reproduced with permission of the copyright owner. Further reproduction prohibited without permission.

Table 2.2. Continued
The temperature field along the barrel is important to
obtain a proper m elt Too low of a temperature can lead to
grinding of the pellets and the formation of fine particles
which will not plasticate properly. Also, a low temperature
will lead to a very viscous melt, which, upon shearing, will
generate more heat and lead to monomer generation. It
was found that a raising temperature profile along the
barrel, e.g. 260- 270-280 °C from feed zone to nozzle, was
appropriate.
Mold design and manufacture
Because PMMA is rather brittle compared to other
molding plastics, the mold design should avoid undercuts
and sharp comers. It is recommended that the sprue have a
taper of 3-4° per side to facilitate sprue extraction. The
diameter of the sprue can be 8-10 mm, when using a
sprue-gate design.
The optical properties of PMMA can be easily lost if the
surface finish of the mold is not very high. Thus, the mold
needs to be well polished to a mirror-like finish for the part
to be optically clear.
The mold cavity should be under vacuum upon injection,
thus a vacuum system has to be fitted on the mold.
Reproduced with permission of the copyright owner. Further reproduction prohibited without permission.
• edge. Also, the lateral surface of the cavity was machined at a positive angle of
taper, favoring demolding. Also, the part was designed with rounded mating edges
between sprue and the part itself, to increase strength.
• Extended residence times inside the barrel aggravate the degradation of PMMA
when the melt is prepared at high temperatures. To avoid long residence times, the
part was calculated to use about 85% of shot size, at the expense of perfectly
accurate shot size preparation. Although accurate shot size dosing is important-
especially for smaller parts, in our design we did not observe any negative
influences on the quality of the molded parts.
2.6 Repeatability Reproducibility Study for LIGA Micromolding
The process of injection molding involves many repetitions of the same procedure,
sometimes for thousands of times. It is then understandable why one is concerned with
the performance of the molding process in terms of:
• Molding plastic parts that accurately reproduce the geometry of the mold, and
• Molding plastic parts that have the same characteristics (geometry and
physical properties) indifferent of the number of molding cycles.
The mold contains a metallic master (mold insert) patterned with the negative image of
the plastic part. After the polymer fills the mold, it hardens and the plastic part is
extracted from the mold having the desired geometry- the "negative" image of the mold
insert pattern. Upon molding, the resulting plastic parts will differ slightly from the
master and among themselves. The mass of polymer undergoes shrinkage and the
difference from the mold dimensions will vary around an average value.
37
Reproduced with permission of the copyright owner. Further reproduction prohibited without permission.
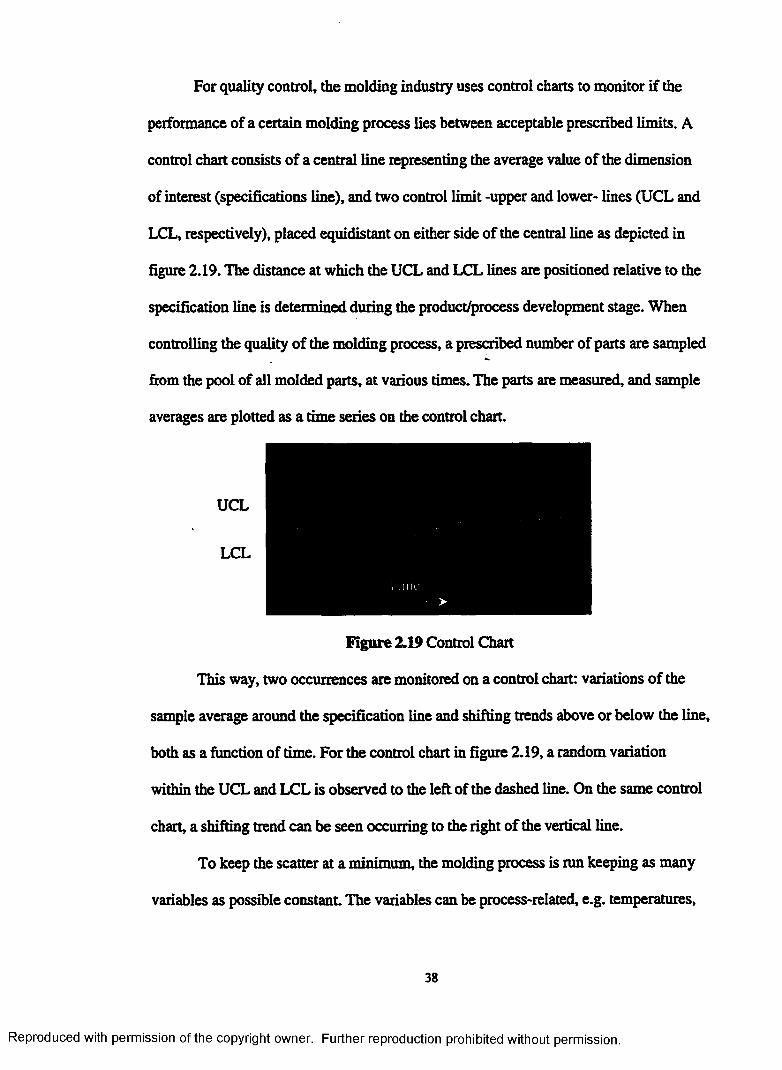
For quality control, the molding industry uses control charts to monitor if the
performance of a certain molding process lies between acceptable prescribed limits. A
control chart consists of a central line representing the average value of the dimension
of interest (specifications line), and two control limit -upper and lower- lines (UCL and
LCL, respectively), placed equidistant on either side of the central line as depicted in
figure 2.19. The distance at which the UCL and LCL lines are positioned relative to the
specification line is determined during the product/process development stage. When
controlling the quality of the molding process, a prescribed number of parts are sampled
from the pool of all molded parts, at various times. The parts are measured, and sample
averages are plotted as a time series on the control chart.
UCL
LCL
Figure 2.19 Control Chart
This way, two occurrences are monitored on a control chart: variations of the
sample average around the specification line and shifting trends above or below the line,
both as a function of time. For the control chart in figure 2.19, a random variation
within the UCL and LCL is observed to the left of the dashed line. On the same control
chart, a shifting trend can be seen occurring to the right of the vertical line.
To keep the scatter at a minimum, the molding process is run keeping as many
variables as possible constant The variables can be process-related, e.g. temperatures,
38
Reproduced with permission of the copyright owner. Further reproduction prohibited without permission.
flow rates, pressures, etc, and material-related such as viscosity, humidity content, etc.
Ideally, the identification of all variables influencing the process is done during the
investigative research efforts. Keeping these variables constant during the molding
cycle would leave the variation of the process to exhibit only naturally random
departures from the specifications line. Such a process is called to be under statistical
control [17]. When designing a plastic part, the manufacturer and the customer require
that certain dimensional specifications are met, but they allow for an acceptable interval
of variation. For example, a micropart could be specified to have the wall 625 microns
thick, ±5 microns. The values such as ±5 microns are usually a tradeoff between “what
can be molded’* and “what needs to be molded”. While “what needs to be molded” is a
result of the micropart design, “what can be molded” is determined experimentally. In a
planned set of experiments, the researcher determines the amount of scatter for the
dimension of interest when the process is run keeping a comprehensive set of process
variables constant. Thus, in the product/process development stage, the distance at
which the UCL and LCL lines of a control chart are positioned relative to the central
line is determined. This distance is based on the standard deviation or on the range
(difference between the largest and the smallest value) for the measurements of the
dimension of interest, as it will be calculated later in this section. Also during the
product/process development stage, the average departure of the measurements from the
central line is determined. For instance, the amount of shrinkage is determined when the
dimensions for the plastic part are compared with the dimensions on the metallic insert.
During the production phase, the control chart is used to monitor the
performance of the process. An increase in the amount of variation around the central
39
Reproduced with permission of the copyright owner. Further reproduction prohibited without permission.
value indicates that a parameter is out of control and that it varies randomly. For
instance, if the mold temperature cannot be maintained at a constant level due to a
malfunction in the control unit, the part shrinkage will vary since the shrinkage is
proportional to temperature. When the UCL or LCL limits are exceeded, the molding is
stopped and the problem is fixed to bring the process back under statistical control.
Secondly, a shift in the average of the measured values indicates that a certain
parameter has changed to a new constant value, for instance the quality of the feedstock
has changed leading to a new value of the part shrinkage. Again, the molding is stopped
and an adjustment is made to bring the process back under statistical control.
This section reports on the transfer and preservation of geometrical
characteristics of HARMs molded by injection molding, when the variables injection
speed, mold temperature and barrel temperature are kept constant. In the following
paragraphs, the terms repeatability and reproducibility will be used to describe
variations of the sample average around the specification line and shifting trends above
or below the line, respectively. The study of reproducibility and repeatability is part of
the effort to bring a process under statistical control [17]. The terms are borrowed from
the statistical field of gauge measurements evaluation [18]. In this section, we will use
reproducibility as a term describing how much a plastic micropart is different when
compared with the metallic master used for replication- mold insert In addition, we will
use repeatability to describe how much plastic microparts molded under the same
conditions differ from each other. On a control chart reproducibility would correspond
to identification and quantification of shrinkage, while repeatability would indicate the
random variation around the centerline.
40
Reproduced with permission of the copyright owner. Further reproduction prohibited without permission.
The importance of injection speed and mold temperature and barrel temperature on
the quality of the molded microstructures was reported in section 2.4. In this section, the
process of micromolding is studied for reproducibility and repeatability under constant
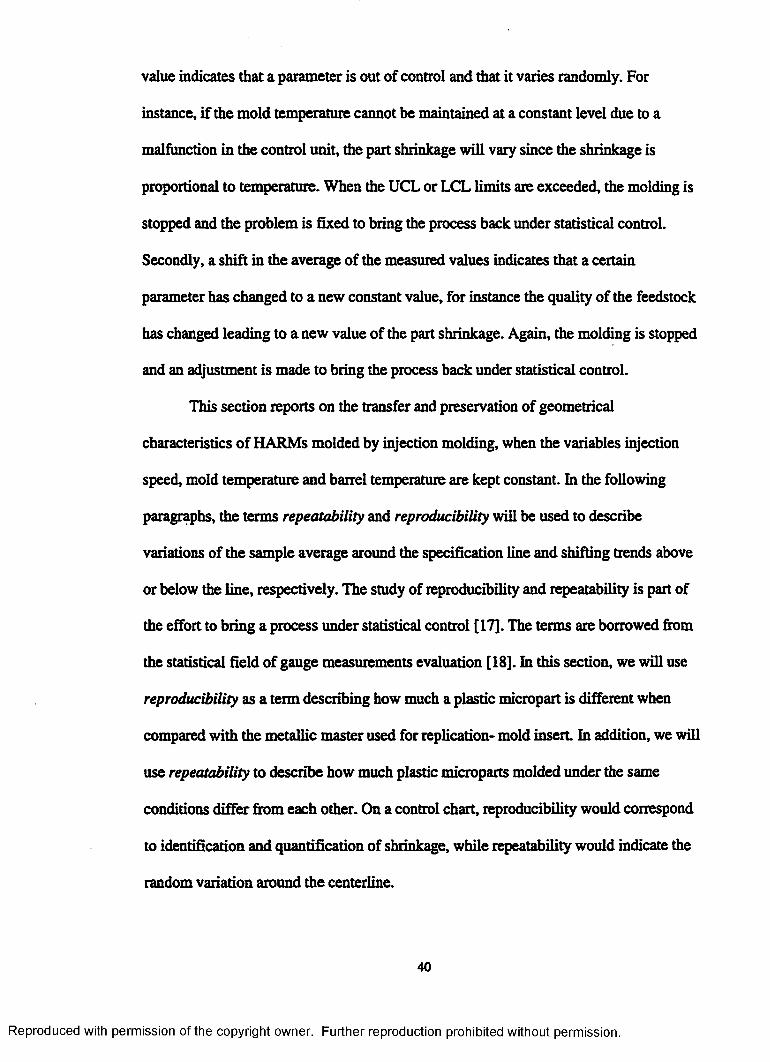
injection speed, mold temperature and barrel temperature. Specifically, a micro heat
exchanger pattern was molded, under constant conditions, using PMMA. The pattern
consists of three columns of fine rectangular troughs. Each trough is about 80 microns
thick and 1000 microns deep, as shown in Figure 2.20.
Figure 2.20 SEM Micrograph of: a- metallic master (mold insert), and b- molded
2.6.1 Repeatability
For the study of repeatability, 27 plastic parts were produced by injection
molding. The experimental design consists of the following: molding runs were
performed in three different batches corresponding to three different days; in each day
(batch), three plastic parts were molded; the surface of a part was then divided in 3
smaller rectangles, corresponding to the columns of microchannels. Each resulting
rectangle was uniquely identified by its vertical location: west, central, or east. For each
individual rectangle, twelve microfins were randomly selected and their thickness was
a b
pattern
41
Reproduced with permission of the copyright owner. Further reproduction prohibited without permission.
measured. This was repeated for every molded part Thus, the experimental design
consisted of the following factors:
• batch, with three levels t = 1,2,3
• part, with three levels j — 1,2,3
• position, with 3 levels k = 1,2,3
The levels of the “position” factor are defined by the column locations (West,
Central, East). The purpose of designing the experiment with three different days of
operation and small number of parts manufactured in one day was to identify the
presence of influences due to small series production (frequent machine start/stop
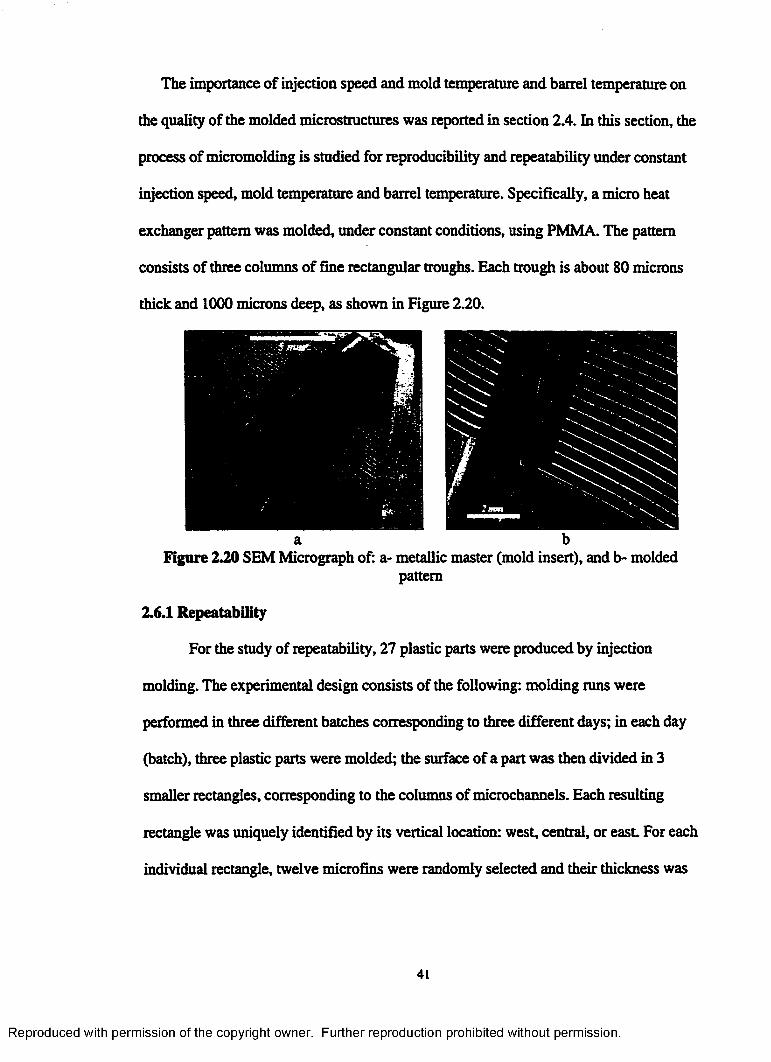
cycles). A sample of 6 of the total of 324 fin thickness measurements is given in Table
2.3.
Table 23 Sample of Thickness Measurements
1 1 West 701 I West 701 I West 711 1 West 701 I West 721 1 West 74
The mathematical model describing the potential sources of variation for an
individual thickness measurement (effects model) is:
yijU — + fit + P m + £ ijU
where:
• yiju is the thickness of an individual fin
• ft is the overall mean for all fins measured
42
Reproduced with permission of the copyright owner. Further reproduction prohibited without permission.

• p is the contribution of the “batch” effect
• p is the contribution of the “part” effect
• or is the contribution of the “position” effect
• £is the random error term.
The statistical analysis of the thickness measurement data was performed using
the S AS® package. The above model was used in a General Linear Model (GLM)
procedure where differences between batches, parts, and regions were assessed based
on Tukey’s post-ANOVA comparison technique. Table 2.4 shows the output of the
GLM procedure for each effect. As seen, the p-values indicate that the null hypothesis
of equal means cannot be rejected in the case of the “batch” (p=0.2844) and the “part”
(p=0.997) factors. In the case of the “region” factor, at least one mean is different and
the null hypothesis of equal means is rejected (p=0.0001).
Table 2.4 Output From the GLM Procedure
DF2
Source: BATCH Error MS(SAMPLE(BATCH)) Denominator Denominator
TypelOMS DF MS 12.114197531 6 7.7561728395
F Value 1.5619
Pr>F0.2844
DF6
Source: PART(BATCH)Error MS(REGION(BATCH*SAMPLE))
Denominator Denominator Type m MS DF MS F Value
7.7561728395 18 196.08024691 0.0396Pr>F
04997
DF18
Source: REGION(BATCH*PART) Error MS(Error)
Denominator Denominator Type III MS DF MS 196.08024691 297 2.1966891134
F Value 89.2617
Pr>F0.0001
Statistically speaking, these results indicate that the factors “batch” and “part”
do not influence the value of the thickness of the fins. Thus, the thickness of the molded
43
Reproduced with permission of the copyright owner. Further reproduction prohibited without permission.

fin is not a function of the day when the part was molded nor is it a function of the
molded part on which the fins were located. However, the thickness of the fins is a
function of the position (region) on the plastic part.
At this point, the calculation of LCL and UCL limits for the process is done,
based on the standard deviations for each location. Table 2.5 contains the values of the
statistics used in the LCL UCL calculations, based on fin measurements taken on each
region on the molded parts. The following formulas are used:
UCL = Mean+3-iJSDy/ LCL = M ean-3 (16)
Table Means and Standard Deviations for the East, Central, and West regions
E 108 80 1.21C 108 76 1.74W 108 72 1.69
The UCL and LCL values have the following statistical interpretation: when
taking a sample of n measurements, their average will fall between the LCL and UCL
limits with a probability of 97%. The value of n in our case is chosen to be 5. Assuming
an average value of the standard error SD=1.54, the calculation becomes, for the
CENTRAL region:
UCL = 7 6.3+3 • ̂ L54% s 78 LCL = 7 6.3 - 3 * y[L54/ £ = 74
44
Reproduced with permission of the copyright owner. Further reproduction prohibited without permission.
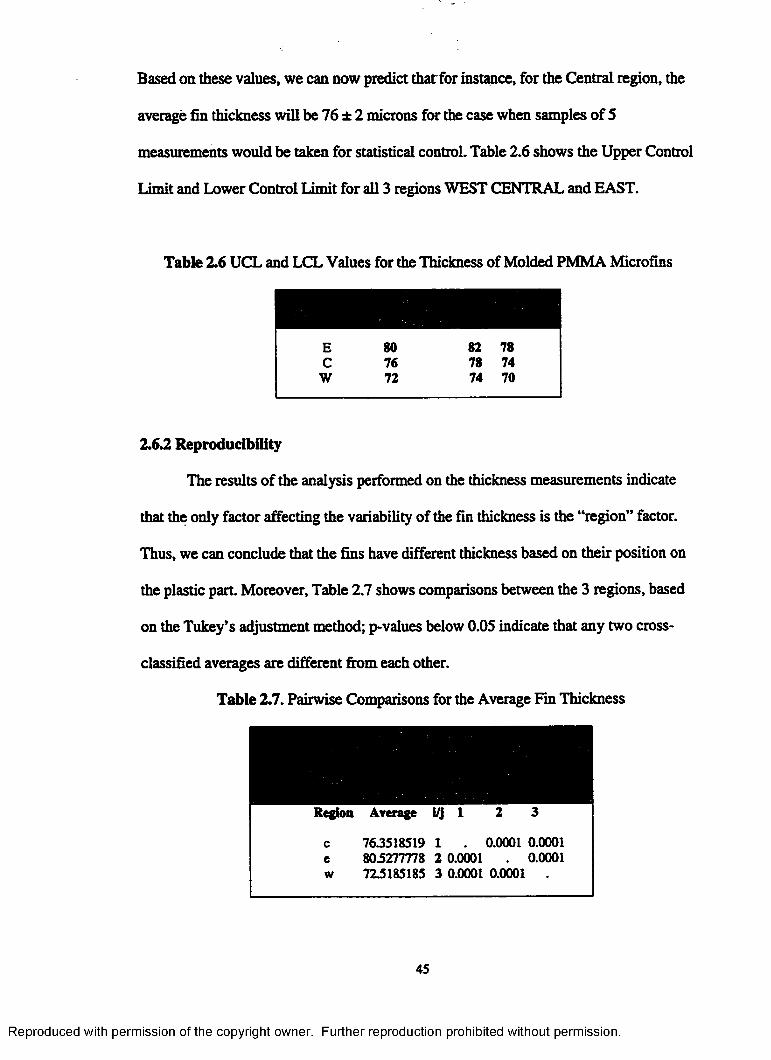
Based on these values, we can now predict that for instance, for the Central region, the
average fin thickness will be 76 ± 2 microns for the case when samples of 5
measurements would be taken for statistical control. Table 2.6 shows the Upper Control
Limit and Lower Control Limit for all 3 regions WEST CENTRAL and EAST.
Table 2.6 UCL and LCL Values for the Thickness of Molded PMMA Microfins
E 80 82 78C 76 78 74
W 72 74 70
1 6 2 Reproducibility
The results of the analysis performed on the thickness measurements indicate
that the only factor affecting the variability of the fin thickness is the “region” factor.
Thus, we can conclude that the fins have different thickness based on their position on
the plastic part Moreover, Table 2.7 shows comparisons between the 3 regions, based
on the Tukey’s adjustment method; p-values below 0.05 indicate that any two cross-
classified averages are different from each other.
Table 2.7. Pairwise Comparisons for the Average Fin Thickness
Region Average id 1 2 3
c 763518519 1 . 0.0001 0.0001e 803277778 2 0.0001 . 0.0001w 723185185 3 0.0001 0.0001
45
Reproduced with permission of the copyright owner. Further reproduction prohibited without permission.

All pairwise comparisons resulted in p-values o f0.0001, indicating that the
average fin thicknesses for all three regions are different from each other. A plausible
explanation for the difference in average fin thickness between regions can be the
existence of similar differences between the average dimensions of the micro-troughs
on the mold insert
To test this hypothesis, the width of the micro-troughs on the mold insert into
which the fins were molded was measured. The surface of the mold insert was divided
into 3 rectangles based on the same geographical arrangement as in the case of the
plastic parts. Twelve measurements were taken for each of the 3 rectangles
(geographical positions), resulting in a total of 36 measurements. Table 2.8 shows the
actual values of the gap widths. The data in Table 2.8 was then used in a statistical
analysis identical with the one performed for the molded parts data.
Table 2.8 Microgap Widths as a Function of Geographical Location
76 76 8375 m sB m i 75 84
s m . 73 m n s m 82 efeSaWU-J 8376 m a m ® 78 sJ®6283&sk 8374 m m m z o 81 m m m 8772 m am m a z 79 m> 84
Si 77 m s& m 50 84 m m m H 83sssh 79 m m m r 79 m m & w 83
76 m & sm 81 8077 m z s m . 79 8175 e s s s s s s 83 8275 80 83
The results are presented in Table 2.9.Again, the p-values lower than 0.05
indicate that the two means under comparison are statistically different A s seen from
Table 2.9, the averages for all three regions, WEST, CENTRAL, and EAST on the
insert are different from each other.
46
Reproduced with permission of the copyright owner. Further reproduction prohibited without permission.

Table 2.9 Pairwise Comparisons for Microgap Width Measurements
Region Average i/j 1
C 79.7500000 1 0.0019 0.0001E 83.0000000 2 0.0019 0.0001W 75.4166667 3 0.0001 0.0001 .
In order to quantify the reproducibility for the process of micromolding, the
thickness of the molded fins must be compared against the width of the microgaps into
which these fins were molded. The comparison between these average values can be
done by subtracting average values per region; thus three differences dw, dc, and dg can
be calculated. Moreover, a better descriptor of reproducibility is obtained when these
values are reported as percent dimensional change (shrinkage):
%shrinkage - ■ .xioo=w,M,̂ “~rtfcfa,̂ xioo
resulting in three shrinkage values sw, sc, and se- The homogeneity of these s-values is
then evaluated. Similar values for sw, sc, and se would indicate a homogeneous
shrinkage for all regions. The comparison insert vs. plastic is in table 2.10.
Table 2.10 Shrinkage Values for Each of the Three Geographical Regions
ORIGIN MEAN % SHRINKAGEMetallic insert 83 3.(1Molded plastic part 80
ORIGIN MEAN % SHRINKAGEMetallic insert 79 3.79Molded plastic part 76
ORIGIN MEAN % SHRINKAGEMetallic insert 75 4.0Molded plastic part 72
47
Reproduced with permission of the copyright owner. Further reproduction prohibited without permission.
2.63 Conclusions on Repeatability and Reproducibility
The study of repeatability and reproducibility for the process of injection molding of
HARMs was performed to investigate the stability of the process during small series
production (often machine start/stop cycles). The analysis was performed by means of
statistical interpretation of the measurements taken on both the metallic master (mold
insert) and the molded parts. In the repeatability study, we took into account three
factors that could influence the variation of fin thickness: batch-or the day when parts
were molded, part- the plastic part onto which the fins were molded, and region- the
geographical location of the fin on the plastic part The results of the repeatability study
indicate that there is no variation in the thickness of the microfins due to the day when
the part was molded or due to the part itself. Statistically speaking, all the parts molded
in our study were identical. This corresponds to a high degree of repeatability for the
molding process. UCL and LCL limits were calculated for samples of 5 measurements.
Secondly, the results of the analysis performed on the thickness measurements
indicate that the only factor affecting the variability of the fin thickness is the “region”
factor, hi other words, all parts molded where identical, but for all parts, the fins have
different thickness based on their position on the plastic part Next we investigated to
see if the same location-dependent variation exists for the width of the gaps on the mold
insert into which the fins were molded. The statistical analysis indicated that the same
geographical variation exists on the mold insert too: the microgaps had different
thickness as a function of their position on the insert
Thirdly, the thickness of the fins was compared with the width of the gaps on the
mold insert The comparison yielded a coefficient of shrinkage that has homogeneous
48
Reproduced with permission of the copyright owner. Further reproduction prohibited without permission.
values for all three geographical locations, with an average value of 3.6%. This
relatively high average shrinkage value can be explained by the application of
insufficient holding pressure during the cool-down period of the molding cycle. After
the mold cavity has been filled completely, the polymer starts to solidify thus shrink.
This amount of thermal shrinkage is estimated as the sum of shrinkage of the
melt between injection temperature and Tg, and shrinkage of the solidified part between
Tg and the demolding temperature:
%shrinkage = ( 7 ^ - T g)+ aaU(Tg - TitmoU) (17)
For PMMA, when r we/l=200°C, 7g=90 °C, and Tdemoid- 35 °C, the predicted shrinkage is
around 5%. To minimize shrinkage of the molded part during cool-down, polymer melt
is forced continuously into the cavity to maintain the same specific volume in the melt
as in the solid state. This is done by the application of the so-called holding pressure.
The experimental shrinkage value of 3.6% is probably due to the application of
insufficient holding pressure following cool-down.
2.7 Conclusions Injection Molding
Experimental work was carried out to study the microreplication of high aspect
ratio microstructures (HARMs) by means of injection molding. The general conclusion
of this work is that injection molding of HARMs follows the principles of injection
molding of larger scale parts. However, several specific considerations separate the
injection molding of HARMs from the existing macro-scale molding applications.
First, heat transfer and flow issues become more critical in the case of micro-scale high
aspect ratios. This is due to the very narrow widths into which the melt has to penetrate;
the heat transfer between the polymeric melt and the surroundings is intense, and the
49
Reproduced with permission of the copyright owner. Further reproduction prohibited without permission.
pressure losses associated with the flow into these narrow spaces are high. Molding
experiments were performed to evaluate the importance of injection speed and mold
insert temperature as variables for injection molding of HARMs. It was found that the
temperature of the mold insert is determinant, followed by injection speed. Heating the
mold insert to a temperature corresponding to the melting point of the polyethylene
used in injection led to complete penetration between the microposts used as test
pattern. This held true for any value of the injection speed, although increasing the
injection speed did favor the process at lower mold insert temperatures.
Secondly, the injection machine employed for this research work was a
commercially available machine designed for generic molding applications. Therefore,
several specific adaptations and modifications were made to the injection machine in
order to make it suitable for micromolding. A vacuum system was added to evacuate
the mold cavity, and a heating/ cooling system was mounted on the insert side of the
mold. Also related to the hardware, the design criteria for building the mold included
minimizing the pressure losses upstream from the mold cavity, a uniform cross section
of the melt path, and a proper retaining mechanism for separation of the molded part
from the mold insert
Thirdly, materials used for injection molding HARMs were either semi-
crystalline or amorphous. As an example of a semi-crystalline polymer, high density
polyethylene was used as a molding material having good flow characteristics. Molding
materials need to be analyzed prior to molding to determine the flow characteristics as a
function of temperature and imposed shear rates. Special care needs to be used when
molding PMMA due to its susceptibility to rapid degradation over 300 °C.
50
Reproduced with permission of the copyright owner. Further reproduction prohibited without permission.

Last, experiments were carried out and statistical analysis was performed to
study the repeatability and reproducibility limits for injection molding of LIGA
HARMs in a micro heat exchanger pattern. The study found that the process of injection
molding of these HARMs was repeatable. The study of pattern reproducibility showed a
rather large value for the dimensional change of the molded microfeatures, compared to
the mold insert This shrinkage value was explained based on insufficient application of
holding pressure after injection.
51
Reproduced with permission of the copyright owner. Further reproduction prohibited without permission.

CHAPTER 3. HOT EMBOSSING
3.1 Survey of Embossing Techniques
Hot embossing is a molding technique consisting of patterning a polymeric
substrate by pressing the heated metallic insert into the moldable plastic. The technique
involves the use of a molding material in form of a preshaped sheet or in form of a
powder, which can be molded under applied pressure and heat Bacher et al. describe
the process of hot embossing using either a solid film (produced by casting of a mixture
MMA/PMMA) or a pile of powder-like PMMA [2]. The material was positioned either
underneath the mold insert (when a film was used) or on top of the insert (when powder
was used). The PMMA was heated "beyond its glass transition temperature" and
structured under vacuum by impression of the hot molding tool [2]. Harmening et al
[11] report on their work with hot embossing mentioning that the quality of the final
product is influenced by the mold release agent used during the process, together with
the molding and the “unmolding” (demolding) temperatures. Five different
experimental schemes were presented [21] based on the type of the material used and on
the way the material was positioned with respect to the molding tool.
The German company Jenoptik has developed the HEX hot embossing system,
as a result of the extensive experimental work carried out over more than ten years of
research. One of the features incorporated into the system is a high alignment precision
(lOmicrons over 120 mm of span) of the two plates of the press. Also included as
standard features are a precise control of the temperature of the plates and an accurate
control over the clamping force and speed. The two plates are enclosed inside a vacuum
chamber that allows for evacuation of the molding area prior to the actual embossing
52
Reproduced with permission of the copyright owner. Further reproduction prohibited without permission.
step. The maximum molding force is 200 kN, while the maximum molding temperature
is at 320 °C. The system is computer controlled and fully integrated. Parts embossed
using this system include micro-optical parts and microfluidic devices [19].
One other technique used to produce very fine structures, somewhat related to
hot embossing, is in-mold casting. This technique also deals with a reacting mass of
prepolymerized reactants [20,21] which is simply poured into a master pattern. After
casting, the hardened material is separated from the master by peeling it off. Using an
elastomeric master rather than a rigid one substantially eases the process. The procedure
was applied to first produce an elastomeric master made of poly(dimethylsiloxane),
PDMS . The prepolymerized PDMS was cast against an original master which had been
patterned with nanometer-size structures using lithographic techniques; this original
master could be Si02, S i ^ , metals or PMMA. The resulting elastomeric master was in
turn used to pattern a rigid organic polymer, for instance photochemically curable
polyurethane, PU [21]. This in-mold casting, also called replica molding, of PU against
a PDMS master could also be carried out while the PDMS was bent mechanically; in
this case smaller features than on the original master could be produced.
3.2 Theoretical Considerations
In order to better understand hot embossing and to identify the important
operating variables for this technique, one can approach the process through the
simplified model of squeezing flow between two plates (disks). Leider and Bird [25]
reviewed various solutions for squeezing flows between two disks, concluding that a
steady state solution for a power-law fluid is satisfied for the case of “slow” squeezing
of melts. Tadmor and Gogos [25] present the derivation of the Scott equation for such
53
Reproduced with permission of the copyright owner. Further reproduction prohibited without permission.
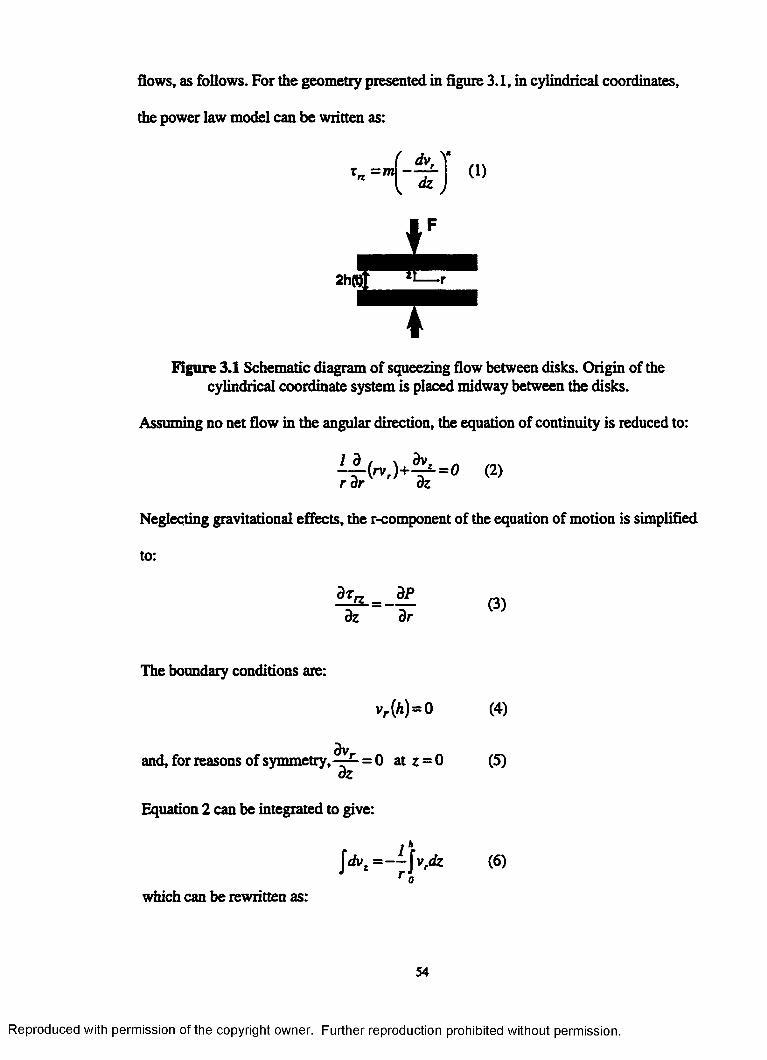
flows, as follows. For the geometry presented in figure 3.1, in cylindrical coordinates,
the power law model can be written as:
Figure 3.1 Schematic diagram of squeezing flow between disks. Origin of the cylindrical coordinate system is placed midway between the disks.
Assuming no net flow in the angular direction, the equation of continuity is reduced to:
(2)
Neglecting gravitational effects, the r-component of the equation of motion is simplified
to:
The boundary conditions are:
vr (A)=0 (4)
dvand, for reasons of symmetry,—^ = 0 at z = 0 (5)dz
Equation 2 can be integrated to give:
0(6)
which can be rewritten as:
54
Reproduced with permission of the copyright owner. Further reproduction prohibited without permission.
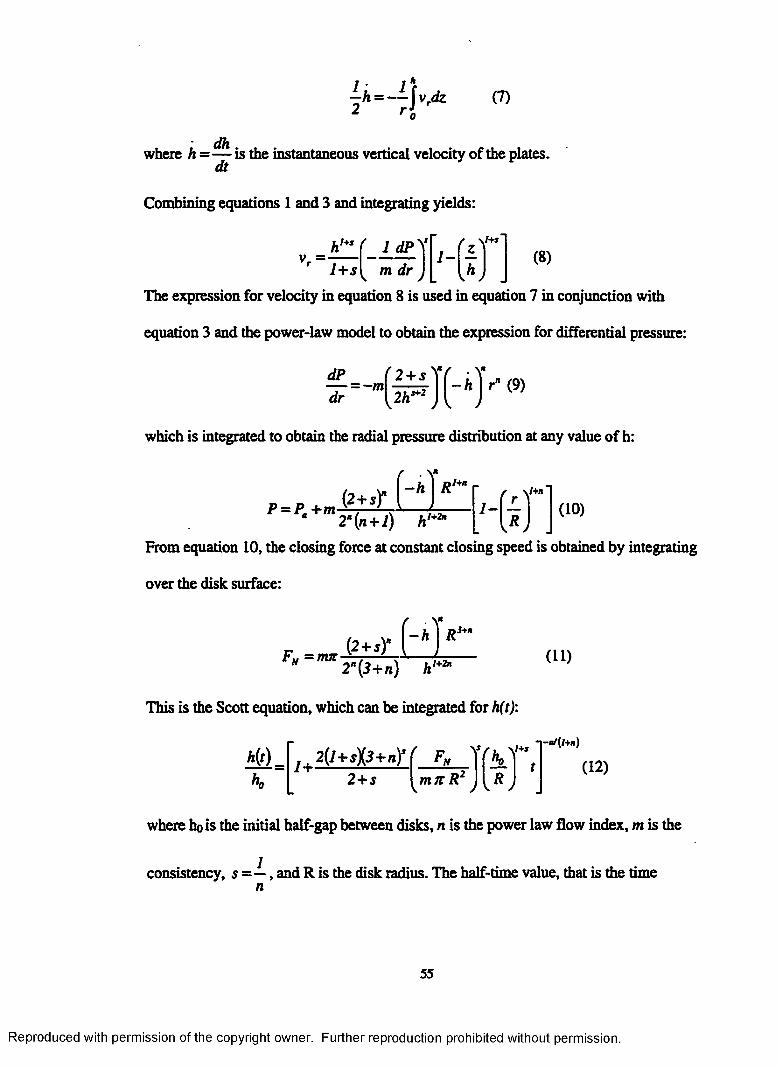
L h = -L )v ,d z (7)2 r i
d h .where h = — is the instantaneous vertical velocity of the plates. dt
Combining equations 1 and 3 and integrating yields:
h,+I( 1 dP yVr 1+s m dr
1 -r z \'”
L Kh J(8)
The expression for velocity in equation 8 is used in equation 7 in conjunction with
equation 3 and the power-law model to obtain the expression for differential pressure:
dr y2h j { Jrn (9)
which is integrated to obtain the radial pressure distribution at any value of h:
r • \ "
- h RP = Pa +m
2n(n+l) A/+2B1 -
r V+*(10)
From equation 10, the closing force at constant closing speed is obtained by integrating
over the disk surface:
Ff,=mjc (2 +s)- [h RJ+n
2"(3+n) A/+2b
This is the Scott equation, which can be integrated for h(t):
(11)
h(t).K
j , 2{H-st3+n)s2 + 5
NmJtR
f u V+*(12)
where hois the initial half-gap between disks, n is the power law flow index, m is the
consistency, s =•—, and R is the disk radius. The half-time value, that is the time n
55
Reproduced with permission of the copyright owner. Further reproduction prohibited without permission.

needed for reducing the gap to one-half the initial value can be obtained from equation
(12):
tM 2 = Kf 0 mitR
\ 5 r R
{*0(13)
where
K = n f2‘" - l Y2+sy 1* k
(14)
Bird notes that the Scott equation is applicable for "slow" squeezing of melts [4]. Slow
squeezing rates allow for the relaxation of visco-elastic effects through long
experimental times. This helps to avoid phenomena related to stress overshoot where
the polymer is not allowed to "catch-up" with the imposed signal. Therefore, at a given
temperature, experiments carried out at low values of the Deborah number will conform
to the Scott equation. Low De values (smaller than or equal to one) allow stress
relaxation to occur during embossing, leading to permanent deformations of the
thermoplastic polymer subjected to compression. Deborah number is defined as:
XDe = (15)‘exp
where X is the characteristic relaxation time and is the experimental time.
Equation 12 shows which variables will be involved in the squeezing flow. The
geometry of the flow can be generalized to include a set of N individual pairs of disks
of radius R pressed together at the same time in the same press. This scenario is a
qualitative descriptor of the case of hot embossing of microstructures. Thus, after
pooling together all constants in equation 12, the expression can be rearranged to give:
56
Reproduced with permission of the copyright owner. Further reproduction prohibited without permission.
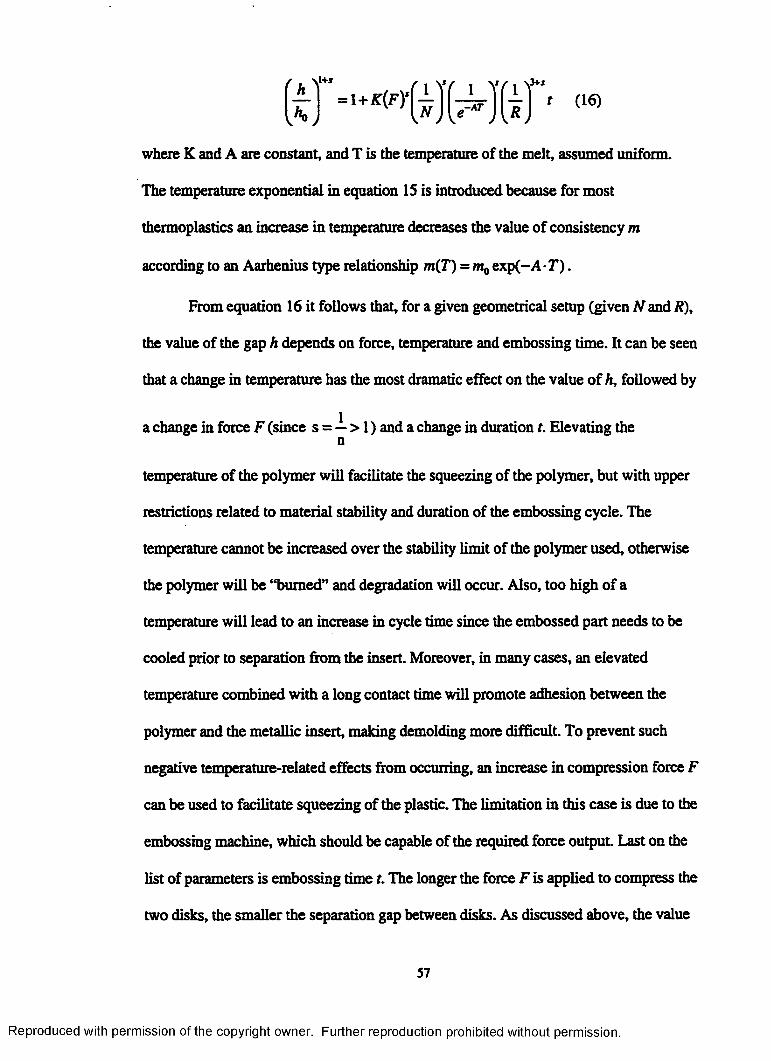
where K and A are constant, and T is the temperature of the melt, assumed uniform.
The temperature exponential in equation IS is introduced because for most
thermoplastics an increase in temperature decreases the value of consistency m
according to an Aarhenius type relationship m(T)=m0 ex p (-A -r).
From equation 16 it follows that, for a given geometrical setup (given N and R),
the value of the gap h depends on force, temperature and embossing time. It can be seen
that a change in temperature has the most dramatic effect on the value of h, followed by
a change in force F (since s = — > I ) and a change in duration t. Elevating then
temperature of the polymer will facilitate the squeezing of the polymer, but with upper
restrictions related to material stability and duration of the embossing cycle. The
temperature cannot be increased over the stability limit of the polymer used, otherwise
the polymer will be “burned*’ and degradation will occur. Also, too high of a
temperature will lead to an increase in cycle time since the embossed part needs to be
cooled prior to separation from the insert. Moreover, in many cases, an elevated
temperature combined with a long contact time will promote adhesion between the
polymer and the metallic insert, making demolding more difficult. To prevent such
negative temperature-related effects from occurring, an increase in compression force F
can be used to facilitate squeezing of the plastic. The limitation in this case is due to the
embossing machine, which should be capable of the required force output Last on the
list of parameters is embossing time t. The longer the force F is applied to compress the
two disks, the smaller the separation gap between disks. As discussed above, the value
57
Reproduced with permission of the copyright owner. Further reproduction prohibited without permission.

of t needs to be long enough to eliminate stress overshoot and to allow for relaxation of
the molecular chains under stress thus allowing for permanent deformation of the
substrate. The upper limit of cycle duration is related to the aforementioned problem of
stiction and to the economics of the overall cycle time.
33 Hot Embossing Equipment
The hot embossing work presented here was performed using a high-precision
press, model TS21HC manufactured by PHI, Ca. This press model is manufactured for
applications requiring independent control of pressure, temperature, and parallelism of
the plates. However, this press was not designed specifically for hot embossing of
HARMs, and additions were made to adapt it to the scope of microreplication, as it will
be later discussed in detail. The plates of the PHI press are 8 inches x 8 inches,
supported on four sliding posts. The sliding posts are chrome-plated, and the bottom
plate slides up and down on linear bushings for low-friction closing. An air-over-
hydraulic cylinder, capable of a maximum force o f9000 N, provides the closing force.
The two plates have a parallelism of 8.5 microns over 100 mm of span. The PHI press is
also designed with a heating/cooling system. The heating can be controlled
independently for each of the upper and lower plates at a rate of approximately 13
F/min, while the cooling is done simultaneously for both the upper plate and the lower
plate. The closing speed can be adjusted to achieve values of 50 microns/sec, minimum,
but with reduced accuracy. Table 3.1 below compares the principal characteristics of the
PHI system with the Jenoptik HEX 03 system. HEX is a series of embossing machines
designed specifically for micro hot embossing, and HEX 03 is the largest model in the
58
V
Reproduced with permission of the copyright owner. Further reproduction prohibited without permission.

series [26]. Different from the HEX 03, the PHI press does not have a vacuum chamber,
and most of the controls are separated from each other and are not computer controlled.
Table 3.1. Comparison between Jenopdk and PHI Embossing Systems
Press force Adjustable < 200 kN Adjustable < 8900kNEmbossing time Cycle time (typical) 7 min 1-10 minTemperatures Heating-up time (60°C to
180°C) < 7 min Cooling period (180°C to 60°C) < 7 min Temperature inside of the chamber < 320 °C
Temperature stability ± 2 K
< 15 min
<7 min
< 250°C
N/A
Cooling for PHI system issimultaneou s for both plates
Vacuum Vacuum / chamber (oil- mist free) < 1 mbar Pump-down time < 1 min Vent time <0.5 min
~ 0.1 bar
<5 sec
<5 sec
Vacuumchamberdesignedseparatelyand added tothe PHIsystem
Work substrates Max. substrate size 0150 mmor Max 150 mm x 150 mm. Embossing area 0 120 mmPermissible thickness of the emboss sandwich (contains mold and workpiece material)1...20 mmAdjustment of the vacuum chamber to the sandwich level automatically
0133 mm N/A
0 120 mm
1...12 mm
Yes
Alignment unit Max. distance between alignment markers 90 mm Instrumental overlay accuracy ± 3 pm
N/A
Cooling Water Inlet temperature < 15°C Water consumption 61/min
From water line
59
Reproduced with permission of the copyright owner. Further reproduction prohibited without permission.

Table 3.1 Continued
Electricalsupply
230/400 VA, Frequency 50 Hz or 60 Hz Power consumption 16.0 kW
120 VAC
2.6 kW
Pneumaticconnection
Compressed air 0.6 MPa...0.8 MPa
0.5Mpa min.
Dimensions Width 2600 mm Depth 900 mm Height 1800 mm
812mm x 406mm x 812mm
Weight Total weight approx. 1700 kg
120 kg
Because the PHI system is designed as a general-purpose hot-plate press, a
vacuum chamber was designed and built to make the press suitable for hot embossing of
microstructures. The design of the vacuum chamber was done based on the following
criteria:
• Employment of a standard mold insert geometry. This criterion was imposed
as part of the effort to facilitate rapid inter-use of inserts between injection
molding and hot embossing. The standardization was done by deciding on a
circular insert geometry, having a diameter of up to 4 % inches, with the
pattern inscribed inside a 3 Vi inches diameter circle;
• The need for an automated demolding mechanism. Demolding from the
metallic insert has to be done by separating the substrate from the insert
parallel to each other, without lateral movement that can deform or break the
microfeatures. This requirement can be fulfilled if the demolding is done
automatically, without manually handling of the substrate;
• Maximum height of the molding sandwich (mold insert and molding
substrate) up to Vi”;
60
Reproduced with permission of the copyright owner. Further reproduction prohibited without permission.

■ Preservation of plate parallelism;
• Control of temperature through the press heating/cooling system.
Applying these criteria, the design resulted in the vacuum chamber consisting of
a piston/cylinder assembly, with the sealing done using an o-ring mounted on the
moving piston. The top of the piston is secured onto a square support plate, while the
cylinder is attached to its own square support plate. These two halves of the so-formed
sealed chamber are aligned relative to each other by a set of four sliding posts machined
to tightly fit into corresponding cups. The alignment posts are screwed into the support
plate on the piston side, while the cups are screwed into the support plate on the
cylinder side, at the comers. To support the piston such that the mold insert does not
touch the molding substrate prior to closing the press, a spring is inserted at the bottom
of each cup. Figure 3.2 shows a photograph of the piston and of the cylinder composing
the vacuum chamber. Also shown on the right side of figure 3.2 is the mold insert
mounted on the piston, using six miniature screws # 2-56. This mounting method
resulted from the effort to standardize the geometry of the mold inserts to where mold
inserts are now easily interchangeable. Both the hot embossing press and the injection
molding machine use the same mold inserts, and a minimal time is needed to mount and
un-mount the insert inside the vacuum chamber of the hot embossing press or inside the
mold cavity on the injection molding machine.
Because the heating and cooling of the two sides of the vacuum chamber is done from
the press platens, heat transfer is important. The materials for building the vacuum
chamber were required to offer rapid and uniform heat transfer, and to have good
machinability and wear resistance. The piston was made of aluminum, together with the
61
Reproduced with permission of the copyright owner. Further reproduction prohibited without permission.
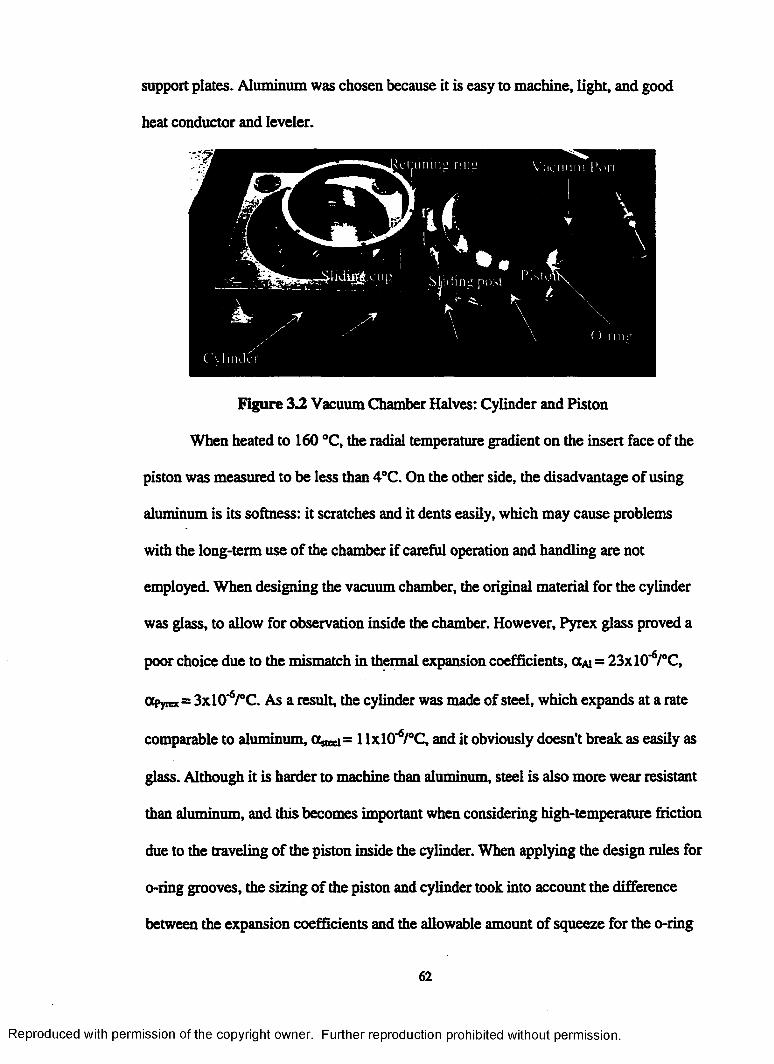
support plates. Aluminum was chosen because it is easy to machine, light, and good
heat conductor and Ieveler.
Figure 3.2 Vacuum Chamber Halves: Cylinder and Piston
When heated to 160 °C, the radial temperature gradient on the insert face of the
piston was measured to be less than 4°C. On the other side, the disadvantage of using
aluminum is its softness: it scratches and it dents easily, which may cause problems
with the long-term use of the chamber if careful operation and handling are not
employed. When designing the vacuum chamber, the original material for the cylinder
was glass, to allow for observation inside the chamber. However, Pyrex glass proved a
poor choice due to the mismatch in thermal expansion coefficients, gcai = 23xlO*6/°C,
otpyiex- 3x1 (I'V e. As a result, the cylinder was made of steel, which expands at a rate
comparable to aluminum, a..~i= 1 lxlO'V’C, and it obviously doesn’t break as easily as
glass. Although it is harder to machine than aluminum, steel is also more wear resistant
than aluminum, and this becomes important when considering high-temperature friction
due to the traveling of the piston inside the cylinder. When applying the design rules for
o-ring grooves, the sizing of the piston and cylinder took into account the difference
between the expansion coefficients and the allowable amount of squeeze for the o-ring
62
Reproduced with permission of the copyright owner. Further reproduction prohibited without permission.
inside its groove. The o-ring material was chosen to be a high-temperature silicone
robber capable of withstanding the elevated temperatures along the piston.
3.4 Hot Embossing Experiments
3.4.1 Substrate preparation
The embossing experiments were carried out using commercially available
polymers, pre-shaped as S3" diameter disks. Before embossing, the molding substrate
needs to be prepared to ensure good replication of the microstructures. The preparation
is done to clean the substrate of dust and small particles, and also to eliminate the
moisture content from the substrate. After removing the protective foil, the substrate
was first cleaned by spraying isopropanol on both surfaces and blowing it dry. It was
found that this cleaning method is better than wiping the surfaces, because it eliminates
the risk of scratching the glass-like surface finish, and it prevents the deposition of
electrostatically-charged lint on the surface to be embossed. Drying the substrates was
done in an air oven at 80 °C, for 4-8 hours. The substrates were then stored under dry
environment inside a desiccator.
3.43 Molding sequence
One of the goals of this research work was to establish a standard embossing
procedure in order to ensure repeatability for the hot embossing process. The
construction of the vacuum chamber, together with deciding on standard mold insert
geometry greatly helped in achieving repeatable embossing results. For the embossing
experiments presented in this work, a hot embossing sequence of operation was
developed to involve the following steps:
• substrate preparation
63
Reproduced with permission of the copyright owner. Further reproduction prohibited without permission.

• substrate mounting
• close vacuum chamber
• place vacuum chamber between the press platens and connect the temperature
gage and the vacuum line
• establish desired temperatures for the insert and the molding substrate
• establish vacuum inside the chamber
• close press and emboss
• open press and demold
• disconnect vacuum chamber and remove it from the press
• open chamber and remove the substrate
• flatten substrate
Mounting of the substrate is done using a retaining ring, as shown in figure 3.2. The
ring fits around and on top of the edge of the plastic disk, and it has the role to secure
the substrate when demolding it from the insert Securing the ring to the bottom plate of
the vacuum chamber is done using six miniature screws. Before closing the vacuum
chamber, the mold insert is conditioned using a mold release agent. The mold release
agent is used to prevent stiction of the plastic to the insert The agent used for
embossing PMMA and PC was a dry film release, sprayable mixture, containing
phosphate esters, polyolefins, and fluoropolymers. This mixture has good heat stability
and it forms a layer that does not transfer onto the molded part. When both the mold
insert and the molding substrate are ready for embossing, the vacuum chamber is
closed, placed between the press platens, and the temperatures are set for both the mold
insert and the substrate. The mold insert temperature is set at a value higher than the
64
Reproduced with permission of the copyright owner. Further reproduction prohibited without permission.
glass transition temperature of the thermoplastic used. At the same time, the
temperature of the substrate is raised, too, but only to a value lower than Tg. This is
done to allow for the desired plastic deformation of the top portion of the substrate, but,
at the same time, preserving the shape of the disk. As it was discussed at the beginning
of this chapter, the deformation of the polymer during embossing is a function of time,
force, and temperature. For a given force, while the mold insert contacts the polymer
during the embossing time and at the embossing temperature, adhesion forces are
developed between the metal and the plastic. These adhesion forces combined with
undesired undercuts on the mold insert, and with friction forces due to mismatch in the
expansion coefficients for plastic and metal lead to difficulties in demolding. The
magnitude of these unfavorable forces can be enough to cause plastic deformation of
the entire substrate upon demolding or it can cause breakage of the molded
microstructures, which remain stuck on the insert Because the substrate has the shape
of a disk held in place by the retaining ring, the stiction forces that are exerted centrally
cause bowing of the disk with the convexity towards the micropattemed side. This
deformation can be recovered entirely after separation, but sometimes it can also be
severe enough to become permanent To avoid such problems from occurring, a
combination of lowest possible insert temperature and shortest embossing time should
be used. This previous assessment is purely qualitative, since the processing values for
embossing time and temperature were only determined experimentally. Another type of
permanent deformation of the substrate is induced by the existence of a temperature
gradient across the thickness of the substrate. This temperature gradient leads to the
formation of a bow in the substrate disk with the concavity towards the micropattemed
65
Reproduced with permission of the copyright owner. Further reproduction prohibited without permission.

side. Although this deformation cannot be avoided when using the PHI press, a post
embossing baking of the part completely eliminates the bow. Thus, after extraction from
the vacuum chamber, two molded parts were clamped back-to-back and were placed
inside a hot-air oven at 85°C, just below the glass transition temperature of PMMA. The
parts were allowed to relax and flatten against each other at this temperature, for 6
hours.
Table 33 Example of Embossing Parameters. Pattern: Micro Heat Exchanger.Embossing Substrate Material: PMMA Max. Aspect ratio: 8:1
Mold Insert temperature, °C 180Substrate temperature*, °C 85Embossing time, min 7Embossing force, N 3780Force raise rate (O-nom.), N/sec 100Demolding temperature- insert, °C 145Demolding temperature- substrate, °C 45
(♦Measured as temperature of the press platen)
3.43 Embossing of PMMA
As mentioned above, the material mostly used for hot embossing of HARMs
was PMMA. Several reasons prompted the use of PMMA as an embossing material,
related to its optical and mechanical properties, as presented in chapter 2. From the
embossing viewpoint, PMMA offers some advantages over other thermoplastics:
• it has a lower Tg than other optically-clear materials such as PC. This makes the
embossing process less difficult, because lower temperatures are employed when
pressing the substrate. Operating the press at lower temperatures is desirable,
because not only the operation of the press and the handling of parts are easier, but
also less thermal stress is imposed on the mold insert and vacuum chamber;
66
Reproduced with permission of the copyright owner. Further reproduction prohibited without permission.

• it has good machinability, allowing for relatively easy post-embossing machining.
One of the collaborative goals of this research was to successfully manufacture a
cross-flow micro heat exchanger. The manufacture of this part involves several
post-embossing machining steps, as it will be shown in the following paragraphs,
and PMMA proved to be a suitable choice;
• PMMA is easier to bond, when compared to other rather inert thermoplastics such
as PE. The microflow elements mentioned above are first molded as open troughs.
Gluing a top over the opened side then closes the troughs. The use of suitable glue
can become an important issue when chemically inert polymers such as polyolefins
(i.e. HDPE) are used for molding, because such polymers are not readily bondable.
hi contrast to HDPE, PMMA is easy to bond due to its chemical structure that offers
active sites for bonding;
• it allows for in situ observation of flow inside microchannels, for embossed parts
such as micro heat exchangers and micro DNA separators. The optical clarity of
PMMA permits not only direct visualization of the flow, but, in the case of DNA
sequencers, it also allows the use of light detectors for determination of changes in
the structure of the flow elements;
However, PMMA has a few shortcomings, too:
• PMMA has a shorter elongation at break compared to PE or PC. This can cause
problems upon demolding, since the molded microstructures can break inside the
metallic pattern before they can be extracted from the mold insert;
Reproduced with permission of the copyright owner. Further reproduction prohibited without permission.
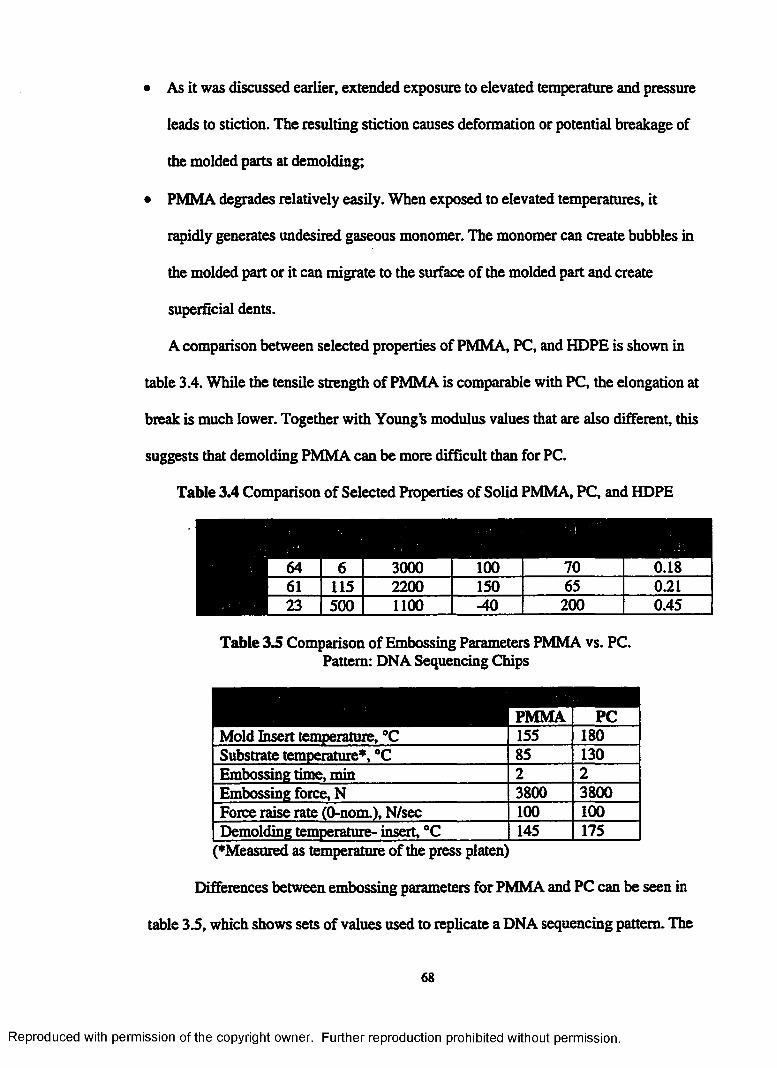
• As it was discussed earlier, extended exposure to elevated temperature and pressure
leads to stiction. The resulting stiction causes deformation or potential breakage of
the molded parts at demolding;
• PMMA degrades relatively easily. When exposed to elevated temperatures, it
rapidly generates undesired gaseous monomer. The monomer can create bubbles in
the molded part or it can migrate to the surface of the molded part and create
superficial dents.
A comparison between selected properties of PMMA, PC, and HDPE is shown in
table 3.4. While the tensile strength of PMMA is comparable with PC, the elongation at
break is much lower. Together with Young’s modulus values that are also different, this
suggests that demolding PMMA can be more difficult than for PC.
Table 3.4 Comparison of Selected Properties of Solid PMMA, PC, and HDPE
64 6 3000 100 70 0.1861 115 2200 150 65 0.2123 500 1100 -40 200 0.45
Table 3.5 Comparison of Embossing Parameters PMMA vs. PC. Pattern: DNA Sequencing Chips
PMMA PCMold Insert temperature, °C 155 180Substrate temperature*, °C 85 130Embossing time, min 2 2Embossing force, N 3800 3800Force raise rate (0-nom.), N/sec 100 100Demolding temperature- insert, °C 145 175
(^Measured as temperature of the press platen)
Differences between embossing parameters for PMMA and PC can be seen in
table 3.5, which shows sets of values used to replicate a DNA sequencing pattern. The
68
Reproduced with permission of the copyright owner. Further reproduction prohibited without permission.
mold insert temperature is over the Tg for the polymer used. The amount exceeding Tg
is less for PC (155-100=55°C) than for PMMA (180-150=30°Q because PC softens
more rapidly with temperature than PMMA. The substrate temperature is less than that
Tg for both polymers.
3.4.4 Examples of molded patterns: Embossing and manufacture of cross flow micro heat exchanger.
One of the research projects at LSU aims at designing, manufacturing, and
testing a micro cross flow heat exchanger. This type of heat exchanger takes advantage
of the small scale of the features to make the heat transfer more efficient. By
constraining the flow to narrow microchannels, the convective resistance at the
solid/fluid interface is reduced, and the heat transfer is enhanced [27]. Also
characteristic for these small heat exchangers are the shorter conduction paths through
micron-sized walls. These advantages, combined with the fact that these types of heat
exchangers have a larger ratio surface area/ volume available for heat transfer, provide
for more efficient heat transfer. Ideally, the heat exchanger would be made of a material
with very good heat-conduction properties. However, to prove the concept and the
design of such a heat exchanger, it was decided to first manufacture it from a polymeric
material- PMMA, via hot embossing. The design and assembly of this device are
described in detail elsewhere [27]. The mold insert used for manufacture was
electroplated as a two-dimensional pattern with features 1000 microns tall and the
narrowest gap of 125 microns. A further machining operation turned the mold insert
into a three-dimensional pattern, by precision machining of the lines corresponding to
the microchannels for liquid flow. Figure 3.3 shows an electron microscope micrograph
of the mold insert after machining.
69
Reproduced with permission of the copyright owner. Further reproduction prohibited without permission.

Figure 33 Mold Insert for Micro Heat Exchanger
Embossing into the insert shown in figure 3.3 results in replication of one half of
the heat exchanger. The complete device is made by assembling face-to-face two such
halves, using alignment pins placed around the micropattem.
Issues related to embossing this pattern were the following:
• possible air entrapment;
• stiction due to large lateral contact area between polymer and metal;
• stiction due to undercuts present on the mold insert;
• bowing of the substrate;
As opposed to other mold insert designs, the pattern shown in figure 3.3 has the
potential to lead to air entrapment upon embossing. As the metallic microstructures are
pushed into the softened plastic, the microgaps between features can become enclosed
in plastic and trap air inside. As a result, this pattern is an example where to prevent this
from occurring the application of vacuum inside the molding chamber was necessary
prior to embossing.
70
Reproduced with permission of the copyright owner. Further reproduction prohibited without permission.

Secondly, the geometry of this mold insert includes a large lateral surface over
which the polymer contacts the metal. As it was presented earlier, the adhesion forces
developed between the PMMA and the metal are proportional to the lateral contact area.
To minimize the stiction, an external mold release agent was used. The mold release has
to be applied homogeneously with special care taken to disperse it into the deep and
narrow microgaps. The mold release used, having the chemical composition described
in the preceding paragraphs, is an aerosol contained in a spray can. It is commercially
available as MoldWiz® F-57NC, manufactured by Axel Laboratories, NY. The
application was done by spraying at an angle of 45°, from 4 different directions.
As mentioned above, a precision machining operation was necessary to generate
the three-dimensional pattern on the insert. The machining was done using a jeweler’s
saw cutting from the original height of the pattern, along the long lines seen in figure
3.3. This operation caused the top of the machined features to present a burr, sometimes
as wide as 75 microns. This undercut was unacceptable for embossing, and it was then
necessary to manually remove this burr, using a razor blade, under the optical
microscope. Removal of the undercuts together with the use of a mold release
minimized the stiction between the substrate and the mold insert However, when
molding the heat exchanger, the adhesion forces are high enough to cause bowing of the
substrate when demolding. This bow cannot be relaxed by immediately heat treating the
substrate because that would require the patterned side of the 5 millimeters thick
substrate to be forced flat, and that would cause distortion of the microstructures.
Although it was formed, the bow did not cause problems in the manufacturing steps
following embossing. Moreover, the bow was ultimately removed by heat-pressing two
71
Reproduced with permission of the copyright owner. Further reproduction prohibited without permission.

halves against each other, but only after the two halves were thinned down to the final
thickness of 850 microns. Figure 3.4 shows a top view of the embossed PMMA part
that represents half of the micro heat exchanger.
Figure 3.4 One Side of Embossed PMMA Micro Heat Exchanger
3.4.5 Examples of molded patterns: DNA sequencing chips
Another type of device manufactured via hot embossing are DNA sequencing
chips. Several of these patterns are designed by different researchers at LSU, but the
general layout is similar to all, and the differences between designs are not significant
from the point of view of the molder. The designs have as centerpiece a long
microchannel for separation of fluid elements based on differential flow. The channel
typically about 100-200 microns tall and 20-30 microns wide. An example of such a
pattern is shown in figure 3.5.
The challenge when embossing such patterns consists in preservation of
structural integrity of the fine continuous vertical strip that forms the microchannels.
The possibility of deforming the tall and thin (aspect ratios of 6:1) microstructures
requires special care when embossing such patterns. As discussed above, successful
72
Reproduced with permission of the copyright owner. Further reproduction prohibited without permission.

S t r i p U>r S e p a r a t i o n
C h a n n e l
tIi
iI
Sn i ]^ s f o r D e t e c t i o n
c h a n n e U
Figure 3.5 SEM Close-up of DNA Sequencing Mold Insert
embossing can be achieved through several combinations of temperature, force, and
time, but in a case like this, it is preferable to specifically maximize the temperature and
increase embossing time. Doing so allows the insert to be pressed slowly into the soft
substrate, protecting the thin microwalls from being deformed. Examples of sets of
parameters for embossing DNA sequencing chips were given in table 3.5.
Figure 3.6 SEM micrograph of Hot Embossed DNA Micropattem
73
Reproduced with permission of the copyright owner. Further reproduction prohibited without permission.
A close-up picture of a region on a DNA chip molded in PMMA by hot embossing is
shown Figure 3.6. As in discussing injection molding results, the observation is made
that the quality of the embossed surfaces depends on the quality of the surfaces of the
mold insertThe micrograph in figure 3.7 is a magnified view of the section of DNA
chip shown in the preceding figure.
Figure 3.7 Detailed View of Embossed Surfaces
In figure 3.7 it can be seen that the appearances of the top and bottom surfaces
of the embossed part are different This can be explained by the fact that the mold insert
used had its surfaces (top and bottom) prepared differently. The bottom surface of the
mold insert was polished before electroplating using sandpaper, thus the uneven,
scattered marks on the top surface of the molded part Correspondingly, the top surface
of the mold insert was finished by a surface grinding operation, which left parallel
marks as seen on the bottom surface of the molded part As for microreplication of
HARMs by injection molding, this observation emphasizes that the mold insert needs to
74
Reproduced with permission of the copyright owner. Further reproduction prohibited without permission.

have a high quality surface finish in order to replicate smooth surfaces on the molded
parts.
3 i Conclusions Hot Embossing
It was shown that hot embossing is a suitable technique for molding HARMs
using mold inserts fabricated by LIGA. The embossing machine used is a standard,
commercially available parallel-plate press requiring a low initial equipment
investment. A vacuum chamber was designed and built to perform the embossing cycle
in a below-atmospheric pressure environment The chamber was designed to accept
standard-size mold inserts, readily exchangeable between the hot embossing machine
and the injection molding machine. The mold inserts used in the experimental work
bear two different patterns; one was used to manufacture a micro cross flow heat
exchanger, and the second pattern was used to mold micro flow elements as part of
DNA sequencing assemblies. Although the overall cycle time is long compared to the
relatively fast cycle time in injection molding, several characteristics of the hot
embossing technique make it advantageous for using it in molding HARMs.
First, the operating temperature on hot embossing is relatively low. The hot
embossing technique employs a pre-shaped polymer substrate. To pattern this substrate
with the desired HARMs design, the molding face of the material is brought at
temperatures above the glass transition value. Examples of sets of operating parameters
for different mold inserts were given throughout this chapter. However, the technique
does not call for the polymer to have a low viscosity, as this requirement exists in
injection molding. Consequently, the temperature of operation in hot embossing is less
extreme, preventing polymer degradation thus unsatisfactory molding results.
75
Reproduced with permission of the copyright owner. Further reproduction prohibited without permission.
Secondly, the hot embossing technique is gentle on the mold inserts. During the
longer cycle times, the operation of the hot embossing press is done by slowly pressing
the mold insert into the soft polymeric substrate. As a result, the chances to deform the
fragile tall and narrow microstructures are minimized. From the experience
accumulated in this work, after over 100 embossing cycles the quality of the molded
parts has been preserved at the original standards. At the conclusion of this work, both
the heat exchanger and the DNA sequencing-type mold inserts have preserved the
original geometry and are schedu^d for continuous use in future molding cycles.
A third advantage of hot embossing is also related to the imposed long cycle
time. Slow operation corresponds to low deformation rates of the polymer substrate.
This not only protects the structural integrity of the mold inserts but it also promotes
molding of stress-free parts. It was discussed that by employing long experimental
times, the value of the Deborah number is maintained low, and the polymer is then
allowed to relax and to conform to the surface of the metallic mold insert.
It was also shown that the hot embossing technique is sensitive to the quality of
the molding substrate and the quality of mold inserts. The PMMA substrates need to be
conditioned prior to molding, as the presence of moisture causes low-quality parts to be
embossed. Also, it was concluded that the surface definition for the molded part
matches the finest imperfections present on the mold inserts. Because hot embossing
results in accurate reproduction of all details, the mold insert needs to be manufactured
with a high surface finish.
76
Reproduced with permission of the copyright owner. Further reproduction prohibited without permission.

CHAPTER 4. COMPARATIVE STUDY HOT EMBOSSING VS. INJECTION MOLDING
4.1 Design of Experiments
Several aspects of injection molding and hot embossing for LIGA were
presented in the previous chapters. In this chapter, a comparison between the two
techniques is presented. The comparison was done through a set of molding
experiments designed and executed using two mold inserts both in injection molding
and in hot embossing.
The planning of the experiments started with the design of the mold insert
pattern. First, it was decided to investigate the effect that the microstructure height will
have on the outcome of the molding process. It was expected that taller or deeper
microstructures would pose more challenges when molding, due to an increase in
vertical aspect ratio. To study that effect, it was planned to manufacture two different
mold inserts, having heights of 200 and 500 microns, respectively. Consequently, the
first factor in the experimental design is mold height.
Next, the effect that the lateral aspect ratio would have on the outcome of the
molding process was considered. At the same height, the comparison between different
lateral aspect ratios is done between microstructures which have one side length in
common or between microstructures that have different side lengths but the same
footprint. Qualitatively, this translates in comparing "short", "long", and "wide”
microstructures among each other. When increasing the lateral aspect ratio by
increasing the length of either one or both sides of a microstructure, the vertical sides of
the microstructure increase in area, which means that the contact surface between
plastic and metal is increased. This also corresponds to an increase in the support area
77
Reproduced with permission of the copyright owner. Further reproduction prohibited without permission.
for the molded microstructure, but at different rates depending if one or both sides are
lengthened. The ratio between the area of the vertical sides (Aw) and the area of the
footprint (Ac) is:
Av _ 2h(l+L)_ 2h A, 1L
i n—■I—1 Lv.
where / is the width of the microstructure, L is the length, and h is the height Assuming
tensile failure only, when separating the molded part from the metallic insert the stiction
forces are opposed by the tensile strength of the microstructure:
Fs = °PKbut
Ft =xyA^
where Oj> is the plastic tensile strength and %, is the shear stress at the polymer/metal
interface. This shows that, for given values of ap and %,, the ratio AJAC dictates the
behavior of the microstructure upon demolding. It was decided for each of the two
inserts (each height), that the pattern should include two types of features: square
features and rectangular features. The square features have two different side lengths,
40 and 160 microns, while the rectangular features have the dimensions 40x640
microns and 160x2560 microns. This results in four possible levels for the shape factor.
Rewriting the AJAC ratio in terms of the basic length /<p40 pm yields:
Ac I0 x y /„
where R =(—+—). The values of the (x;y) pair are as follows: (1:1), (1:16), (4:4), x y
(4:64). A plot of the AJAC ratio versus the cross-sectional area of the microstructure
(footprint) is shown in figure 4.1. In addition, all four shapes were designed to be
78
Reproduced with permission of the copyright owner. Further reproduction prohibited without permission.
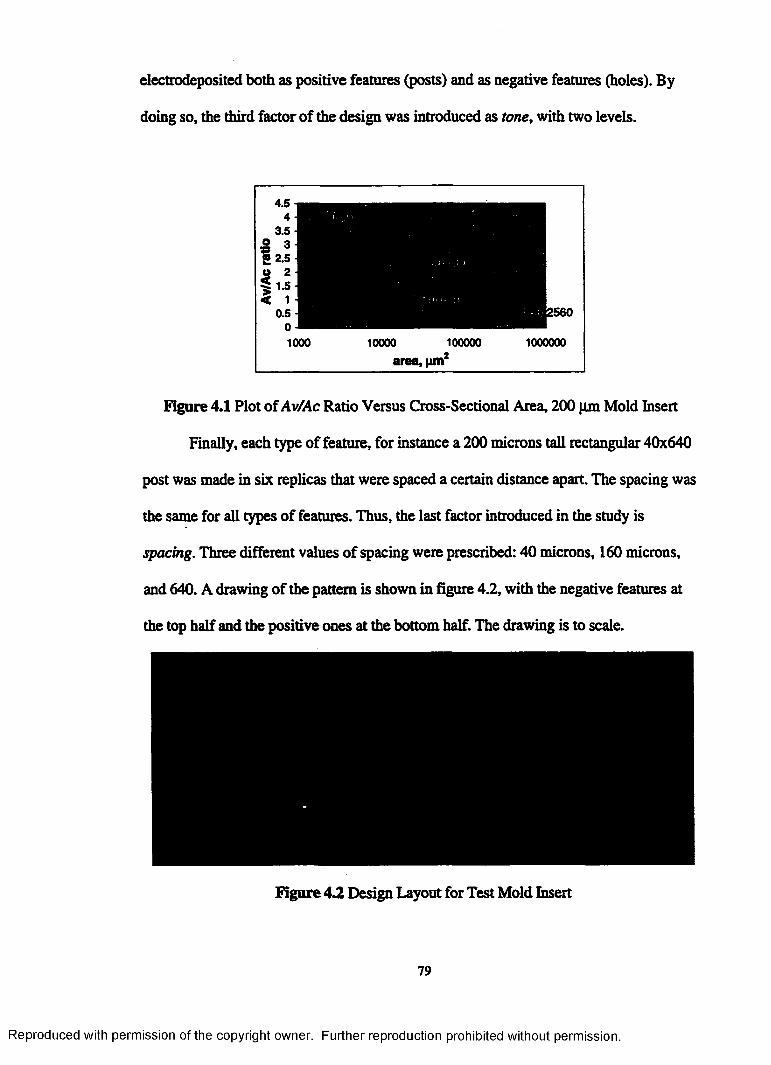
electrodeposited both as positive features (posts) and as negative features (holes). By
doing so, the third factor of the design was introduced as tone, with two levels.
100000010000
Figure 4.1 Plot of Av/Ac Ratio Versus Cross-Sectional Area, 200 pm Mold Insert
Finally, each type of feature, for instance a 200 microns tall rectangular 40x640
post was made in six replicas that were spaced a certain distance apart. The spacing was
the same for all types of features. Thus, the last factor introduced in the study is
spacing. Three different values of spacing were prescribed: 40 microns, 160 microns,
and 640. A drawing of the pattern is shown in figure 4.2, with the negative features at
the top half and the positive ones at the bottom half. The drawing is to scale.
Figure 4.2 Design Layout for Test Mold Insert
79
Reproduced with permission of the copyright owner. Further reproduction prohibited without permission.

4.2 Mold Insert Making
The mold inserts were fabricated using LIGA. The design pattern was first
transferred from a graphical drawing to an optical mask using the pattern generator at
CAMD. The optical mask was then used to pattern an x-ray mask, using the UV-light
source in the Electrical Engineering Dept, LSU. The x-ray mask was made using a
Kapton® membrane, with gold as the x-ray absorber. Next the x-ray mask was used to
pattern two different PMMA substrates, with heights 200 and 500 microns, respectively.
The substrates were first glued onto conductive support plates: the 200 microns PMMA
was glued onto a 4%" stainless steel plate and the 500 microns PMMA was glued onto a
4%" titanium plate pretreated with a thin layer of Ti02. The two support plates are made
of different materials because two different mold-making techniques were employed
when electrodepositing nickel, as it will be discussed later. The two PMMA substrates,
now glued onto their respective base plates, were patterned using x-rays from the
CAMD synchrotron. The x-ray exposure was done through the x-ray mask and an
aluminum filter, using 1.5 GeV radiation, with a bottom dose of 3500 J/cm3. The
PMMA substrates were then developed to remove the exposed polymer, and the
resulting pattern was ready for use as template for electroplating. The electrodeposition
of both mold inserts used a nickel sulphamate solution. The plating bath included,
besides the plating salt, boric acid (as pH buffer) and lauryl sulfate (as wetting agent).
The electroplating was carried out galvanostatically, at 20 mA/cm2, and 55°C. On one
hand, the 200 microns insert was produced by electroplating nickel from the stainless
steel face up and just over the height of the PMMA template. The electroforming step
was then followed by a surface grinding operation performed to remove the "over-
80
Reproduced with permission of the copyright owner. Further reproduction prohibited without permission.
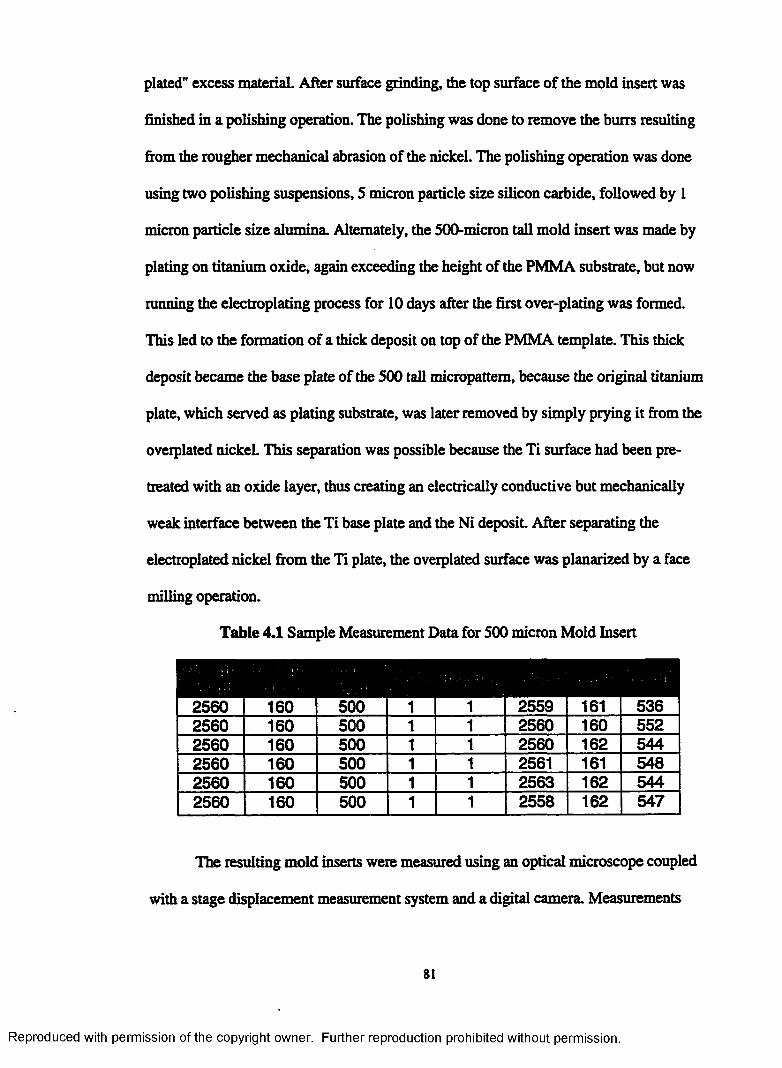
plated" excess material. After surface grinding, the top surface of the mold insert was
finished in a polishing operation. The polishing was done to remove the burrs resulting
from the rougher mechanical abrasion of the nickel. The polishing operation was done
using two polishing suspensions, 5 micron particle size silicon carbide, followed by 1
micron particle size alumina. Alternately, the 500-micron tall mold insert was made by
plating on titanium oxide, again exceeding the height of the PMMA substrate, but now
running the electroplating process for 10 days after the first over-plating was formed.
This led to the formation of a thick deposit on top of the PMMA template. This thick
deposit became the base plate of the 500 tall micropattem, because the original titanium
plate, which served as plating substrate, was later removed by simply prying it from the
overplated nickel. This separation was possible because the Ti surface had been pre
treated with an oxide layer, thus creating an electrically conductive but mechanically
weak interface between the Ti base plate and the Ni deposit After separating the
electroplated nickel from the Ti plate, the overplated surface was planarized by a face
milling operation.
Table 4.1 Sample Measurement Data for 500 micron Mold Insert
2560 160 500 1 1 2559 161 5362560 160 500 1 1 2560 160 5522560 160 500 1 1 2560 162 5442560 160 500 1 1 2561 161 5482560 160 500 1 1 2563 162 5442560 160 500 1 1 2558 162 547
The resulting mold inserts were measured using an optical microscope coupled
with a stage displacement measurement system and a digital camera. Measurements
81
Reproduced with permission of the copyright owner. Further reproduction prohibited without permission.
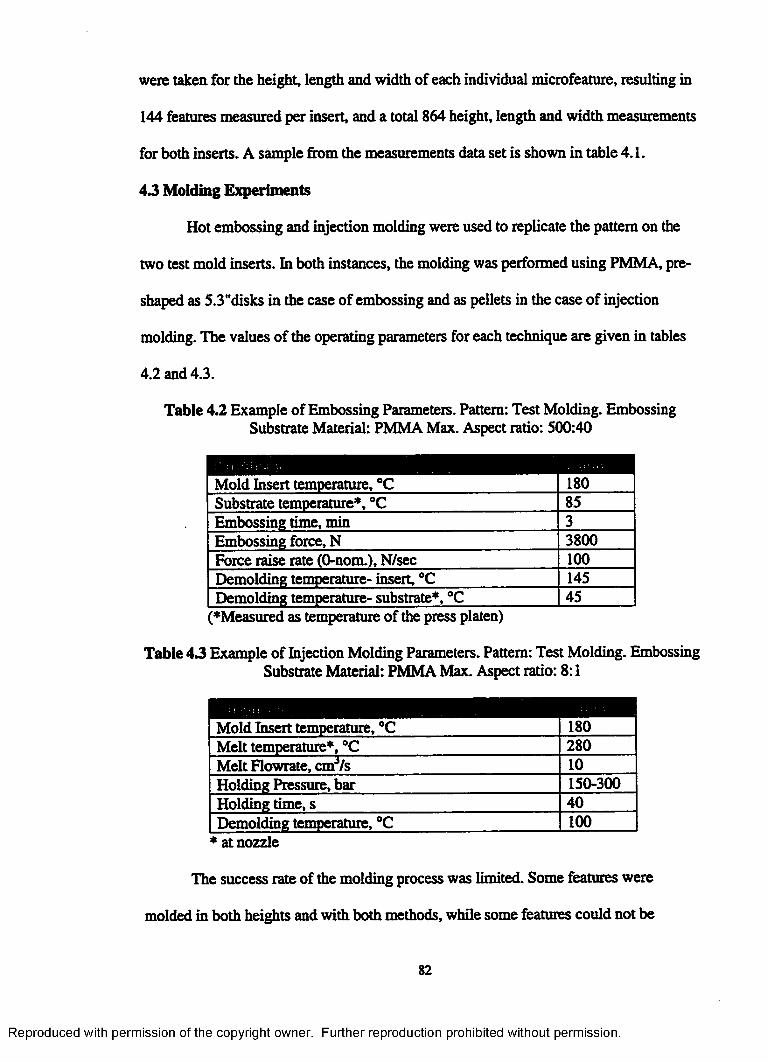
were taken for the height, length and width of each individual microfeature, resulting in
144 features measured per insert, and a total 864 height, length and width measurements
for both inserts. A sample from the measurements data set is shown in table 4.1.
4 3 Molding Experiments
Hot embossing and injection molding were used to replicate the pattern on the
two test mold inserts, hi both instances, the molding was performed using PMMA, pre
shaped as 5.3"disks in the case of embossing and as pellets in the case of injection
molding. The values of the operating parameters for each technique are given in tables
4.2 and 4.3.
Table 4.2 Example of Embossing Parameters. Pattern: Test Molding. Embossing Substrate Material: PMMA Max. Aspect ratio: 300:40
Mold Insert temperature, °C 180Substrate temperature*, °C 85Embossing time, min 3Embossing force, N 3800Force raise rate (0-nom.), N/sec 100Demolding temperature- insert, °C 145Demolding temperature- substrate*, °C 45
(♦Measured as temperature of the press platen)
Table 4 3 Example of Injection Molding Parameters. Pattern: Test Molding. Embossing Substrate Material: PMMA Max. Aspect ratio: 8:1
Mold Insert temperature, °C 180Melt temperature*, °C 280Melt Flowrate, cmVs 10Holding Pressure, bar 150-300Holding time, s 40Demolding temperature, °C 100
♦ at nozzle
The success rate of the molding process was limited. Some features were
molded in both heights and with both methods, while some features could not be
82
Reproduced with permission of the copyright owner. Further reproduction prohibited without permission.

produced using both techniques or both mold inserts. Some features could not be
produced at all. Table 4.4 summarizes the success rate of the molding experiments by
molding method, insert size, tone, feature width and length, and spacing. The light gray
cells are combinations that did not exist as microfeatures on the respective mold inserts
before molding due to imperfections in the mold insert fabrication process. The cells
with white background represent positions where molding was not successful. The cells
with darker background represent combinations that were molded successfully.
Table 4.4 Results of Injection Molding and Hot Embossing Experiments
160x2560 narrow 160x160 narrow1160x160 wide Q H B H B H 160x160 medium
'40X640wfde 160x2560wide 40X640mecflum 160x2560medium!
40x40 narrow 40X640 narrow 40x40 narrow40x40 wide 40x40 medum
40X640 medium40X640wide
160x2560 narrow
holes? S32§1 >— m nACta - . -- ___________ _
40X640wfde ^ ■ ^ ■ § 4 0 X 6 4 0 medium ]
Qualitatively, the results in table 4.4 indicate that the molding of PMMA into
the test pattern under discussion was different with regard to mold insert height. The
success rate for the 200 micron mold insert is higher than the 500 micron insert, both
for injection molding and for hot embossing. As it was presented earlier, the higher (or
deeper) microstructures appear to have been more difficult to be replicated. When
unsuccessful results for the 200 micron and the 500 micron mold inserts are pooled
together per molding method, table 4.4 indicates that the success rate may be regarded
as insensitive to the molding method used, either hot embossing or injection molding.
83
Reproduced with permission of the copyright owner. Further reproduction prohibited without permission.
However, a closer look suggests that hot embossing worked better for the 200 micron
insert, while the 500 micron insert was easier to replicate using injection molding.
Several reasons can be listed to explain this difference between the embossing
results and the injection molding results. The list includes the geometry of the mold
inserts at the top, the difference between the rate of demolding in embossing versus
injection molding, and the existence of a different thermal regime based on different
characteristic dimensions for each type of microstructures. Also, the temperature field
across the mold insert when mounted onto the embossing machine was probably
different versus when mounted in the injection machine.
The top of the mold inserts was examined using a scanning electron microscope.
It was believed that the two inserts had a different appearance at the top, since the
electroplating/polishing were performed differently for each insert. Indeed, SEM
observation of the mold inserts revealed different topographies for the two mold insert
tops. The 200 micron mold insert, because it was only slightly overplated, and the
overplating had to be lapped down by surface grinding, presented a more pronounced
overhang (burr) due to this harsh mechanical abrasion, despite the final polishing
operation that was performed on that surface. This imperfection (burr) was measured to
be around 2-3 microns wide, which made it sizeable when compared with characteristic
widths of 40 microns. Two photographs of the overhang, including the estimate
measurement are shown in figures 4.3 and 4.4.
The image in figure 4.3 shows a 40x640 micron positive feature with a
considerable overhang at the top. The picture was taken after the molding experiments
were complete. It can be seen that the overhang appearance is rounded, indicating that
84
Reproduced with permission of the copyright owner. Further reproduction prohibited without permission.

Figure 4.3. SEM Micrograph o f200 micron Microfeature- Top View
the molded plastic features did not break the overhang upon demolding, but the burr
was bent upwards. Also noticeable are the estimate measurements of the overhang,
shown in figure 4.4. The measurements were taken on a 40x640 micron type feature.
Highlighted at the top of the two pictures are the widths measured between the vertical
lines. It can be seen that the size of the overhang is very large compared to the
characteristic width of 40 microns. For the 500 micron mold insert, the manufacturing
process did not involve overpladng followed by surface grinding. As a result of the way
the insert was made, the electroplated microfeatures did not present a sizable overhang
resulting from mechanical abrasion of the top. A small overhang was, however, noticed
under the SEM, consisting of Ti02 crystals that broke with the Ni plating away from the
TI plating substrate. The size of the overhang for the 500 micron insert was estimated to
be at submicronic level, much smaller than for the 200 micron mold insert
85
Reproduced with permission of the copyright owner. Further reproduction prohibited without permission.

Figure 4.4. SEM Micrograph o f200 micron Estimated Overhang Width
The explanation for the different success rates for injection molding and hot
embossing relative to the two mold insert heights could also be found in the demolding
step. When the mold insert is separated from the molded plastic part, the molded
microstructures are subject to tension forces due to stiction and overhang. Relative to
the rate of separation, the dynamic response of the polymeric material can consist of a
more plastic behavior for a slower rate and more elastic behavior when a faster, more
brisk rate of separation is imposed. It is believed that the demolding mechanism in hot
embossing facilitated the extraction of shorter (200 microns) features from their
corresponding microgaps, despite the presence of the overhang. By separating the two
surfaces very slowly, the polymer was allowed to elongate and slide over the overhang,
and out from the microgap. At the same time, the strength of the plastic feature
overcame the stiction forces that are proportional to lateral surface area. In contrast, the
lateral surface area for the 500 micron insert was large enough to cause the stiction to
exceed the strength of the plastic microfeature, causing them to break despite the slow
separation rate. The opposite is believed to hold true for the injection molding. There,
the demolding was performed at a higher rate, which favored the extraction of the 500
86
Reproduced with permission of the copyright owner. Further reproduction prohibited without permission.

micron features. The rapid separation of the mold insert caused the polymer to respond
in an elastic, stiff manner, overcoming the stiction to the lateral surface, hi contrast, the
rapid separation did not benefit the 200 micron features, where the overhang caused a
sizeable change in cross section; decreasing the total strength of the polymeric features
and causing them to break more often than the 500 micron ones. An example of a field
of molded 200 micron microposts is shown in figure 4.5.
One of the goals of this set of experiments was to quantify the shrinkage that the
plastic microstructures undergo during micromolding. To determine the shrinkage
value, the molded plastic parts were measured using the optical system setup described
before. Each individual microfeature was measured for height, width and length
Width, length, and height measurements taken on the plastic parts were
compared to the same corresponding dimensions on the mold inserts into which the
molding was done. This comparison was reported as a percent change in dimension:
Figure 4.5 Held o f200 Micron Embossed Microfeatures
%change = 100\ ~
87
Reproduced with permission of the copyright owner. Further reproduction prohibited without permission.

where dintm is the dimension on the mold insert and dimp is the measurement on the
molded part Consequently, 288 microfeatures were measured, 72 per insert/technique
combination. From this total, most values for height and width %change were negative,
and could not be used in reporting an overall shrinkage value. Measurements for plastic
posts with positive percent values for width and length were grouped together resulting
in a smaller data set. For this data, the height shrinkage values (some positive, some
negative) were averaged based on the cross sectional geometry. Table 4.S summarizes
the information based on the cross-sectional area of the microposts.. Percent-change
values are reported: also reported in the same table are the values of the Av/Ac ratio, as
plotted in figure 4.1. The data in these two columns are plotted together in figure 4.6.
Table 4.5 %Change for Height and Av/Ac Rationn m■40x40 1600 -3.91 440x640 25600 -3.21 1
160x2560 409600 -2.15 0.5313160x160 25600 -4.71 2.333
As discussed above, the Av/Ac ratio is proportional to the ratio of stiction forces
and tensile strength for a given microstructure. For plastic posts, this ratio is therefore a
predictor of the ease with which microstructures of a given geometry will separate from
the metallic insert (demold). The comparison of the percent change in height and the
Av/Ac values is then justified by the fact that the elongation of microstructures is a
direct result of its tensile response to stiction forces.
88
Reproduced with permission of the copyright owner. Further reproduction prohibited without permission.

cross-sectional area, iim21.00E+02
5.004.00
1.00E+03 1.00E+04 1.00E+05 1.00E+06
S -3.00 no -4.00
-6.00-6.00
figure 4.6 %Change Height and Av/Ac Ratio vs. Cross Sectional Area
An enhanced adhesion between plastic and metal causes the plastic
microstructure to elongate before being demolded from the insert. Values for the Av/Ac
ratio shown in figure 4.6 predict that the more difficult separation thus the greatest
elongation will occur with the 40x40 micron features, followed by the 40x640,
160x160, and 160x2560 features. As predicted by the Av/Ac values, the 40x40
microfeatures did exhibit a high degree of elongation, while the 160x2560 features
exhibited the lowest The intermediate values o f40x640 and 160x160 have reversed
positions on the %change plot, when compared to the Av/Ac values. Also, these values
appear slightly shifted towards higher percent-change relative to the 40x40 features.
This could be explained by the material properties of the polymer at the time of
demolding. Since the narrower 40x640 features cooled down faster than the wider
160x160 ones, the polymer was at a higher temperature in the latter case, thus it
exhibited greater elongation than expected when demolded from the insert. Based on
89
Reproduced with permission of the copyright owner. Further reproduction prohibited without permission.

the same explanation, the 160x2560 microstructures probably had larger elongations
than the Av/Ac values predicted.
Last, but not least, a set of 24 measurements, all with positive %change values,
were averaged for width, length, and height. The averaged values are reported in table
4.6. These values represent the percent change of the corresponding dimension of the
plastic part due to thermal shrinkage, only. As seen, these values are homogeneous
around an overall mean of 1.26%.
Table 4.6 Average Shrinkage Values for LIGA molded HARMs
I 1.73 | 0.96 | 1.07 I
4.4 Conclusions on Comparison between Injection Molding and Hot Embossing
Experiments were planned and performed to compare hot embossing and
injection molding for LIGA HARMS. Two mold inserts bearing the same test pattern
were manufactured in two different heights, 200 and 500 micron. The mold inserts were
manufactured using LIGA: the 200 micron insert was plated on a stainless steel
substrate and the 500 micron insert was manufactured by overplating and debonding
from the original Ti substrate. The overplating was later machined flat to become the
mold insert base. The test pattern on the mold inserts was designed to measure the
influence of height, width, length, spacing and tone on the dimensional change of the
molded plastic microfeatures. The molding experiments yielded mixed results: some
microstructures were molded properly, while others were elongated or broke upon
demolding. The successfully molded microstructures were measured for height, width,
and length and percent change in these dimensions were calculated. The number of
observations gathered was insufficient to perform a complete statistical analysis on the
90
Reproduced with permission of the copyright owner. Further reproduction prohibited without permission.

influence of all factors above-mentioned. However, average shrinkage values could be
and were calculated for the features that were molded correctly. The reported mean
value for the shrinkage was 1.25 %. This value could be used as a design guide when
planning micropattems that require a high degree of control over the dimensions of the
final molded part Qualitative interpretation of the molding results was also done. It was
shown that the success rate for the 200 micron mold insert was higher than that for the
500 micron insert, both for injection molding and for hot embossing. This was assessed
based on the total number of features molded successfully. Also, the molding results
suggested that hot embossing worked better for the 200 micron insert, while the 500
micron insert was easier to replicate using injection molding. This difference was
explained based on the demolding step following immediately after molding. It was
argued that the difference in the dynamic loading of the polymer upon demolding could
offer the explanation for this relationship.
91
Reproduced with permission of the copyright owner. Further reproduction prohibited without permission.

CHAPTER 5. FINAL CONCLUSIONS AND RECOMMENDATIONS
The advent of LIGA is "old news” at the time this work is being written. The
research presented in these pages started with small steps representing some of the
earliest systematic efforts in the US in the field of LIGA and more specifically, molding
for LIGA. Since then, more and more groups have been involved in the development
and application of LIGA for research purposes and, more recently, for commercial use.
Applications of LIGA-manufactured micro components have been marketed or are
currently under development in fields including biomedicine, sensors, actuators, heat
transfer, optics, etc. Moreover, some of the results presented here are currently applied
in the daily activities of a start up company created based on the research work from
LSU’s Microsystem Engineering Team. These developments serve as proof that LIGA
is viewed as a promising technology, which can compete in the market for technologies
used for fabrication of large-area parts covered with micro features.
Molding is the last step in the LIGA manufacturing sequence. Molding gives
LIGA the mass-production character, allowing for production of low-cost parts. The
two molding techniques investigated in this work were injection molding and hot
embossing. Both techniques proved to be suitable for use to reproduce layouts of
micropattems existing on mold inserts manufactured by x-ray exposure of PMMA and
electroplating in the so-produced PMMA templates. The molding research work was
based on two commercially available machines. While the 150-ton injection machine
was already in place before the beginning of the research, the parallel-plate press was
purchased at the start of the investigative efforts in the area of microreplication by hot
embossing. Preliminary experiments with both machines indicated that several
92
Reproduced with permission of the copyright owner. Further reproduction prohibited without permission.

modifications and additions were necessary to adapt the injection machine and the
embossing press for microreplication. For the injection machine, the manufacture of a
suitable mold was pursued including the addition of a vacuum system (needed to
evacuate the air out of the mold cavity prior to injection of the polymer melt), and the
design and manufacture of a heating/cooling system for the mold. Several technical
solutions were investigated for the design of the mold, until a final geometry was
adopted, in relationship with the specific requirements for molding PMMA, as
presented in chapter 2. The resulting mold geometry ensures minimal pressure loss
upstream from the entrance into the mold cavity, together with optimal shape for
molding and demolding PMMA parts.
For the hot embossing press, a vacuum chamber was designed and built to fit
between the press platens. The vacuum chamber contains the embossing sandwich, with
the temperatures of the mold insert and of the substrate controlled through the press’
heating/cooling system. The mold for injection molding and the vacuum chamber for
the hot embossing press were designed to accept the same standard-size mold inserts.
This allows for rapid interchange of mold inserts between the two molding machines.
Experiments were performed to identify the important process parameters in
injection molding of HARMs-pattemed mold inserts. It was established that the
temperature of the mold insert is of primary importance for the process, followed by the
melt flow rate. For the process of hot embossing, it was argued that changes in the
temperature of the substrate have most evident effects on the process, followed by
variations in the embossing force and embossing time. It was shown that the embossing
93
Reproduced with permission of the copyright owner. Further reproduction prohibited without permission.

time should preferably be long, to allow for relaxation of the macromolecular chains
resulting in stress-free moldings.
Regarding the materials for molding, several thermoplastics were used
throughout the experiments. Injection molding was studied using mainly two polymers:
high density polyethylene- HDPE and polymethylmethacrylate- PMMA. Compared to
HDPE, it was shown that PMMA is heat-sensitive, and that it requires special care
including drying before dosage, and dosage under controlled temperature and shear
conditions to prevent molecular degradation. When used in hot embossing, PMMA is
advantageous compared with polycarbonate- PC, because it allows embossing at lower
temperatures. While thermal degradation of PMMA can be avoided more easily in hot
embossing, moisture content still needs to be kept minimal for proper part quality. PC
was used as an alternate embossing material for PMMA. PC also has good optical
properties and is easy to machine and bond. Moreover, its higher glass transition allows
parts molded from PC to be used at temperatures higher than Tg for PMMA, without
softening or deformation of the part Also related to molding materials, it was noted that
successful molding consists of fully penetrating into the microgaps on the mold insert
and also proper demolding of the plastic microstructures from the metallic pattern.
Molding experiments presented in this work confirmed previous research, which
indicated the importance of using a proper demolding agent to facilitate the separation
of the plastic part from the metallic insert Two demolding agents were used: a silicon-
based spray for HDPE, and a mix of phosphate esters, polyolefins, and fluoropolymers
for PMMA and PC.
94
Reproduced with permission of the copyright owner. Further reproduction prohibited without permission.

Several patterns were molded during this research work. Molding of various
new patterns was improved and made faster by the design of standard-size mold insert
geometry. From inception of this work, three micro heat exchanger geometries were
molded (and fabricated for testing), one stacked pattern and two cross flow patterns.
Also, several DNA sequencing chips were microreplicated, using both injection
molding and hot embossing.
The last pattern to be replicated in both molding machines was a test pattern.
This pattern was designed for comparison between techniques performed by molding
into two inserts of different heights (200 and 500 microns) using the same material
(PMMA). Insufficient number of measurements of molded microfeatures could not
provide enough data for a comprehensive statistical analysis to be performed. However,
by measuring all microfeatures molded correctly an overall mean value of 1.25 % was
reported for shrinkage of the plastic compared to the mold insert This value can be used
as a design guide when planning PMMA micropattems that require a high degree of
control over the dimensions of the final molded part Qualitative interpretation of the
molding results showed differences in the demolding success rate between the two
molding techniques combined with the two mold insert heights. These observed
differences were used to emphasize the importance of mold insert quality on the
microreplicated part molded using either injection molding or hot embossing.
As a last consideration to be made at the end of this work, the author believes
that the question "which method is better for microreplication: injection molding or hot
embossing?" does not have a definitive answer. Both methods work, and both methods
present advantages and disadvantages when compared to each other. As discussed
95
Reproduced with permission of the copyright owner. Further reproduction prohibited without permission.

throughout this work, the selection of one method over the other depends on what is to
be molded, in what material, and on how fast and accurate does the microreplication
need to be. Injection molding is a faster technique, but the molding material is
processed under high temperatures and shear rates, which can lead to the chance of
molecular degradation and can leave the part with frozen-in stresses after demolding.
Hot embossing is more attractive for use when sensitive polymers such as PMMA are to
be used, because it avoids the above-mentioned shortcomings. However, it is less
advantageous as a large-scale manufacturing technique due to its longer cycle time.
The recommendations for future work start with this last consideration. A
systematic study of the stresses induced by either technique will illustrate the difference
between the qualities of the molded products made using each technique. The stressed
regions in the molded microstructures are most likely found at the polymer-metal
interface, and would probably be best-detected using optical or electron microscopy
techniques.
A second suggestion for future research would involve the study of the flow of
the polymer inside the microstructures on the mold insert, for both injection molding
and hot embossing. This study would better define the influence of operating
parameters on the molding process, helping to set proper values for accurate control of
injection molding or hot embossing. This study would involve numerical simulations
for the flow, coupled with measurements of pressure and temperature distributions
along the flow path.
96
Reproduced with permission of the copyright owner. Further reproduction prohibited without permission.

REFERENCES
1. Ruprecht R., Kalb H., Kowanz B., and Bacher W„ Molding of IIGA Microstructures from Fluorinated Polymers, Microsystem Technologies 2 (1996) 182-185
2. Bacher W., Menz W., and Mohr J., The LIGA Technique and Its Potential for Microsystems-A Survey, IEEE Transactions on Microelectronics, vol 42 no 5, October 1995;
3. Becker, E.W., Ehrfeld, W., Munchmeyer, D., Betz, H., Heuberger, A., Pongratz, S., Michel H. J., and Siemens, V.R., Production of Separation Nozzle for Uranium Enrichement by a Combination of X-Ray Lithography and Galvanoplastics, Naturwissenshaften, vol 69,1982, p. 520-523;
4. Fasset J., Thin Wall Molding: How Its Processing Considerations Differ From Standard Injection Molding, Plastics Engineering, December ’95,35-37;
5. Christenson T. R., and Guckel H., Deep X-Ray Lithography for Micromechanics, SPIE Proceedings of Micromachining and Microfabrication Process Technology, 23- 24 October 1995, Austin, Texas;
6. Ehrfeld W., Abraham M., Ehrfeld U., Lacher M., and Lehr H., Materials for LIGA Products, Proceedings IEEE Micro Electro Mechanical Systems, Oiso, Japan, January 25-28,1994;
7. Ehrfeld W., Bley P., Gotz F., Hagmann P., Maner P., Mohr A., Moser J., Munchmeyer H. O., Schelb W., Schmidt D., and Becker E.W., Fabrication of Microstructures using the LIGA, presented at Micro Robotsand Teleoperators Workshop, Hyannis, Massachusetts, 1987;
8. Kelly, K., Stephens, S., Kountouris, D., McLean, J., Coynel, J., “Construction and Testing of a Micro Heat Exchanger on the End Face of an Annular Ring”, submitted to the Journal of Microelectromechanical Systems, December 1998.
9. Stephens, S., Kelly, K., Kountouris, D., McLean, J., Coynel, J., “Application of Micro Heat Exchangers to Turbomachinery Components”, submitted to the Journal of Microelectromechanical Systems, December 1998.
10. Madou, M., Fundamentals of Microfabrication, Preprints, Chapter 5: Surface Micromachining;
11. Harmening M, Bacher W., Bley P., El-Kholi A., Kalb H., Kowanz B., Menz W., Michel W., and Mohr J., Molding of Threedimensional Microstructres by the LIGA Proces, Micro Electro Mechanical Systems ’92, Travelmiinde, Germany, February 4- 7,1992;
97
Reproduced with permission of the copyright owner. Further reproduction prohibited without permission.
12. Ruprecht R., Bacher W., HauBelt JH ., and Plotter V., Injection Molding of LIGA and LIGA-Similar Microstructures using Filled and Unfilled Thermoplastics, Proceedings at the SPIE Micromachining and Microfabrication Process Technology, 23-24 October 1995, Austin Texas;
13. Breuer P., Microinjection Molding From CDs to Implants, Miniature Parts are Key to Developing Microsystems, Modem Plastics, Mid-November 1995 d84-D85;
14. Rahner S., and Neilley R, Microparts: Market growing, Parts Shrinking, Injection Molding, October 1998,150-152;
15. Arburg Allrounder9 CMD with Dialogica® Control, User’s Manual
16. Despa, M., Injection Molding of High Aspect Ratio Microstructures, A Thesis, Louisiana State University, May 1998
17. Rosato D.V. and Rosato D. V., Injection Molding Handbook, Second Edition, Chapman & Hal, 1995;
18. Vardeman, S. B., VanValkenburg, E. S., Two-way Random Effects Analyses and Gauge R&R Studies, Technometrics, August 1999, Vol. 41, No.3;
19. Becker H., Heim u, Polymer High Aspect Ratio Microstructures Fabricated with hot embossing, Jenoptik Mikrotechnik Technical Report
20. Madou, M., Fundamentals of Microfabrication, Chapter 6:LIGA, CRC Press, 1997;
21. Xia Y., McClelland J. J., Gupta R., Qin D., Zhao X-M., Sohn L., Celotta R. J., and Whitesides G. M., Replica Molding Using Polymeric Materials: A Practical Step Toward Nanomanufacturing, Advanced Materials, No. 2,9,1997
22. Bird R. B., Stuart W. E., and Ligtfoot E. N., Transport Phenomena, John Wiley & Sons, 1960;
23. Bley P., Menz W., Bacher W., Feit K., Harmening M., Hein H., Mohr J., Scomburg W. K., and Stark W., Application of the LIGA Process in Fabrication of Three- Dimensional Mechanical Microstructures; Proceedings of 1991 International MicroProcess Conference, 384-389;
24. Both A., Bacher W., Heckele M., Muller K.D., Ruprecht R., and Strohmann M., Molding Process with High Alignment Precision for the LIGA Technology, Proceedings TF.F.F. Micro Electro Mechanical Systems, Amsterdam, the Netherlands, February2,1995;
98
Reproduced with permission of the copyright owner. Further reproduction prohibited without permission.

25. Tadmor Z. and Gogos C.G., Principles of Polymer Processing, John Wiley and Sons Inc, 1979;
26. Jenoptik Mikrotech GmbH Inetmet Webpage, http://www.jo- mikrotecbnik.com/english/indexJitml;
27. Harris C., Despa M., and Kelly K., Design and Fabrication of Cross-flow Micro Heat Exchanger, Journal of MEMS, Vol. 9, December 2000.
99
Reproduced with permission of the copyright owner. Further reproduction prohibited without permission.
VITA
Mircea was bom on August 18th 1969, in Ploiesti, Romania. Between 1983 and
1987, he was enrolled at the “Mihai Viteazul” high school, in the mathematics and
physics section. During the same time, he played team-handball at the “C.D. Gherea”
sports club and became national vice-champion in 1984.
In July 1987, he was admitted at the “Politechnica” University of Bucharest.
Before starting college, he served in the Romanian Army for the required 9 months of
military service. Then, he enrolled as a freshman in September 1988. He married
Simona in November 1992. In July 1994 he graduated from U.P.B with a degree in
Chemical Engineering with concentration in Polymer Science.
After graduation, he was accepted a position as a research engineer at the
National Romanian Oil Institute. He maintained the same position until his departure to
Louisiana State University.
Mircea enrolled as a graduate student in the Department of Chemical
Engineering at L.S.U. in August 1995. His research focused on the manufacture of
microstructures and their replication by plastic molding. After defending his thesis in
1998, he continued to work towards his doctorate degree with Dr. Kevin Kelly as
graduate advisor. In May 2001, he will be conferred the degree of Doctor of
Philosophy.
Reproduced with permission of the copyright owner. Further reproduction prohibited without permission.

DOCTORAL EXAMINATION AND DISSERTATION REPORT
C a n d id a te : Mircea S. Despa
M a jo r F ie ld : Engineering Science
T i t l e o f D is s e r ta t io n : Molding Large Area Plastic Parts Coveredwith HASMs
A p p ro ved :
Ma j o r P r o fe e a i
''G rad u a te*'S ch o o l
EXAMINING COMMITTEE:
D a te o f » » M < n a t io n :
December 4, 2000
Reproduced with permission of the copyright owner. Further reproduction prohibited without permission.