Embed Size (px)
Citation preview
University of Tennessee at Chattanooga MOLAR RATIO STUDY FOR THE REACTION OF
FREE FATTY ACIDS WITH METHANOL TO FORM FATTY ACID METHYL ESTERS OR BIODIESEL FUEL
by
Trip Dacus ENCH 435
Course: Ench435 Section: 001 Date: 11/17/2009 Instructors: Jim Henry, Tricia Thomas, Frank Jones
Introduction During a time of foreign fuel dependency and high green house gas emissions, it is
imperative for the US to develop a biofuel that can alleviate economic and environmental
pressures. Biodiesel, a fuel made from plant and animal oils, uses domestic feedstock for
production and recycles CO2 previously released during combustion. Currently biodiesel
is produced from food oils using homogenous base catalysts in a batch reaction process.
The creation of significant byproducts, the displacement of a food source, and the batch
nature of this process make biodiesel an expensive fuel alternative.
In other areas of the biodiesel project, pure metal and metal oxide catalysts were tested in
order to develop a heterogeneous, continuous flow process. It was found that several
vegetable oils can be successfully converted to biodiesel using these metal and metal
oxides at low temperatures (see Appendix A). Use of the novel catalysts did not create
unwanted byproducts that require purification. Successful catalysts also create biodiesel
at low temperatures for a variety of vegetable oils containing traditional impurities such
as free fatty acids.
Free fatty acids traditionally cannot be used as a feedstock for commercial biodiesel
production since it almost exclusively converts to soap in the presence of a base catalyst.
Since our system does not use base catalysts, free fatty acids were able to be successfully
converted to biodiesel without the formation of soap byproducts. In order for further
experimentation on free fatty acids to continue, it was necessary to determine the proper
molar ratio of methanol and free fatty acids to use in order to optimize conversion to
biodiesel.
Objective
The purpose of this experiment is to determine the proper molar ratio of methanol and
free fatty acids to use in order to optimize conversion of these reactants into biodiesel.
The methanol and free fatty acid are to be reacted in a 4:1, 12:1, and 24:1 ratio at 120oC
in the presence of nickel (II) oxide in 1.5mL stainless steel vials for a 1.5 hour residence
time. A nuclear magnetic resonance machine will be used to analyze the product mixture
and determine percent conversion to biodiesel.
Background and Theory
Reaction Chemistry
Free fatty acids or FFA, such as oleic acid which can be seen below in Figure 1, are
saturated or unsaturated hydrocarbon chains linked to a carboxylic acid. They are
considered an impurity in various food and fuel industries since they form from the
degradation of triglycerides or pure food oils. A typical triglyceride molecule can be seen
below in Figure 2. R1, R2, and R3 represent the three hydrocarbon chains similar to that of
oleic acid.

Figure 1 – Free Fatty Acid1
Figure 2 – Triglyceride1
Both free fatty acids and triglycerides can be used as a feedstock for biodiesel production.
However, in the presence of a base catalyst, free fatty acid converts to soap instead of the
biodiesel molecule. As a result, feedstock oil streams must be purified of free fatty acids
in order to be used as a feedstock for biodiesel in current industrial processes. A soap
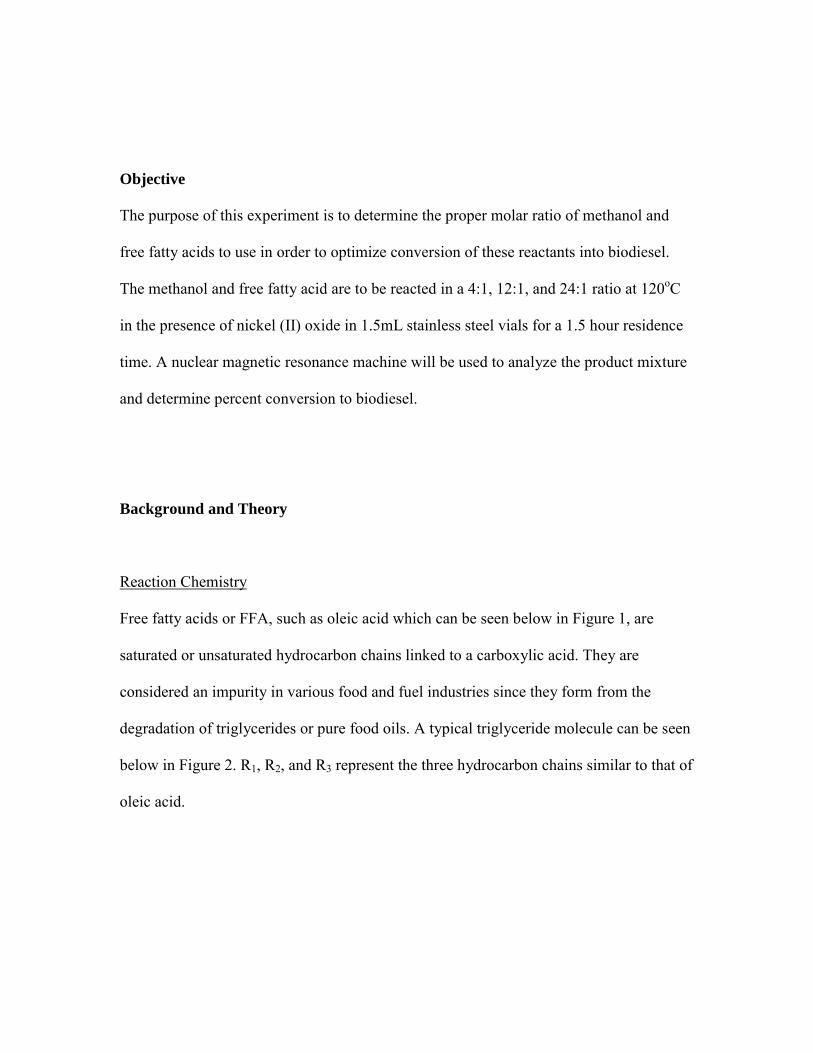
molecule can be seen in Figure 3. When the positive ion from the base catalyst, in this
case Na, dissociates, it reacts with FFA to form soap. Since soap is soluble in both polar
and non polar liquids, it is a difficult impurity to separate from product streams and
increases the processing time and costs for biodiesel production.
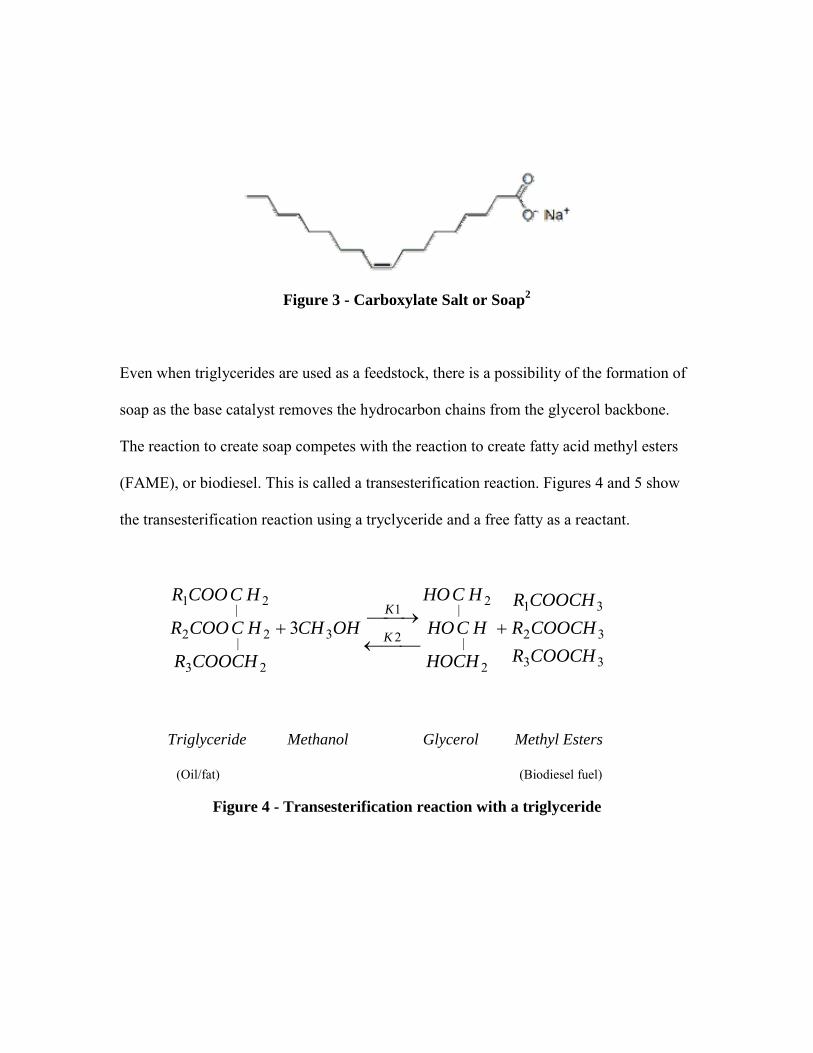
Figure 3 - Carboxylate Salt or Soap2
Even when triglycerides are used as a feedstock, there is a possibility of the formation of
soap as the base catalyst removes the hydrocarbon chains from the glycerol backbone.
The reaction to create soap competes with the reaction to create fatty acid methyl esters
(FAME), or biodiesel. This is called a transesterification reaction. Figures 4 and 5 show
the transesterification reaction using a tryclyceride and a free fatty as a reactant.
33
32
31
2
|
2|
2
1
3
23
2|
2
2|
1
3COOCHRCOOCHRCOOCHR
HOCH
HCHO
HCHO
OHCH
COOCHR
HCCOOR
HCCOOR
K
K+
⎯⎯←⎯→⎯+
Triglyceride Methanol Glycerol Methyl Esters
(Oil/fat) (Biodiesel fuel)
Figure 4 - Transesterification reaction with a triglyceride

Figure 5 – Transesterification reaction with a free fatty acid
In previous studies using soybean oil as a triglyceride feedstock, it was found that metal
and metal oxide catalysts were able to successfully create FAME without the formation
of soap byproducts since there were no positive ions in the reactant feed. Further studies
showed that free fatty acids could also be used as a reactant without the formation of
soap. Therefore, it can be concluded that free fatty acids do not have to be purified out of
a reactant feed for a process using solid, heterogeneous catalysts, nor do product streams
have to be purified of soap byproducts.
This is a great advantage for future biodiesel production since free fatty acids are a major
component of many waste oils such as restaurant waste grease and trap grease from water
processing plants that were previously unused in the industrial production of FAME. In
the United States, 2.75 billion lbs of waste recyclable restaurant oil grease and 11.64
billion lbs of animal fat (such as poultry fat) are produced annually. “Yellow grease” or
restaurant waste grease has a 15wt% FFA composition and costs between $0.01 to $0.07
324
3
3 RCOOCHOHOHCH K
K
+⎯⎯←⎯→⎯
+
Oleic Acid Methanol Water Methyl Ester (FFA)
per pound. “Brown grease” or trap grease from water processing plants has a 6 to 15wt%
FFA composition and costs between $0.09 to $0.20 per pound.3 Due to their high FFA
content, these waste oils are either purified or not used in industrial biodiesel production.
Use of heterogeneous catalysts allows for FFA to be used in feedstocks without
purification making these inexpensive feedstocks a feasible alternative for biodiesel
production.
Tall oil was used as the primary source of FFA for the molar ratio study. It is comprised
of mostly oleic acid which is the hydrocarbon shown in Figure 5.
Nuclear Magnetic Resonance Spectroscopy
NMR spectroscopy utilizes the magnetic properties of nuclei in order to determine the
composition and properties of organic chemical samples. Proton or hydrogen nuclei
exhibit either an α or a β spin state that will align with or against a strong, external
magnetic field. When a radiation energy is introduced to the aligned nuclei that are equal
to the energy difference between the two spin states, the spin of the nuclei will flip. This
radiation energy is in the radio frequency of the electromagnetic spectrum, and nuclei that
absorb this radiation are said to be “in resonance” with the applied energy. Detectors
within the NMR instrument can sense when this electromagnetic energy is being
absorbed, and the resulting plot of absorption for different electromagnetic frequencies is
what is used to analyze the chemical sample.
The greater the magnetic field that the sample is exposed to is, the greater the resolution
of the instrument. In UTC’s chemistry department, they use a 10 tesla NMR to perform
their resonance analysis. To put in perspective how strong of a field this is, a typical
household bar magnet usually creates a 0.001 tesla magnetic field. UTC’s NMR utilizes
helium cooled (between 4 and 2 K) superconductors to generate its powerful magnetic
field. Further use of shimming coils ensures the proper shape of the magnetic field that
the chemical sample is exposed to.
The electron cloud in surrounding nuclei acts as a shield from the applied magnetic field.
This shielding effect causes different protons to absorb different levels of radiation
depending on the electron density of the surrounding nuclei. As a result, the frequency of
absorption can be linked with different atomic structures. Samples are solvated in a
variety of liquids for analysis such as D2O (water with deuterium nuclei) and
deuterochloroform (CDCl3). The deuterium present in these solvents respond to a known
radio frequency and can be used as a reference point for the rest of the resonance peaks in
the chemical sample. The samples are then spun along their axis so that the position of
molecules within the sample can be averaged which increases the overall resolution of
the spectrum. The sample is then exposed to an electromagnetic pulse containing a wide
range of frequencies, and the protons absorb a specific frequency according to their
resonance. The intensity of the frequency absorbed by the protons then decay over time,
and a computer converts this data into an intensity-verses-frequency plot called a Fourier
Transform.
The NMR resonance signals are measured according to a “chemical shift” from a
reference compound such as tetramethylsilane or TMS. This chemical shift is calculated
by dividing the distance in hertz downfield from the reference compound by the
operating frequency of the spectrometer and is measured in parts per million or ppm.
Dueterochlorophorm was used as the analytical solvent for the FFA molar ratio study.
The acyl group present in both FFA and FAME shields surrounding protons and causes
the chemical shift used to determine percent conversion to products. The two protons that
bond to the carbon that is at the beginning of the hydrocarbon chain in FFA exhibit a
chemical shift of 2.2ppm in the presence of dueterochlorphorm. The three protons on the
methyl group of FAME exhibit a chemical shift of 3.6ppm in the presence of
dueterochlorophorm.
As FFA converts to FAME, the 2.2ppm protons next to the acyl group do not react and
are present in both reactant and product molecules. This peak in the NMR spectra will
remain unchanged regardless of the percent conversion to FAME. The 3.6ppm peak
corresponding to the methyl ester group only exists in the FAME molecule. The Jeol
software that performs the Fourier transform on the NMR spectra is able to integrate the
peaks that correspond to the various chemical shifts. When the area under the 3.6ppm
peak is compared to that of the 2.2ppm peak, percent conversion to FAME can be
calculated. For 100% conversion, the area under the 3.6ppm peak will be in a 3:2 ratio to
that of the 2.2ppm peak since the protons are at a 3:2 ratio in the FAME molecule.
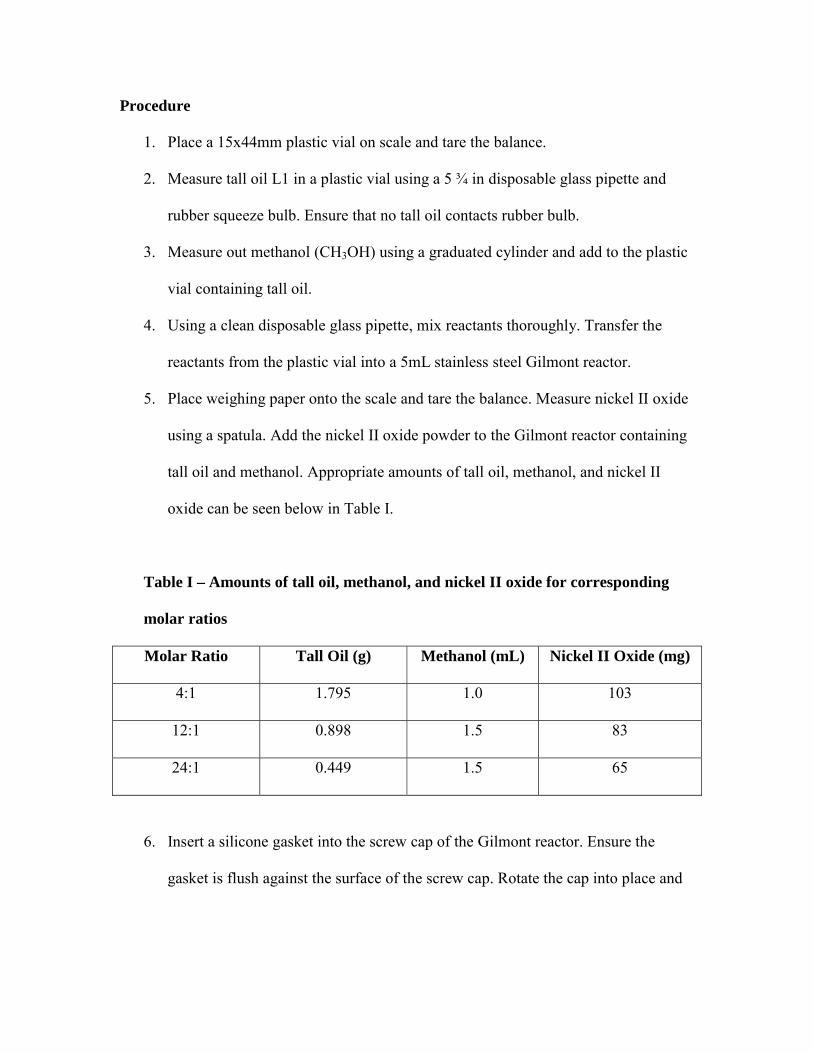
Procedure
1. Place a 15x44mm plastic vial on scale and tare the balance.
2. Measure tall oil L1 in a plastic vial using a 5 ¾ in disposable glass pipette and
rubber squeeze bulb. Ensure that no tall oil contacts rubber bulb.
3. Measure out methanol (CH3OH) using a graduated cylinder and add to the plastic
vial containing tall oil.
4. Using a clean disposable glass pipette, mix reactants thoroughly. Transfer the
reactants from the plastic vial into a 5mL stainless steel Gilmont reactor.
5. Place weighing paper onto the scale and tare the balance. Measure nickel II oxide
using a spatula. Add the nickel II oxide powder to the Gilmont reactor containing
tall oil and methanol. Appropriate amounts of tall oil, methanol, and nickel II
oxide can be seen below in Table I.
Table I – Amounts of tall oil, methanol, and nickel II oxide for corresponding
molar ratios
Molar Ratio Tall Oil (g) Methanol (mL) Nickel II Oxide (mg)
4:1 1.795 1.0 103
12:1 0.898 1.5 83
24:1 0.449 1.5 65
6. Insert a silicone gasket into the screw cap of the Gilmont reactor. Ensure the
gasket is flush against the surface of the screw cap. Rotate the cap into place and
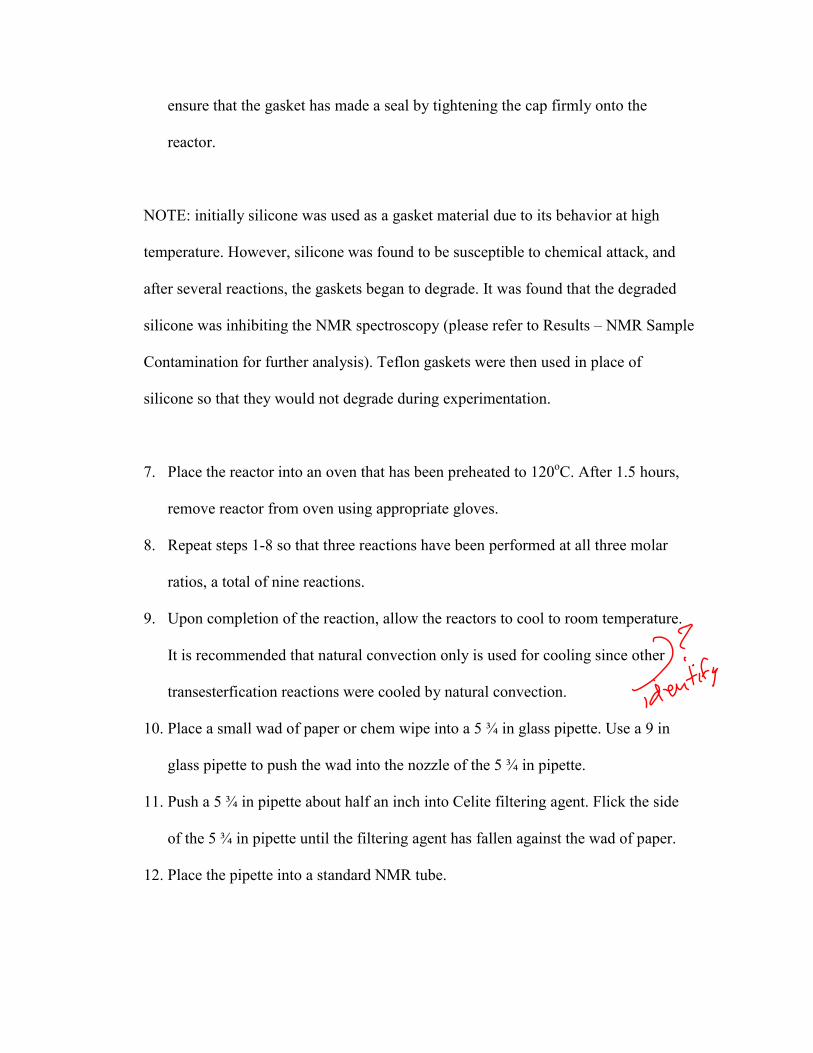
ensure that the gasket has made a seal by tightening the cap firmly onto the
reactor.
NOTE: initially silicone was used as a gasket material due to its behavior at high
temperature. However, silicone was found to be susceptible to chemical attack, and
after several reactions, the gaskets began to degrade. It was found that the degraded
silicone was inhibiting the NMR spectroscopy (please refer to Results – NMR Sample
Contamination for further analysis). Teflon gaskets were then used in place of
silicone so that they would not degrade during experimentation.
7. Place the reactor into an oven that has been preheated to 120oC. After 1.5 hours,
remove reactor from oven using appropriate gloves.
8. Repeat steps 1-8 so that three reactions have been performed at all three molar
ratios, a total of nine reactions.
9. Upon completion of the reaction, allow the reactors to cool to room temperature.
It is recommended that natural convection only is used for cooling since other
transesterfication reactions were cooled by natural convection.
10. Place a small wad of paper or chem wipe into a 5 ¾ in glass pipette. Use a 9 in
glass pipette to push the wad into the nozzle of the 5 ¾ in pipette.
11. Push a 5 ¾ in pipette about half an inch into Celite filtering agent. Flick the side
of the 5 ¾ in pipette until the filtering agent has fallen against the wad of paper.
12. Place the pipette into a standard NMR tube.
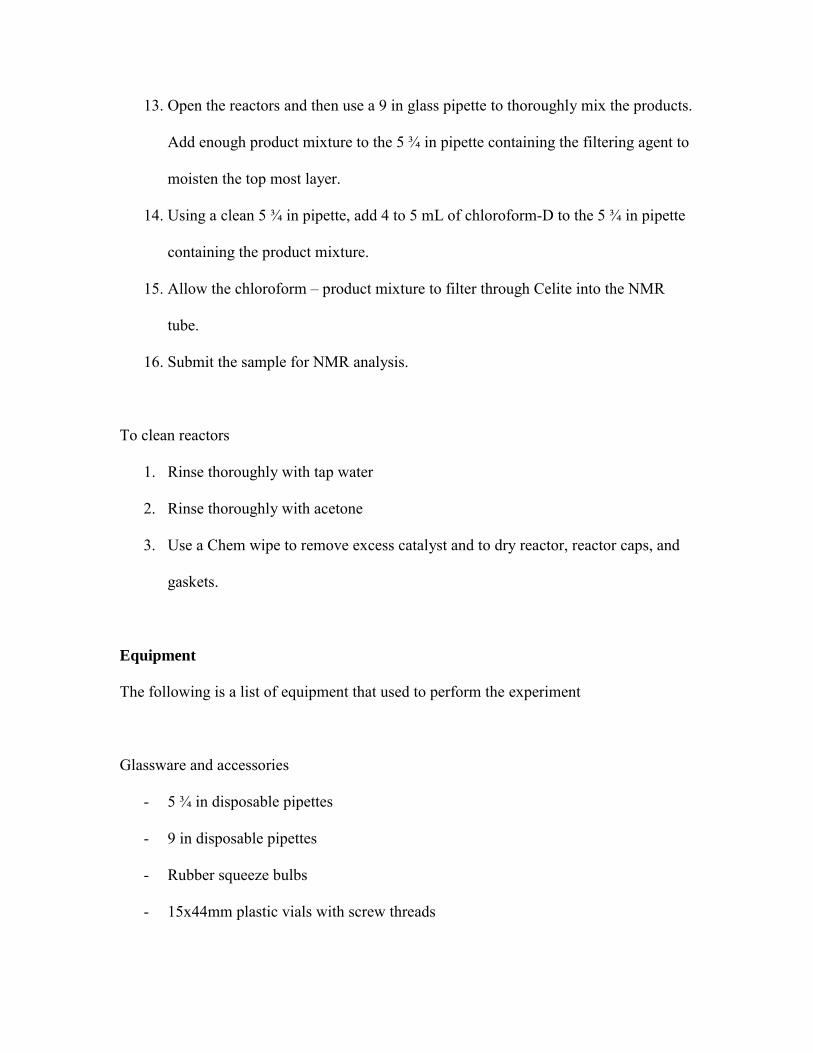
13. Open the reactors and then use a 9 in glass pipette to thoroughly mix the products.
Add enough product mixture to the 5 ¾ in pipette containing the filtering agent to
moisten the top most layer.
14. Using a clean 5 ¾ in pipette, add 4 to 5 mL of chloroform-D to the 5 ¾ in pipette
containing the product mixture.
15. Allow the chloroform – product mixture to filter through Celite into the NMR
tube.
16. Submit the sample for NMR analysis.
To clean reactors
1. Rinse thoroughly with tap water
2. Rinse thoroughly with acetone
3. Use a Chem wipe to remove excess catalyst and to dry reactor, reactor caps, and
gaskets.
Equipment
The following is a list of equipment that used to perform the experiment
Glassware and accessories
- 5 ¾ in disposable pipettes
- 9 in disposable pipettes
- Rubber squeeze bulbs
- 15x44mm plastic vials with screw threads
- NMR sample tubes
- NMR sample tube caps
- NMR tube stand
- 10mL graduated cylinder
Reactants and chemicals
- Celite filtering agent
- Nickel II oxide catalyst powder
- Tall Oil 1% rosen composition
- Laboratory grace methanol reagent
- Acetone and acetone bottle
Miscellaneous equipment
- 15mL Gilmont stainless steel reactors
- Silicone gaskets
- Teflon gaskets
- Chem wipes
- Balance with 0.1 mg accuracy
- Oven with 200oC heating capability
- Insulated gloves for handling hot reactors
- Chemical sample labels
Results
NMR Sample Contamination
In order to better seal the stainless steel reactors used for chemical analysis, silicone
gaskets were used in place of the original plastic gaskets supplied by Gilmont. Silicone
was used since it behaves well at high temperatures and its behavior as an elastomer
creates a seal for the reactors. After several reactions, it was found that the silicone
gaskets began to degrade due to chemical attack from the reactants. Eventually they were
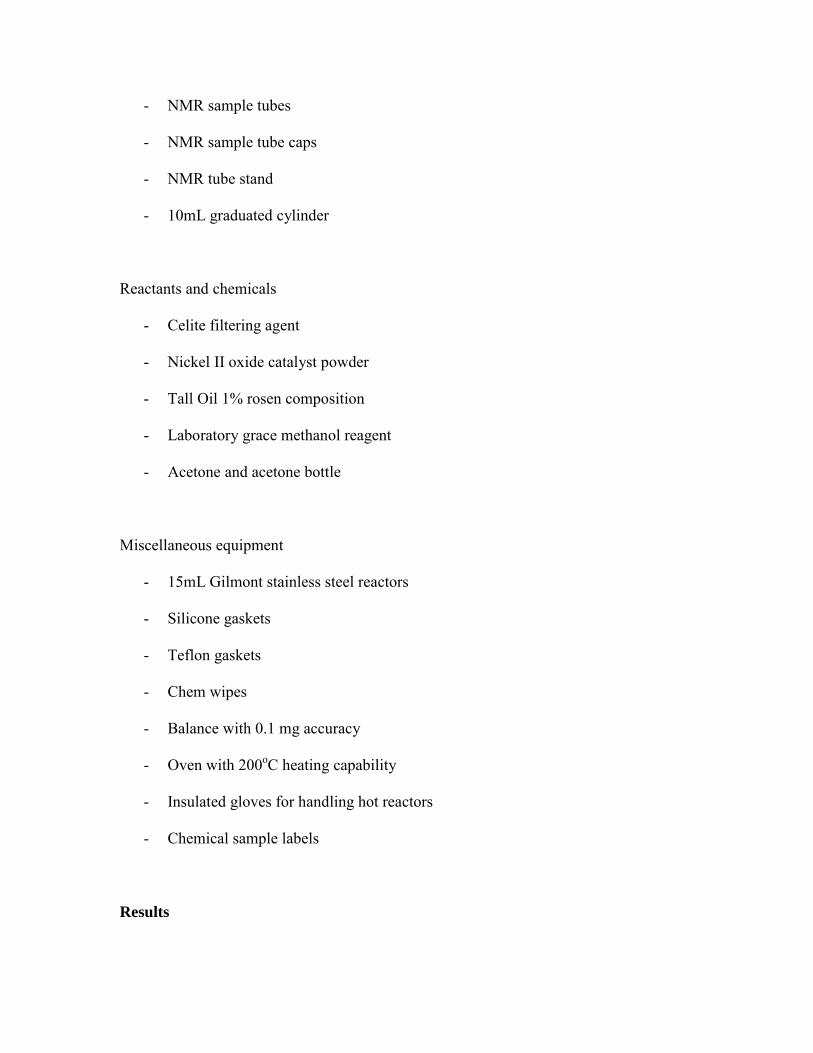
replaced with Teflon gaskets that were able to resist chemical attack. Figure 6 below
shows a picture of a degraded silicone gasket and an intact Teflon gasket. Initially this
did not pose a problem, since the reactions with triglycerides still had a proper seal and
the NMR spectroscopy did not show any contamination in the product mixture.
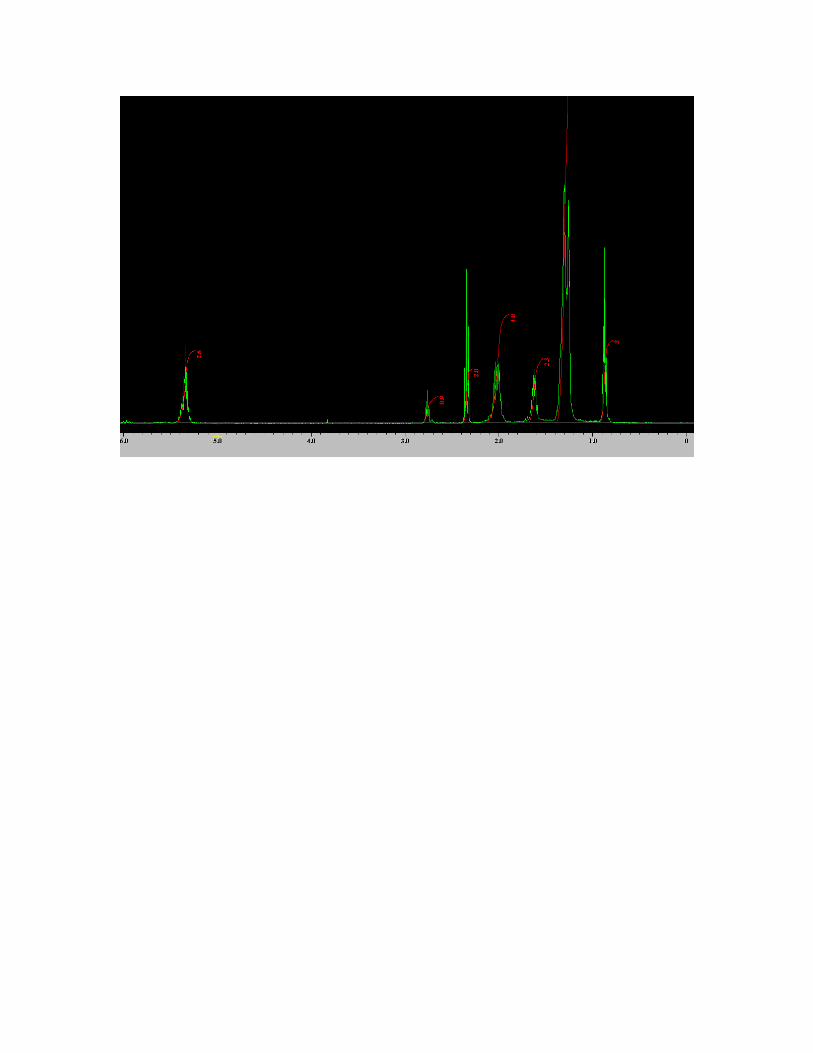
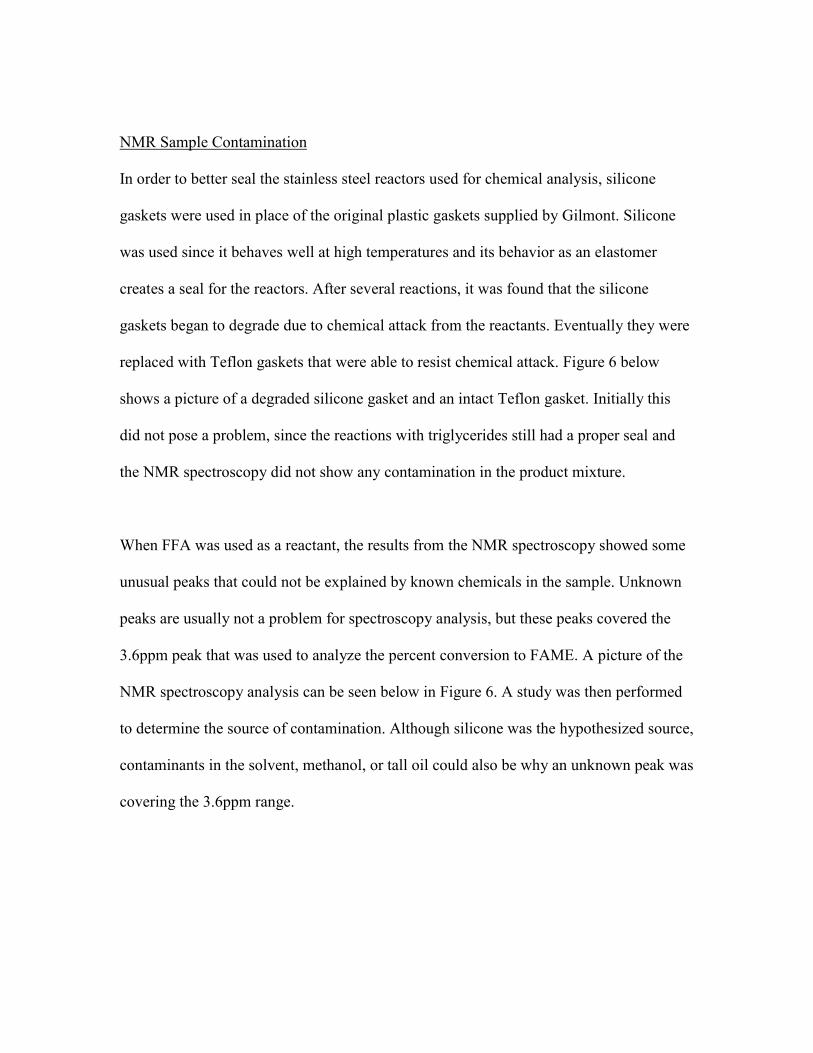
When FFA was used as a reactant, the results from the NMR spectroscopy showed some
unusual peaks that could not be explained by known chemicals in the sample. Unknown
peaks are usually not a problem for spectroscopy analysis, but these peaks covered the
3.6ppm peak that was used to analyze the percent conversion to FAME. A picture of the
NMR spectroscopy analysis can be seen below in Figure 6. A study was then performed
to determine the source of contamination. Although silicone was the hypothesized source,
contaminants in the solvent, methanol, or tall oil could also be why an unknown peak was
covering the 3.6ppm range.
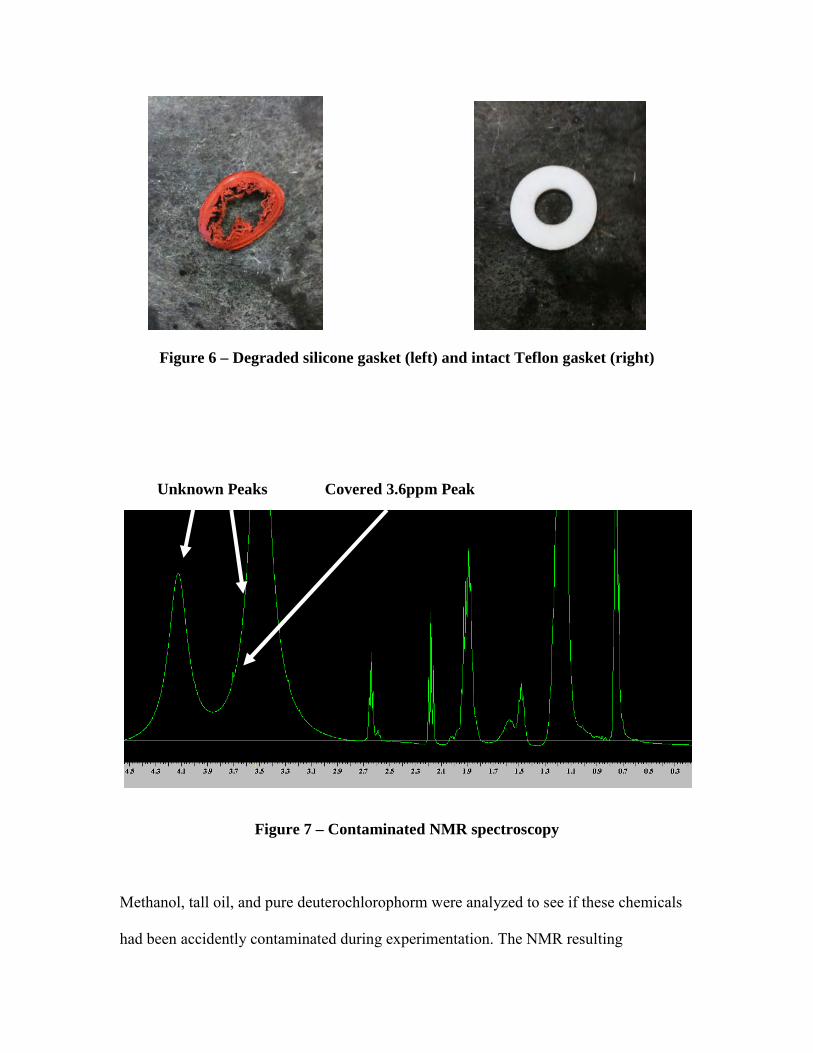
Figure 6 – Degraded silicone gasket (left) and intact Teflon gasket (right)
Figure 7 – Contaminated NMR spectroscopy
Methanol, tall oil, and pure deuterochlorophorm were analyzed to see if these chemicals
had been accidently contaminated during experimentation. The NMR resulting
Unknown Peaks Covered 3.6ppm Peak
spectroscopy of these materials showed that there were no unknown materials present.
NMR spectra for pure methanol and tall oil can be found in Appendix B. An NMR was
also run on an un-reacted methanol, tall oil mixture that to see if mixing these products
resulted in any spectroscopy abnormalities. Figure 7 below shows the NMR spectroscopy
for the un-reacted methanol, tall oil mixture.
Figure 8 – NMR spectroscopy of un-reacted methanol, tall oil mixture
Figure 7 shows no unknown peaks around the 3.6ppm shift. The small peak that does
exist at the 3.6ppm shift is a side band from the 3.4ppm methanol peak, and is the result
of improper magnetic coil shimming in the NMR. These side bands were unable to be
removed throughout the experimentation, but they did not inhibit the ability to determine
percent conversion to FAME. The same un-reacted mixture was then washed over one of
the degraded silicone gaskets to see if exposure to the gasket resulted in an unknown
peak. Figure 8 below shows the NMR spectroscopy after the mixture was washed over
the degraded silicone gasket.
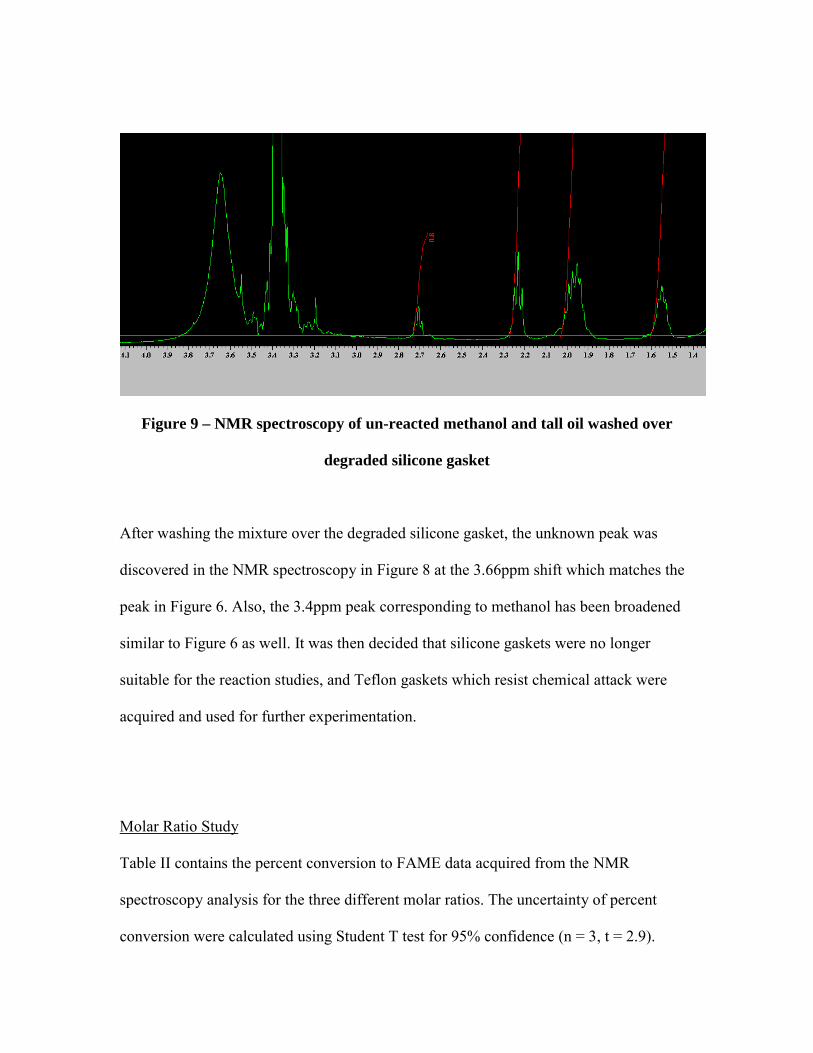
Figure 9 – NMR spectroscopy of un-reacted methanol and tall oil washed over
degraded silicone gasket
After washing the mixture over the degraded silicone gasket, the unknown peak was
discovered in the NMR spectroscopy in Figure 8 at the 3.66ppm shift which matches the
peak in Figure 6. Also, the 3.4ppm peak corresponding to methanol has been broadened
similar to Figure 6 as well. It was then decided that silicone gaskets were no longer
suitable for the reaction studies, and Teflon gaskets which resist chemical attack were
acquired and used for further experimentation.
Molar Ratio Study
Table II contains the percent conversion to FAME data acquired from the NMR
spectroscopy analysis for the three different molar ratios. The uncertainty of percent
conversion were calculated using Student T test for 95% confidence (n = 3, t = 2.9).
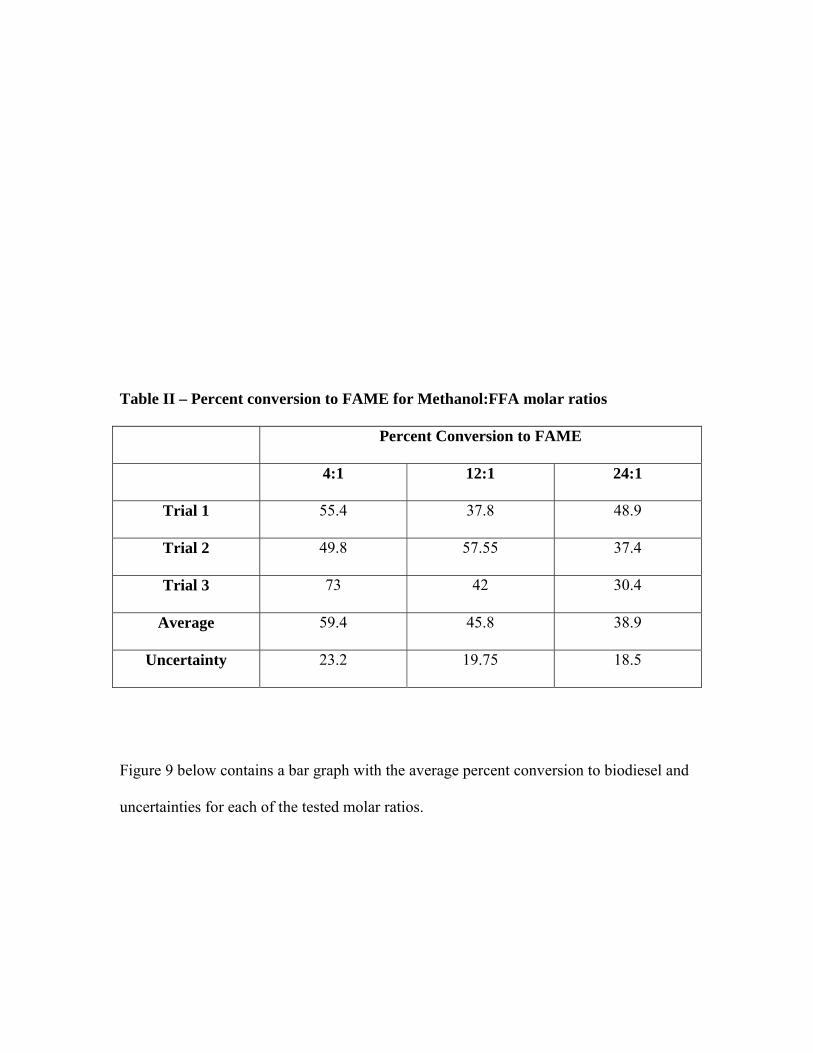
Table II – Percent conversion to FAME for Methanol:FFA molar ratios
Percent Conversion to FAME
4:1 12:1 24:1
Trial 1 55.4 37.8 48.9
Trial 2 49.8 57.55 37.4
Trial 3 73 42 30.4
Average 59.4 45.8 38.9
Uncertainty 23.2 19.75 18.5
Figure 9 below contains a bar graph with the average percent conversion to biodiesel and
uncertainties for each of the tested molar ratios.
4to1
12to1
24to1
0
10
20
30
40
50
60
70
80
90
Percent Conversion
(%)
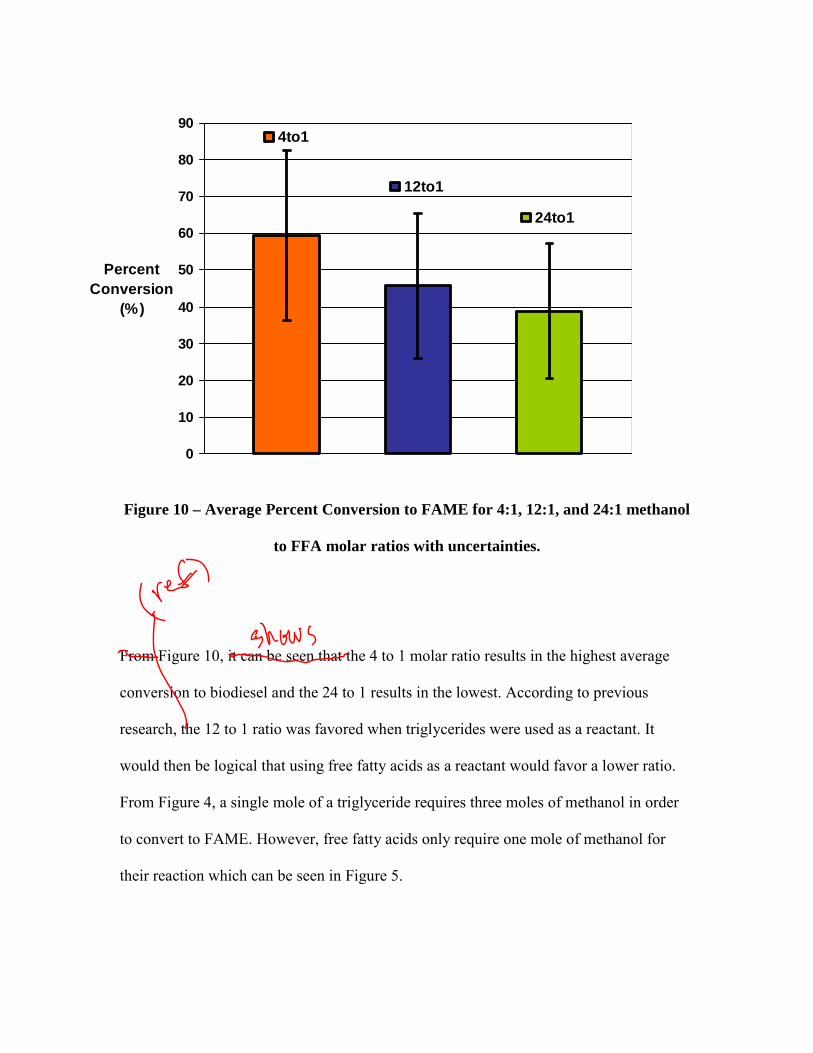
Figure 10 – Average Percent Conversion to FAME for 4:1, 12:1, and 24:1 methanol
to FFA molar ratios with uncertainties.
From Figure 10, it can be seen that the 4 to 1 molar ratio results in the highest average
conversion to biodiesel and the 24 to 1 results in the lowest. According to previous
research, the 12 to 1 ratio was favored when triglycerides were used as a reactant. It
would then be logical that using free fatty acids as a reactant would favor a lower ratio.
From Figure 4, a single mole of a triglyceride requires three moles of methanol in order
to convert to FAME. However, free fatty acids only require one mole of methanol for
their reaction which can be seen in Figure 5.

Although Figure 10 shows that the 4 to 1 average percent conversion is higher, it is
important to note that both the 12 to 1 and 24 to 1 average conversions are contained
within the uncertainty of the 4 to 1 ratio. From a statistical standpoint, it cannot be
concretely confirmed that the 4 to 1 ratio is the most favorable due to the large degree of
uncertainty in this ratio’s percent conversion to FAME. However, the nature of this study
is to determine a favorable ratio with the understanding that other ratios may behave
similarly. If future experiments are to optimize conversion to FAME using FFA as a
reactant, this study would then recommend using a 4 to 1 ratio with respect to FFA as a
reactant.
In addition to this, the 4 to 1 ratio has a much higher viscosity than the 12 to 1 and the 24
to 1 mixtures. This intuitively is due to the low viscosity of methanol, which makes
mixtures with higher ratios of methanol less viscous. Viscosity can play a significant role
in industrial processing since many operations that require pumps to supply a flow rate of
fluids have a limited range of viscosity in which they are allowed to operate. In these
applications, it can be said that increasing the molar ratio of methanol to FFA can help to
reduce the viscosity of the reactant feed without significantly affecting the percent
conversion to FAME.
Conclusions
The 4 to 1 methanol to free fatty acid ratio exhibits the highest percent conversion to fatty
acid methyl esters when compared to 12 to 1 and a 24 to 1 ratios. The average percent
conversion of both the 12 to 1 and the 24 to 1 ratios fell within the uncertainty of the 4 to
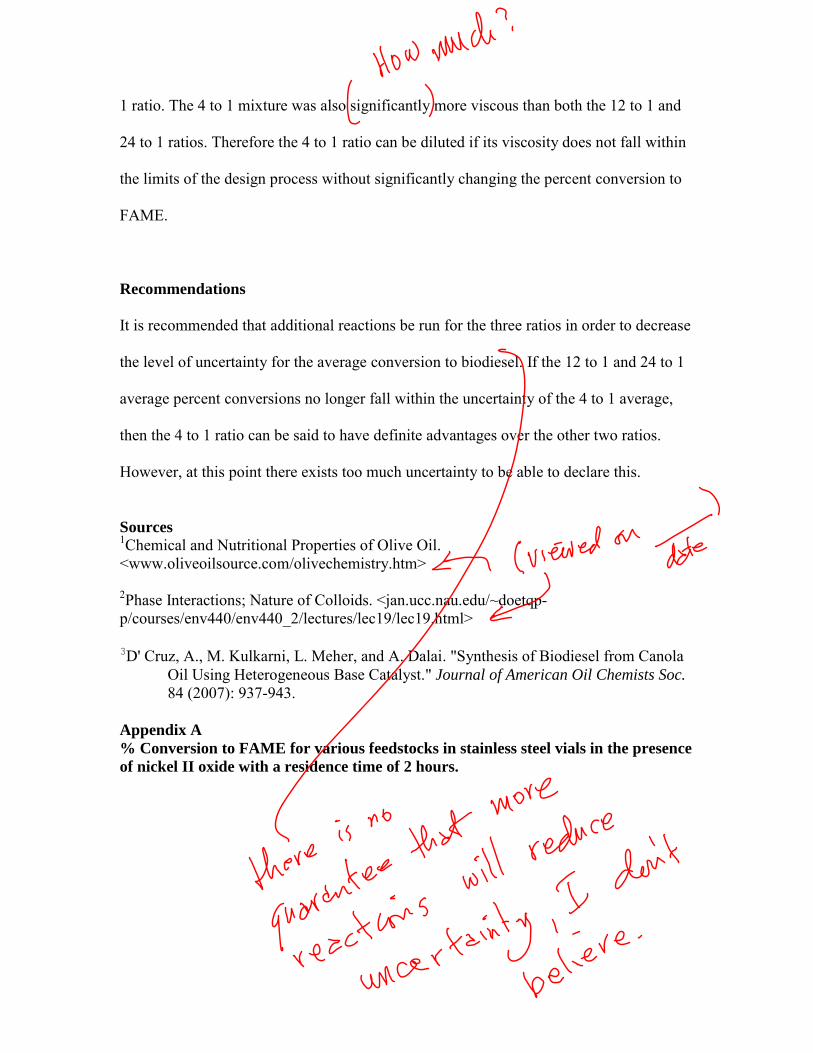
1 ratio. The 4 to 1 mixture was also significantly more viscous than both the 12 to 1 and
24 to 1 ratios. Therefore the 4 to 1 ratio can be diluted if its viscosity does not fall within
the limits of the design process without significantly changing the percent conversion to
FAME.
Recommendations
It is recommended that additional reactions be run for the three ratios in order to decrease
the level of uncertainty for the average conversion to biodiesel. If the 12 to 1 and 24 to 1
average percent conversions no longer fall within the uncertainty of the 4 to 1 average,
then the 4 to 1 ratio can be said to have definite advantages over the other two ratios.
However, at this point there exists too much uncertainty to be able to declare this.
Sources 1Chemical and Nutritional Properties of Olive Oil. <www.oliveoilsource.com/olivechemistry.htm> 2Phase Interactions; Nature of Colloids. <jan.ucc.nau.edu/~doetqp-p/courses/env440/env440_2/lectures/lec19/lec19.html> 3D' Cruz, A., M. Kulkarni, L. Meher, and A. Dalai. "Synthesis of Biodiesel from Canola
Oil Using Heterogeneous Base Catalyst." Journal of American Oil Chemists Soc. 84 (2007): 937-943.
Appendix A % Conversion to FAME for various feedstocks in stainless steel vials in the presence of nickel II oxide with a residence time of 2 hours.
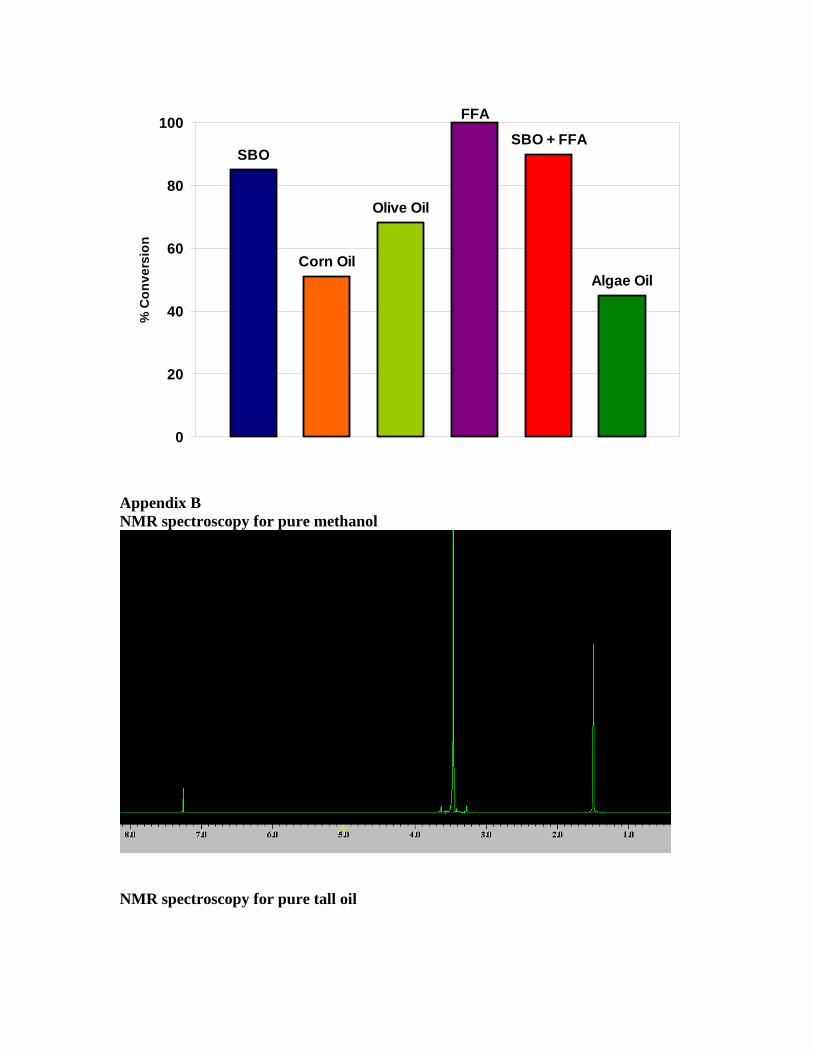
SBO
Corn Oil
Olive Oil
FFA
SBO + FFA
Algae Oil
0
20
40
60
80
100%
Con
vers
ion
Appendix B NMR spectroscopy for pure methanol
NMR spectroscopy for pure tall oil