Embed Size (px)
Citation preview

Defence R&D Canada – Atlantic
DEFENCE DÉFENSE&
Mössbauer effect and X-ray diffraction
studies of Fe100-xGax films prepared by
combinatorial methods
Norman C. Deschamps and Richard A. DunlapDalhousie University
Department of Physics and Atmospheric ScienceDalhousie UniversityHalifax, Nova Scotia B3H 3J5
Project Manager: Richard A. Dunlap, (902) 494-2394
Contract Number: W7707-052899/001/HAL
Contract Scientific Authority: Dr. Shannon P. Farrell, (902) 427-3437Defence Scientist, Emerging Materials Section
Terms of Release: The scientific or technical validity of this Contract Report is entirely the responsibility of thecontractor and the contents do not necessarily have the approval or endorsement of Defence R&D Canada.
Terms of Release: The information contained herein is proprietary to Her Majesty and is provided to the recipienton the understanding that it will be used for information and evaluation purposes only. Any commercial useincluding use for manufacture is prohibited. Release to third parties of this publication or information containedherein is prohibited without the prior written consent of Defence R&D Canada.
Contract Report
DRDC Atlantic CR 2005-171
November 2005
Copy No.________
Defence Research andDevelopment Canada
Recherche et développementpour la défense Canada

This page intentionally left blank.
Mössbauer effect and X-ray diffraction studies of Fe100-xGax films prepared by combinatorial methods
Norman C. Deschamps, Richard A. Dunlap Dalhousie University
Department of Physics and Atmospheric ScienceDalhousie University Halifax, Nova Scotia Canada B3H 3J5
Project Manager: Richard A. Dunlap (902) 494-2394
Contract number: W7707-052899/001/HAL Contract Scientific Authority: Dr. Shannon P Farrell (902) 427-3437 Defence Scientist, Emerging Materials Section The scientific or technical validity of this Contractor Report is entirely the responsibility of the contractor and the contents do not necessarily have the approval or endorsement of Defence R&D Canada.
The information contained herein is proprietary to Her Majesty and is provided to the recipient on the understanding that it will be used for information and evaluation purposes only. Any commercial use including use for manufacture is prohibited. Release to third parties of this publication or information contained herein is prohibited without the prior written consent of Defence R&D Canada.
Defence R&D Canada – Atlantic
Contract Report DRDC Atlantic CR 2005-171 November 2005


Abstract
This research was conducted by Norman Deschamps and Richard Dunlap of Dalhousie University (Department of Physics and Atmospheric Science) to evaluate the combinatorial synthesis and characterization approach for the development of Fe-Ga alloys. Binary combinatorial thin films of Fe100-xGax with a range of 0 < x < 36 at. % Ga were made using a sputtering approach. The films were analyzed using microprobe, XRD and Mössbauer spectroscopy, all of which were designed to allow for rapid measurements of the combinatorial systems. Microprobe data confirmed that a linear change in gallium composition was achieved along the length of each film. XRD analysis showed a disordered bcc structure for the film, for all compositions, and exhibited no evidence for occurrence of the D03 phase at increased Ga content. Lattice parameters for the thin films increased with increasing gallium, showing the same trend as seen in the literature, but with decreased lattice parameters. Mössbauer spectroscopy confirmed the lack of a D03 phase, and showed a steady increase of two or more gallium atom nearest neighbours for each Fe site past x = 22. Future work will include measurement of the magnetostrictive and physical properties of the combinatorial thin films.
Résumé
Les travaux de recherche qui font l’objet du présent rapport ont été exécutés par Norman Deschamps et Richard Dunlap, du département de physique et des sciences de l’atmosphère de l’Université Dalhousie. Ils avaient pour but d’évaluer l’efficacité des techniques combinatoires de synthèse et de caractérisation appliquées à l’élaboration d’alliages de Fe-Ga. On a préparé des couches minces de l’alliage binaire de composition Fe100-xGax, où 0 < x < 36 % atomique de Ga, en utilisant des techniques combinatoires de pulvérisation. Les films obtenus ont été analysés à l’aide d’une microsonde et de techniques spectroscopiques (diffraction des rayons X et mesure de l’effet Mössbauer), qui ont été optimisées afin de permettre la mesure rapide de certains paramètres des échantillons produits par des techniques combinatoires. Les données recueillies à l’aide de la microsonde confirment la présence d’une variation linéaire de la teneur en gallium en fonction de la position longitudinale sur le film. Les résultats obtenus par diffraction des rayons X (XRD) révèlent la présence d’une structure désordonnée (ou structure aléatoire) du type bcc dans tous les films de compositions différentes, mais ne permettent pas de déceler la présence d’une phase du type D03 dans le cas des compositions à teneur élevée en Ga. On a observé une augmentation des paramètres de maille des couches minces en fonction de l’accroissement de la teneur en Ga; cette tendance est compatible avec les résultats rapportés dans certaines publications sur le sujet, les valeurs correspondantes étant toutefois toujours inférieures. Les résultats de spectroscopie Mössbauer confirment l’absence de la phase du type D03 et de plus, ils indiquent que dans le cas des compositions où x est supérieur à 22, il
DRDC Atlantic CR 2005-171 i

existe un accroissement régulier d’au moins deux atomes de gallium constituant des voisins immédiats de chaque atome de fer. Les futurs travaux comprendront la mesure des propriétés magnétostrictives et physiques des couches minces d’alliages obtenues à l’aide de techniques combinatoires.
ii DRDC Atlantic CR 2005-171

Executive summary
Introduction: Rare earth magnetostrictive materials, such as Terfenol-D, have been widely used as actuator/sensor materials. Unfortunately, these materials tend to be expensive and brittle. Non-rare-earth based materials such as iron-based alloys are attractive alternatives as they are less expensive and more robust, machinable and formable. Norman Deschamps and Richard Dunlap of Dalhousie University (Department of Physics and Atmospheric Science) were contracted to assess the combinatorial approach for rapid fabrication and characterization of Fe-Ga alloys.
Significance: The combinatorial approach provided a means to rapidly explore and map the magnetic and crystallographic structures of the Fe-Ga binary system. This is an integral step to identification and selection of compositions of Fe-Ga for application as actuator or sensor materials for use by the Canadian Forces.
Results: The combinatorial materials approach is an effective means to economically and efficiently produce thin film libraries of Fe-Ga compositions. Characterization of the films showed that composition varied linearly with position on the film and that all compositions have the disordered bcc structure, consistent with other material fabrication techniques. No evidence was found for the presence of the ordered D03 phase, that diminishes the magnitude of the magnetostriction, but 57Fe Mössbauer spectra clearly suggest the presence of Ga clustering that may act as a precursor to D03 formation.
Future Plans: Evaluation of magnetostriction on the as-received and heat treated films will commence shortly. In addition, the effects of elemental substitutions to Fe and Fe-Ga based-films will be studied for improvement of magnetostriction, formability and other key properties.
Deschamps, N. and Dunlap, R.A. 2005. Mössbauer effect and X-ray diffraction studies of Fe1-xGax films prepared by combinatorial methods. DRDC Atlantic CR 2005-171. Defence R&D Canada – Atlantic.
DRDC Atlantic CR 2005-171 iii

Sommaire
Introduction : Les matériaux magnétostrictifs à base de terres rares tels que le Terfenol-D sont couramment utilisés comme matériaux d’actionneurs et de détecteurs. Malheureusement, les matériaux de ce type sont souvent coûteux et fragiles. Les matériaux à base d’éléments autres que les terres rares, par exemple les alliages ferreux, constituent d’intéressants produits de substitution, car ils sont moins coûteux, plus résistants et plus faciles à usiner et à former. On a accordé un contrat à Norman Deschamps et Richard Dunlap, du département de physique et des sciences de l’atmosphère de l’Université Dalhousie, afin qu’ils exécutent des travaux d’évaluation des techniques combinatoires comme outils de production rapide et de caractérisation des alliages de Fe-Ga.
Importance des résultats : L’utilisation de techniques combinatoires constitue un moyen rapide d’étudier l’alliage binaire Fe-Ga et d’en déterminer les structures magnétiques et cristallographiques. Ces techniques constituent des éléments clés dans le processus d’identification et de sélection des compositions de Fe-Ga qui pourraient être utilisées dans les matériaux d’actionneurs et de détecteurs présentant un intérêt pour les Forces canadiennes.
Résultats : Les techniques combinatoires de production de matériaux constituent des moyens efficaces et économiques d’obtenir des ensembles de couches minces d’alliages de Fe-Ga de compositions différentes. La caractérisation des films produits indique que la composition varie linéairement en fonction de la position sur le film et que toutes les compositions d’alliages possèdent une structure désordonnée (ou structure aléatoire) du type bcc; ces résultats sont compatibles avec ceux obtenus à l’aide d’autres techniques de fabrication de matériaux. Il n’existe aucune donnée confirmant la présence de la phase de structure ordonnée du type D03, qui réduit l’importance de la magnétostriction des matériaux, mais les spectres Mössbauer du 57Fe semblent indiquer assez clairement la présence d’agrégats de Ga, lesquels peuvent servir de précurseurs à la formation d’une structure du type D03.
Futurs projets : Des travaux portant sur l’évaluation de la magnétostriction de films non traités et traités thermiquement seront amorcés sous peu. On étudiera aussi les effets de la substitution des éléments dans les films d’alliages à base de Fe et de Fe-Ga afin d’améliorer certaines propriétés clés des matériaux, entre autres la magnétostriction et l’aptitude au formage.
Deschamps, N. et Dunlap, R.A. 2005. Étude de films de Fe100-xGax préparés par des méthodes combinatoires à l’aide de la mesure de l’effet Mössbauer et de la diffraction des rayons X. RDDC Atlantique CR 2005-171. R & D pour la défense Canada – Atlantique.
iv DRDC Atlantic CR 2005-171
Table of contents
Abstract........................................................................................................................................ i
Executive summary ................................................................................................................... iii
Sommaire................................................................................................................................... iv
Table of contents ........................................................................................................................ v
List of figures ........................................................................................................................... vii
List of tables .............................................................................................................................. ix
Acknowledgements .................................................................................................................... x
1. Introduction ................................................................................................................... 1
2. Theory/Equipment ......................................................................................................... 2
2.1 Combinatorial Sputtering System..................................................................... 2
2.2 X-Ray Diffraction............................................................................................. 3
2.3 Mössbauer Spectroscopy .................................................................................. 4
3. Sample Fabrication........................................................................................................ 6
3.1 Sputtering of the Fe100-xGax Films .................................................................... 6
3.2 Film Composition Confirmation ...................................................................... 8
3.3 Film Mass & Thickness Measurement ........................................................... 10
3.4 Correlating Compositions Between Substrates of the Same Library ............. 10
4. Sample Characterization.............................................................................................. 12
4.1 X-ray Diffraction Results ............................................................................... 12
4.1.1 INEL XRD Data ................................................................................ 12
4.1.2 X’Pert Pro XRD Data........................................................................ 14
4.2 Mössbauer Spectroscopy Results ................................................................... 16
5. Discussion ................................................................................................................... 26
6. Conclusions and Future Work ..................................................................................... 29
DRDC Atlantic CR 2005-171 v

6.1 Conclusions .................................................................................................... 29
6.2 Future Work ................................................................................................... 29
7. References ................................................................................................................... 31
Annex A – Raw Microprobe Data ............................................................................................ 33
Annex B – Sputtered Film Weights and Thicknesses .............................................................. 35
Distribution list ......................................................................................................................... 36
vi DRDC Atlantic CR 2005-171

List of figures
Figure 1. Combinatorial sputtering system (Picture courtesy of the Dahn lab).......................... 2
Figure 2. INEL curved detector XRD system (Picture courtesy of the Dahn lab) ..................... 3
Figure 3. Photograph of the X-Z sample positioning stage used for automated Mössbauer spectra collection................................................................................................................. 5
Figure 4. Sputtering table layout (picture courtesy of the Dahn lab) ......................................... 6
Figure 5. Substrates after sputtering; (a) alumina plate, (b) Kapton, (c) al2O3 strip, (d) Si(100) strip...................................................................................................................................... 7
Figure 6. The JEOL 8200 Microprobe in the Department of Earth Sciences at Dalhousie University. ........................................................................................................................... 8
Figure 7. Composition as a function of radial position; (a) S2C026, (b) S2C027, (c) S2C011, (d) S2C013, (e) S2C012.. .................................................................................................... 9
Figure 8. INEL XRD patterns for Fe-Ga (A) ........................................................................... 12
Figure 9. INEL XRD patterns for Fe-Ga (B)............................................................................ 13
Figure 10. INEL XRD patterns for Fe-Ga (C).......................................................................... 13
Figure 11. X’Pert Pro XRD pattern of Fe100-xGax for x=29 ...................................................... 14
Figure 12. Lattice parameters of Fe100-xGax combinatorially sputtered thin films.................... 15
Figure 13. Mössbauer Spectra of Fe-Ga (A) at different compositions (number in at. %)....... 16
Figure 14. Mössbauer Spectra of Fe-Ga (B) at different compositions (number in at. %)....... 17
Figure 15. Mössbauer Spectra of Fe-Ga (C) at different compositions (number in at. %)....... 17
Figure 16. χ2 value for VBF fit of selected Mössbauer spectra.. ............................................. 18
Figure 17. Probability distributions of the hyperfine field of Fe-Ga (A) at different compositions (number in at. %). ....................................................................................... 19
Figure 18. Probability distributions of the hyperfine field of Fe-Ga (B) at different compositions (number in at. %). ....................................................................................... 19
Figure 19. Probability Distributions of the hyperfine field of Fe-Ga (C) at different compositions (number in at. %). ....................................................................................... 20
DRDC Atlantic CR 2005-171 vii

Figure 20. A1/A3 of the Fe100-xGax thin films as a function of composition.............................. 21
Figure 21. A2/A3 of Fe100-xGax thin film as a function of composition. .................................... 22
Figure 22. Mean centre shift, <δ>, of Fe100-xGax thin films as a function of composition........ 23
Figure 23. <|H|> of Fe100-xGax thin film as a function of composition ..................................... 23
Figure 24. Gaussian width, σ, of Fe100-xGax thin film as a function of composition ................ 24
Figure 25. Relative intensity of component 1 for Fe100-xGax thin film as a function of composition. ...................................................................................................................... 25
viii DRDC Atlantic CR 2005-171
List of tables
Table 1. Sputtering conditions for compositionally changing Fe100-xGax libraries ..................... 7
Table 2. Fe-Ga Library Naming Convention............................................................................ 10
Table 3. Raw Microprobe Data ................................................................................................ 33
Table 4. Sputtered Film Weights and Thicknesses................................................................... 35
DRDC Atlantic CR 2005-171 ix
Acknowledgements
We would like to acknowledge Richard Mar of the Dahn Laboratory at Dalhousie University for designing the target masks, running the sputtering system that produced the Fe-Ga samples and for assistance with evaluation and characterization of the films.
Gary Fisher of Defence R&D Canada – Atlantic was an asset for his help in collecting x-ray diffraction patterns.
Patricia Stoffyn of the microprobe lab in the Earth Sciences Department of Dalhousie University was very helpful in collecting the microprobe data.
x DRDC Atlantic CR 2005-171

1. Introduction
Magnetostrictive materials are materials that produce strains in response to application of a magnetic field. The discovery of giant magnetostrictive materials such as Terfenol-D, in the 1960’s, has led to the incorporation of magnetostrictive materials into actuators, sensors and other devices. The increasing application of these materials has led to research in new magnetostrictive materials that possess other useful physical properties.
Rare earth magnetostrictive materials such as Terfenol-D have been widely used as actuator materials as they possess large magnetostriction (~3600 ppm at room temperature) [1]. Unfortunately, these materials tend to be expensive, brittle, and are not easily machined [2,3]. Due to these limitations, non-rare-earth based materials such as iron-based alloys are being studied for their toughness and potential magnetostrictive properties. A promising magnetostrictive material is Fe-Ga, also known as Galfenol. While Fe-Ga alloys do not yield as high a magnetostriction as Terfenol-D, it is a more desirable magnetostrictive material in terms of formability, ease machining and tensile strength [3].
This study is part of an initiative by Defence R&D Canada for the development of Fe-based materials for use as actuator or sensor materials. This research was contracted to Richard Dunlap (Dalhousie University) to employ the combinatorial sputtering approach for rapid, cost-effective production and characterization of Fe-Ga thin-film libraries.
There were two specific goals for the project. The first goal of the project was to create libraries of Fe100-xGax thin films that would span the composition range of 0 < x < 30. This composition range encompasses the range of compositions where magnetostrictive values are largest [4]. Ideally, the combinatorial sputtering approach would create films with a near-linear composition change to allow for easier modelling of the film composition.
The second goal of the project was to characterize the crystallographic and magnetic properties of the libraries at a variety of compositions in a fast combinatorial fashion. X-ray diffraction (XRD) was used to identify long range crystallographic ordering of the films. Mössbauer spectroscopy (MS) was used to identify short range crystallographic and magnetic ordering of the system. Both the XRD and MS systems were modified systems that could analyze the combinatorial films in a rapid, automated fashion.
In particular, Mössbauer spectroscopy may be more sensitive than XRD to identify and evaluate short-range structural ordering in Fe-Ga combinatorial films. There had not been many Mössbauer studies of Fe-Ga for low gallium compositions since Kawamiya in 1972 [5], and then only between 15 < x < 30. Dunlap and coworkers have shown that local D03 ordering in sputtered Fe-Si films [6] and melt spun Fe-Ga [7] is noticed before long range ordering is seen using XRD. Since the Fe-Ga system also experience the same sort of structural change as the Fe-Si system, starting around 19 at% Ga [8], MS might allow us to see short range ordering in Fe-Ga films as well.
DRDC Atlantic CR 2005-171 1

2. Theory/Equipment
2.1 Combinatorial Sputtering System The sputtering system used to create the Fe-Ga combinatorial thin films was developed at Dalhousie University by Jeff Dahn [9]. The sputtering machine consists of a modified Corona Vacuum Coaters model V-3T system, as seen in Figure 1. There is one RF power supply and three magnetron power supplies that can be used to sputter up to four different targets. The rotating substrate table is water-cooled and the system contains a R2000 series Polycold cyropump to remove water vapour due to condensation during sputtering.
Figure 1. Combinatorial sputtering system (Picture courtesy of the Dahn lab)
The chamber is turbo pumped during sputtering and argon is fed into the chamber to maintain a partial argon pressure of approximately 1 mTorr. The sputtering system can sputter both binary and ternary combinatorial films by using masks of defined shapes over the various sample targets. The deposition table itself rotates during sputtering, causing a doughnut shaped area to be sputtered onto the table.
A binary film is created using two different targets. Each of the targets is masked and sputtered according to the desired composition range. Rotation of the sputtering table will result in a changing composition of the film along the radial direction of the table.
2 DRDC Atlantic CR 2005-171

2.2 X-Ray Diffraction Two different X-Ray diffractometers were used for structure identification. The INEL CPS120 curved detector system (Dahn lab at Dalhousie University) was used for rapid assessment of the structure over the entire combinatorial film. This technique took only a few hours for an entire sample, giving us crystal structure mapping for a large range of compositions in a very short time period.
The curved detector system measures all angles simultaneously in an area that is approximately 1 mm wide by 1 cm long. The detection width is always 1mm since the angle of the X-rays to the surface of the sample remains at a constant shallow angle. A built in X-Y translation stage automatically moves the sample so that the next section of the sample can be measured. Figure 2 is a picture of the INEL system.
The INEL XRD system used a Cu Kα source at 40 keV and 30 mA, with scan times ranging from 2400 s to 900 s for each position on the films. Data were collected at 2 mm intervals along the axial length of each library over a range of angles of 10°<2θ<120°.
Figure 2. INEL curved detector XRD system (Picture courtesy of the Dahn lab)
While the INEL system is good for fast characterization of the crystal structure of the film at various compositions, more accurate, and thus more time consuming, measurements of exact 2θ peak locations were performed with an X’Pert Pro XRD system at Defence R&D Canada – Atlantic. Using the system for overnight scans at each of 8 positions along each sample allowed for accurate determination of diffraction peak locations and calculation of the resulting lattice parameters.
DRDC Atlantic CR 2005-171 3
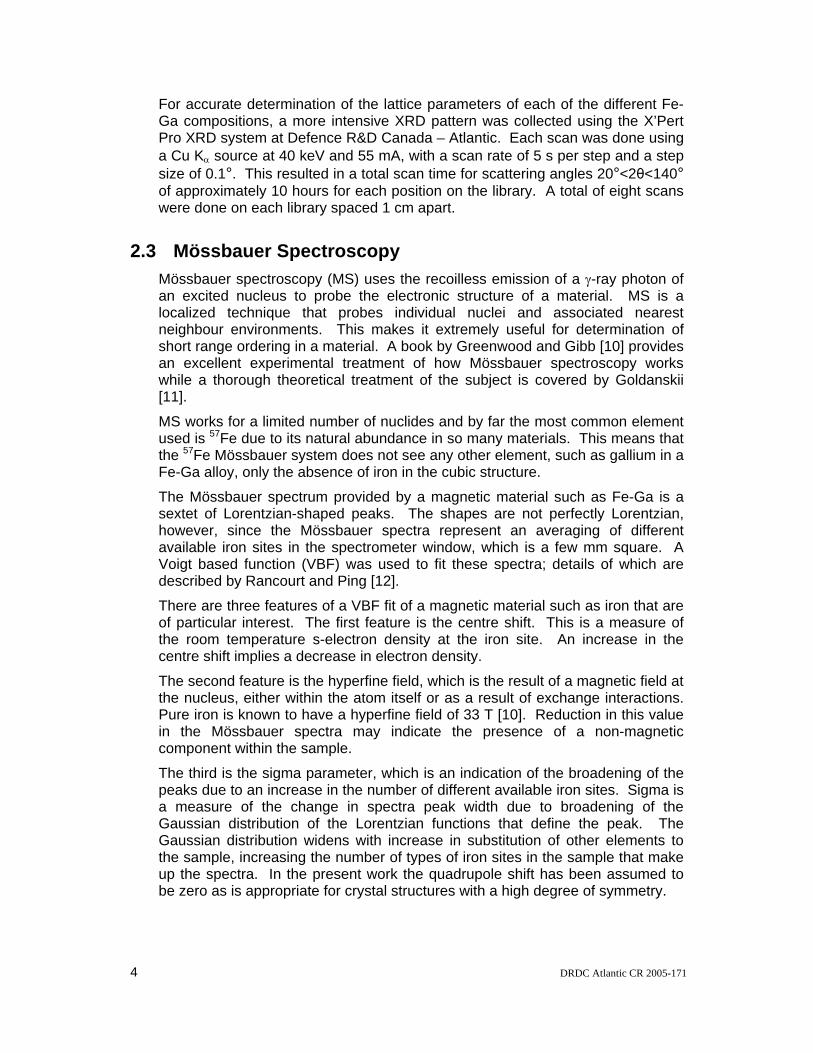
For accurate determination of the lattice parameters of each of the different Fe-Ga compositions, a more intensive XRD pattern was collected using the X’Pert Pro XRD system at Defence R&D Canada – Atlantic. Each scan was done using a Cu Kα source at 40 keV and 55 mA, with a scan rate of 5 s per step and a step size of 0.1°. This resulted in a total scan time for scattering angles 20°<2θ<140° of approximately 10 hours for each position on the library. A total of eight scans were done on each library spaced 1 cm apart.
2.3 Mössbauer Spectroscopy Mössbauer spectroscopy (MS) uses the recoilless emission of a γ-ray photon of an excited nucleus to probe the electronic structure of a material. MS is a localized technique that probes individual nuclei and associated nearest neighbour environments. This makes it extremely useful for determination of short range ordering in a material. A book by Greenwood and Gibb [10] provides an excellent experimental treatment of how Mössbauer spectroscopy works while a thorough theoretical treatment of the subject is covered by Goldanskii [11].
MS works for a limited number of nuclides and by far the most common element used is 57Fe due to its natural abundance in so many materials. This means that the 57Fe Mössbauer system does not see any other element, such as gallium in a Fe-Ga alloy, only the absence of iron in the cubic structure.
The Mössbauer spectrum provided by a magnetic material such as Fe-Ga is a sextet of Lorentzian-shaped peaks. The shapes are not perfectly Lorentzian, however, since the Mössbauer spectra represent an averaging of different available iron sites in the spectrometer window, which is a few mm square. A Voigt based function (VBF) was used to fit these spectra; details of which are described by Rancourt and Ping [12].
There are three features of a VBF fit of a magnetic material such as iron that are of particular interest. The first feature is the centre shift. This is a measure of the room temperature s-electron density at the iron site. An increase in the centre shift implies a decrease in electron density.
The second feature is the hyperfine field, which is the result of a magnetic field at the nucleus, either within the atom itself or as a result of exchange interactions. Pure iron is known to have a hyperfine field of 33 T [10]. Reduction in this value in the Mössbauer spectra may indicate the presence of a non-magnetic component within the sample.
The third is the sigma parameter, which is an indication of the broadening of the peaks due to an increase in the number of different available iron sites. Sigma is a measure of the change in spectra peak width due to broadening of the Gaussian distribution of the Lorentzian functions that define the peak. The Gaussian distribution widens with increase in substitution of other elements to the sample, increasing the number of types of iron sites in the sample that make up the spectra. In the present work the quadrupole shift has been assumed to be zero as is appropriate for crystal structures with a high degree of symmetry.
4 DRDC Atlantic CR 2005-171

The Mössbauer system in the Dunlap lab at Dalhousie University consists of a Wissel System II spectrometer that utilizes a Rh57Co source. The system also has an X-Z translation stage to use with combinatorial films. Figure 3 shows the Mössbauer drive and the X-Z translation stage. The translation stage is controlled by LabView code that is timed through signals received from the Mössbauer drive electronics. A description of the translation stage set-up can be found in work by McGraw et al. [13].
Figure 3. Photograph of the X-Z sample positioning stage used for automated Mössbauer spectra collection; (a) Mössbauer drive motor, (b) frame for holding sample film (c) X-Z translation stage, (d) stepper motor and (e) proportional counter (picture courtesy of Josh McGraw).
DRDC Atlantic CR 2005-171 5
3. Sample Fabrication
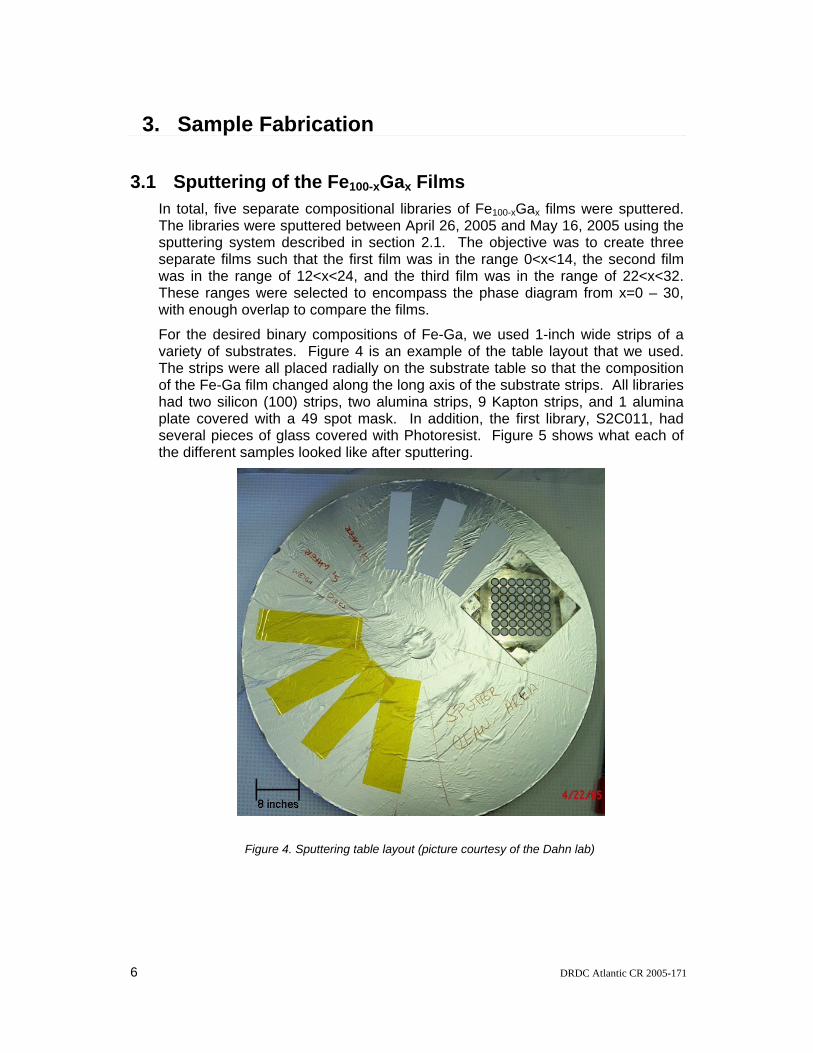
3.1 Sputtering of the Fe100-xGax Films In total, five separate compositional libraries of Fe100-xGax films were sputtered. The libraries were sputtered between April 26, 2005 and May 16, 2005 using the sputtering system described in section 2.1. The objective was to create three separate films such that the first film was in the range 0<x<14, the second film was in the range of 12<x<24, and the third film was in the range of 22<x<32. These ranges were selected to encompass the phase diagram from x=0 – 30, with enough overlap to compare the films.
For the desired binary compositions of Fe-Ga, we used 1-inch wide strips of a variety of substrates. Figure 4 is an example of the table layout that we used. The strips were all placed radially on the substrate table so that the composition of the Fe-Ga film changed along the long axis of the substrate strips. All libraries had two silicon (100) strips, two alumina strips, 9 Kapton strips, and 1 alumina plate covered with a 49 spot mask. In addition, the first library, S2C011, had several pieces of glass covered with Photoresist. Figure 5 shows what each of the different samples looked like after sputtering.
Figure 4. Sputtering table layout (picture courtesy of the Dahn lab)
6 DRDC Atlantic CR 2005-171

Figure 5. Substrates after sputtering; (a) alumina plate, (b) Kapton, (c) al2O3 strip, (d) Si(100) strip.
To achieve the Fe-Ga binary compositions, a low carbon steel target and a Fe-Ga target of 50% iron and 50% gallium were used. The targets measure 2” in diameter by ¼” thick and were masked to create different ranges of compositions for each of the libraries sputtered. Table 1 gives the sputtering conditions and the target masks used for each of the sputtering runs.
Table 1. Sputtering conditions for compositionally changing Fe100-xGax libraries
LIBRARY NAME
DATE OF SPUTTER
CHAMBER PRESSURE
FE TARGET FE-GA TARGET1
dd-mm-yyyy (mTorr) of Argon
Power (W)
Energy (Watt-
minutes)
Mask Used
Power (W)
Energy (Watt-
minutes)
Mask Used2
S2C011 26-04-2005 1.87 98 2241 constant 38 8855 0-100 Linear In
S2C012 28-04-2005 1.89 49 22181 constant 38 17683 50-100 Linear out Version 1
S2C013 29-04-2005 1.88 18 16835 constant 24 23213 50-100 Linear out Version 1
S2C026 12-05-2005 1.90 18 16740 constant 24 23085 50-100 Linear out Version 2
S2C027 16-05-2005 1.87 66 23602 constant 38 13800 50-100 Linear out Version 2
1 To calculate sputtering time (min), divide Watt-minutes for a target by the Watts for the same target. 2 Without a mask a Gaussian-shaped mass profile is produced. A linear in mask produces a film where the mass increases linearly from the outside in towards the center of the sputtering chamber. Linear out is the opposite and the maximum mass is deposited furthest from the center of the sputtering chamber.
DRDC Atlantic CR 2005-171 7
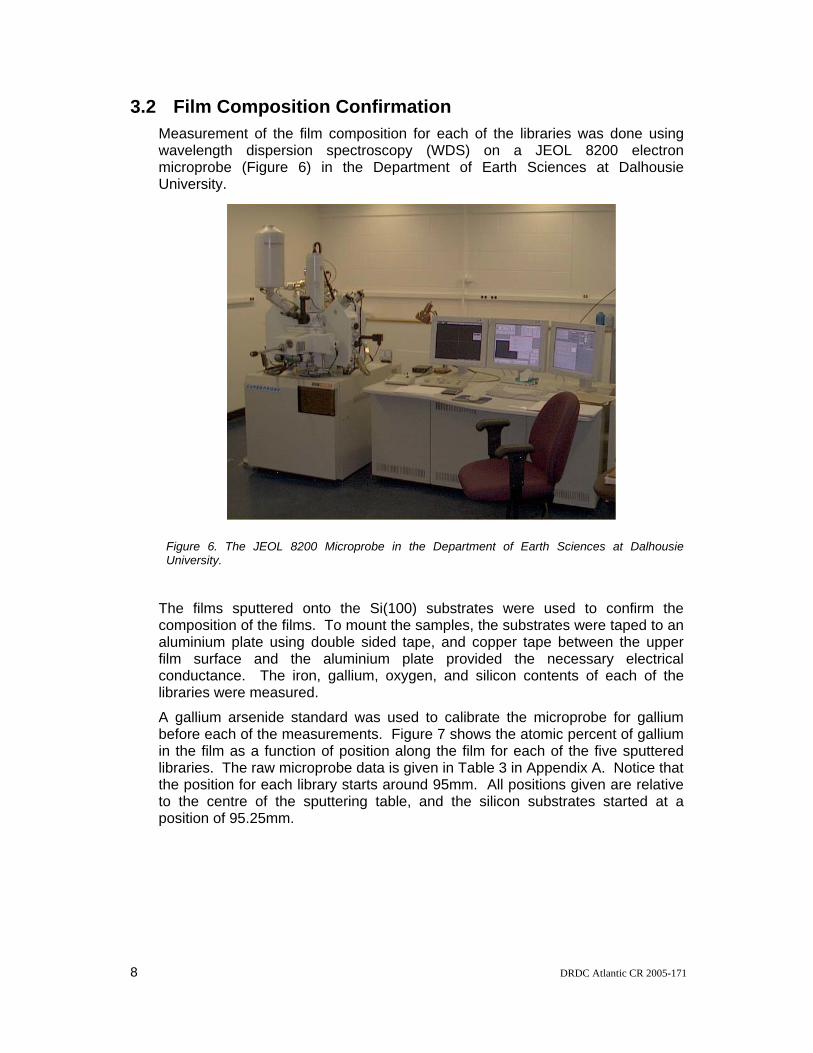
3.2 Film Composition Confirmation Measurement of the film composition for each of the libraries was done using wavelength dispersion spectroscopy (WDS) on a JEOL 8200 electron microprobe (Figure 6) in the Department of Earth Sciences at Dalhousie University.
Figure 6. The JEOL 8200 Microprobe in the Department of Earth Sciences at Dalhousie University.
The films sputtered onto the Si(100) substrates were used to confirm the composition of the films. To mount the samples, the substrates were taped to an aluminium plate using double sided tape, and copper tape between the upper film surface and the aluminium plate provided the necessary electrical conductance. The iron, gallium, oxygen, and silicon contents of each of the libraries were measured.
A gallium arsenide standard was used to calibrate the microprobe for gallium before each of the measurements. Figure 7 shows the atomic percent of gallium in the film as a function of position along the film for each of the five sputtered libraries. The raw microprobe data is given in Table 3 in Appendix A. Notice that the position for each library starts around 95mm. All positions given are relative to the centre of the sputtering table, and the silicon substrates started at a position of 95.25mm.
8 DRDC Atlantic CR 2005-171

0
3
6
9
12
15
18
x
15
18
21
24
x
27
30
33
36
100 120 140 160
27
30
33
36
x
100 120 140 16021
24
27
30
Position (mm)
(c)
(b) (d)
(a)
(e)
Figure 7. Composition as a function of radial position; (a) S2C026, (b) S2C027, (c) S2C011, (d) S2C013, (e) S2C012. The line in (a), (b), & (c) are linear fits to the data. The position is measured relative to the table centre.
From Figure 7, it is apparent that S2C012 and S2C013 did not have a linearly changing composition. These two libraries used the first version of the 50-100 linear in mask on the Fe-Ga target during sputtering. After microprobe analysis, the masks were redesigned and S2C026 and S2C027 were done with the second version of the 50-100 linear in mask.
The difference in slope among S2C011 and S2C026 and S2C027 is caused by the different mask profiles used on the Fe-Ga target. S2C011 used a 0-100 linear in mask making the substrate towards the outer diameter of the sputtering table gallium rich, while the other two libraries used a 50-100 linear out mask, making the inner diameter end of the substrate gallium rich.
The microprobe data show that the sputtering technique developed by the Dahn lab provides smoothly changing compositional libraries with the correct mask. As a result of these tests, S2C012 and S2C013 were not used for any of the
DRDC Atlantic CR 2005-171 9
other analysis done on these films as the remaining three films spanned the desired compositional range of 0<x<30 in an adequately linear fashion.
From this point forward in this report, only the three libraries that showed linear change in composition throughout their entire length will be evaluated. To reduce confusion, the libraries will be referred to according to Table 2.
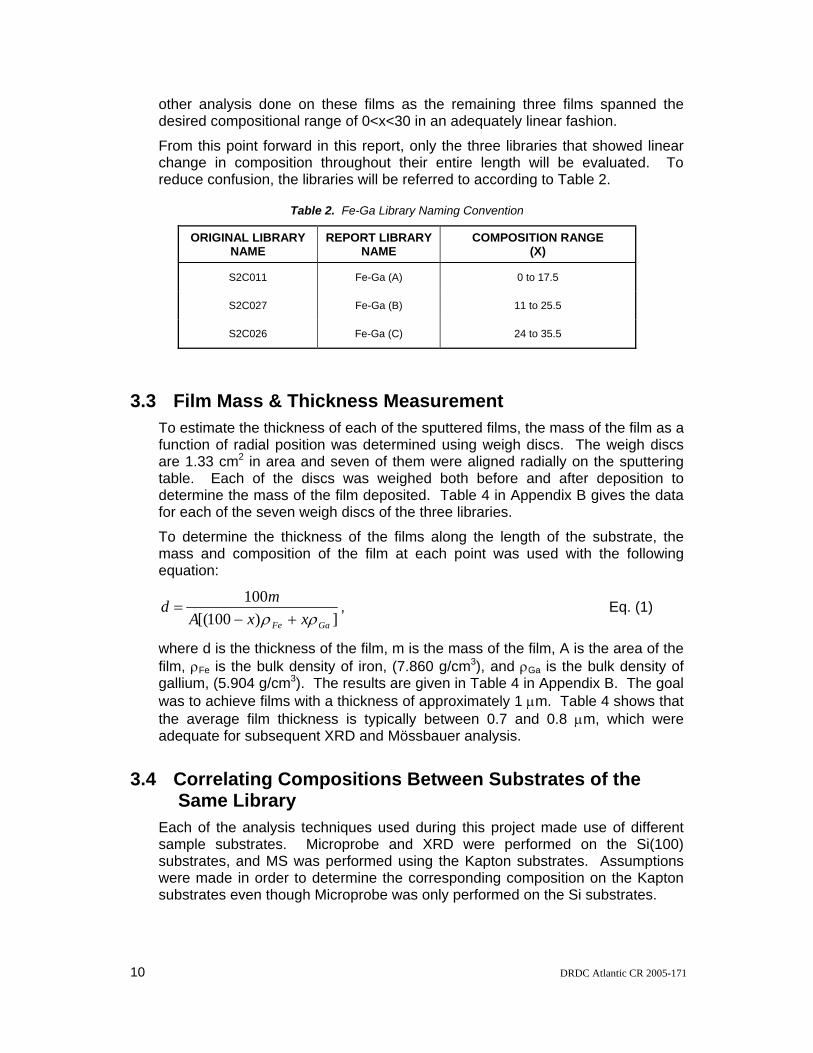
Table 2. Fe-Ga Library Naming Convention
ORIGINAL LIBRARY NAME
REPORT LIBRARY NAME
COMPOSITION RANGE (X)
S2C011 Fe-Ga (A) 0 to 17.5
S2C027 Fe-Ga (B) 11 to 25.5
S2C026 Fe-Ga (C) 24 to 35.5
3.3 Film Mass & Thickness Measurement To estimate the thickness of each of the sputtered films, the mass of the film as a function of radial position was determined using weigh discs. The weigh discs are 1.33 cm2 in area and seven of them were aligned radially on the sputtering table. Each of the discs was weighed both before and after deposition to determine the mass of the film deposited. Table 4 in Appendix B gives the data for each of the seven weigh discs of the three libraries.
To determine the thickness of the films along the length of the substrate, the mass and composition of the film at each point was used with the following equation:
])100[(
100
GaFe xxAmd
ρρ +−= , Eq. (1)
where d is the thickness of the film, m is the mass of the film, A is the area of the film, ρFe is the bulk density of iron, (7.860 g/cm3), and ρGa is the bulk density of gallium, (5.904 g/cm3). The results are given in Table 4 in Appendix B. The goal was to achieve films with a thickness of approximately 1 μm. Table 4 shows that the average film thickness is typically between 0.7 and 0.8 μm, which were adequate for subsequent XRD and Mössbauer analysis.
3.4 Correlating Compositions Between Substrates of the Same Library
Each of the analysis techniques used during this project made use of different sample substrates. Microprobe and XRD were performed on the Si(100) substrates, and MS was performed using the Kapton substrates. Assumptions were made in order to determine the corresponding composition on the Kapton substrates even though Microprobe was only performed on the Si substrates.
10 DRDC Atlantic CR 2005-171

The first assumption was to fit the Microprobe data to a linear model as seen in Figure 7. While the linear model did fit the data quite well, there is some discrepancy, particularly for the samples Fe-Ga (B) and Fe-Ga (C).
The second assumption was that the sputtered mass would only be dependant on the radial distance from the centre of the sputtering table, and not on lateral distances. From work done by Dahn and coworkers [9] the error that assumption incurs should be negligible.
There was also error associated with positioning of each substrate on the table. The substrates were placed onto the sputtering table such that one end of the Si and Alumina substrates was located on a ring 95.25mm ± 1mm from the centre of the sputtering table. The Kapton substrates were placed on the table such that the tape holding the substrates to the sputtering table was also at 95.25mm from the centre of the sputtering table. Given the elasticity of the Kapton substrates, the positioning error may have been larger than that of the other substrates.
To determine the absolute position of the Kapton substrates, the outer diameter deposition end line was assumed to be at the same absolute distance from the centre of the sputtering table for all substrates. Again, since there is negligible lateral difference in sputtered mass, this assumption should cause little error in itself. The problem arises in that the deposition end line has a finite width that was difficult to determine accurately. Determining this line also added error in the positioning estimated to be +/- 1mm between substrates. This gives a minimum error in sample positioning of +/- 2mm, which corresponds to a minimum composition error of +/- 1at. % Ga simply due to correspondence between substrates.
DRDC Atlantic CR 2005-171 11

4. Sample Characterization
4.1 X-ray Diffraction Results
4.1.1 INEL XRD Data For initial characterization of the structure of the Fe100-xGax films, the INEL XRD system was used. The results of the scans can be seen in Figures 8-10. The highest intensity peak near 44° corresponds to the (110) reflection of the disordered bcc structure of Fe. The peak that occurs near 82° corresponds to the (211) reflection. There was no evidence of reflections (occurring near ~26° and 54°) to support the presence of the D03 superstructure; even at higher gallium compositions. Cullen and coworkers [15] suggest that the short-range D03 phase starts occurring near x=25 in bulk samples of Fe-Ga, but this structural transition is not evident in the XRD data. An additional peak near 86.7° in Figure 9 is an artefact of the measurement due to reflection from the sample holder.
30 50 70 90scattering angle (degrees)
inte
nsity
(arb
itrar
y un
its)
x
0.6
5.6
11.0
16.0
Figure 8. INEL XRD patterns for Fe-Ga (A)
12 DRDC Atlantic CR 2005-171

30 50 70 90scattering angle (degrees)
inte
nsity
(arb
itrar
y un
its)
x
25.0
21.3
18.3
14.3
Figure 9. INEL XRD patterns for Fe-Ga (B)
30 50 70 90scattering angle (degrees)
inte
nsity
(arb
itrar
y un
its)
x
36.3
32.6
28.6
24.9
Figure 10. INEL XRD patterns for Fe-Ga (C)
DRDC Atlantic CR 2005-171 13
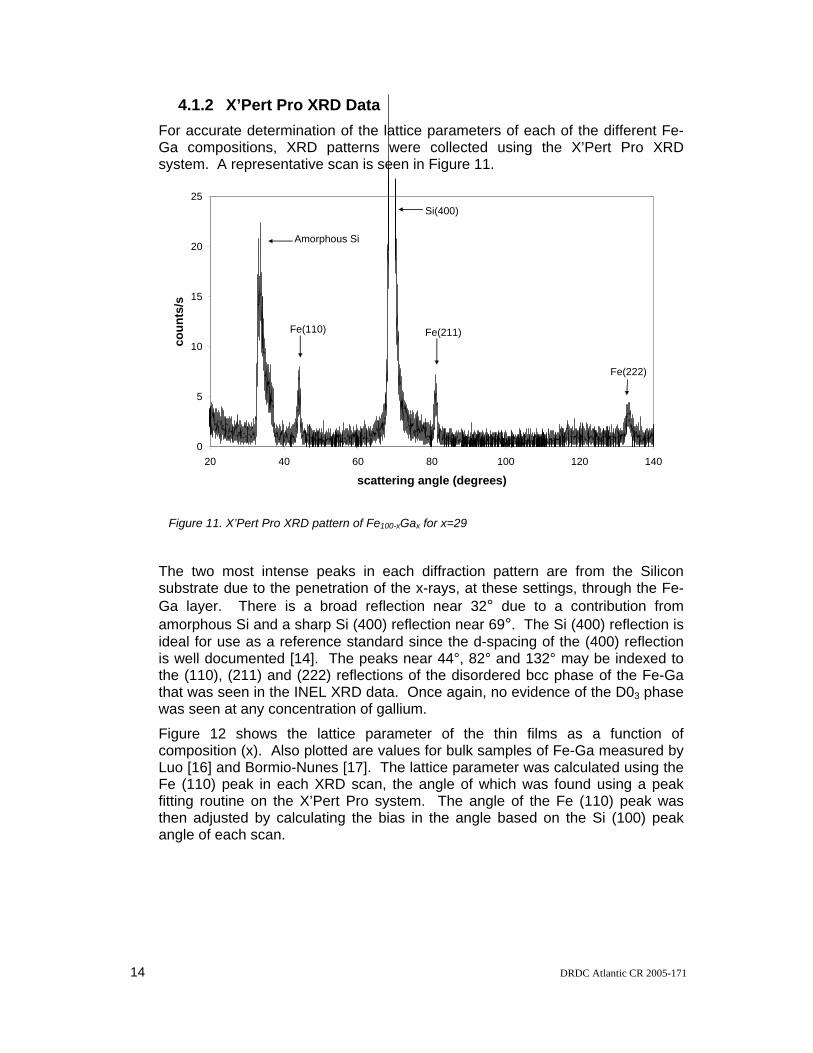
4.1.2 X’Pert Pro XRD Data For accurate determination of the lattice parameters of each of the different Fe-Ga compositions, XRD patterns were collected using the X’Pert Pro XRD system. A representative scan is seen in Figure 11.
0
5
10
15
20
25
20 40 60 80 100 120 140
scattering angle (degrees)
coun
ts/s
Fe(110) Fe(211)
Si(400)
Fe(222)
Amorphous Si
Figure 11. X’Pert Pro XRD pattern of Fe100-xGax for x=29
The two most intense peaks in each diffraction pattern are from the Silicon substrate due to the penetration of the x-rays, at these settings, through the Fe-Ga layer. There is a broad reflection near 32° due to a contribution from amorphous Si and a sharp Si (400) reflection near 69°. The Si (400) reflection is ideal for use as a reference standard since the d-spacing of the (400) reflection is well documented [14]. The peaks near 44°, 82° and 132° may be indexed to the (110), (211) and (222) reflections of the disordered bcc phase of the Fe-Ga that was seen in the INEL XRD data. Once again, no evidence of the D03 phase was seen at any concentration of gallium.
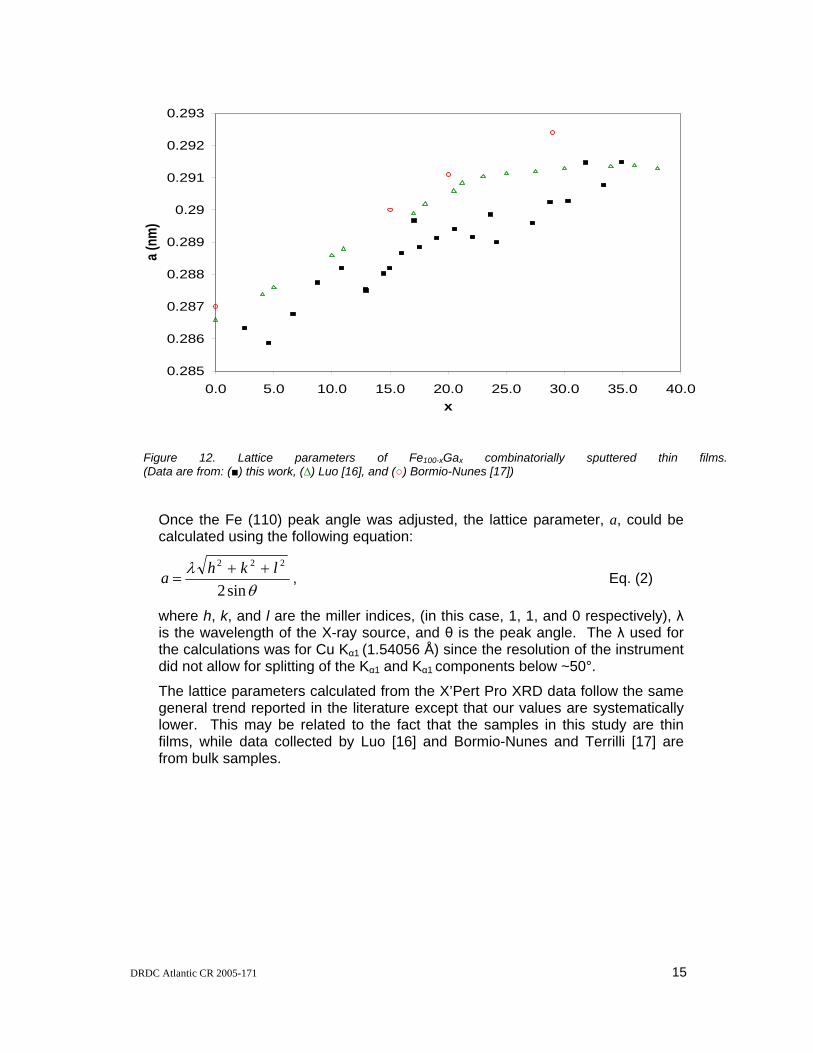
Figure 12 shows the lattice parameter of the thin films as a function of composition (x). Also plotted are values for bulk samples of Fe-Ga measured by Luo [16] and Bormio-Nunes [17]. The lattice parameter was calculated using the Fe (110) peak in each XRD scan, the angle of which was found using a peak fitting routine on the X’Pert Pro system. The angle of the Fe (110) peak was then adjusted by calculating the bias in the angle based on the Si (100) peak angle of each scan.
14 DRDC Atlantic CR 2005-171
0.285
0.286
0.287
0.288
0.289
0.29
0.291
0.292
0.293
0.0 5.0 10.0 15.0 20.0 25.0 30.0 35.0 40.0x
a (nm
)
Figure 12. Lattice parameters of Fe100-xGax combinatorially sputtered thin films. (Data are from: (■) this work, (∆) Luo [16], and (○) Bormio-Nunes [17])
Once the Fe (110) peak angle was adjusted, the lattice parameter, a, could be calculated using the following equation:
θλ
sin2
222 lkha ++= , Eq. (2)
where h, k, and l are the miller indices, (in this case, 1, 1, and 0 respectively), λ is the wavelength of the X-ray source, and θ is the peak angle. The λ used for the calculations was for Cu Kα1 (1.54056 Å) since the resolution of the instrument did not allow for splitting of the Kα1 and Kα1 components below ~50°.
The lattice parameters calculated from the X’Pert Pro XRD data follow the same general trend reported in the literature except that our values are systematically lower. This may be related to the fact that the samples in this study are thin films, while data collected by Luo [16] and Bormio-Nunes and Terrilli [17] are from bulk samples.
DRDC Atlantic CR 2005-171 15

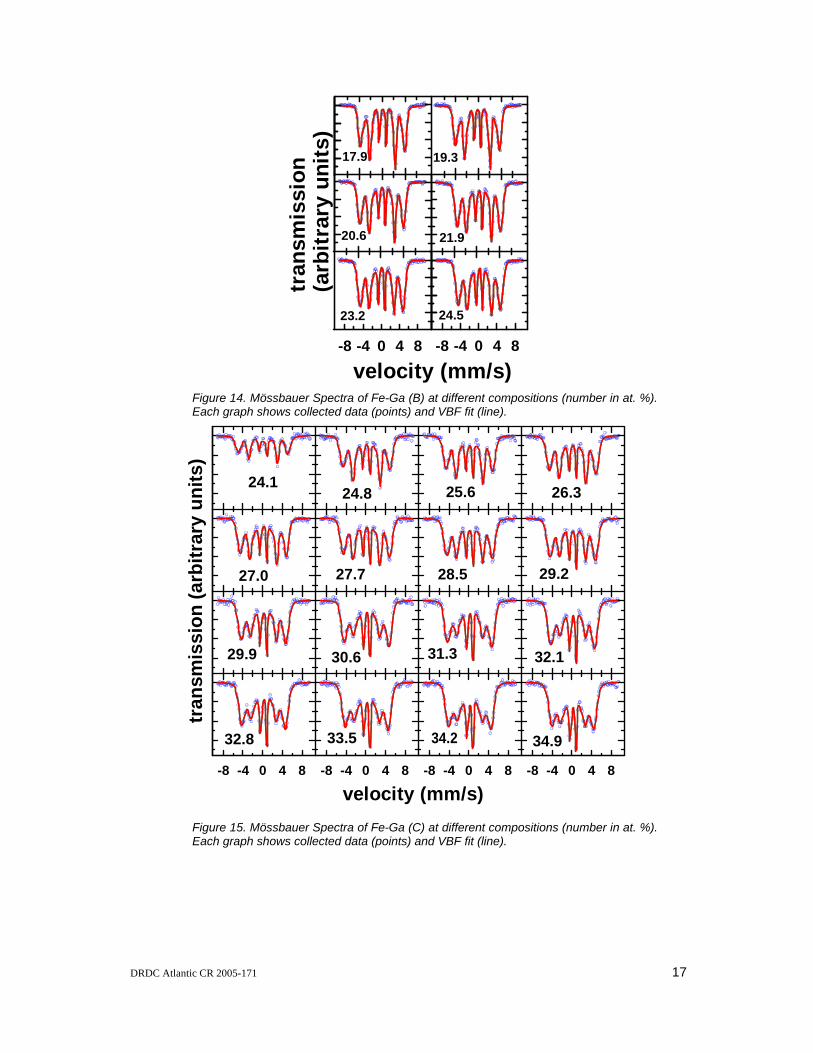
4.2 Mössbauer Spectroscopy Results Mössbauer spectra for the three linearly changing Fe100-xGax films were collected using the combinatorial MS apparatus outlined in section 2.3. To reduce the measurement time for each position, nine of the films sputtered onto Kapton strips were stacked together to increase the amount of available iron at each position on the film. Typical measurement time for each position on libraries Fe-Ga (A) and Fe-Ga (C) was approximately 10 hours and approximately 20 hours for Fe-Ga (B). In total, 16 positions spaced ~5mm apart were measured on each of the Fe-Ga (A) and Fe-Ga (C) libraries. Six positions spaced ~9mm apart were measured on library Fe-Ga (B). Shorter duration measurements at closer intervals were also done on Fe-Ga (B), however the longer duration scans were more statistically significant and followed the same trend as the shorter duration measurements, so no information was lost due to the increased separation between the measured points. Only six positions on Fe-Ga (B) were required since some compositions overlapped with Fe-Ga (A).
Figures 13, 14, and 15 show the Mössbauer spectra collected for each of the three libraries. All the Mössbauer spectra were fit using a VBF fit with one hyperfine distribution site with two components.
-8 -4 0 4 8-8 -4 0 4 8-8 -4 0 4 8-8 -4 0 4 8
velocity (mm/s)
trans
miss
ion
(arb
itrar
y uni
ts)
4.7
8.6
12.6
16.5
3.8
7.7
11.6
15.5
2.8
6.7
10.6
14.5
1.8
5.7
9.6
13.5
Figure 13. Mössbauer Spectra of Fe-Ga (A) at different compositions (number in at. %).Each graph shows collected data (points) and VBF fit (line).
16 DRDC Atlantic CR 2005-171
-8 -4 0 4 8 -8 -4 0 4 8
velocity (mm/s)
tran
smis
sion
(arb
itrar
y un
its)
17.9 19.3
20.6 21.9
23.2 24.5
Figure 14. Mössbauer Spectra of Fe-Ga (B) at different compositions (number in at. %).Each graph shows collected data (points) and VBF fit (line).
-8 -4 0 4 8-8 -4 0 4 8-8 -4 0 4 8-8 -4 0 4 8
velocity (mm/s)
tran
smis
sion
(arb
itrar
y un
its)
26.3
29.2
32.1
34.9
25.6
28.5
31.3
34.2
24.8
27.7
30.6
33.5
24.1
27.0
29.9
32.8
Figure 15. Mössbauer Spectra of Fe-Ga (C) at different compositions (number in at. %).Each graph shows collected data (points) and VBF fit (line).
DRDC Atlantic CR 2005-171 17
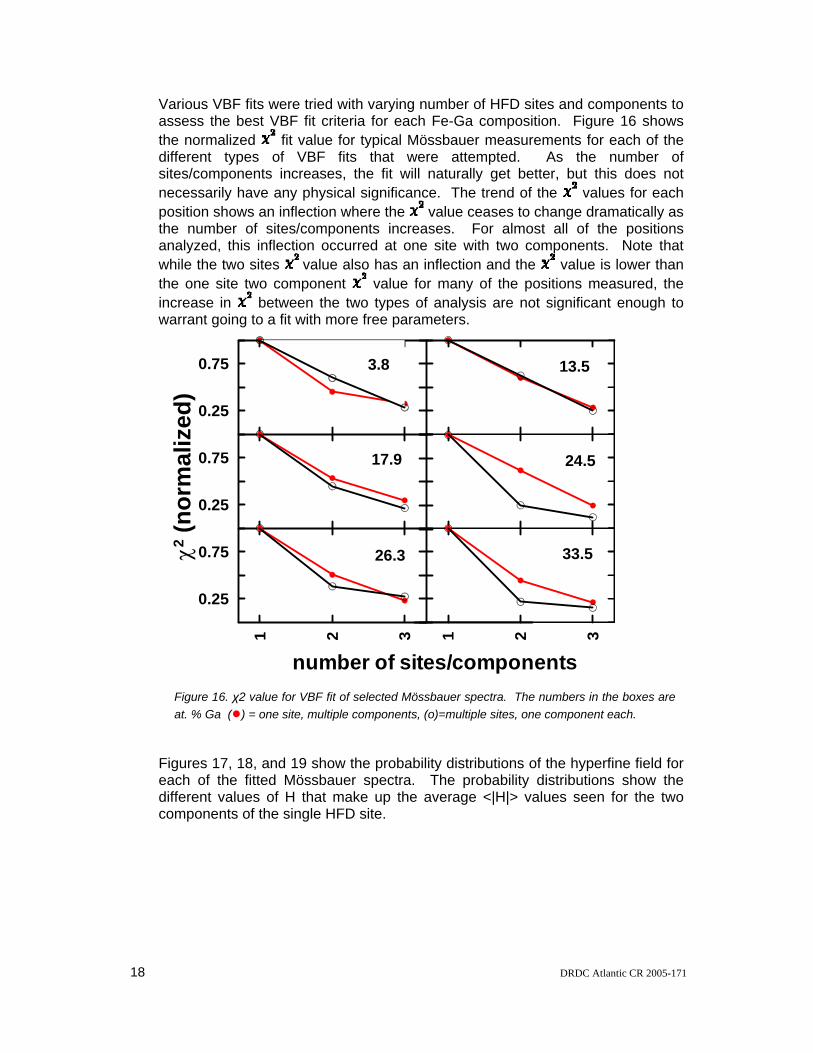
Various VBF fits were tried with varying number of HFD sites and components to assess the best VBF fit criteria for each Fe-Ga composition. Figure 16 shows the normalized fit value for typical Mössbauer measurements for each of the different types of VBF fits that were attempted. As the number of sites/components increases, the fit will naturally get better, but this does not necessarily have any physical significance. The trend of the values for each position shows an inflection where the value ceases to change dramatically as the number of sites/components increases. For almost all of the positions analyzed, this inflection occurred at one site with two components. Note that while the two sites value also has an inflection and the value is lower than the one site two component value for many of the positions measured, the increase in between the two types of analysis are not significant enough to warrant going to a fit with more free parameters.
0.25
0.75
0.25
0.75
1 2 3
0.25
0.75
1 2 3
number of sites/components
χ2 (n
orm
aliz
ed)
3.8 13.5
17.9 24.5
26.3 33.5
Figure 16. χ2 value for VBF fit of selected Mössbauer spectra. The numbers in the boxes are at. % Ga (●) = one site, multiple components, (o)=multiple sites, one component each.
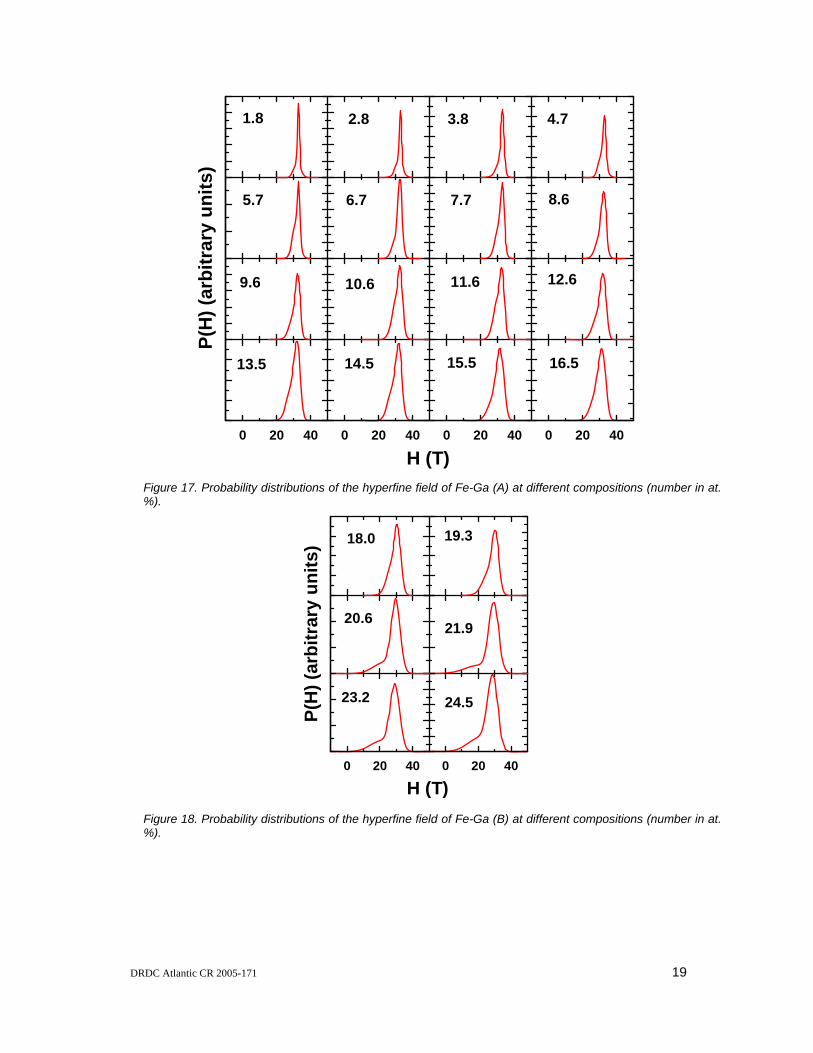
Figures 17, 18, and 19 show the probability distributions of the hyperfine field for each of the fitted Mössbauer spectra. The probability distributions show the different values of H that make up the average <|H|> values seen for the two components of the single HFD site.
18 DRDC Atlantic CR 2005-171
0 20 400 20 400 20 400 20 40
H (T)
P(H
) (ar
bitr
ary
units
)
4.7
8.6
12.6
16.5
1.8
5.7
9.6
13.5
2.8 3.8
6.7 7.7
10.6 11.6
14.5 15.5
Figure 17. Probability distributions of the hyperfine field of Fe-Ga (A) at different compositions (number in at. %).
0 20 400 20 40
H (T)
P(H
) (ar
bitr
ary
units
) 19.3
21.9
24.5
18.0
20.6
23.2
Figure 18. Probability distributions of the hyperfine field of Fe-Ga (B) at different compositions (number in at. %).
DRDC Atlantic CR 2005-171 19

0 20 400 20 400 20 400 20 40
H (T)
P(H
) (ar
bitr
ary
units
)
26.3
29.2
32.1
35.0
24.1
27.0
29.9
32.7
24.8 25.6
27.7 28.5
30.6 31.3
33.5 34.2
Figure 19. Probability Distributions of the hyperfine field of Fe-Ga (C) at different compositions (number in at. %).
The six peaks of a magnetically split 3⁄2 to 1⁄2 transition have intensity ratios A1:A2:A3:A3:A2:A1 corresponding to the appropriate Clebsch-Gordon coefficients for the transitions. Figure 20 shows the fitted value of A1/A3 as a function of composition. The uncertainty in A1/A3 is typically about +-0.2, so all spectra reported here show values that are, more or less, consistent with the theoretical value of 3.0. It is not uncommon for researchers to fix the value of this ratio to 3.0; some fits performed using a fixed ratio have provided results that are virtually identical to those reported below. Allowing A1/A3 to be a free parameter and seeing that it converges to a value consistent with 3.0, provides some confirmation of the validity of the fit and the reliability of the hyperfine parameters; they are not affected by an incorrectly fixed A1/A3. The plot of A1/A3 vs. x suggests a slight increase in this ratio with increasing Ga content. This may be coincidental or it may be related to the increased complexity of the spectra for larger Ga content due to greater diversity of Fe sites or to thickness effects.
20 DRDC Atlantic CR 2005-171

2.4
2.6
2.8
3
3.2
3.4
3.6
0 5 10 15 20 25 30 35 40x
A 1/A
3
Figure 20. A1/A3 of the Fe100-xGax thin films as a function of composition.
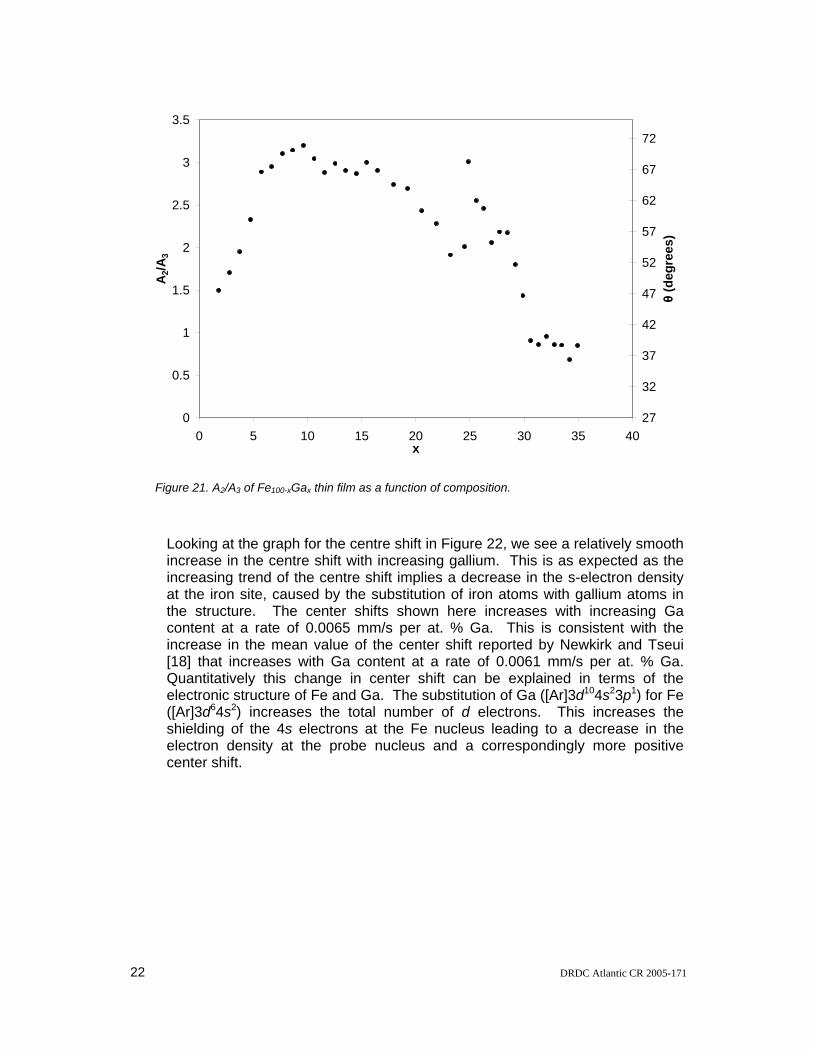
The ratio of the peaks A2/A3 is related to the orientation of magnetic domains or magnetic texturing of the film. In a non-textured sample, the ratio of A2/A3 should have the average value of 2.0. For a sample with domains perpendicular to or parallel to the film surface would have a value of 0 or 4, respectively. As can be seen from Figure 21, A2/A3 changes significantly across the composition range. We can calculate the angular dependence of the ratio using the following equation [10]:
( )⎟⎟⎠
⎞⎜⎜⎝
⎛
+=
32
32
/4
/2Arcsin
AAAA
θ . Eq. (3)
From Eq. (3) it is clear that there is a direct correlation between A2/A3 and the angular dependence of the magnetic orientation of the film. The value θ is measured as the angle between the γ-ray direction and the principal axis of the hyperfine field and is illustrated in Figure 20.
DRDC Atlantic CR 2005-171 21
0
0.5
1
1.5
2
2.5
3
3.5
0 5 10 15 20 25 30 35 40x
A2/A
3
27
32
37
42
47
52
57
62
67
72
θ (d
egre
es)
Figure 21. A2/A3 of Fe100-xGax thin film as a function of composition.
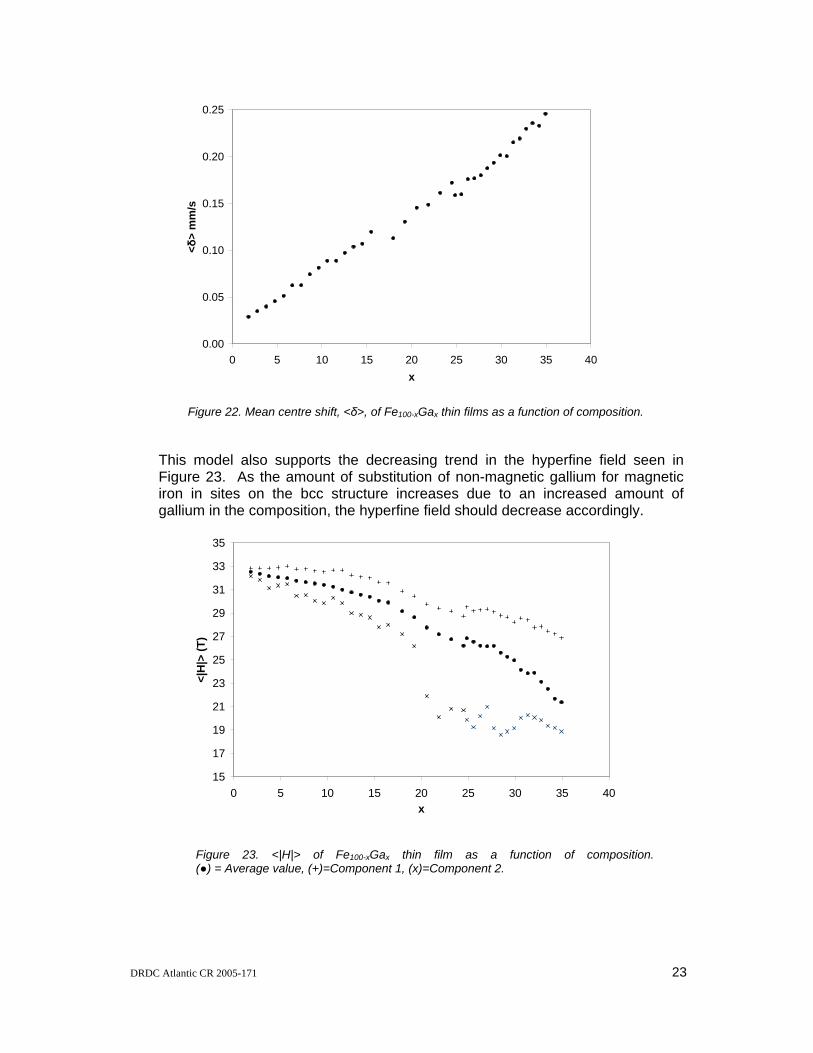
Looking at the graph for the centre shift in Figure 22, we see a relatively smooth increase in the centre shift with increasing gallium. This is as expected as the increasing trend of the centre shift implies a decrease in the s-electron density at the iron site, caused by the substitution of iron atoms with gallium atoms in the structure. The center shifts shown here increases with increasing Ga content at a rate of 0.0065 mm/s per at. % Ga. This is consistent with the increase in the mean value of the center shift reported by Newkirk and Tseui [18] that increases with Ga content at a rate of 0.0061 mm/s per at. % Ga. Quantitatively this change in center shift can be explained in terms of the electronic structure of Fe and Ga. The substitution of Ga ([Ar]3d104s23p1) for Fe ([Ar]3d64s2) increases the total number of d electrons. This increases the shielding of the 4s electrons at the Fe nucleus leading to a decrease in the electron density at the probe nucleus and a correspondingly more positive center shift.
22 DRDC Atlantic CR 2005-171
0.00
0.05
0.10
0.15
0.20
0.25
0 5 10 15 20 25 30 35 40x
<δ>
mm
/s
Figure 22. Mean centre shift, <δ>, of Fe100-xGax thin films as a function of composition.
This model also supports the decreasing trend in the hyperfine field seen in Figure 23. As the amount of substitution of non-magnetic gallium for magnetic iron in sites on the bcc structure increases due to an increased amount of gallium in the composition, the hyperfine field should decrease accordingly.
15
17
19
21
23
25
27
29
31
33
35
0 5 10 15 20 25 30 35 40x
<|H
|> (T
)
Figure 23. <|H|> of Fe100-xGax thin film as a function of composition. (●) = Average value, (+)=Component 1, (x)=Component 2.
DRDC Atlantic CR 2005-171 23

The third value that supports this view is the Gaussian width (σ). As the amount of gallium content increases, the number of different HFD nearest neighbour sites should also increase due to an increased amount of substitution of gallium for iron in the bcc structure. This increase in the number of different HFD nearest neighbour sites corresponds to an increase in σ and this trend is clearly seen in Figure 24.
0
2
4
6
8
10
12
0 5 10 15 20 25 30 35 40x
σ (T
)
Figure 24. Gaussian width, σ, of Fe100-xGax thin film as a function of composition. (●) = average value, (+)=Component 1, (x)=Component 2.
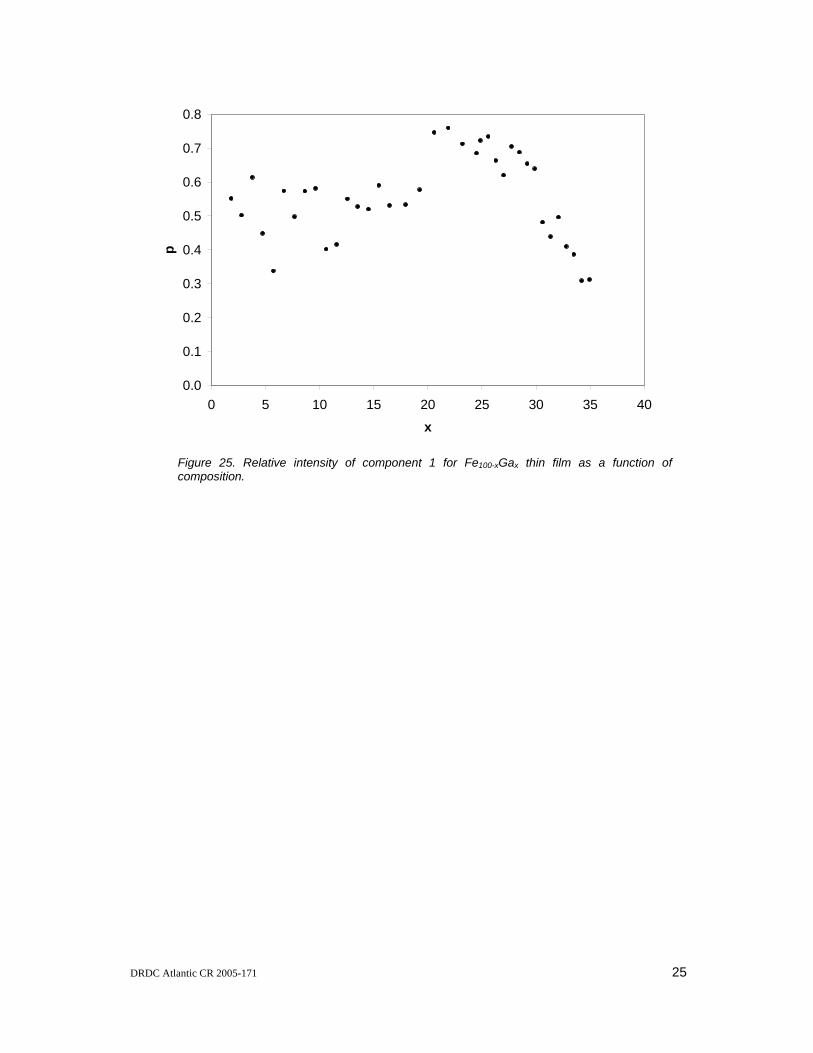
There is another sound physical reason for using the fit to one HFD site with two components. The first component corresponds to sites with 0 or 1 gallium atoms replacing iron atoms in the bcc structure, and the second component corresponds to atomic sites with 2 or more gallium atoms replacing iron atoms in the bcc structure. A graph of p value (Figure 25), which is a measure of the relative intensity of the low field component (component 1) in the VBF fit, versus composition supports this view. Above x=22, the importance of component 1 reduces and the importance of component two increases. Below x=22, the amount of gallium is low enough that the distribution is random and so the p values for the two components in the fit are approximately equal.
24 DRDC Atlantic CR 2005-171
0.0
0.1
0.2
0.3
0.4
0.5
0.6
0.7
0.8
0 5 10 15 20 25 30 35 40
x
p
Figure 25. Relative intensity of component 1 for Fe100-xGax thin film as a function of composition.
DRDC Atlantic CR 2005-171 25

5. Discussion Wertheim et al. [19] have undertaken an analysis of the Mössbauer effect spectra of Fe100-xGax on the basis of the first and second nearest neighbor Ga coordination around the Fe probe site. Newkirk and Tsuei [18] have taken the same approach and used a more detailed analysis over a wider composition range and have identified spectral components associated with differing numbers of Ga neighbors. Kawamiya et al. [5] have concentrated on a limited composition range around x = 25 and have considered the local Fe environment in the context of bcc, D03 and L12 ordering. Dunlap et al. [6] have looked at melt spun samples with compositions between x = 8.3 and x = 23.3 and have suggested the existence of a disordered bcc phase with Ga pairing up to about x = 20 and short range D03 ordering for higher Ga content.
The decrease in hyperfine fields as a function of Ga content shown in Figure 23 are consistent with the mean fields reported by Newkirk and Tsuei [18]. Although a direct comparison of the changes in Fe hyperfine field as a function of Ga content between the present results and those of Newkirk and Tsuei is not straight forward because of the different fitting philosophies as well as the somewhat non-linear changes in the fields, both studies show a similar decrease in mean field of about 0.15 T per at. % Ga for small Ga concentrations. Discrete spectral components corresponding to specific Ga nearest and second nearest neighbor coordination around the Fe probe sites as observed by Newkirk and Tsuei [18] are not seen in the present spectra. This is presumably due to the disordered nature of the samples resulting from the sputtering process. However, an analysis of the relationship of hyperfine field and Ga coordination as reported by Newkirk and Tsuei [18] shows that there is a fairly well defined distinction between hyperfine field values for Fe with zero or one Ga nearest neighbor and those for Fe with two or more Ga nearest neighbors. These categories of Fe sites correspond to the high-field and low-field components, respectively, in the present spectral analysis. This same distinction has been seen by Dunlap et al. [6] for melt spun Fe-Ga alloys, at least up to about 20 at. % Ga.
The relatively smaller change in Fe hyperfine fields as a function of Ga content for x greater than about 20 may be viewed in the context of results of Kawamiya et al. [5] and Dunlap et al. [6]. Figure 23 shows that the two hyperfine field components remain more or less constant as a function of Ga (between about x = 22 and x = 28 content) at about 29 T (for the high-field component) and 20 T (for the low-field component). These two field components have been identified in the spectrum of the x = 23.3 melt spun sample by Dunlap et al. [6]. These components correspond to the two sites present in the ordered D03 phase as reported by Kawamiya et al. [5] for well-ordered samples with x near 25. Consistent with Dunlap et al. [6] the present measurements show the prevalence for local D03 ordering in Fe-Ga alloys as x approaches 25. This results from the formation of <110> Ga-Ga pairs for alloys with compositions
26 DRDC Atlantic CR 2005-171
near the stoichiometric D03 composition (x = 25). The field distributions are not as well defined as those observed by Dunlap et al. [6] for melt spun alloys, presumably as a result of the greater degree of disorder present in the sputtered samples. This may specifically be the result of the range over which Ga-Ga pairing remains correlated. For greater than about 28 at. % Ga the data suggest a slight decreasing trend in the fields associated with the two components. This may result from Ga in excess of the stoichiometric D03 amount increasing the probability of larger Ga clusters.
As seen in Figure 24, the lower field component, corresponding to Fe with two or more Ga neighbors, shows a greater Gaussian width than that for the high-field component for all Ga concentrations. This difference in Gaussian widths is most obvious above about x = 20. In the nearest neighbor shell, the diversity of Fe environments for Fe sites with zero or one Ga neighbor is limited. However, for two or more neighbor Ga atoms, the variation in Fe environments is greater and this diversity increases as Ga content increases. The relative proportions of the high and low-field components, p, as shown in Figure 25, provide considerable information about the details of the short-range order in these samples. For disordered bcc samples with randomly distributed Ga the value of p should decrease monotonically from a value of p = 1 at x = 0 with increasing Ga content. The present results clearly indicate that this behavior is not observed. In general, the low values of p for small x indicate that there is an excess number of Fe sites with more Ga neighbors than statistically expected. This same feature has been observed in melt spun Fe-Ga up to about x = 20 [6]. This results from the tendency of Ga atoms to pair along the <100> direction in the disordered bcc structure. This pairing increases the proportion of Fe sites with two Ga nearest neighbors at the expense of Fe sites with one Ga nearest neighbor. Lograsso et al. [8] have suggested this type of pairing behavior as an explanation for the large magnetostriction observed in the Fe-Ga system. The increase in p above x = 20 is consistent with a transition from a tendency for <100> Ga pairing for lower x to <110> Ga pairing as precursor to short range D03 phase formation as x approaches 25. For x greater than about 28 or 30, the value of p decreases due to the statistical probability for the formation of larger Ga clusters.
A final point of interpretation deals with the observed magnetic texture of the sample as a function of composition. There are a number of factors that influence magnetic texture including crystal structure, magnetic ordering, defects, external stress, macroscopic sample geometry, and grain structure. It is probable that the overall trends in the domain orientation as shown in Figure 21 are related to changes in the sample composition. In addition to these overall trends there is an anomalous increase near x = 25. This occurs in a composition range that corresponds to the region where we might expect changes in crystal structure and/or magnetic structure, at least on a local scale. It is tempting to attribute changes in magnetic texture to fundamental crystallographic changes. In fact, it is in this composition region that other Mössbauer parameters show some evidence for local structural and magnetic changes. For example changes in the hyperfine field distributions. The
DRDC Atlantic CR 2005-171 27
difference, however, is that (1) the changes in hyperfine field distributions occur more gradually as a function of composition while the change in A2/A3 is quite abrupt, (2) the changes in hyperfine field distributions occur fairly continuously over two libraries while the change in A2/A3 occurs just at the transition between libraries and (3) the hyperfine field distribution is relatively insensitive to properties like macroscopic sample geometry, grain structure and quenched in strains while A2/A3 is probably much more sensitive to these factors. It is, therefore, unclear if the anomalous features seen in Figure 21 result from basic structural and/or magnetic variations related to composition or merely to factors related to differences in sputtering parameters between libraries. Investigations of further libraries in this composition range would be needed to clarify this behavior.
28 DRDC Atlantic CR 2005-171
6. Conclusions and Future Work
6.1 Conclusions The combinatorial synthesis and characterization approach is effective for the fabrication of Fe-Ga thin films. Binary combinatorial thin films of Fe100-xGax with a range of 0 < x < 36 at. % Ga were made using a sputtering approach. The films were analyzed using microprobe, XRD and Mössbauer spectroscopy, all of which were designed to allow for rapid measurements of the combinatorial thin-film libraries. Microprobe data confirmed that a linear change in gallium composition was achieved along the length of each film.
XRD analysis shows a disordered bcc structure for the film for all compositions investigated and no evidence of a D03 phase occurring with increasing gallium. Lattice parameters for the thin films increased with increasing gallium, showing the same trend but with decreased lattice parameters as seen in the literature.
Mössbauer spectroscopy also confirms the absence of a D03 phase, and shows a steady increase of two or more gallium atoms for each site past x = 22. There is no evidence to suggest the existence of a D03 phase occurring, even at the atomic level. This is quite different from work done by Cullen et al. [15] that shows a D03 phase starting to form around x=19. The work by Cullen however was done on bulk samples that would have a much lower quench rate than the sputtering system used to create the combinatorial thin films studied here.
6.2 Future Work Investigation of an Fe-Ga thin film library that spans the composition range where we might expect changes in crystal structure and/or magnetic structure to occur. This is needed to distinguish magnetic textural changes that are due to structural and/or magnetic variations related to composition from factors related to differences in sputtering parameters.
Further characterization of physical and magnetic properties, especially magnetostrictive properties, of the films at different compositions need to be done. While some preliminary work was done in both of these areas through stretch tests on the Kapton substrate films, and VSM and Hall probe measurements for magnetic properties, all of the experiments provided null results.
At issue is the problem of finding a non-destructive combinatorial approach to measuring the physical and magnetic characteristics of the thin films. One possibility for magnetic measurements is the scanning Magneto-Optical Kerr Effect (MOKE) system currently being developed by the Monchesky lab at Dalhousie University and should be ready in the fall of 2005.
In addition, annealing studies may clarify the importance of thermal treatment on the structural and magnetic properties of these alloys. In particular, X-ray
DRDC Atlantic CR 2005-171 29

diffraction and Mössbauer spectroscopy studies of selected Fe-Ga compositions after different heat-treatments would permit incite into evolution of the D03 phase Eventually, study of the effects of elemental substitutions to Fe and Fe-Ga based films will be studied for the improvement of magnetostriction, formability and other key properties of these materials.
30 DRDC Atlantic CR 2005-171

7. References
1. Clark, A.E., Wun-Fogle, M. (2002). Modern magnetostrictive materials: classical and non-classical alloys. Proceedings of SPIE, 4699, 421-436
2. Clark, A.E., Wun-Fogle, M., and Lograsso, T.A. (2000). Magnetostrictive properties of Fe-Ga alloys under large compressive stresses. Magnetics Conference, 2000 IEEE International April 9-13, 177-177.
3. Butera, A., Weston, J.L., and Barnard, J.A. (2004). Ferromagnetic resonance of epitaxial Fe81Ga19(110) thin films. Journal of Magnetism and Magnetic Materials, 284, 17-25.
4. Clarke, A.E., Hathaway, K.B., Wun-Fogle, M., Restorff, J.B., Lograsso, T.A., Keppens, V.M., Petculescu, G., & Taylor, R.A. (2003). Extraordinary magnetoelasticity and lattice softening in bcc Fe-Ga alloys. Journal of Applied Physics, 93(10), 8621-8623.
5. Kawamiya, N., Adachi, K., & Nakamura, Y. (1972). Magnetic Properties and Mössbauer Investigations of Fe-Ga Alloys. Journal of the Physical Society of Japan, 33(5), 1318-1327.
6. Dunlap, R.A., McGraw, J.D., and Farrell, S.P. (2005) A Mössbauer effect study of structural ordering in rapidly quenched Fe-Ga alloys. Journal of Magnetism and Magnetic Materials (submitted).
7. McGraw, J.D., Fleischauer, M.D., Dahn, J.R., and Dunlap, R.A. (2005). Mössbauer spectroscopy of Si-Fe thin films. Physical Review B, submitted.
8. Lograsso, T.A., Ross, A.R., Schlagel, D.L., Clark, A.E., & Wun-Fogle, M. (2003). Structural transformations in quenched Fe-Ga alloys. Journal of Alloys and Compounds, 350, 95-101.
9. Dahn, J.R., Trussler, S., Hatchard, T.D., Bonakdarpour, A., Mueller-Neuhaus, J.R., Hewitt K.C., & Fleischauer, M. (2002). Economical Sputtering System To Produce Large-Size Composition-Spread Libraries Having Linear and Orthogonal Stoichiometry Variations. Chemistry of Materials, 14(8), 3519-3523.
10. Greenwood N.N. and Gibb T.C., Mössbauer Spectroscopy (Chapman and Hall, London 1971).
11. Goldanskii, V.I., and Makarov, E.F., “Fundamentals of Gamma-Resonance Spectroscopy” in Chemical applications of Mössbauer Spectroscopy, Goldanskii, V.I., and Herber, R.H., editors (Academic Press, New York 1968) pages 1-113.
DRDC Atlantic CR 2005-171 31
12. Rancourt D.G., and Ping J.Y., Voigt-based methods for arbitrary static hyperfine parameter distributions in Mössbauer spectroscopy, Nuclear Instrument and Methods in Physics Research, B58 (1991) 85-97.
13. McGraw, J.D., Fleischauer, M.D., Dahn, J.R., & Dunlap, R.A., (2005). Effect Study of Si-Fe Prepared by Combinatorial Materials Science Methods. Proc. 11th CF/DRDC International Meeting on Naval Applications of Materials Technology, Dartmouth, Nova Scotia.
14. JCPSD Database, (2001) Card # 27-1402.
15. Cullen, J.R., Clark, A.E., Wun-Fogle, M., Restorff, J.B., and Lograsso, T.A., Magnetoelasticity of Fe-Ga and Fe-Al alloys, Journal of Magnetism and Magnetic Materials, 226-230 (2001) 948-949.
16. Luo, H.L., Lattice Parameters of Iron-Rich Iron-Gallium Alloys, Transactions of the Metallurgical Society of AIME, 239 (1967) 119-120.
17. Bormio-Nunes, C., and Tirelli, M.A., Volume magnetostriction and structure of copper mold-cast polycrystalline Fe-Ga alloys, Journal of Applied Physics, 97 (2005) 033901-1-6.
18. Newkirk, L.R. and Tsuei, C.C., Mossbauer Study of Hyperfine Magnetic Interactions in Fe-Ga Solids Solutions, Phys. Rev. B 4 (1971) 4046-4053.
19. Wertheim, G.K., Jaccarino, V., Wernick J.H. and Buchanan, D.N.E. Range of the Exchange Interaction in Iron Alloys Phys. Rev. Lett. 12 (1964) 24-27.
32 DRDC Atlantic CR 2005-171

Annex A – Raw Microprobe Data
Table 3. Raw Microprobe Data
POSITION Fe Ga Si O POSITION Ga Fe Si O
Fe-Ga (A) Fe-Ga (B)
0.064 87.9784 1.7615 7.0973 3.1628 21.374 21.8096 78.0163 0.1741 0
4.272 86.6342 2.3739 7.9926 2.9993 25.479 25.4624 74.5179 0.0197 0
8.479 85.9645 3.1587 8.3978 2.479 29.584 22.6003 77.3997 0 0
12.686 85.0759 4.0177 8.6054 2.301 33.689 23.0758 76.9242 0 0
16.893 83.5256 4.9628 8.6546 2.857 37.794 23.3612 76.3477 0.2911 0
21.1 83.8878 5.8533 8.1335 2.1254 41.9 22.152 77.4937 0.3543 0
25.307 83.5904 6.6864 7.7212 2.0019 46.005 20.5031 79.3022 0.1947 0
29.514 83.5542 7.4984 7.0202 1.9271 50.111 19.4997 80.2326 0.2677 0
33.722 83.5253 8.2042 6.1953 2.0752 54.215 20.0819 79.9181 0 0
37.929 83.3945 9.2506 5.4076 1.9472 58.321 19.5589 80.0856 0.3555 0
42.136 83.4042 10.0791 4.5412 1.9756 62.426 19.078 80.6952 0.2268 0
46.343 83.6369 10.9068 3.4392 2.017 66.532 17.3124 82.3725 0.3151 0
50.55 83.8133 11.7006 2.5345 1.9516 70.636 17.2425 82.0782 0.6793 0
54.757 83.2183 12.7931 1.7497 2.2389 74.742 14.5707 84.6311 0.7982 0
58.965 82.7541 13.4778 1.229 2.5391 78.847 15.618 83.4075 0.9745 0
63.172 82.3787 14.4602 0.7287 2.4324 82.952 14.0549 84.923 1.0221 0
67.379 82.0081 15.0898 0.4528 2.4493 87.058 12.7679 86.0083 1.2239 0
71.586 79.4226 16.8766 1.3761 2.3247 91.163 14.1596 84.9126 0.9278 0
75.793 4.0384 0.6335 89.2156 6.1125 95.268 14.0964 84.8082 1.0954 0
80 0.4975 0.1009 97.4301 1.9715 99.373 10.614 83.0609 6.3251 0
Positions are Microprobe positions along the axial length of the film.
DRDC Atlantic CR 2005-171 33
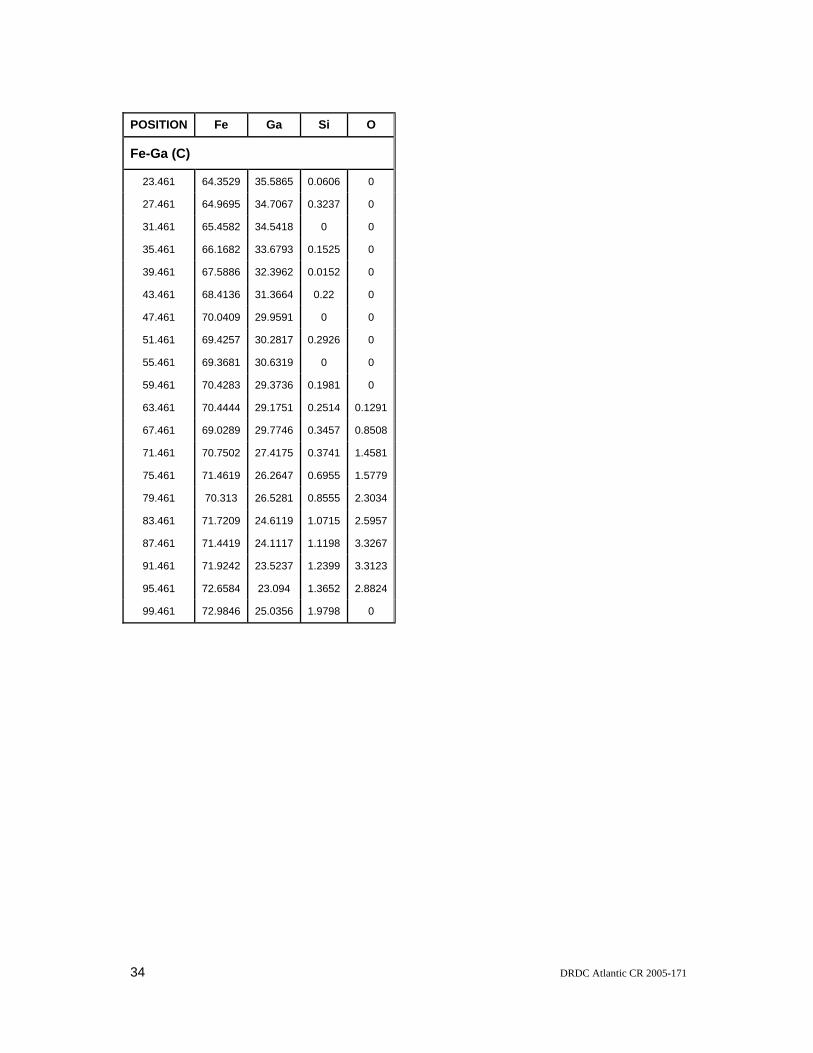
POSITION Fe Ga Si O
Fe-Ga (C)
23.461 64.3529 35.5865 0.0606 0
27.461 64.9695 34.7067 0.3237 0
31.461 65.4582 34.5418 0 0
35.461 66.1682 33.6793 0.1525 0
39.461 67.5886 32.3962 0.0152 0
43.461 68.4136 31.3664 0.22 0
47.461 70.0409 29.9591 0 0
51.461 69.4257 30.2817 0.2926 0
55.461 69.3681 30.6319 0 0
59.461 70.4283 29.3736 0.1981 0
63.461 70.4444 29.1751 0.2514 0.1291
67.461 69.0289 29.7746 0.3457 0.8508
71.461 70.7502 27.4175 0.3741 1.4581
75.461 71.4619 26.2647 0.6955 1.5779
79.461 70.313 26.5281 0.8555 2.3034
83.461 71.7209 24.6119 1.0715 2.5957
87.461 71.4419 24.1117 1.1198 3.3267
91.461 71.9242 23.5237 1.2399 3.3123
95.461 72.6584 23.094 1.3652 2.8824
99.461 72.9846 25.0356 1.9798 0
34 DRDC Atlantic CR 2005-171

Annex B – Sputtered Film Weights and Thicknesses
Table 4. Sputtered Film Weights and Thicknesses
WEIGH DISC
CENTRE POSTION
AT. % GA (X)
WEIGH DISC MASS BEFORE SPUTTERING
WEIGH DISC MASS AFTER SPUTTERING
FILM MASS FILM THICKNESS
(mm) (Calculated) (milligrams) (milligrams) (milligrams) (μm)
Fe-Ga (A)
95.5 0.4 6.8189 7.202 0.3831 0.37
108.2 3.1 6.7951 7.3151 0.52 0.50
120.9 5.7 6.801 7.31 0.509 0.49
133.6 8.4 6.8333 7.4026 0.5693 0.56
146.3 11.0 6.8492 7.4421 0.5929 0.58
159.0 13.7 6.8543 7.5387 0.6844 0.68
171.7 16.3 6.8603 7.4115 0.5512 0.55
Fe-Ga (B)
95.5 24.8 6.796 7.4753 0.6793 0.69
108.2 22.8 6.8278 7.6917 0.8639 0.88
120.9 20.8 6.8205 7.6047 0.7842 0.79
133.6 18.8 6.7699 7.498 0.7281 0.73
146.3 16.7 6.8035 7.4664 0.6629 0.66
159.0 14.7 6.8181 7.4348 0.6167 0.61
171.7 12.7 6.7865 7.1577 0.3712 0.37
Fe-Ga (C)
95.5 35.2 6.7812 7.3402 0.559 0.59
108.2 33.3 6.8133 7.9001 1.0868 1.13
120.9 31.4 6.8101 7.7235 0.9134 0.95
133.6 29.6 6.748 7.607 0.859 0.89
146.3 27.7 6.8072 7.5188 0.7116 0.73
159.0 25.9 6.7865 7.4318 0.6453 0.66
171.7 24.0 6.8092 7.2912 0.482 0.49
Note: Weigh disc centre positions are relative to the centre of the sputtering table.
DRDC Atlantic CR 2005-171 35
Distribution list
1. Norman Deschamps (2 electronic copies and 2 hardcopies) Apt. 310, 110 Keewatin Avenue Toronto, ON M4P 1Z8
2. Richard A. Dunlap (2 electronic copies and 2 hardcopies)
EMAT/FM Defence R&D Canada – Atlantic
3. Shannon Farrell (3 electronic copies and 3 hardcopies) EMAT/FM Defence R&D Canada – Atlantic
4. Calvin Hyatt (1 electronic copy)
EMAT/SH Defence R&D Canada – Atlantic
5. Rosaura Ham-Su (1 electronic copy) EMAT/FM Defence R&D Canada – Atlantic
6. Leon Cheng (1 electronic copy)
EMAT/FM Defence R&D Canada – Atlantic
7. DRDC Library (3 electronic copies and 3 hardcopies)
8. DRDKIM (1 electronic copy)
36 DRDC Atlantic CR 2005-171
DRDC Atlantic mod. May 02
DOCUMENT CONTROL DATA(Security classification of title, body of abstract and indexing annotation must be entered when the overall document is classified)
1. ORIGINATOR (the name and address of the organization preparing the document.Organizations for whom the document was prepared, e.g. Centre sponsoring acontractor's report, or tasking agency, are entered in section 8.)
Defence R&D Canada – Atlantic
2. SECURITY CLASSIFICATION !!(overall security classification of the document including special warning terms if applicable).
UNCLASSIFIED
3. TITLE (the complete document title as indicated on the title page. Its classification should be indicated by the appropriate abbreviation (S,C,R or U) in parentheses after the title).
Mössbauer effect and X-ray diffraction studies of Fe1-xGax films prepared by combinatorialmethods
4. AUTHORS (Last name, first name, middle initial. If military, show rank, e.g. Doe, Maj. John E.)
Norman Deschamps and Richard A. Dunlap
5. DATE OF PUBLICATION (month and year of publication ofdocument)
November 2005
6a. NO. OF PAGES (totalcontaining information IncludeAnnexes, Appendices, etc). 36
6b. NO. OF REFS (total citedin document)
19
7. DESCRIPTIVE NOTES (the category of the document, e.g. technical report, technical note or memorandum. If appropriate, enter thetype of report, e.g. interim, progress, summary, annual or final. Give the inclusive dates when a specific reporting period is covered).
CONTRACT REPORT 8. SPONSORING ACTIVITY (the name of the department project office or laboratory sponsoring the research and development. Include address).
Defence R&D Canada – AtlanticPO Box 1012Dartmouth, NS, Canada B2Y 3Z7
9a. PROJECT OR GRANT NO. (if appropriate, the applicable researchand development project or grant number under which the documentwas written. Please specify whether project or grant).
11gm19
9b. CONTRACT NO. (if appropriate, the applicable number underwhich the document was written).
W7707-052899/001/HAL 10a ORIGINATOR'S DOCUMENT NUMBER (the official document
number by which the document is identified by the originatingactivity. This number must be unique to this document.)
DRDC Atlantic CR 2005-171
10b OTHER DOCUMENT NOs. (Any other numbers which may beassigned this document either by the originator or by thesponsor.)
11. DOCUMENT AVAILABILITY (any limitations on further dissemination of the document, other than those imposedby security classification)( X ) Unlimited distribution( ) Defence departments and defence contractors; further distribution only as approved( ) Defence departments and Canadian defence contractors; further distribution only as approved( ) Government departments and agencies; further distribution only as approved( ) Defence departments; further distribution only as approved( ) Other (please specify): DRDC and Dalhousie University; further distribution only as approved
12. DOCUMENT ANNOUNCEMENT (any limitation to the bibliographic announcement of this document. This will normally correspond to theDocument Availability (11). However, where further distribution (beyond the audience specified in (11) is possible, a wider announcementaudience may be selected).

DRDC Atlantic mod. May 02
13. ABSTRACT (a brief and factual summary of the document. It may also appear elsewhere in the body of the document itself. Itis highly desirable that the abstract of classified documents be unclassified. Each paragraph of the abstract shall begin with anindication of the security classification of the information in the paragraph (unless the document itself is unclassified) representedas (S), (C), (R), or (U). It is not necessary to include here abstracts in both official languages unless the text is bilingual).
This research was conducted by Norman Deschamps and Richard Dunlap of DalhousieUniversity (Department of Physics and Atmospheric Science) to evaluate thecombinatorial synthesis and characterization approach for the development of Fe-Gaalloys. Binary combinatorial thin films of Fe100-xGax with a range of 0 < x < 36 at. %Ga were made using a sputtering approach. The films were analyzed using microprobe,XRD and Mössbauer spectroscopy, all of which were designed to allow for rapidmeasurements of the combinatorial systems. Microprobe data confirmed that a linearchange in gallium composition was achieved along the length of each film. XRDanalysis shows a disordered bcc structure for the film for all compositions and noevidence of a D03 phase occurring with increasing gallium. Lattice parameters for thethin films increased with increasing gallium, showing the same trend but with decreasedlattice parameters as seen in the literature. Mössbauer spectroscopy also confirms thelack of a D03 phase, and shows a steady increase of two or more gallium atoms for eachsite past x = 22. Future work will include measurement of the magnetostrictive andphysical properties of the combinatorial thin films.
14. KEYWORDS, DESCRIPTORS or IDENTIFIERS (technically meaningful terms or short phrases that characterize adocument and could be helpful in cataloguing the document. They should be selected so that no security classification isrequired. Identifiers, such as equipment model designation, trade name, military project code name, geographic location mayalso be included. If possible keywords should be selected from a published thesaurus. e.g. Thesaurus of Engineering andScientific Terms (TEST) and that thesaurus-identified. If it not possible to select indexing terms which are Unclassified, theclassification of each should be indicated as with the title).
Combinatorial, Thin-Film, Magnetron sputtering, D03, Mössbauer spectroscopyElectron microprobe analysis, X-ray diffraction, Fe-Ga, Magnetostrictive.

This page intentionally left blank.