Embed Size (px)
Citation preview

56TH CANADIAN GEOTECHNICAL CONFERENCE4TH JOINT IAH-CNC/CGS CONFERENCE2003 NAGS CONFERENCE
56ième CONFÉRENCE CANADIENNE DE GÉOTECHNIQUE4ième CONFÉRENCE CONJOINTE AIH-CCN/SCG
2003 NAGS CONFÉRENCE
CHARACTERIZATION OF GCL SHEAR STRENGTH VARIABILITYJohn S. McCartney, University of Texas at Austin, Austin, TXJorge G. Zornberg, University of Texas at Austin, Austin, TX
ABSTRACT: Variability in geosynthetic clay liner (GCL) internal and GCL-geomembrane (GM) interface shear strengthmeasured using large-scale direct shear tests is evaluated in this study. Several sources of GCL peak shear strengthuncertainty are identified, including laboratory equipment and procedures, GCL and GM material variability, andconditioning/test procedures. Uncertainty related to GCL and GM material variability is found to arise in GCL and GMspecimens taken from different manufacturing lots, with specimens from the same lot having similar behavior. Thecontributions to the material variability of the GCL fiber reinforcements, the GM textured asperities, and the bentoniteare addressed separately. GCL peel strength results do not to correlate well with GCL internal and GCL-GM shearstrength results, indicating that this test is not appropriate for characterizing the material variability in the GCL internalreinforcements or the GCL-GM interlocking capabilities. Comparison of the shear strength variability obtained forreinforced and unreinforced GCLs indicates that the contribution of the bentonite to the reinforced GCL internal shearstrength variability is relevant, though lower in magnitude than the contribution of the reinforcement. Material variabilityin the bentonite water content at the completion of the test is not a major source of internal or interface shear strengthvariability.
RÉSUMÉ: La variabilité dans le GCL interne et résistance au cisaillement d'interface de GCL-GM a mesuré employerles essais directs à grande échelle de cisaillement est évaluée dans cette étude. Plusieurs sources d'incertitudemaximale de résistance au cisaillement de GCL ont été identifiées, y compris l'équipement et les procédures delaboratoire, la variabilité matérielle de GCL et de GM, et les conditions d'essai. L'incertitude liée à la variabilité matériellede GCL et de GM s'est avérée pour surgir dans des spécimens de GCL et de GM pris de différents sorts de fabrication,avec des spécimens du même sort ayant le comportement semblable. Les contributions à la variabilité matérielle desrenforts de fiber de GCL, des aspérités texturisées une consistance rugueuse par GM, et du bentonite ont étéadressées séparément. Des résultats de résistance à peau de GCL se sont avérés pour ne pas se corréler bien avec leGCL interne et des résultats de résistance au cisaillement de GCL GM, indiquant que cet essai n'était pas appropriépour caractériser la variabilité matérielle dans les renforts internes de GCL ou les possibilités enclenchantes de GCLGM. La comparaison de la variabilité de résistance au cisaillement obtenue pour GCLs renforcé et non renforcé indiqueque la contribution du bentonite à la résistance au cisaillement interne renforcée de GCL est également appropriée à lacontribution du renfort. La variabilité matérielle dans la teneur en eau de bentonite à l'accomplissement de l'essai s'estavérée pour ne pas être une source importante de variabilité interne ou d'interface de résistance au cisaillement.
1. INTRODUCTION
Variability in GCL internal and GCL-geomembrane (GM)interface shear strength is an important topic for bothdesigners and manufacturers. Designers must considerpossible deviations from the model being used to quantifythe safety of a project, while manufacturers must evaluatequality control and material consistency. Past studieshave investigated GCL shear strength (Gilbert et al. 1996;Fox et al. 1998; Triplett and Fox 2001), but little insighthas been gained so far on variability in shear strengthvalues. This is most likely due to the high costs andlengthy times required to run the multiple large-scaledirect shear tests necessary to address GCL shearstrength variability.
This study benefits from a large database, referred hereinas the GCLSS database, which includes 375 GCLinternal and 388 GCL-GM interface large-scale (305 mmby 305 mm) direct shear tests. The GCLSS database isuseful to address the sources of GCL internal and GCL-GM interface shear strength variability. The tests wereconducted between 1992 and 2002 by Soil-GeosyntheticInteraction laboratory of GeoSyntec Consultants,currently operated by SGI Testing Services (SGI). SGI isan accredited testing facility, and used test procedures
that were consistent with ASTM D6243 (ASTM 1998),even before the standard was instituted. Test conditionsreported for each series in the GCLSS database includespecimen preparation and conditioning procedures,hydration time (th), consolidation time (tc), normal stressduring hydration (�h), normal stress during shearing (�n),and shear displacement rate (SDR). Also, the watercontent at the end of shearing (w) and the GCL peelstrength were reported for selected tests. The specificeffects of each of these variables on the GCL internal andGCL-GM interface shear strength have been addressedelsewhere (McCartney et al. 2002). The specific focus ofthis paper is on the influence of these variables on theshear strength variability.
This study includes the results of three analyses: (1)identification of the different sources of shear strengthuncertainty, (2) statistical characterization of the overallGCL internal and GCL-GM interface material variability,and (3) investigation of different properties that have beencorrelated to GCL shear strength, such as peel strengthand the bentonite water content. These analyses focuson the peak shear strength results from direct shear testsinvolving four GCL types and two GM types. These willbe referred to as GCL A (needle-punched), GCL B (stitch-bonded), GCL C (needle-punched and thermally-locked)
McCartney, J.S., and Zornberg, J.G. (2003). “Characterization of GCL Shear Strength Variability.” Proceedings of the 2003 North American Conference on Geosynthetics, Winnipeg, Canada, September 28 - October 1 (CD-ROM).

and GCL F (unreinforced bentonite sandwiched betweenwoven carrier geotextiles) as well as GM s and GM v(textured HDPE, 80-mil, different manufacturers).
2. SOURCES OF SHEAR STRENGTH UNCERTAINTY
Figures 1(a) and 1(b) show the GCL internal and GCL-GM interface shear strength results for all GCLs in theGCLSS database under different conditioning/testprocedures for normal stresses less than 100 kPa.
0
10
20
30
40
50
60
70
80
90
100
0 10 20 30 40 50 60 70 80 90 100Normal Stress, kPa
Peak
She
ar S
treng
th, k
Pa
10°
20°
30°
40°
50°60°70°80°
0
10
20
30
40
50
60
70
80
90
100
0 10 20 30 40 50 60 70 80 90 100Normal Stress, kPa
Peak
She
ar S
treng
th, k
Pa
70° 60° 50°
40°
30°
20°
10°
80�
Figure 1: Shear strength of all GCLs for �n < 100 kPa: (a)GCL Internal, (b) GCL-GM interface
This wide range of shear strength values emphasizes theneed to distinguish between the effect of physicalvariables (e.g., normal stress, conditioning/testprocedures) on the shear strength, and inherent materialvariability (e.g., variability in the fiber reinforcementdensity, water absorption by the bentonite in a givenperiod of time). This may be done through identifyingdifferent sources of uncertainty.
In this study, a source of uncertainty is defined as anaspect of equipment, material properties, orconditioning/testing procedures that lead to uncertainty inGCL shear strength. Figure 2 summarizes the differentsources of uncertainty relevant for evaluation of the GCLinternal and GCL-GM interface shear strength.
Figure 2: Sources of uncertainty
Source of uncertainty (1) is expected to arise due todifferences in measurement devices, specimen grippingmechanisms, and conditioning/testing procedures usedby different laboratories. Source (1) is not evaluated inthis study, as the shear strength information in theGCLSS database was obtained from a single laboratoryusing consistent testing procedures. Source ofuncertainty (2) is expected to arise from using differentGCL or GM types or manufacturers as well as frominherent material variability of a single GCL or GM type.Source of uncertainty (3) may arise due to differences inconditioning (e.g., hydration, consolidation) or test (e.g.,normal stress or rate of shearing) conditions, which havebeen related directly to GCL shear strength and indirectlyto differences in shear-induced pore water pressures(McCartney et al. 2002). This study is mainly concernedwith source of uncertainty (2), but the combined effect ofsources of uncertainty (2) and (3) will also be addressed.
3. UNCERTAINTY DUE TO MATERIALS ANDCONDITIONING/TEST PROCEDURES
Uncertainty due to materials is a very broad categorywhose analysis is aided by separating the GCLs/GMs intothree different categories: (i) GCLs/GMs from the samemanufacturing lot (where material differences areminimal), (ii) GCLs/GMs of the same type but fromdifferent manufacturing lots, and (iii) GCLs/GMs ofdifferent types (where material differences are maximal).In addition, shear strength variability of GCLs of the sametype but from different lots is expected to arise from GCLreinforcement or GM texturing asperity variability, as wellas from bentonite variability. The classification of shearstrength uncertainty due to materials is shown in Figure 3.
Figure 3: Uncertainty due to materials
GCL internal and GCL-GM interface shear strength uncertainty
(2) Uncertainty due to materials
(3) Uncertainty due to specimen conditioning and shear displacement rate
(1) Uncertainty due to differences in laboratory equipment and procedures
Uncertainty due to GCL and GM materials
(2-i) Repeatability of a single GCL-GM type (single lot)
(2-ii) Overall material variability of a single GCL-GM type (different lots)
(2-iii) Different GCL-GM types or manufacturers
(2-ii-a) Reinforcement and asperity variability
(2-ii-b) Bentonite variability
(a)
(b)

Source of uncertainty (2-i) should be accounted for whenthe actual manufacturing lot of the GCL to be used duringconstruction has been identified, and this project-specificinformation is available (e.g., from a project-specifictesting program). It should be noted that a GCLmanufacturing lot is not strictly standardized, but istypically defined as a set of rolls produced in a shift, dayor even week, with materials manufactured together orfrom the same source. As will be shown in section 4,GCLs and GMs taken from the same manufacturing lothave comparatively low shear strength variability, forwhich reason source of uncertainty (2-i) is referred to inthis study as the repeatability.
Source of uncertainty (2-ii) should be accounted for whenthe actual type of GCL to be used during construction hasbeen selected, but the actual manufacturing lot has notbeen identified (i.e. if project-specific information is notavailable, but product-specific data is) or there areseveral manufacturing lots used for a single project.Further evaluation of source of uncertainty (2-ii) indicatesthat the overall variability of a single GCL from differentmanufacturing lots arises from: (2-ii-a) variability ininternal GCL fiber reinforcement (or in GCL-GMinterlocking connections) and (2-ii-b) variability inbentonite composition (or in the amount of bentoniteextruded from the GCL into the GM interface). It is likelythat variability in the fiber reinforcements and thebentonite composition are also present in source (2-i) aswell, but their effects on the repeatability are significantlylower than those of source of uncertainty (2-ii).
Source (2-iii) should be accounted for when the type ofGCL and GM to be used during construction has not beenselected. It should be noted that different GCL types(needle-punched, stitch-bonded, thermally-locked,unreinforced) have different internal reinforcement typesand carrier geotextile surface treatments while differentGMs may have different polymer type and surfacetexturing. Figure 5 shows the variability in shear strengthdue to source of uncertainty (2-iii) while maintaining theconditioning/test conditions constant (with exception ofthe unreinforced GCL F). This figure indicates that theparticular internal reinforcements, and the means bywhich the reinforcements are secured to the carriergeotextiles of the GCL (e.g., thermally-locking), willsignificantly impact the shear strength of the GCL.
GCL A
GCL C
GCL B
GCL F (th = 168 hs, tc = 0 hs, SDR = 1.0 mm/min)0
50
100
150
200
250
0 50 100 150 200 250 300 350Normal Stress, kPa
Peak
She
ar S
treng
th, k
Pa Test Conditions:th = 168 hs tc = 48 hs Hydration Normal Stress = 20.7 kPaSDR = 0.1 mm/min
Figure 5: Shear strength variability due to source ofuncertainty (2-iii)
Source of uncertainty (2-ii) is examined in detail in section5 of this paper, but at this point it is interesting to view thecombined effect of source of uncertainty (2-ii) and (3).Figure 4 shows a set of internal peak shear strengthenvelopes for GCL A with four hydration scenarios. In allof the tests, the specimens were hydrated for a time thunder a normal stress equal to that used during shearing.The water content at the end of shearing increasedsignificantly from th = 0 hs to th = 24 hs but only slightly forth values beyond 24 hs. This figure shows a significantvariability for each of the failure envelopes, but a cleardecreasing peak shear strength with increasing th. Thisindicates that conditioning/test conditions should be heldconstant when examining material variability.
th = 0 hs w f,ave. = 14.5%
th = 24 hs w f,ave. = 109.9%
th = 48 hsw f,ave. = 121.8%
th = 72 hs w f,ave. = 130.7%
0102030405060708090
100110
0 15 30 45 60 75 90 105 120
Normal Stress, kPa
Peak
She
ar S
treng
th, k
Pa
0 hs24 hs48 hs72 hs
Figure 4: Shear strength variability due to sources ofuncertainty (2-ii) and (3)
4. REPEATABILITY
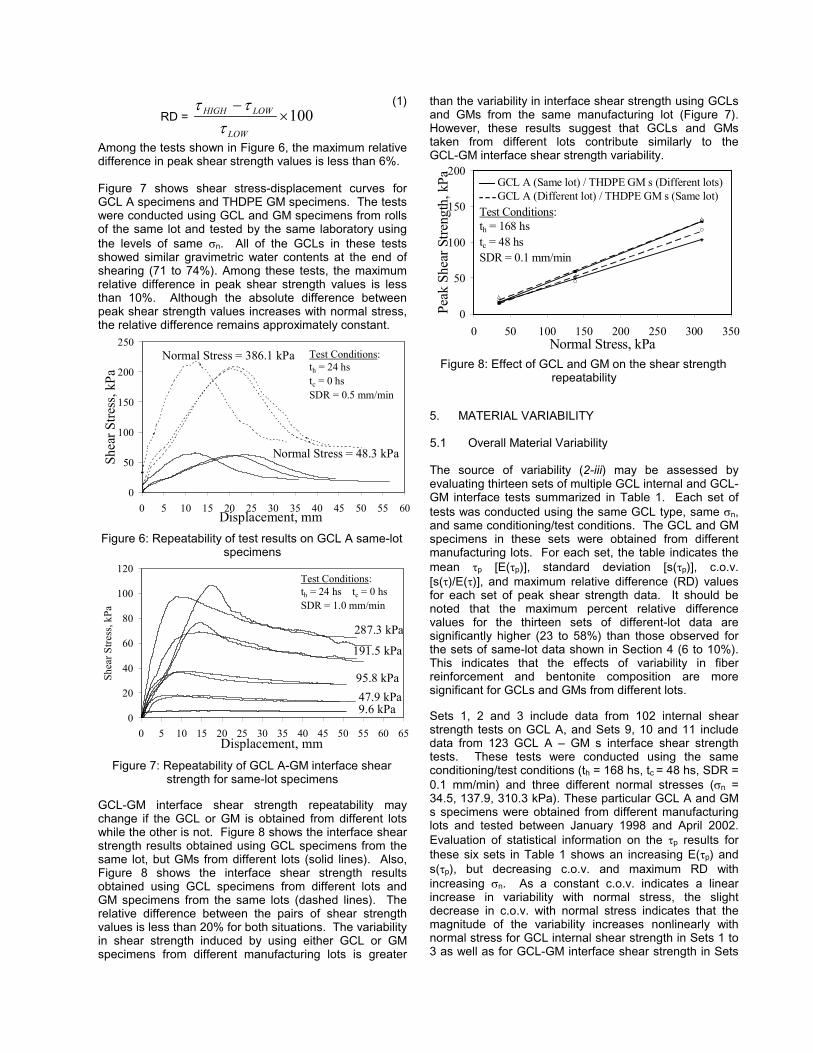
Repeatability should be evaluated in an engineering testconducted using the same materials. With GCLs, a smallamount of variability is expected in a direct shear test onthe same GCL product due to variations in the fiberreinforcement and bentonite composition. Also, as adirect shear test on reinforced GCL destroys thereinforcing structure of the GCL, multiple tests on anidentical specimen are not possible. Consequently, thesource of variability (2-i) can be assessed by comparingthe results of tests conducted by a single laboratory usingspecimens collected from a single manufacturing lot.Figure 6 shows shear stress-displacement curves forGCL A specimens obtained from rolls of the same lot andtested by the same laboratory using the same levels of�n. All of these specimens had approximately the samegravimetric water contents at the end of shearing (about90%). These results illustrate that a very goodrepeatability can be achieved in the stress-strain-strengthresponse when tests are conducted in the samelaboratory using same-lot specimens. As there are onlythree peak shear strength values to compare at eachnormal stress, the percent relative difference is a betterquantification of the repeatability than the standarddeviation. The relative difference, RD, is defined as:
RD = 100�
�
LOW
LOWHIGH
�
��(1)
Among the tests shown in Figure 6, the maximum relativedifference in peak shear strength values is less than 6%.
Figure 7 shows shear stress-displacement curves forGCL A specimens and THDPE GM specimens. The testswere conducted using GCL and GM specimens from rollsof the same lot and tested by the same laboratory usingthe levels of same �n. All of the GCLs in these testsshowed similar gravimetric water contents at the end ofshearing (71 to 74%). Among these tests, the maximumrelative difference in peak shear strength values is lessthan 10%. Although the absolute difference betweenpeak shear strength values increases with normal stress,the relative difference remains approximately constant.
0
50
100
150
200
250
0 5 10 15 20 25 30 35 40 45 50 55 60Displacement, mm
Shea
r Stre
ss, k
Pa
Test Conditions:th = 24 hstc = 0 hsSDR = 0.5 mm/min
Normal Stress = 386.1 kPa
Normal Stress = 48.3 kPa
Figure 6: Repeatability of test results on GCL A same-lotspecimens
0
20
40
60
80
100
120
0 5 10 15 20 25 30 35 40 45 50 55 60 65Displacement, mm
Shea
r Stre
ss, k
Pa
Test Conditions:th = 24 hs tc = 0 hsSDR = 1.0 mm/min
191.5 kPa
287.3 kPa
95.8 kPa47.9 kPa9.6 kPa
Figure 7: Repeatability of GCL A-GM interface shearstrength for same-lot specimens
GCL-GM interface shear strength repeatability maychange if the GCL or GM is obtained from different lotswhile the other is not. Figure 8 shows the interface shearstrength results obtained using GCL specimens from thesame lot, but GMs from different lots (solid lines). Also,Figure 8 shows the interface shear strength resultsobtained using GCL specimens from different lots andGM specimens from the same lots (dashed lines). Therelative difference between the pairs of shear strengthvalues is less than 20% for both situations. The variabilityin shear strength induced by using either GCL or GMspecimens from different manufacturing lots is greater
than the variability in interface shear strength using GCLsand GMs from the same manufacturing lot (Figure 7).However, these results suggest that GCLs and GMstaken from different lots contribute similarly to theGCL-GM interface shear strength variability.
0
50
100
150
200
0 50 100 150 200 250 300 350Normal Stress, kPa
Peak
She
ar S
treng
th, k
Pa
Test Conditions:th = 168 hstc = 48 hsSDR = 0.1 mm/min
GCL A (Same lot) / THDPE GM s (Different lots)GCL A (Different lot) / THDPE GM s (Same lot)
Figure 8: Effect of GCL and GM on the shear strengthrepeatability
5. MATERIAL VARIABILITY
5.1 Overall Material Variability
The source of variability (2-iii) may be assessed byevaluating thirteen sets of multiple GCL internal and GCL-GM interface tests summarized in Table 1. Each set oftests was conducted using the same GCL type, same �n,and same conditioning/test conditions. The GCL and GMspecimens in these sets were obtained from differentmanufacturing lots. For each set, the table indicates themean �p [E(�p)], standard deviation [s(�p)], c.o.v.[s(�)/E(�)], and maximum relative difference (RD) valuesfor each set of peak shear strength data. It should benoted that the maximum percent relative differencevalues for the thirteen sets of different-lot data aresignificantly higher (23 to 58%) than those observed forthe sets of same-lot data shown in Section 4 (6 to 10%).This indicates that the effects of variability in fiberreinforcement and bentonite composition are moresignificant for GCLs and GMs from different lots.
Sets 1, 2 and 3 include data from 102 internal shearstrength tests on GCL A, and Sets 9, 10 and 11 includedata from 123 GCL A – GM s interface shear strengthtests. These tests were conducted using the sameconditioning/test conditions (th = 168 hs, tc = 48 hs, SDR =0.1 mm/min) and three different normal stresses (�n =34.5, 137.9, 310.3 kPa). These particular GCL A and GMs specimens were obtained from different manufacturinglots and tested between January 1998 and April 2002.Evaluation of statistical information on the �p results forthese six sets in Table 1 shows an increasing E(�p) ands(�p), but decreasing c.o.v. and maximum RD withincreasing �n. As a constant c.o.v. indicates a linearincrease in variability with normal stress, the slightdecrease in c.o.v. with normal stress indicates that themagnitude of the variability increases nonlinearly withnormal stress for GCL internal shear strength in Sets 1 to3 as well as for GCL-GM interface shear strength in Sets

9 to 11. Comparing the variability in internal and interfaceshear strength values, the maximum RD are similar, whilethe c.o.v. values of the interface data are slightly lower.
As the mean interface shear strength is lower than themean internal shear strength, the lower c.o.v. values forthe interface results indicates that the variability is lowerfor internal shear strength for the same conditioning/testprocedures and normal stresses. This is most likely dueto differences in internal and interface shear strengthmobilization (e.g., bentonite shear strength, GCL internalreinforcements, or GM asperity-GCL connections).
Sets 4, 5 and 6 in Table 1 include variability data fromadditional direct shear tests conducted using the sameGCL tested in Sets 1, 2 and 3 (GCL A, needle-punched),but using different conditioning/test conditions and normalstresses. Set 4 includes GCL A specimens that weresheared under unhydrated conditions at a high normalstress (517.1 kPa). A lower variability is observed inthese shear strength values than in Sets 1 to 3, asquantified by the c.o.v. and the maximum RD. Sets 5 and6 include GCL A specimens tested under two hydrationconditions at a low normal stress (9.6 kPa). The shearstrength variability in these two sets differs significantly,with Set 5 having the lowest variability and Set 6 havingone of the highest. Although the normal stress and theconditioning/test conditions are not the main source ofGCL shear strength variability, evaluation of Sets 4, 5 and6 indicate that the magnitude of variability is affected byboth. Tests with longer hydration times and lower normalstress show higher variability. Sets 7 and 8 include datafrom other GCLs: GCL B (stitch-bonded) and GCL F(unreinforced) tested under the same conditions andnormal stress as Set 6. Although the mean shearstrength values of Sets 6 and 7 are very different (theyhave different reinforcement), Set 6 still shows relativelyhigh variability. This indicates that the GCL reinforcementtype may affect the shear strength variability slightly, butthe material variability within a single GCL type (fromdifferent lots) is more significant. Set 8 will be discussedin more detail in Section 5.3.
Sets 12 through 14 in Table 1 include variability data froma set of 21 direct shear tests conducted using the sameGCL tested in Sets 9 to 11 (GCL A), but a different GM(GM v) and different conditioning/test conditions (th = 24hs, tc = 0 hs, SDR = 1.0 mm/min). Three different �n(172.4, 344.7, and 689.5 kPa) were used in this program.The different GM and conditioning/test conditions led to arelatively constant c.o.v. and maximum RD value,indicating that variability increases linearly with normalstress. This c.o.v. is smaller than that obtained for Sets9, 10, and 11 using different conditioning/test conditions,suggesting that conditioning/testing procedures havesome effect on the GCL-GM interface variability.
Figure 9 shows the actual probability density functions(PDFs) for �p at each �n (Sets 1, 2, 3, 9, 10 and 11 inTable 1). These PDFs quantify the statistical informationon �p useful for reliability-based design or dataforecasting. Also included in each figure are twoparametric PDFs (normal and lognormal) and onenonparametric PDF for the data sets. The nonparametricPDF was developed using a normal kernel densityfunction (Bowman and Azzalani 2000). Thenonparametric PDFs were developed by creating locally-weighted PDFs at each value, and adding them todevelop a global PDF. Nonparametric PDFs are capableof capturing the actual trends in the data, whileparametric PDFs are restricted by their underlyingmathematical model. This is apparent in Figure 10(a),10(b), and 10(c), where bimodal trends in GCL internalpeak shear strength is observed. The parametricdensities could not capture the bimodality, while thenonparametric densities capture the shape of the data.This bimodality is most likely due changes in theproperties of GCL A over the time period of this testingprogram. The parametric and nonparametric densitiescapture the behaviour of the GCL-GM interface shearstrength data equally well. The interface shear strengthvalues are slightly skewed to lower shear strength values.Although the normal density also appears to capture theoverall trend in the data, negative values are possible bythe underlying model.
Table 1: Statistical Analysis of Selected GCL Internal and GCL-GM Interface Shear Strength Sets
TypeManufacturer
label TypeManufacturer
label Thicknessth
(hs)tc
(hs)SDR
(mm/min)
Mean E(�p) (kPa)
St.dev. s(�p) (kPa)
c.o.v.
1 Needle-punched A 34 168 48 0.1 34.5 38.8 10.3 0.26 562 Needle-punched A 34 168 48 0.1 137.9 94.5 22.0 0.23 543 Needle-punched A 34 168 48 0.1 310.3 176.3 33.6 0.19 514 Needle-punched A 5 0 0 1.0 517.1 404.4 41.4 0.10 235 Needle-punched A 8 24 0 1.0 9.6 25.2 1.3 0.05 136 Needle-punched A 18 48 0 1.0 9.6 31.1 5.8 0.19 557 Stitch-bonded B 5 48 0 1.0 9.6 26.4 3.3 0.12 278 Unreinforced F 6 24 0 1.0 9.6 3.9 0.7 0.19 359 Needle-punched A THPDE s 80-mil 41 168 48 0.1 34.5 18.0 3.8 0.21 5810 Needle-punched A THPDE s 80-mil 41 168 48 0.1 137.9 60.8 9.6 0.16 5011 Needle-punched A THPDE s 80-mil 41 168 48 0.1 310.3 122.9 16.6 0.14 4212 Needle-punched A THPDE v 80-mil 7 24 0 1.0 172.4 73.5 8.1 0.11 2713 Needle-punched A THPDE v 80-mil 7 24 0 1.0 344.7 138.5 16.5 0.12 3114 Needle-punched A THPDE v 80-mil 7 24 0 1.0 689.5 264.6 31.8 0.12 34
GCL information GM information
Set number
Normal Stress (kPa)
Number of tests
Test conditions Peak shear strengthMaximum
RD (%)
InternalInternal
InternalInternalInternal
InternalInternalInternal

Because of the bimodal distribution noted in the internalGCL shear strength data, the statistics (e.g., mean,standard deviation) may be affected by the location of thetwo modes. Bootstrap sampling (Efron and Tibshirani1993) constitutes an interesting analysis tool useful forproviding nonparametric confidence intervals on thestatistics, as well as allowing further comparison betweenthe statistics for the different sets in Table 1.Bootstrapping involves randomly selecting values from acurrent sample (with replacement after selection) to forma new sample with the same size as the current sample.It is likely that the new sample will have different valuesthan the current sample as well as different statistics. If
this is repeated several times, a range of statistics maybe found, which can be evaluated using a boxplot. Theparticular boxplot used in this study includes a boxdefined by the 25 and 75% quantiles of the data set, acenter line defined by the median, whiskers defined bythe 10 and 90% quantiles, as well as any outliers.Figure 10 shows the boxplots of the means, standarddeviations and maximum relative differences frombootstrapped samples of Internal GCL Sets 1, 2, 3, andGCL-GM Interface Sets 9, 10 and 11. Plotted on top ofthe boxplots are arrows indicating the value of the statisticcalculated for the original data sets, which correspondwell with the center line of the boxplots. The boxplots for
Figure 10: Boxplots of bootstrapped statistics of internal and interface shear strength sets in Table 1 (arrows = originalvalues): (a) Means; (b) Standard deviations; (c) c.o.v. values; (d) Means; (e) Standard deviations; (f) c.o.v. values
Figure 9: PDFs of the peak shear strength data: (a) Set 1; (b) Set 2; (c) Set 3; (d) Set 9; (e) Set 10; (f) Set 11; Note: Solid line =Nonparametric PDF, Dashed line = Normal PDF; Dotted line = Lognormal PDF
(a) (b) (c)
(e)(d) (f)
(a) (b) (c)
(e) (f)(d)
�p, (kPa) �p, (kPa) �p, (kPa)
�p, (kPa) �p, (kPa) �p, (kPa)
E(�p) s(�p) c.o.v.
E(�p) s(�p) c.o.v.
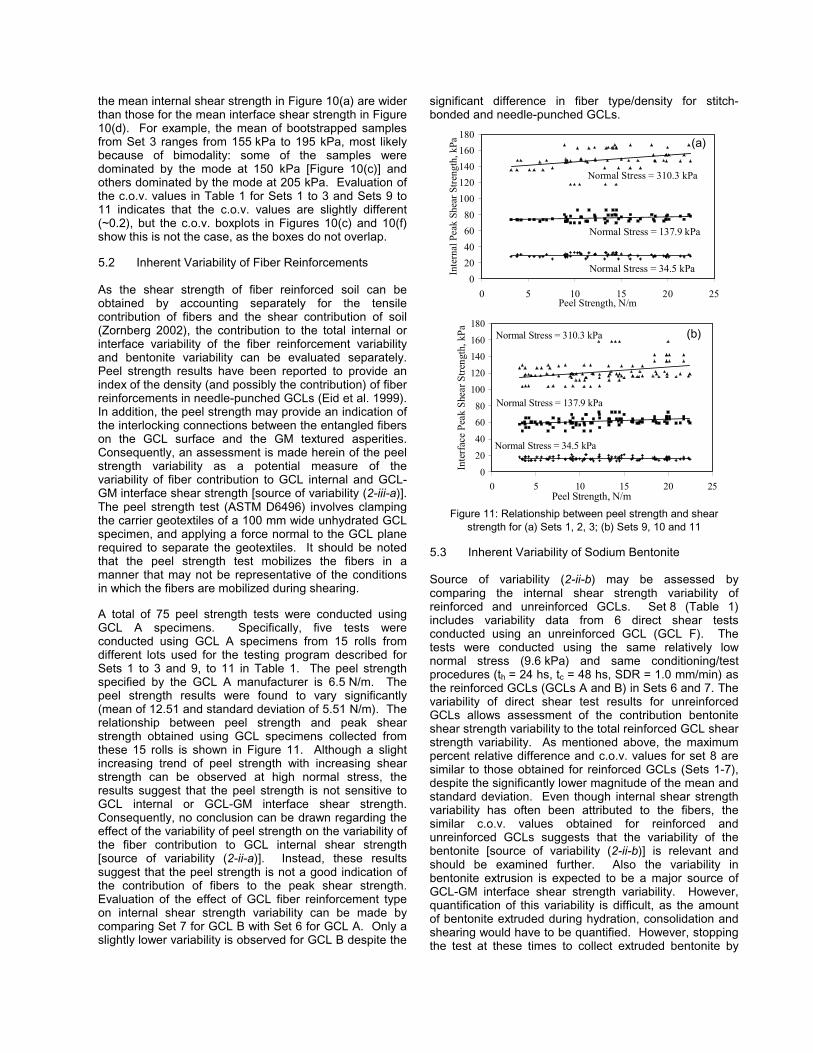
the mean internal shear strength in Figure 10(a) are widerthan those for the mean interface shear strength in Figure10(d). For example, the mean of bootstrapped samplesfrom Set 3 ranges from 155 kPa to 195 kPa, most likelybecause of bimodality: some of the samples weredominated by the mode at 150 kPa [Figure 10(c)] andothers dominated by the mode at 205 kPa. Evaluation ofthe c.o.v. values in Table 1 for Sets 1 to 3 and Sets 9 to11 indicates that the c.o.v. values are slightly different(~0.2), but the c.o.v. boxplots in Figures 10(c) and 10(f)show this is not the case, as the boxes do not overlap.
5.2 Inherent Variability of Fiber Reinforcements
As the shear strength of fiber reinforced soil can beobtained by accounting separately for the tensilecontribution of fibers and the shear contribution of soil(Zornberg 2002), the contribution to the total internal orinterface variability of the fiber reinforcement variabilityand bentonite variability can be evaluated separately.Peel strength results have been reported to provide anindex of the density (and possibly the contribution) of fiberreinforcements in needle-punched GCLs (Eid et al. 1999).In addition, the peel strength may provide an indication ofthe interlocking connections between the entangled fiberson the GCL surface and the GM textured asperities.Consequently, an assessment is made herein of the peelstrength variability as a potential measure of thevariability of fiber contribution to GCL internal and GCL-GM interface shear strength [source of variability (2-iii-a)].The peel strength test (ASTM D6496) involves clampingthe carrier geotextiles of a 100 mm wide unhydrated GCLspecimen, and applying a force normal to the GCL planerequired to separate the geotextiles. It should be notedthat the peel strength test mobilizes the fibers in amanner that may not be representative of the conditionsin which the fibers are mobilized during shearing.
A total of 75 peel strength tests were conducted usingGCL A specimens. Specifically, five tests wereconducted using GCL A specimens from 15 rolls fromdifferent lots used for the testing program described forSets 1 to 3 and 9, to 11 in Table 1. The peel strengthspecified by the GCL A manufacturer is 6.5 N/m. Thepeel strength results were found to vary significantly(mean of 12.51 and standard deviation of 5.51 N/m). Therelationship between peel strength and peak shearstrength obtained using GCL specimens collected fromthese 15 rolls is shown in Figure 11. Although a slightincreasing trend of peel strength with increasing shearstrength can be observed at high normal stress, theresults suggest that the peel strength is not sensitive toGCL internal or GCL-GM interface shear strength.Consequently, no conclusion can be drawn regarding theeffect of the variability of peel strength on the variability ofthe fiber contribution to GCL internal shear strength[source of variability (2-ii-a)]. Instead, these resultssuggest that the peel strength is not a good indication ofthe contribution of fibers to the peak shear strength.Evaluation of the effect of GCL fiber reinforcement typeon internal shear strength variability can be made bycomparing Set 7 for GCL B with Set 6 for GCL A. Only aslightly lower variability is observed for GCL B despite the
significant difference in fiber type/density for stitch-bonded and needle-punched GCLs.
Normal Stress = 34.5 kPa
Normal Stress = 137.9 kPa
Normal Stress = 310.3 kPa
020406080
100120140160180
0 5 10 15 20 25Peel Strength, N/m
Inte
rnal
Pea
k Sh
ear S
treng
th, k
Pa
Normal Stress = 310.3 kPa
Normal Stress = 137.9 kPa
Normal Stress = 34.5 kPa
0
20
40
60
80
100
120
140
160
180
0 5 10 15 20 25Peel Strength, N/m
Inte
rfac
e Pe
ak S
hear
Stre
ngth
, kPa
Figure 11: Relationship between peel strength and shearstrength for (a) Sets 1, 2, 3; (b) Sets 9, 10 and 11
5.3 Inherent Variability of Sodium Bentonite
Source of variability (2-ii-b) may be assessed bycomparing the internal shear strength variability ofreinforced and unreinforced GCLs. Set 8 (Table 1)includes variability data from 6 direct shear testsconducted using an unreinforced GCL (GCL F). Thetests were conducted using the same relatively lownormal stress (9.6 kPa) and same conditioning/testprocedures (th = 24 hs, tc = 48 hs, SDR = 1.0 mm/min) asthe reinforced GCLs (GCLs A and B) in Sets 6 and 7. Thevariability of direct shear test results for unreinforcedGCLs allows assessment of the contribution bentoniteshear strength variability to the total reinforced GCL shearstrength variability. As mentioned above, the maximumpercent relative difference and c.o.v. values for set 8 aresimilar to those obtained for reinforced GCLs (Sets 1-7),despite the significantly lower magnitude of the mean andstandard deviation. Even though internal shear strengthvariability has often been attributed to the fibers, thesimilar c.o.v. values obtained for reinforced andunreinforced GCLs suggests that the variability of thebentonite [source of variability (2-ii-b)] is relevant andshould be examined further. Also the variability inbentonite extrusion is expected to be a major source ofGCL-GM interface shear strength variability. However,quantification of this variability is difficult, as the amountof bentonite extruded during hydration, consolidation andshearing would have to be quantified. However, stoppingthe test at these times to collect extruded bentonite by
(a)
(b)

separating the GCL from the GM would change theproperties of the interface. The amount of extrusion atthe end of the test is likely to be similar for most GCL-GMtests, as McCartney et al. (2002) reported that GCL-GMinterfaces have similar large-displacement shearstrength.
0
50
100
150
200
250
300
0 20 40 60 80 100 120Final GCL Water Content, %
Inte
rnal
Pea
k Sh
ear S
treng
th, k
Pa
34.5 kPa137.9 kPa310.3 kPa
Normal Stress
Test Conditions:th = 168 hs�h = 20.7 kPatc = 48 hsSDR = 0.1 mm/min
0
50
100
150
200
250
300
0 20 40 60 80 100 120Final GCL Water Content, %
Inte
rface
Pea
k Sh
ear S
treng
th, k
Pa
34.5 kPa137.9 kPa310.3 kPa
Normal Stress
Test Conditions:th = 168 hs�h = 20.7 kPatc = 48 hsSDR = 0.1
Figure 12: Relationship between GCL water content atthe end of shearing and (a) GCL internal shear strength(Sets 1 to 3); (b) GCL-GM interface shear strength (Sets
9 to 11)
Another factor related to the contribution of bentonite toGCL shear strength variability is the water content of theGCL. It is expected that higher water contents will lead tolower GCL shear strength as the bentonite has a lowersuction. If the bentonite component of different GCLsabsorbs variable quantities of water in the same timeperiod, then this variability may be related to the shearstrength variability. However, Figure 12 shows that thewater content measured at the end of the test for theGCLs in Sets 1 to 3 and Sets 9-11 does not correlate wellwith the peak GCL internal or GCL-GM interface shearstrength. This indicates that the variability in the quantityof water absorbed during a fixed period of time does notaffect the shear strength variability.
6. CONCLUSIONS
A database of 375 GCL internal and 388 GCL-GMinterface shear strength tests was used to analyze the
sources of GCL shear strength variability. The followingconclusions may be drawn from this study:� Good repeatability of results was obtained for tests
conducted by the same laboratory using GCL/GMspecimens from the same manufacturing lot.However, significant variability was obtained for testsconducted using different-lot GCL/GM specimens.
� Conditioning/test procedures, normal stress andinternal reinforcements were found to have someeffect on the variability.
� Peel strength was found not to correlate well with theGCL internal or GCL-GM interface peak shearstrength. The peel strength variability cannot beused to infer the effect of fibers on the variability ofGCL and GCL-GM shear strength.
� The unreinforced GCL shear strength variability wasfound to be high relative to the magnitude of themean shear strength, suggesting that the bentoniteshear strength variability may contribute to reinforcedGCL shear strength variability.
� The bentonite water content at the end of shearingwas found not to correlate well with GCL internal orGCL-GM interface shear strength, indicating that thevariability in the quantity of water absorbed during afixed period of time does not affect significantly thepeak shear strength.
REFERENCES
American Society of Testing and Materials. (1998)."Standard Test Method for Determining the Internaland Interface Shear Resistance of GeosyntheticClay Liner by the Direct Shear Method." ASTMD6243. West Conshohocken, Pennsylvania.
American Society of Testing and Materials. (1999)."Standard Test Method for Determining AverageBonding Peel Strength between the Top andBottom Layers of Needle-Punched GeosyntheticClay Liners." ASTM D6496. West Conshohocken,Pennsylvania.
Bowman, A.W. Azzalini, A. (2000). Applied SmoothingTechniques for Data Analysis : the KernelApproach with S-Plus Illustrations. ClarendonPress, Oxford.
Efron, B., and Tibshirani, R. (1993). An Introduction to theBootstrap. Chapman & Hall, New York.
Fox, P. J., Rowland, M. G., and Scheithe, J. R. (1998)."Internal Shear Strength of Three GeosyntheticClay Liners." Journal of Geotechnical andGeoenvironmental Engineering, ASCE, 124(10),933-944.
Gilbert, R. B., Fernandez, F. F., and Horsfield, D. (1996)."Shear Strength of a Reinforced Clay Liner."Journal of Geotechnical and GeoenvironmentalEngineering, ASCE, 122(4), 259-266.
McCartney, J.S., Zornberg, J.G., and Swan, R. (2002).Internal and Interface Shear Strength ofGeosynthetic Clay Liners (GCLs). GeotechnicalResearch Report, Department of Civil,Environmental and Architectural Engineering,University of Colorado at Boulder, 471 p.
(b)
(a)

Triplett, E. J., and Fox, P. J. (2001). "Shear Strength ofHDPE Geomembrane/Geosynthetic Clay LinerInterfaces." Journal of Geotechnical andGeoenvironmental Engineering, ASCE, 127(6),543-552.
Zornberg, J.G. (2002). “Discrete Framework for LimitEquilibrium Analysis of Fibre-Reinforced Soil.”Géotechnique, Vol. 52, No. 8, pp. 593-604.