Embed Size (px)
Citation preview

Module Detail
Subject Name Political Science
Paper Name 02: Indian Politics: II
Module
Name/Title
Changing Nature of Political Participation and
Representation
Module Id
Pre-requisites
Objectives To discuss the Changing Nature of Political
Participation and Representation through
voting in India.
To understand the Rise in the number and
presence of Regional Political parties
through Changing Nature of Political
Participation and Representation
Keywords Political Participation and Representation, Regional
Political Parties, Voting Behavior, Voter Turnout.

Changing Nature of Political Participation and Representation
If we look at how politics in India has changed both at national and state level, we see that a
lot of changes have taken place especially during the last decade or so. It may be difficult to
trace all the changes but the most important change that has taken place is that state politics
has acquired a very important place in politics of India.
The emergence of state as the principal arena of political contestation is linked to the
beginning of the post- Congress Polity (also called the third Electoral System). In the first
two decades Congress use to win both National and State elections with a very huge margin.
1970’s - 1980’s saw a difference between national and state level politics. This was the
second electoral system where national politics was the principal arena that overshadowed
state politics. It was only in 1990’s that the elections to the assemblies attained autonomy and
Role Name Affiliation
Principal Investigator Professor Ashutosh Kumar Panjab
University,
Chandigarh
Paper Coordinator Prof. Sanjay Lodha;
Prof. Rekha Saxena
MLS,University,
Udaipur
Delhi
University,
Delhi
Content Writer/Author
(CW)
Research Associate Vibha
Attri
CSDS, Delhi
Content Reviewer (CR) Prof. Asha Sarangi JNU, New Delhi
Language Editor (LE) Professor Ashutosh Kumar, Panjab
University,
Chandigarh

also the ability to shape the outcome of the national elections1. With sizeable electoral
support, the regional parties have not only managed to win elections and form state
governments, but they have also influenced the national Parties2.
This led to a greater level of recognition of state as the primary unit of analysis and further
to emergence of state politics as an autonomous discipline, whose study is now being
considered essential for understanding of Indian politics.
Single party ruled almost every state for many years but the leaders were unable to identify
the local or regional needs of the particular state, and this gave rise to new regional parties.
The Rise of regional parties and the fall of national parties in India led to coalition
governments at the center. It became difficult for any single national party to come to power
on its own and form the government at the center. During the last two decades, the rise of
regional parties has influenced not only state politics but also the national politics.
As state parties and politics were gaining a lot of importance therefore state politics saw
many publications of volumes on state politics edited by Myron Weiner(1968), Iqbal Narain
(1976), John R Wood(1984) and Francis Frankel and MSA Rao (1990)3. Atul Kohli (1987)
was the first to employ comparative method and he argued that India constituted a
“laboratory for comparative political analysis” which meant that despite having so many
states with quite varied politics, the fact remains that these states are within the same “frame
work of Indian Federalism” and therefore present an ideal type conditions for “controlled
1 Yadav, Yogendra and Suhas Palshikar. 2009. “Ten theses on state politics in India”. In Electoral Politics in
Indian States. Lok Sabha Elections in 2004 and Beyond edited by Sandeep Shastri, K.C. Suri and Yogendra
Yadav, 46-63. Delhi: Oxford University Press.
2 Sanjay Kumar “The turbulent rise of regional parties: A many-sided threat for Congress”. Online available at:
http://www.lokniti.org/pdfs_dataunit/S.Kumar.pdf pp 1-7.
3 The first three edited volumes mentioned above, included state specific papers that focused on listing the
determinants of state level political dynamics in greater empirical details. These volumes presented detailed
analysis of the nature and dynamic of political processes in the particular states, adopting a political sociological
approach. The two volumes edited by Rao and Frankel belonged to different kind and which was much more in
tune with the then emergent trend in the study of sate politics, as the essays focused in the historical pattern of
political transformation that is taking place in particular states especially in terms of land questions. However all
theses state specific studies did not use a comparative method of studying different states.

experiments”4. The first group of studies that came up focused on in depth on a single state
but was not comparative in nature. These studies include those of Jagpal Singh (1992).
Narendra Subramanian (1999), Zoya Hassan ( 1989) , Sanjib Barua (1999), Pradeep Kumar
(2000), Navneeta Chadha Behra (2000), Amit Prkash(2002), Christophe Jaffrelot (2003) and
Gyanesh Kudasia(2006).
The second group consists of studies done by Centre for the Study of Developing Societies.
Lokniti conducted National election study (NES) survey data would fall into the second
category5. The important volumes which using NES data showed the nature of electoral
democracy in India (Yadav 1996; Chibber 1999; Miitra and Singh 1999; Palshikar 2004; Suri
2005; Yadav and Palshikar 2006, 20008, 2009; Heat et al 2006; Varshney 2007) In the same
Lokniti Genre falls the volumes edited by Hansen and Jaffrelot (2001) and Roy and Wallace
(2003 and 20007).
The writings, that used a comparative method to see the commonalities and differences in the
politics of two or more comparable state are Atul Kohli(1987), Emma Mawdsley(1998), John
Harris (1999), Ashutosh Varshney (2002), Gurharpal Singh (2002), Knachan Chandra (2005)
Aseema Sinha (2005), Subrata K Mitra (2006), and Niraja Giopal Jyal (20006) & Rob
Jenkins (2004).
Work on state politics started increasing and it came to believed that the Lok Sabha election
is nothing but an aggregation of state level elections. While emphasizing the autonomy of
state politics from national politics, Yogendra Yadav and Suhas Palshikar (2008) laid out the
Ten theses on state politics in India in which they present critical a “preliminary frame” for
4 Kumar, Ashutosh. 2009. “Rethinking State Politics in India. Regions within Regions”. Economic and Political
Weekly 44 (19): 14-19.
http://www.epw.in/system/files/pdf/2009_44/19/Rethinking_State_Politics_in_India_Regions_within_Regions.
pdf.
5 These readings not only reveal the basic determinants of electoral politics in the state like demographic
composition and nature of ethnic /communal/ caste cleavages as well as other socio- political cleavages like the
regional, rural urban pattern and caste- class linkages but also present and analysis of electoral outcome focusing
on differences in major issues raised, emergent trends, alliance formation, seat adjustment, selection of
candidates and campaign and so on.

interstate comparative analysis by presenting the critical issues for enquiry in the form of
what they call the ten theses on state politics in India “Ten Theses on State Politics in India”6.
We will focus here on Fifth thesis as this thesis relates to Political participation.
Thesis five: Higher and more intense political participation at the state level has widened the
base of democracy and sustained its legitimacy without enriching the quality of democratic
outcomes.
This thesis relates to the degree, intensity and the quality of political participation at the state
level. The emergence of the state as the principal locus of political choice has meant that
electoral participation at the state level is higher than the national level. This chapter will deal
with this changing role of political participation.
POLITICAL PARTICIPATION:-
Political participation is an essential part of the democratic process. Political participation
derives from the freedom to speak out, assemble and associate; the ability to take part in the
conduct of public affairs; and the opportunity to register as a candidate, to campaign, to be
elected and to hold office at all levels of government. A very important aspect of
Participation in electoral processes involves voting. Voter turnout is one of the best indicators
of people’s participation in the electoral process but participation implies much more than the
act of voting.
Over the years, the participation has gone up both in terms of electoral turnout and in election
related political activity. The level of participation varies from state to state. On the whole,
smaller states seem to have higher participation. States like Gujarat, Rajasthan and Andhra
Pradesh, and also larger states like Bihar and U.P record lower level of participation in
elections and election related activity.
To start with, Turnout is one of the best indicators of electoral participation in the electoral
process. Let us see what changes have taken place as far as electoral participation of different
states is concerned.
6 Yadav & Palshikar. 2009. Op.cit.

Participation in terms of electoral turn out/ Voting:-
The success and legitimacy of election relies on citizen’s involvement in voting. The first few
Lok Sabha elections saw low level turnout, but this increased soon after. Over the years,
political participation has gone up both in terms of electoral turnout and in election related
political activities. The Lok Sabha elections held during the two decades have witnessed
nearly 60 percent turnout, the only exception was the 1991 Lok Sabha elections when the
turnout dropped to 55.9 percent. If we look at the state level turn out we see that participation
varies from state to state. Smaller states seem to have higher participation. The state wise turn
out in the 2009 Lok Sabha elections was not very different from previous elections. States
with the history of higher turnout witnessed higher turnout and the ones with lower turnout
registered a low turnout. Bihar and Punjab being the two exceptions. Table 1.1 shows state
wise turnout in Lok Sabha elections. We have further divided it into three categories of States
with significant increase in participation, States with minor increase in participation, States
with more or less similar level of participation and States with lower level of participation
Table 1:- State wise Turn out Lok Sabha Elections (%)
Average
(1989-2009)
2004 2009
States with significant increase in participation
Arunachal Pradesh 60.18 56.3 68.04
Manipur 69.08 67.4 77.16
Meghalaya 59.25 52.7 64.38
Punjab 56.63 61.6 69.75
Tamil Nadu 63.91 60.8 72.99
Tripura 75.80 66.9 84.45
Sikkim 74.09 77.9 83.75
States with minor increase in participation
Andhra Pradesh 67.48 69.9 72.61
Chhattisgarh 53.69 52.1 55.29

Delhi 49.59 47.1 51.84
Gujarat 47.69 45.2 47.84
Haryana 66.64 65.7 67.41
Jammu and Kashmir 37.67 35.2 39.67
Kerala 72.77 71.5 73.33
Madhya Pradesh 52.79 48.1 51.16
Uttarakhand 50.65 48.1 53.21
West Bengal 79.00 78.0 81.74
States with more or less similar level of participation
Karnataka
Assam 70.80 69.1 69.50
Himachal Pradesh 60.01 59.7 58.40
Nagaland 77.62 91.7 89.99
Orissa 59.59 66.0 65.29
Rajasthan 51.37 49.9 48.39
Uttar Pradesh 50.27 48.2 47.75
States with lower level of participation
Bihar 58.36 57.9 44.45
Goa 53.88 58.7 55.28
Mizoram 62.91 63.4 51.80
Jharkhand 53.38 55.6 51.16
Maharashtra 54.88 54.4 50.72
All India 59.16 58.0 58.42
CSDS Data Unit. Elections were not held in Assam (1989) and Jammu and Kashmir (1991)
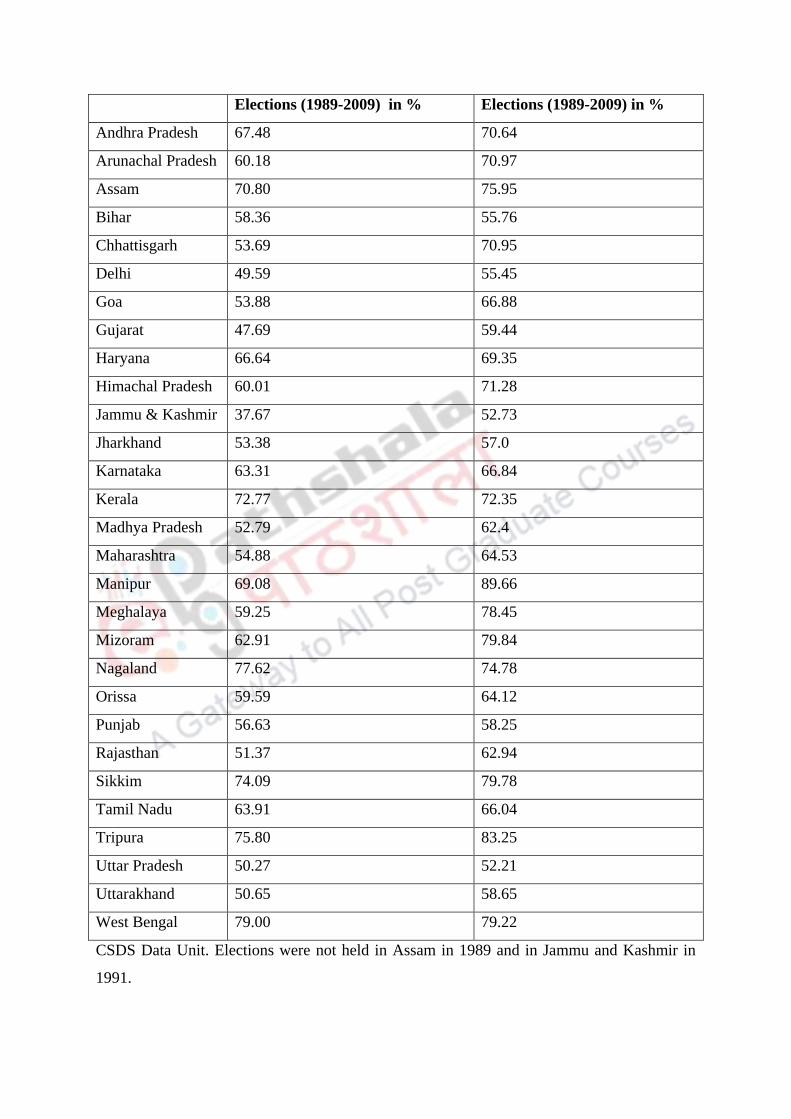
The average turnout for the last two decades is higher for state elections than for national
elections. The table below shows this trend. We can see this trend in all states except Bihar
and Nagaland.
Table 2:- Assembly elections continue to witness higher turnout compared to Lok Sabha
elections:-
States Average Turnout in Lok Sabha Average Turn out in Vidhan
Elections (1989-2009) in % Elections (1989-2009) in %
Andhra Pradesh 67.48 70.64
Arunachal Pradesh 60.18 70.97
Assam 70.80 75.95
Bihar 58.36 55.76
Chhattisgarh 53.69 70.95
Delhi 49.59 55.45
Goa 53.88 66.88
Gujarat 47.69 59.44
Haryana 66.64 69.35
Himachal Pradesh 60.01 71.28
Jammu & Kashmir 37.67 52.73
Jharkhand 53.38 57.0
Karnataka 63.31 66.84
Kerala 72.77 72.35
Madhya Pradesh 52.79 62.4
Maharashtra 54.88 64.53
Manipur 69.08 89.66
Meghalaya 59.25 78.45
Mizoram 62.91 79.84
Nagaland 77.62 74.78
Orissa 59.59 64.12
Punjab 56.63 58.25
Rajasthan 51.37 62.94
Sikkim 74.09 79.78
Tamil Nadu 63.91 66.04
Tripura 75.80 83.25
Uttar Pradesh 50.27 52.21
Uttarakhand 50.65 58.65
West Bengal 79.00 79.22
CSDS Data Unit. Elections were not held in Assam in 1989 and in Jammu and Kashmir in
1991.

As the above table shows that turnout is often higher in assembly elections than in Lok Sabha
elections we can say that the people relate more to state governments than to national
Governments and hence there is greater interest in the former.
Turnout among voters of different Economic Class:-
During the last two decades Lok Sabha elections indicate that the turnout among the lower
class have been higher and turnout among the middle and upper classes have been marginally
lower than the average turnout. The 2009 Lok Sabha even saw a slight increase in the turnout
among middle class voters.
This pattern of turnout is not uniform among the upper class and lower class in the states. In
the 2009 Lok Sabha elections, the turnout in some states was similar to that of national trend
whereas in others it was not. In states like Chhattisgarh, Delhi, Bihar, Jharkhand, Karnataka,
Orissa and Rajasthan, the lower turnout was lower than the upper class voters. On the other
hand in Andhra Pradesh, Assam, Tamil Nadu and West Bengal, the lower class turnout was
higher than that of upper class voters. It was also marginally higher in Punjab7.
Chart 1: - Turnout among voters of different Economic class (%).
7 Turnout figures among voters of different Economic Class Across states can be accessed from: Sanjay Kumar.
2009. “Patterns of Political Participation: trends and Perspective”. Online available at:
http://www.epw.in/system/files/pdf/2009_44/39/Patterns_of_Political_Participation_Trends_and_Perspective.pd
f.

CSDS Data Unit. National Election studies (NES) 96, (sample size 9613); National Election
Study (NES) 99, (Sample size 9,418); National Election study (NES) 04, sample size
27,004);National Election study (NES) 09, (sample size 36,182)
Voting Pattern across social Communities
As far as Social communities are concerned, Dalits have voted more than average and then
most other communities. But if we see carefully we realize that there has been some decline
in their turn out as far 2009 elections are concerned.
Most of the states have witnessed high turnout among Dalit voter. Bihar, Assam, Delhi,
Karnataka and Maharashtra had lower turnouts compared to the state average. The turnout
among Muslims has overtime remained more or less same to the national average. Higher
turnout could be seen in a majority of the states. In U.P and Tamil Nadu the turnout remained
close to state average and it was lower in Andhra Pradesh, Jharkhand, Madhya Pradesh,
Maharashtra and Rajasthan.8
Table 3:- Turnout among social communities across states (1996-2009 in %)
Social
Communities
Lok
Sabha
Lok
Sabha
Lok
Sabha
Lok
Sabha
Lok
Sabha
Average
8 Kumar, Sanjay. 2009. “Patterns of political representation: trends and perspective”. Economic and Political
weekly 44 (39): 47-51.
http://www.epw.in/system/files/pdf/2009_44/39/Patterns_of_Political_Participation_Trends_and_Perspective.pd
f
0
10
20
30
40
50
60
70
Lok Sabha 1996 Lok Sabha 1999 Lok Sabha 2004 Lok Sabha 2009
57.9 60 58.4 58.4
48
57 59 5758 57 57 5961 6258 59
All Voters
Upper Class
Middle Class
Lower Class

1996 1998 1999 2004 2009
All 57.9 62.1 60.0 58.4 58.4 59
Dlalits 62 67 63 60 59 62
Adivasis 56 62 52 61 60 58
OBC 60 61 59 58 59 59
Upper caste 54 62 62 56 58 58
Muslims 56 65 67 46 59 59
CSDS Data Unit. The turnout figures for the survey have been weighted by the actual
turnout figures for all elections.
Patterns across locality:-
The pattern of turnout amongst voters belonging to various economic classes has hardly
changed in the elections held during the last decade. The urban Constituencies continue to
register lower turnout as compared to the rural constituencies. The Lok Sabha elections show
that lower class had been marginally higher and the upper and middle class had been
marginally lower compared to the average turnout. But the 2009 elections show a slight
increase in the turnout amongst the middle class voters.
Turnout amongst youth:-
Young voters were the most talked about in the 2009 elections. Data for Lok Sabha elections
indicate that the turnout amongst youth has always been lower by nearly 3 to 4 percentage
points compared to the national turnout. This pattern is not very different even in states9.
9 Turnout figures among youth across states can be accessed from: Sanjay Kumar (2009): Patterns of
Political Participation: trends and Perspective.
http://www.epw.in/system/files/pdf/2009_44/39/Patterns_of_Political_Participation_Trends_and_Perspective.pd
f
10Kumar Sanjay. 2013. “A shift Towards Regionalisation of Indian Politics”. In Handbook of Politics in Indian
States, Regions, Parties and Economic Reforms edited by Sudha Pai, 146-165. Delhi: Oxford University Press.

Across states it is lower compared to the average turnout except in Karnataka, Kerala and
Madhya Pradesh. 10
Turnout among women:-
Women play a dual role in politics- as voters and political representative. If we see the voting
turn out among women we see that 56 percent of the women voted in the 2009 Lok Sabha
elections. The lowest percentage of women turnout was seen in Bihar, Followed by U.P and
Gujarat. West Bengal had the highest turnout among women across all states.
Chart 2:- Women turnout across states for 2009 Lok Sabha elections (%)
Source CSDS Data unit
Political Participation beyond Voting and Turn out.
Political participation in a narrow sense would imply just voting but we do not want to
confine our self to the act of voting since there are other political activities that are equally
important indicators of Political participation like participating in rallies, meetings, or
campaigning during elections. The findings of Survey conducted by CSDS indicate that
active participation in election campaigns remain restricted, voters have shown interest in
election campaign activities. During the 2009 Lok Sabha elections, 39 percent of voters
Wes
t B
enga
l
Tam
il N
adu
Ker
ala
Ori
ssa
Andhra…
Ass
am
Kar
nat
aka
Ch
atti
sgar
h
Del
hi
Jhar
khan
d
Mah
aras
htr
a
Mad
hya…
Raj
asth
an
Gu
jara
t
Utt
ar P
rad
esh
Bih
ar
8172 71 71 70 68 64
51 50 49 48 47 44 42 42 41
Women Turnout

showed interest in such activities. There is hardly any change in this trend over more than a
decade but the pattern is not uniform across state. The voters in some state took more interest
in election campaign compared to other states. Those in Himachal Pradesh, Karnataka.
Kerala and Tamil Nadu showed greater interest in election campaign activities while those in
Bihar and Maharashtra showed a little Interest.
Table 4:-Interest in Election Camping- Lok Sabha Elections, (1996-2009 in %)
States 1996
Lok Sabha
1999
Lok Sabha
2004
Lok Sabha
2009
Lok Sabha
Average
All India 33 32 40 39 36
Andhra Pradesh 10 20 29 39 25
Assam 31 50 57 41 45
Bihar 24 22 45 24 29
Delhi 39 12 38 40 32
Gujarat 36 12 17 43 27
Haryana 28 27 43 37 34
Himachal Pradesh 25 26 51 52 39
Karnataka 26 25 48 55 39
Kerala 72 36 53 56 54
Madhya Pradesh 20 24 40 38 31
Maharashtra 21 17 14 25 19
Orissa 27 50 28 40 36
Punjab 23 15 52 40 33
Rajasthan 22 32 39 32 31

Tamil Nadu 58 59 56 59 58
Uttar Pradesh 46 37 33 42 40
West Bengal 42 60 39 45 47
CSDS data Unit.NES 1996,1999,2004,2009 (Sample size=36,182) Question wording: Now
let us talk about the campaign during the election. How interested were you in the election
campaign this year- great deal, somewhat, or not at all? The question had been asked with
identical wordings in all surveys reported in the table. Answer categories of great deal and
somewhat have been merged together and reported in the table.
Table.5:- Participation of people in any Election- Related Activity for Lok Sabha
(Average of 1996, 1998, 1999 & 2004 Lok Sabha Elections in %).
States Average
All India 18
Andhra Pradesh 14
Assam 17
Bihar 17
Chhattisgarh 22
Delhi 14
Gujarat 12
Haryana 17
Himachal Pradesh 16
Jharkhand 23
Karnataka 14
Kerala 27
Madhya Pradesh 16
Maharashtra 11
Orissa 16
Punjab 15
Rajasthan 19

Tamil Nadu 14
Uttar Pradesh 21
Uttarakhand 34
West Bengal 36
Source: CSDS Data Unit. National Election Study-1996(Sample size 9613), National
Election Study- 1998 (Sample Size 8133) National Election study 1998 (Sample Size 9418),
National Elections Study- 2004 (Sample size 27 004)]
At the all India level one can see increasing numbers of people who participated in at least
one campaign- related activity, there are some states that do not confirm to this national
trend. In Orissa, UP and West Bengal, the number of people who participated in any election
campaign activity during the 2004 election is slightly less than the number of people who
participated in similar such activity during the 1999 Lok Sabha elections11. Apart from theses
states there has been increase in number for people who have participated in any election
activity. If we look at the national average of participation in election related activity for Lok
Sabha we see that apart from seven states, all other states lag behind the national average in
participating in any election- related activity for Lok Sabha. The states whose average was
higher than national average are Chhattisgarh, Jharkhand, Madhya Pradesh, Rajasthan, Uttar
Pradesh, Uttaranchal and West Bengal12.
Rise in the number and presence of Regional Political parties:-
Over the past many years, the regional parties are on rise. They have grown both in number
and their presence. These regional parties have not only influenced state politics but also
national politics. They play a very significant role in national politics today. As no single
party in India is able to win majority and come to power on its own so it gave rise to coalition
politics and coalition politics has certainly benefitted regional parties. In the late with
sizeable electoral support, the regional parties have not only managed to win elections and
11 Figures for each state and each election can be accessed from: Palshikar, Suhas & Sanjay Kumar. 2004.
“Participatory norm: How broad based is it?” Online available at:. http://www.epw.in/special-
articles/participatory-norm-how-broad-based-it.html
12 ibid.

form state governments, they have also influenced the national politics. Together India’s two
national parties, the Congress and the Bharatiya Janata Party (BJP), have roughly polled a
little less than 50 percent votes. The vote share of the Congress has declined sharply during
last few elections, from 39.5 percent in 1989 to 28.6 percent in 200913. The vote share for
both Congress and BJP has declined. The participation of political parties has been increasing
with every election14.
Table 6:- Vote share of National and Regional Parties: Lok Sabha Elections: 1984-2009
in %
Parties 1984 1989 1991 1996 1998 1999 2004 2009
Congress 48.0 39.5 36.6 25.8 25.8 28.3 26.5 28.6
BJP 7.4 11.4 20.1 25.6 25.6 23.8 22.2 18.8
Left 9.3 10.2 9.7 7.8 7.8 7.6 7.9 7.5
BSP 0.0 2.1 1.8 4.7 4.7 4.2 5.3 6.2
Regional
Parties
11.2 27.1 21.1 29.3 29.3 29.5 29.3 28.4
Note: Regional parties include NCP, JD(U), TMC, SP, SMT, RJD, BJD, MUL, Shiv Sena,
RPI,SAD,SAD(Mann), JKNC, PWP, DMK, AIADMK, TMC(M), PMK, MDMK, KEC,
INLD, RLD, AGP, MGP, TDP, TRS, LJP,JMM,HJC,JVM,PRP, MNS and AUDF
With the increasing importance of regional parties there has also witnessed a reasonable
degree of trust for regional parties amongst Indian Voters. The Post-Poll survey in 2004
showed that the ratio is 1.0 that is the proportion of voters who mentioned the state and the
national Government as their main consideration for their voting decision in the Lok Sabha
elections perfectly balanced each other. This balance was tilted in favour of the Central
Government in the Hindi speaking states that have historically lacked regional identity. As
we can see that this regional tilt is more prominent in the case of the states in the south and
13 Kumar, Sanjay. 2010. “Regional Parties, Coalition Government and Functioning of Indian Parliament:
The Changing Patterns”. Journal of Parliamentary Studies, Institute of Parliamentary Affairs, Government of
Kerala 1(1). Online available at:
http://www.lokniti.org/pdfs_dataunit/publications2010/Journal%20of%20Parliamentry_studies_Sh[1]sanjay_ku
mar_article.pdf
14 Ziegfeld, Adam, 2010. “India in Transition Why the Rise of Regional Parties Isn’t So Bad”. Center for the
Advanced Study of India. Online available at http://casi.sas.upenn.edu/iit/ziegfeld

the North East. A similar survey that was done by CSDS in January 2009 showed a further
trend of tilt towards the state Government as a consideration for Lok Sabha elections. The
centre ratio declined in all regions of the country to fall to 0.815. These figures clearly show
decline of importance of Central Government in the election to the Lok Sabha
Table7:- Centre- State Ratio on Voting Preference16
States 2004 2009
All India 1.0 0.8
Andhra Pradesh 0.2 0.2
Arunachal Pradesh 0.7 1.1
Assam 1.3 0.4
Bihar 1.9 0.8
Goa 1.0 0.2
Gujarat 0.8 0.9
Haryana 0.9 0.8
Himachal Pradesh 1.0 0.6
Jammu and Kashmir 0.8 0.3
Karnataka 1.5 0.9
Kerala 1.4 1.3
Madhya Pradesh 1.4 0.8
Maharashtra 1.1 0.7
Manipur 0.3 0.8
15 Yadav, Yogendra and Suhas Palshikar. 9009. “Revisited ‘Third Electoral System’ Mapping Electoral Trends
in India, 2004-2009. Sandeep Shastri, K.C Suri. & Yogendra Yadav op.cit, 393-429.
16 The ratio is defined here as the proportion of voters who mention the central Government as the main
consideration for voting divided by the proportion of those who mention their state Government as the main
consideration. If the result is 1.0 it implies that that the proportion of voters who mentioned the state and the
national Government as their main consideration of their voting decision in Lok Sabha election perfectly
balanced each other. If the result is greater than 1 than it implies that Central Government is the main
consideration and if the result is less that I then it implies state Government as the main consideration.

Meghalaya 1.0 0.6
Mizoram 0.2 0.5
Nagaland 0.5 0.2
Orissa 1.1 0.6
Punjab 1.1 0.8
Rajasthan 1.5 1.3
Sikkim 0.2 0.3
Tamil Nadu 0.6 0.5
Tripura 0.5 0.3
Uttar Pradesh 1.2 1.5
West Bengal 1.0 0.6
Delhi 1.4 1.8
Uttarakhand 2.3 1.5
Jharkhand 1.2 0.9
Chhattisgarh 1.6 0.6
Source: NES 2004; CSDS Data Unit
Representation:-
Political Representation has multiple dimensions. The basic premise of representative
democracy is that every person subject to policy should have a voice in its making. It is very
necessary that those communities who are marginalized should be given adequate
representation in order to ensure their participation in politics. Representation is not only a
means of ensuring individual participation but these representatives can act as on behalf of
the constituents who elected them. There is a need for giving adequate representation to the
marginalized sections like women, Women, Muslims and Dalits in India in order to ensure
full member ship of all marginalized section in politics and decision making body.
Caste:-
Caste has always played a very important role in politics. As far as turnout among dalits is
concerned they have consistently voted more than average and more than most of the other
communities. Most of the state witnessed a high turnout among dalits in 2009 Lok Sabha
elections. Bihar, Assam, Delhi, Karnataka and had low turnout as compared to the state

average17. Christophe Jaffrelot and Sanjay Kumar (2009) In their book “Rise Of plebeians’?
talk about changing face of Indian legislative Assemblies. They tried to analyze the question
of ‘mirror representation in the state legislative Assemblies and whether it is changing its
power balance and political equations in states.
Jaffrelot and Kumar say that there has been a shift from the dominance of upper castes to the
dominance of OBC’s and Dalits. In the Hindi speaking states the proportion of upper caste
MLA’S has declined steadily from about 40 -55 per cent in the 1950’s to about 25- 35 per
cent today whereas the share of the OBC grew from 10- 20 per cent to about 20-40 percent18.
The rise of Bahujan Samaj party has led to the rapid rise in the representation for the dalits.
However there has been a significant change in assertive dalits- Bhaujan Allliance. In 1993
there was no single upper caste MLA’s in the BSP, but by 1998, 15 percent of the party’s
MLA’ come from the upper castes including Brahmin, and in 200719.
Muslims:-
The political representation of Indian Muslims is a very important question these days. In
1980’s the percentage of muslins MP’s in the assembly was almost proportional to their share
in the population. When the BJP led NDA came into power they experienced erosion in their
number. Things started to improve in 2004 with the electoral defeat of BJP. In 2009 the
percentage of Muslim MP’s decreased again in spite of electoral victory of the Congress led
UPA. Muslim MP’s today make the 5.5 percent of the Lok Sabha MP’s whereas there
population in is 13.4 percent according to 2001 census20.
Table 8:-Muslims among lok Sabha MP’S since 1980’s 21
Year Seats Muslim
Candidates
Muslim Mp’s Percentage of
the Mp’s
Success
rate (%)
1980 542 131 49 9 37
17 Kumar, Sanjay. 2009. Op.cit. 18 Mehra, Ajay K.. 2010. “Understanding the emerging countours of Indian politics”. Main Stream Weekly 48
(41). Online available at: http://www.mainstreamweekly.net/article2349.html 19 Ibid 20 Jaffrelot, Christophe. 2010. Religion Caste & Politics in India. Delhi: Premis Books Delhi. 21 Ibid

1984 542 123 46 8.4 37
1989 543 133 33 6 25
1991 543 149 28 5.1 19
1996 543 140 28 5.1 20
1998 543 146 28 5.1 19
1999 543 175 32 5.8 18
2004 543 168 35 6.4 21
2009 543 832 30 5.5 3.6
The states which do not have a single Muslim member in the Lok Sabha include major states
such as Chhattisgarh, Gujarat, Haryana, Orissa, Jharkhand, Karnataka, Madhya Pradesh,
Maharashtra, Punjab and Rajasthan, though these states have substantial Muslim population.
There is a huge under-representation of Muslim members in Lok Sabha from states such as
Andhra Pradesh, Assam, Bihar, Kerala, Uttar Pradesh and West Bengal. This situation is even
bad if we take a look at their representation in the Assemblies. Out of a total of 4,120 MLAs
in all the states (including two UTs with legislatures), only 357 belong to Muslim
community. Andhra Pradesh, Bihar, Chhattisgarh, Gujarat, Jharkhand, Karnataka, Madhya
Pradesh, Maharashtra, Punjab, Rajasthan, Uttarakhand and Delhi, the number of Muslim
members is inadequate, compared to the ratio of Muslims to the total population22.There are
various reasons for under representation of Muslims. All political parties whether national or
regional have been quite unwilling to give tickets to Muslims in Lok Sabha or Assembly
elections in various states.
Women representation:-
Women constitute almost half the population of the country but they are poorly represented in
the various governance and decision making bodies. By the 1980’s issues raised by the
women’s movements in India made political parties realize the importance of female voters
and women’s wings became active. By the ninth Lok Sabha elections in 1989, many political
parties focused on women issues but this did not translate into more seats for women in
22 Jafri, Syed Amin. 2013. “Where is inclusive democracy?” The Times of India, July 16. Online available at:
http://articles.timesofindia.indiatimes.com/2012-07-16/hyderabad/32697634_1_muslim-community-muslim-
mps-electoral-college)

political parties. Very few women were able to capture seats of power. More recently
political parties have made an effort to bring women into various level of party
organization23.
Chart 3:-Number of women Mp’s in Lok Sabha
Source: CSDS Data Unit
One of the most confusing features of women’s political representation in our legislative
bodies is that it seems to have no direct correlation with literacy and other indicators. A
comparison between the states of Kerala and Rajasthan shows this clearly. In Kerala, female
literacy rate is much higher than that in Rajasthan but even then the percentage of women in
the legislative assemblies of both states is low 24. In the State of Manipur, where women are
known to play a dominant role in both the family and the community elected its first
23 Subramanian, Malathi. …..”Political Participation and Representation of Women in Indian Politics”. Online
available at: http://www.du.ac.in/fileadmin/DU/Academics/course_material/hrge_08.pdf
24 Forum For Democratic Reforms “Women’s Representation in Legislatures.An Alternative to the Government
Bill for Women’s Reservation”. Online available at:
http://www.loksatta.org/cms/documents/advocacy/womens.pdf
2227
3431
2219
28
44
27
39 3943
4945
58
0
10
20
30
40
50
60
70
19
52
19
57
19
62
19
67
19
71
19
77
19
80
19
84
19
89
19
91
19
96
19
98
19
99
20
04
20
09
Number of Women MP's in Lok Sabha
Number of Women MP's inLok Sabha

legislator only as late as 1990. Nagaland and other North-eastern states also have low levels
of women’s representation. UP, Bihar, and Madhya Pradesh are known for their low
education levels sent a relatively larger proportion of women to the Lok Sabha than those
from the North-East, but have also elected relatively more women MLAs. One thing that is to
be noted is that though the number of women elected to Lok Sabha has not been very
impressive, their success rate (% of contestants getting elected) has always been higher than
the male aspirants25.
Table 9:-Declining Representation of Woman in State Legislatures 1952 - 1999 (% of
Women MLAs)26
25 Ibid
26 Figures for women in State legislatures for all the elections as well as state average for all states can be
accessed from: Women’s Representation in Legislatures. An alternative to the Government Bill for Women’s
Reservation. Forum for Democratic Reforms http://www.loksatta.org/cms/documents/advocacy/womens.pdf
State 2005-2009 State Average( 1952- 2009)
Andhra Pradesh 11.66 5.38
Arunachal Pradesh **** 2.61
Asaam 10.3 4.37
Bihar **** 4.54
Chattisgrah 12.32 8.88
Goa 2.5 3.83
Gujarat 8.79 4.87
Haryana 12.22 6.47
Himachal Prdaesh 7.35 4.41
Jhrakhand 3.7 3.7
J&K 3.44 1.77
Karnataka 1.33 3.85
Kerala 5 3.85
Madhya Pradesh 10.72 5.91
Maharashtra ****` 4.6

CSDS Data Unit .Table entry stands for % of women MLAs elected to state legislature in the
relevant elections .(****) States did not exist/ no elections held in that year/ period;
The figures given here are based on name recogition and hence liable to under - reporting of
women representatives.
Conclusion:-
Over the years, the participation has gone up both in terms of electoral turnout and in election
related political activity. The level of participation varies from state to state. On the whole,
smaller states seem to have higher participation. The representation of marginal section of
society is still not up to mark. State parties are becoming more and more important in today’s
political arena due to coalition politics. People relate more to state governments than to
national Governments and they vote more for state elections than national elections.
Manipur 0 0.3
Meghalaya 1.66 2.2
Mizoram 0 1.2
Nagaland 0 0.5
Odisha 4.76 4
Punajb 6.03 4
Rjasthan 14 5
Sikkim 12.5 2.5
Tamil Nadu 9.4 3.6
Tripura 5 3
Uttarakhand 5.7 5.71
Uttar Pradesh 5.7 4.1
West Bengal 12.9 3.4
Delhi 4.28 7.3
Pondicherrry 0 2.6