Embed Size (px)
Citation preview
Name/NetID: Teammate/NetID:
Module 3E: Arduino as oscilloscope
Laboratory Outline This module adds the ability to visualize time-varying signals to your portable bench equipment. If you have completed the module that shows the different ways you can use the Arduino/RedBoard as a voltmeter you know that the Arduino USB interface with the computer works both ways. Data can be sent back to the computer and you can watch a list of number appear in a window called the Serial Monitor. If the voltage varies more quickly and you want to capture and visualize the signal – like an oscilloscope – you can use a couple of methods. The first method, the brute force method has you cutting and pasting the data into either Excel or MATLAB. Recently, an additional feature was added to the Arduino IDE that allows you to visualize the serial data called the Serial Plotter. Rather than print out the values they are plotted.
Arduino As Oscilloscope
Notes:
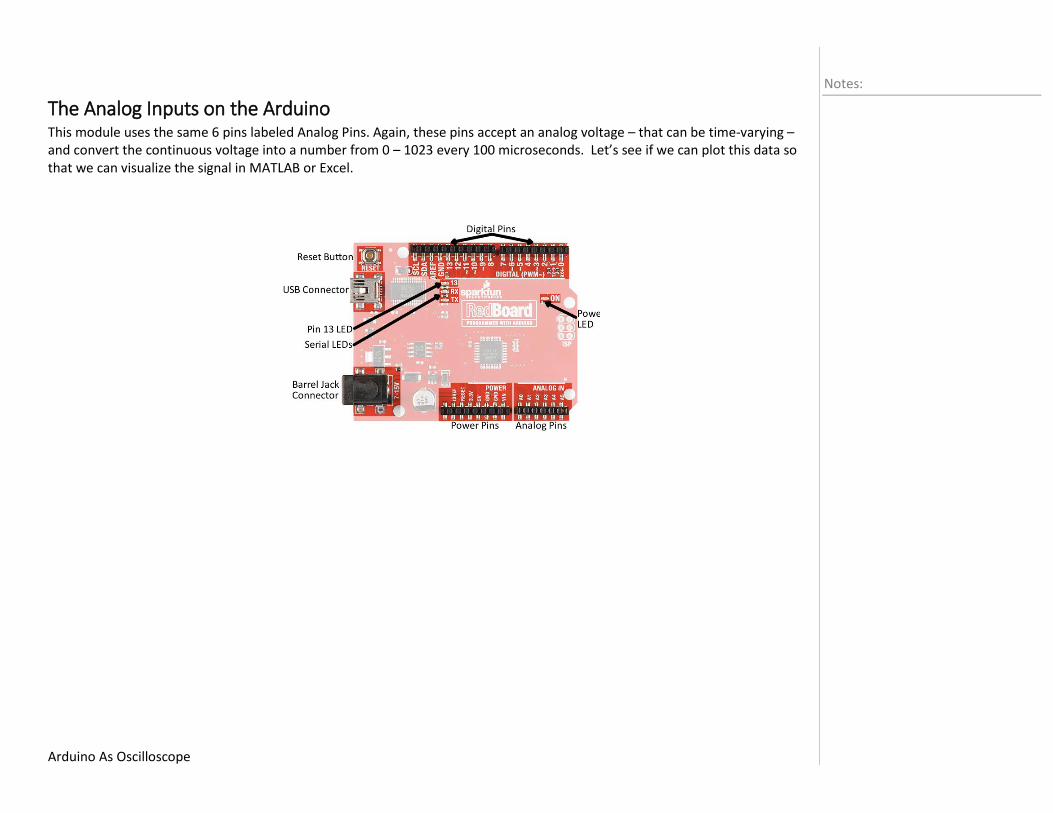
The Analog Inputs on the Arduino This module uses the same 6 pins labeled Analog Pins. Again, these pins accept an analog voltage – that can be time-varying – and convert the continuous voltage into a number from 0 – 1023 every 100 microseconds. Let’s see if we can plot this data so that we can visualize the signal in MATLAB or Excel.
Figure 1: Physical layout of the RedBoard.
Arduino As Oscilloscope
Notes:
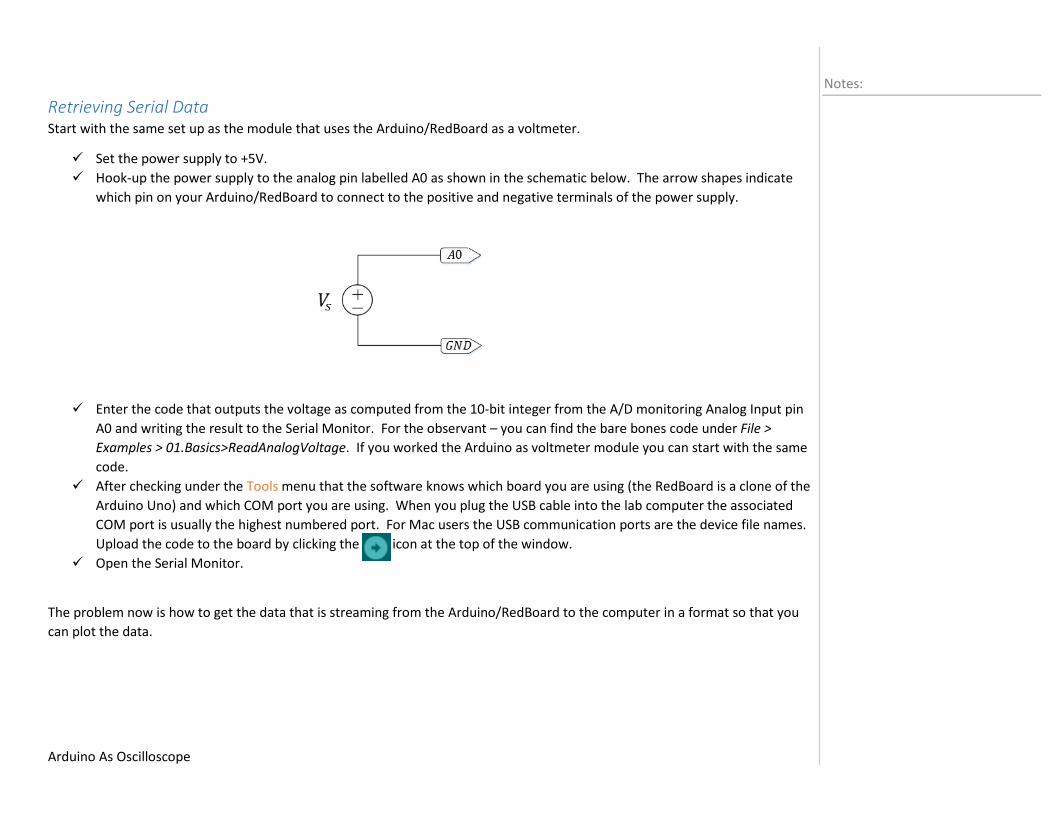
Retrieving Serial Data Start with the same set up as the module that uses the Arduino/RedBoard as a voltmeter.
Set the power supply to +5V. Hook-up the power supply to the analog pin labelled A0 as shown in the schematic below. The arrow shapes indicate
which pin on your Arduino/RedBoard to connect to the positive and negative terminals of the power supply.
Enter the code that outputs the voltage as computed from the 10-bit integer from the A/D monitoring Analog Input pin A0 and writing the result to the Serial Monitor. For the observant – you can find the bare bones code under File > Examples > 01.Basics>ReadAnalogVoltage. If you worked the Arduino as voltmeter module you can start with the same code.
After checking under the Tools menu that the software knows which board you are using (the RedBoard is a clone of the Arduino Uno) and which COM port you are using. When you plug the USB cable into the lab computer the associated COM port is usually the highest numbered port. For Mac users the USB communication ports are the device file names. Upload the code to the board by clicking the icon at the top of the window.
Open the Serial Monitor.
The problem now is how to get the data that is streaming from the Arduino/RedBoard to the computer in a format so that you can plot the data.
Arduino As Oscilloscope
Notes:
The Brute Force Method If unregulated, the data streaming to the Serial Monitor is usually scrolling too quickly to selecting the data you want to extract. There are two ways to make this easier: i) slow down the display rate, and ii) specify the number of samples to print.
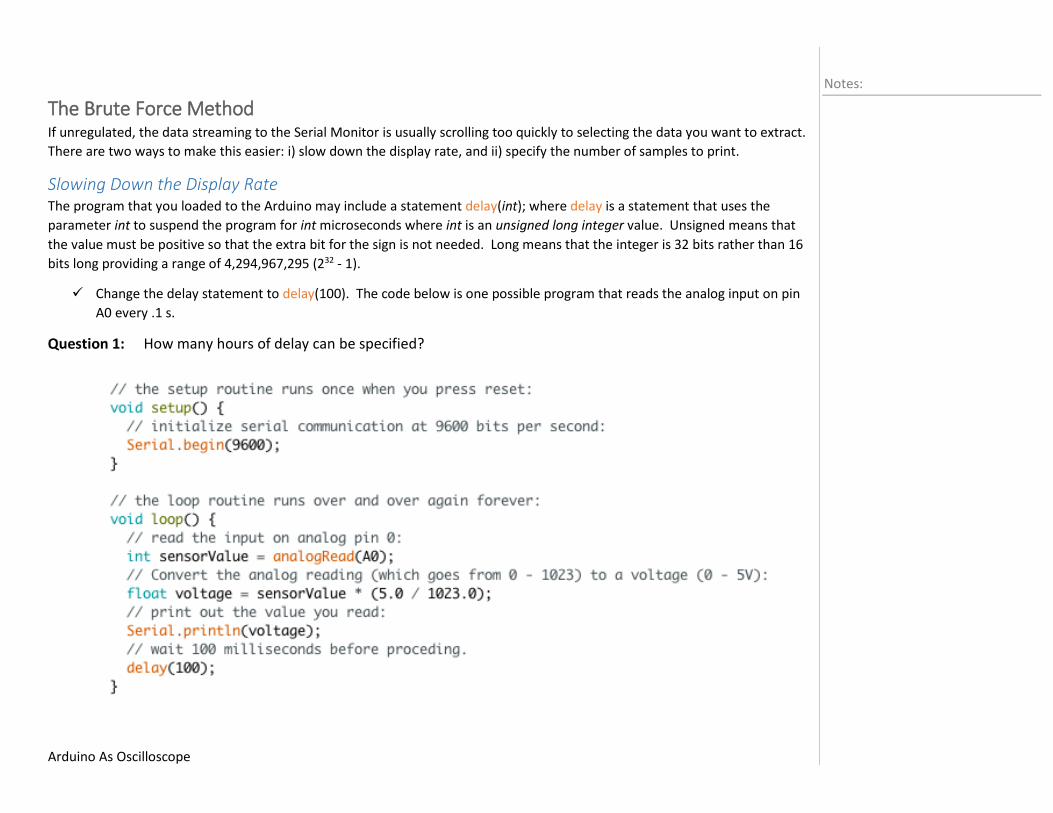
Slowing Down the Display Rate The program that you loaded to the Arduino may include a statement delay(int); where delay is a statement that uses the parameter int to suspend the program for int microseconds where int is an unsigned long integer value. Unsigned means that the value must be positive so that the extra bit for the sign is not needed. Long means that the integer is 32 bits rather than 16 bits long providing a range of 4,294,967,295 (232 - 1).
Change the delay statement to delay(100). The code below is one possible program that reads the analog input on pin A0 every .1 s.
How many hours of delay can be specified?
Arduino As Oscilloscope
Notes:
Limiting the Total Number of Points Measured Slowing down the sampling rate sets a limit on the signals you can usefully sample. A more useful approach is to limit the number of data points sent to the Serial Monitor. The code takes a specified number of data points and stops running. To do this you need to add a couple of statements to your code.
There are many ways to program this feature using the Arduino IDE so the method described below was chosen so that you can see how to use a class of programming functions called conditional statements. These statements are designed to execute ONLY when certain specified condition(s) are met.
In the code:
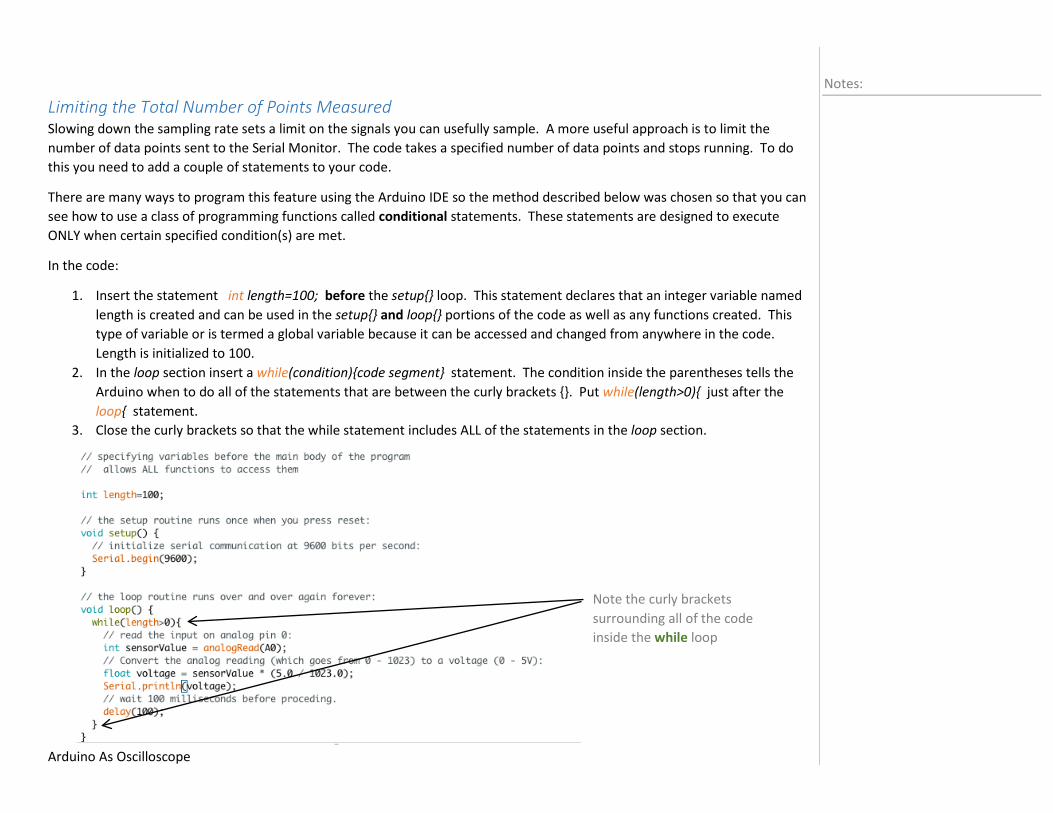
1. Insert the statement int length=100; before the setup{} loop. This statement declares that an integer variable named length is created and can be used in the setup{} and loop{} portions of the code as well as any functions created. This type of variable or is termed a global variable because it can be accessed and changed from anywhere in the code. Length is initialized to 100.
2. In the loop section insert a while(condition){code segment} statement. The condition inside the parentheses tells the Arduino when to do all of the statements that are between the curly brackets {}. Put while(length>0){ just after the loop{ statement.
3. Close the curly brackets so that the while statement includes ALL of the statements in the loop section.
Note the curly brackets surrounding all of the code inside the while loop
Arduino As Oscilloscope
Notes:
At this point nothing about the program has changed functionally so you can upload it, run it while varying the voltage and open the serial monitor to make certain that it still continuously takes data. Now, insert a statement inside the while loop that will make the board take 100 data points, write them to the serial monitor and then do nothing. Hint: you will want to modify the variable length so that it changes. Eventually, the variable length will stop satisfying the condition (length>0). Print out or write down the code used.
Rerun the program – while it is running vary the voltage at the power supply to create a time-varying signal. Get the data into either Excel or MATLAB and make a plot of the data – you do not know the time increment so the x-axes corresponds to the numbers from 1 -100 for now.
Paste them into Excel 1. Open Excel and bring up an empty spreadsheet. 2. Go to the serial monitor with should have 3 data points in it and highlight these points. CTRL + c to copy them to
the computer’s clipboard. 3. Click the first cell of the second row of the spreadsheet and CTRL + v to paste the data.
Paste the into MATLAB 1. Open MATLAB. 2. Use your favorite method to input data or follow the simple instructions below. 3. Find the workspace section – mine looks like this…
Arduino As Oscilloscope
Notes:
4. Click on the down arrow in the upper right corner and choose New or use CTRL + n to have a new variable created. It shows up as a box where you can give it a name – anything you want. Pressing return completes the action.
5. Double-click on the new variable’s name to open a window that looks a lot like a spreadsheet. 6. Click on the first cell and press CTRL – v to paste the values into the new variable. Clicking the x in the upper-
right corner minimizes the variable data window. You can double-click on any variable to view and/or modify its contents.
Now you have 100 data points in either Excel or MATLAB – plot the 100-point curve.
As with all devices that sample time-varying signals there is a limitation on how fast the measuring device can sample. From the data sheets and forums, the claim is that you can get at least one sample every 100 microseconds.
But there are so many factors that affect the sampling rate: i)The underlying assumptions made by the Arduino IDE when it translates the AnalogRead statement sets the sampling rate to a conservative number. Ii)The statements inside the loop, like the print statements, for example, take a certain amount of time to run thus affecting the sampling rate – as you will see in the next section.
In the Arduino code remove the delay function and make sure the number of samples is in the range 100 - 1000. Make certain that the signal generator is in HIGH Z mode – ask your TA for help checking this if you are unsure. Set the signal generator to output a sinewave with a frequency of 10Hz, peak-to-peak amplitude of 4V and an offset of
2V. IT is VERY IMPORTANT that the signal does not go negative. Well, to be honest, in my experimentation I have “accidently” used 10 V and -5V and nothing happened. Not to say that you will have the same experience.
Using a BNC-to-BNC cable connect channel 1 of the oscilloscope to the signal generator and be certain that the sine wave stays positive.
Disconnect the oscilloscope and connect the signal generator to the Arduino using a BNC-to-banana cable and the special termination wires. The negative terminal (black lead or plug) is connected to one of the GND pins, any one will do, and the positive terminal (red) is connected to pin A0.
Approximate the time interval between samples. Remember this is not the actual speed at which the A/D can sample, but it is the interval determined by the code inside the loop and the A/D.
Arduino As Oscilloscope
Notes:
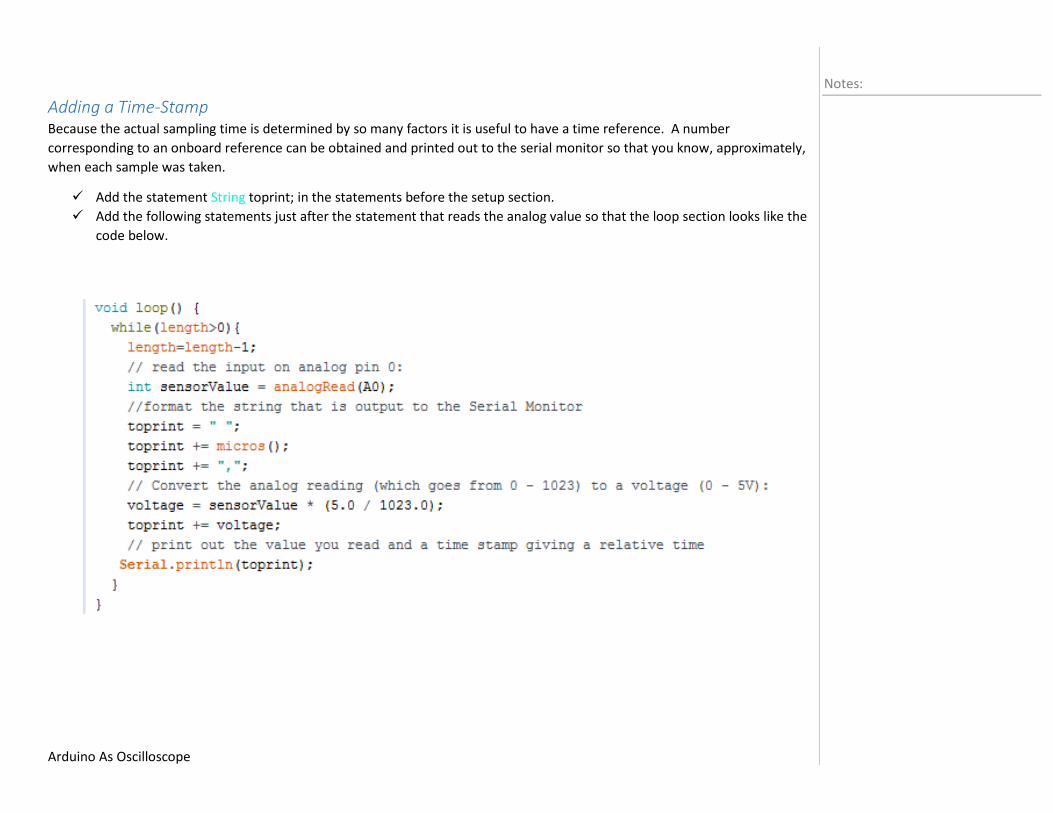
Adding a Time-Stamp Because the actual sampling time is determined by so many factors it is useful to have a time reference. A number corresponding to an onboard reference can be obtained and printed out to the serial monitor so that you know, approximately, when each sample was taken.
Add the statement String toprint; in the statements before the setup section. Add the following statements just after the statement that reads the analog value so that the loop section looks like the
code below.
Arduino As Oscilloscope
Notes: Upload and run the code, then open the serial window. Copy and Paste the data into Excel or MATLAB
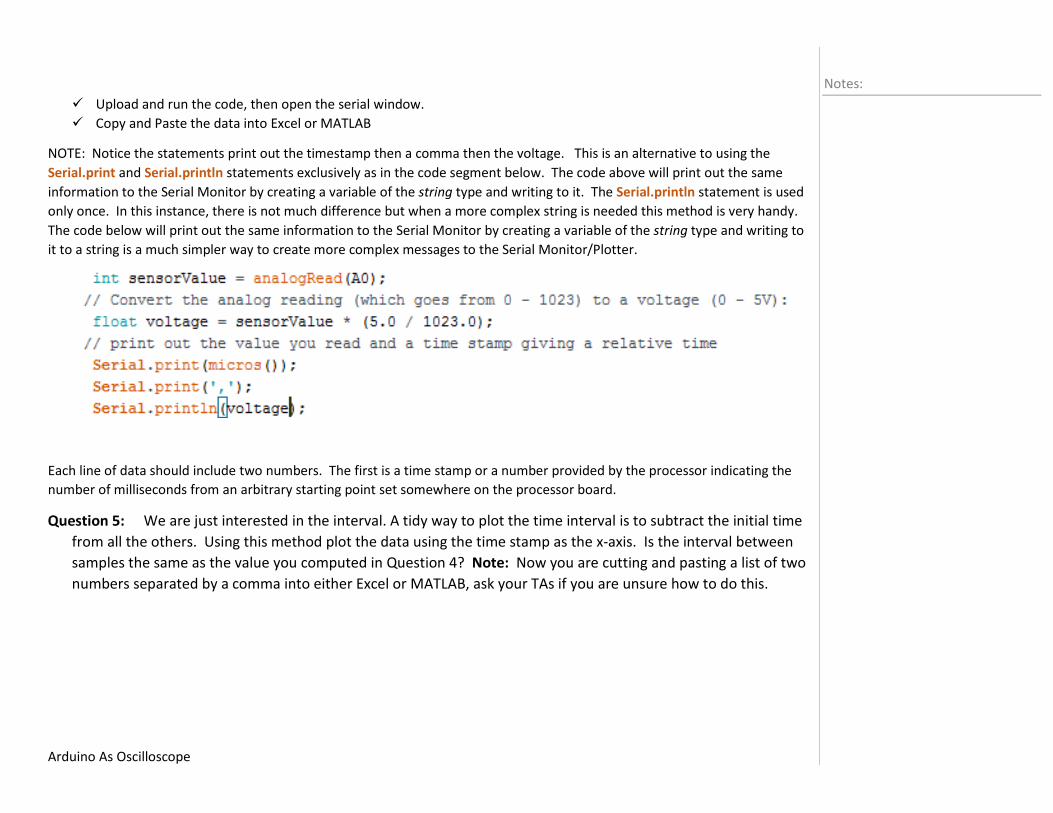
NOTE: Notice the statements print out the timestamp then a comma then the voltage. This is an alternative to using the Serial.print and Serial.println statements exclusively as in the code segment below. The code above will print out the same information to the Serial Monitor by creating a variable of the string type and writing to it. The Serial.println statement is used only once. In this instance, there is not much difference but when a more complex string is needed this method is very handy. The code below will print out the same information to the Serial Monitor by creating a variable of the string type and writing to it to a string is a much simpler way to create more complex messages to the Serial Monitor/Plotter.
Each line of data should include two numbers. The first is a time stamp or a number provided by the processor indicating the number of milliseconds from an arbitrary starting point set somewhere on the processor board.
We are just interested in the interval. A tidy way to plot the time interval is to subtract the initial time from all the others. Using this method plot the data using the time stamp as the x-axis. Is the interval between samples the same as the value you computed in Question 4? Note: Now you are cutting and pasting a list of two numbers separated by a comma into either Excel or MATLAB, ask your TAs if you are unsure how to do this.
Arduino As Oscilloscope
Notes: Remove the statement that computes the voltage and print out sensorValue instead of voltage. Upload and run the program.
Did the removal of this statement change the sampling rate of the signal? If so by how much? You can prove this either by inspection of the data or by plotting it.
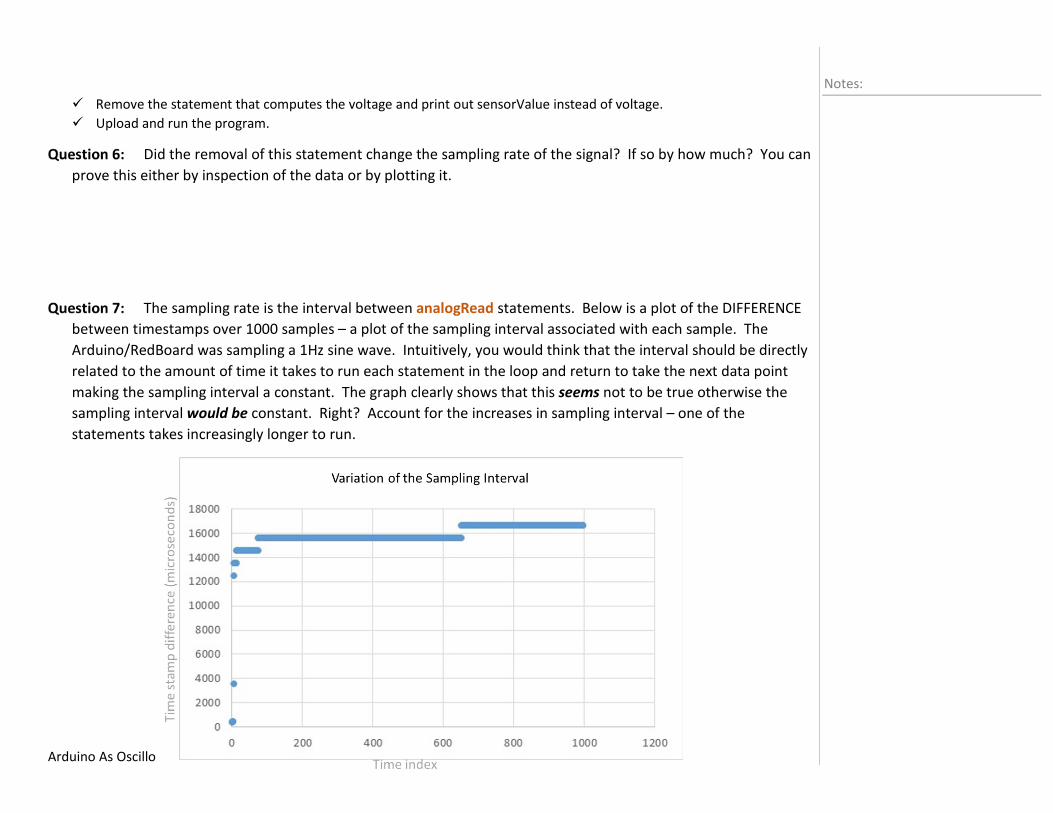
The sampling rate is the interval between analogRead statements. Below is a plot of the DIFFERENCE between timestamps over 1000 samples – a plot of the sampling interval associated with each sample. The Arduino/RedBoard was sampling a 1Hz sine wave. Intuitively, you would think that the interval should be directly related to the amount of time it takes to run each statement in the loop and return to take the next data point making the sampling interval a constant. The graph clearly shows that this seems not to be true otherwise the sampling interval would be constant. Right? Account for the increases in sampling interval – one of the statements takes increasingly longer to run.
Arduino As Oscilloscope
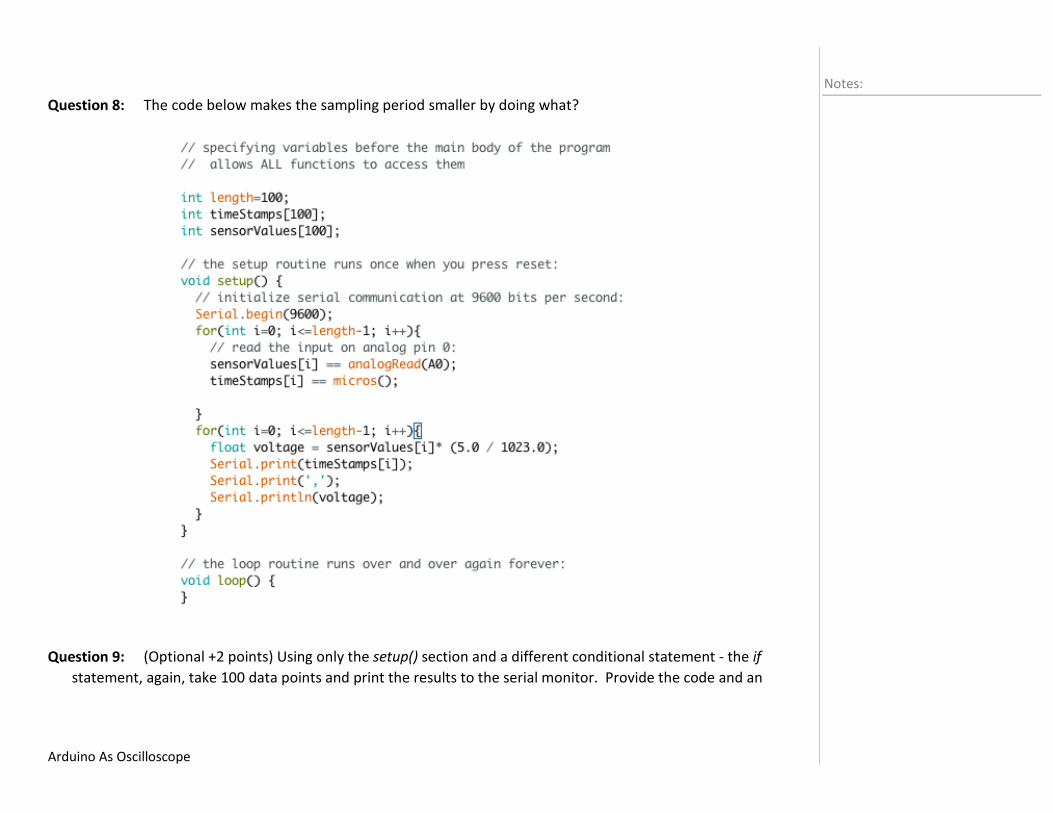
Notes: The code below makes the sampling period smaller by doing what?
(Optional +2 points) Using only the setup() section and a different conditional statement - the if statement, again, take 100 data points and print the results to the serial monitor. Provide the code and an
Arduino As Oscilloscope
Notes: explanation of your code. If you do not know the syntax or functionality of the if statement refer to the reference section on the Arduino website.
Arduino As Oscilloscope
Notes: The number you got for the sampling rate for any of the questions is not even close to 100µs. But for slowly varying signals, like most of the signals you will encounter when connecting the Arduino’s analog input pins to the sensors in your kits, it should be fine. There are ways to increase the speed if needed that are not too difficult if you are comfortable with assembly and interfacing with Python or MATLAB, as well as using arrays to store the data before printing it out.
Using the Serial Plotter The Arduino IDE has a serial plotter that has the same functionality as the Serial Monitor except it is a plot of the data rather than a list.
Set the frequency of the sine wave provided by the signal generator to be 1Hz. Don’t change the amplitude or offset. Make a copy of the code that writes out a voltage and a time stamp. Using this copy remove the while statement and
references to the variable length so that the code writes to the serial monitor continuously. Upload the code and open the Serial Monitor. Under the menu heading Tools open the Serial Plotter. You should get an error – the Serial Monitor and the Serial
Plotter cannot be open together. Close the Serial Monitor and open the Serial Plotter.
What is being plotted? Why can’t you see the sine wave?
Close the Serial Plotter and re-open the Serial Monitor. The Serial Plotter will plot up to 6 variables if each value is delimited by a comma or a space. In this case what it sees is 2 values separated by a comma. To see the sine wave you need to remove the time stamp because the Plotter is also plotting the time stamp whose value is so much larger than the voltage.
Modify the code to print out the voltage( or the sensorValue integer, your choice) ONLY.
Use the Snipping tool to grab a picture of the sine wave (do your best).
Arduino As Oscilloscope
Notes: The Serial Plotter has some serious limitations. List several. Hint: time axis? Snipping on the fly? You
can browse some of the websites and blogs where the limitations are lamented. So close and yet so far.
Without some work it seems that the Arduino does not make a great oscilloscope. The sampling rate at the analog pins is not very useful for high frequency signals and it is not straightforward to get the data into the computer for plotting. But, for our purposes – observing how a sensor responds to a stimulus or how the signal you will use to control the motor varies – it is fine. This brute force method is a simple procedure to capture what you observe in the serial monitor/plotter. Including visual aids will help with documentation of the different things you try on your own when evaluating sensors and sub-circuits. Whether or not you use every device or sub-circuit that you test, it is important to include all the things you tried in your final design project. What if you want to pick up where you left off? Maybe you came up with a clever way of modifying a previous design or improving the working of a sub-circuit. With proper documentation you do not have to start over.