Embed Size (px)
Citation preview
Module 3: Uploading and Connecting to Data Lesson 1: Using the Upload Wizard Try Now!
In this Try Now! exercise, you will be uploading new retail sales data for your organization that you have just received. This data is in a Microsoft Excel spreadsheet (retail_data_extract.xlsx). Specifically, you will be using the Upload Wizard, which is provided with WebFOCUS Business User Edition.
Once the file is uploaded, you will also explore the metadata in the wizard to ensure all of your measures and dimensions are structured properly before the Synonym is created. _____________________________________________________________________________________
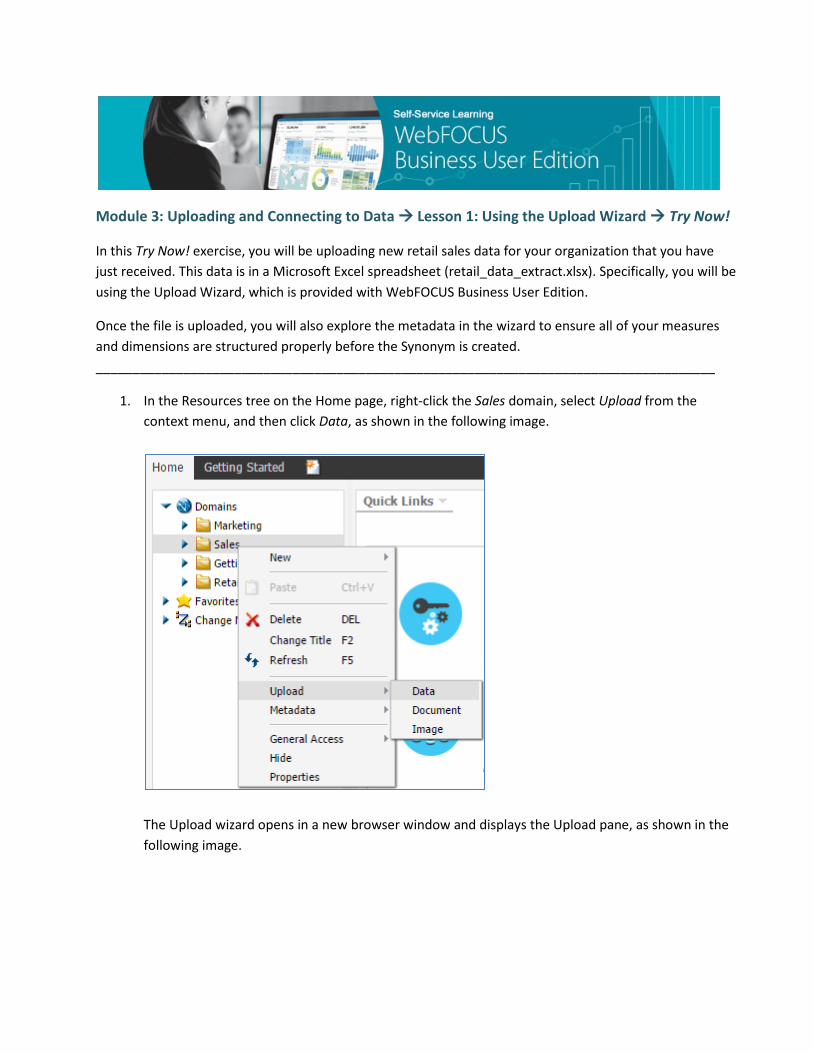
1. In the Resources tree on the Home page, right-click the Sales domain, select Upload from the context menu, and then click Data, as shown in the following image.
The Upload wizard opens in a new browser window and displays the Upload pane, as shown in the following image.
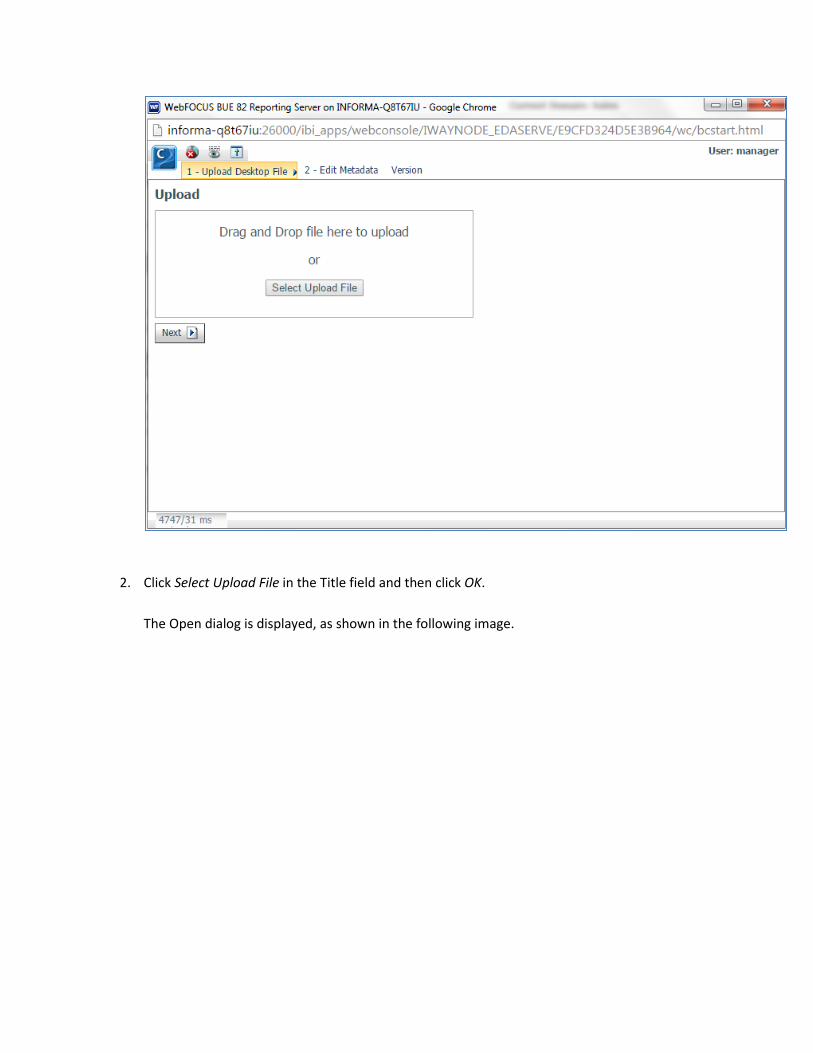
2. Click Select Upload File in the Title field and then click OK. The Open dialog is displayed, as shown in the following image.
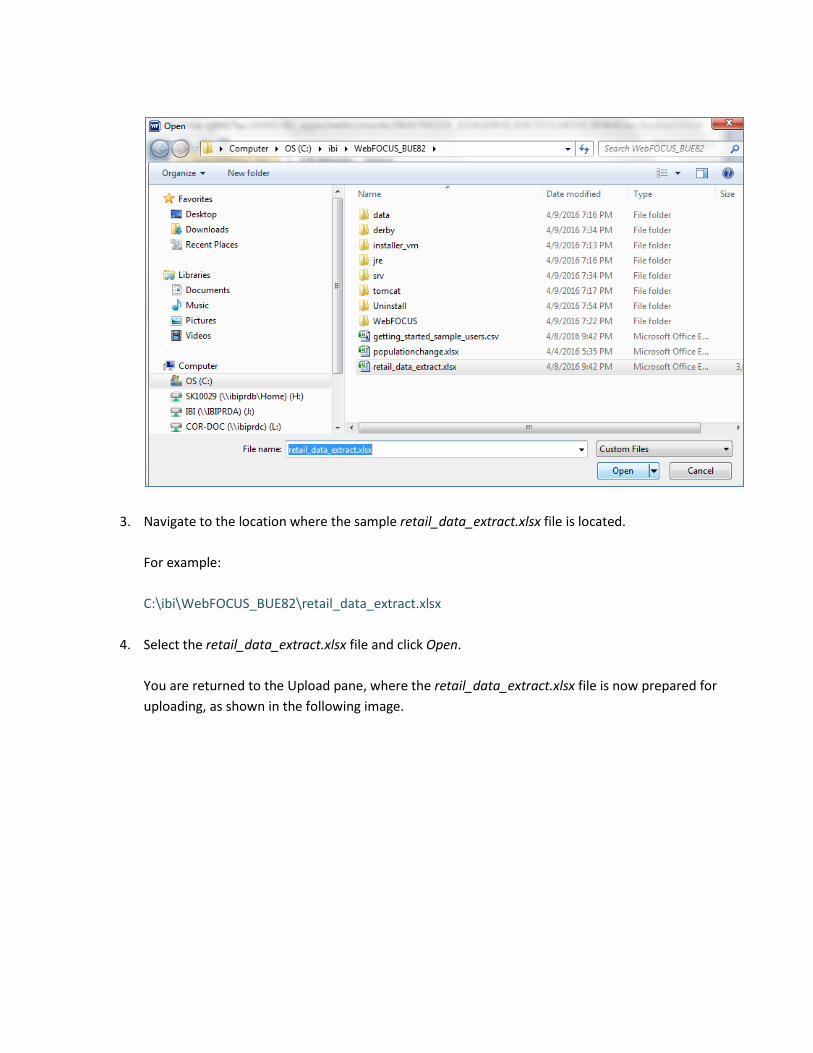
3. Navigate to the location where the sample retail_data_extract.xlsx file is located. For example: C:\ibi\WebFOCUS_BUE82\retail_data_extract.xlsx
4. Select the retail_data_extract.xlsx file and click Open. You are returned to the Upload pane, where the retail_data_extract.xlsx file is now prepared for uploading, as shown in the following image.
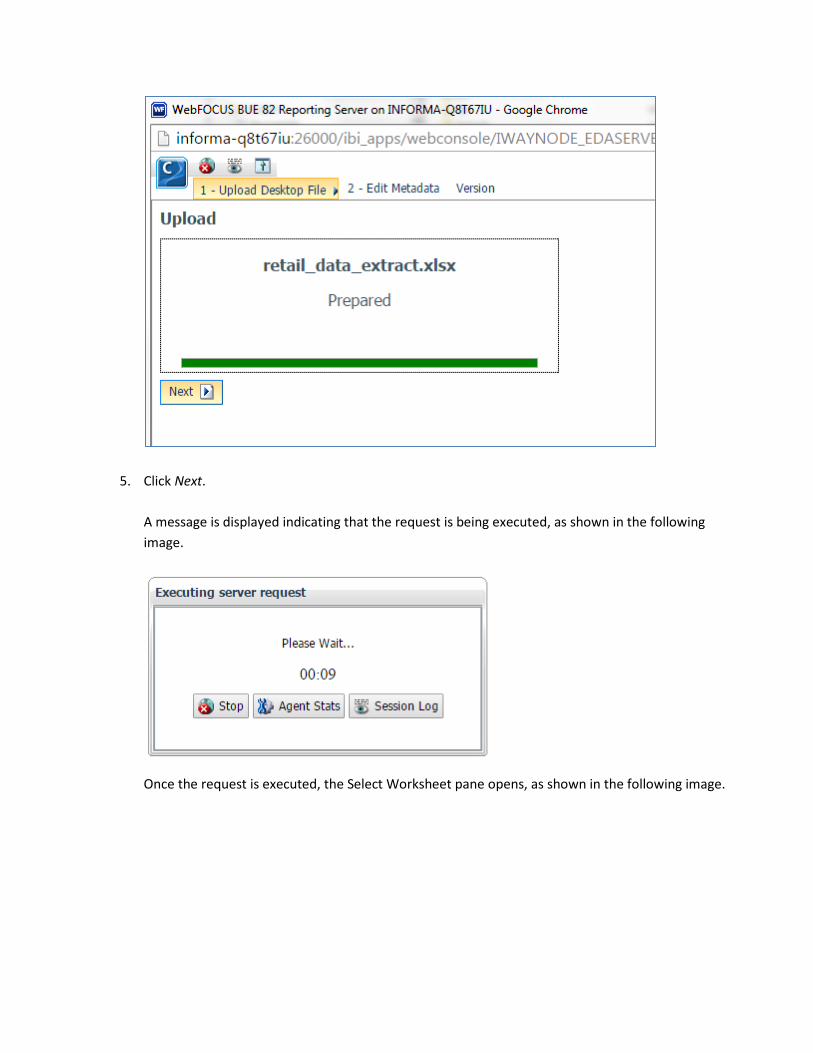
5. Click Next. A message is displayed indicating that the request is being executed, as shown in the following image.
Once the request is executed, the Select Worksheet pane opens, as shown in the following image.
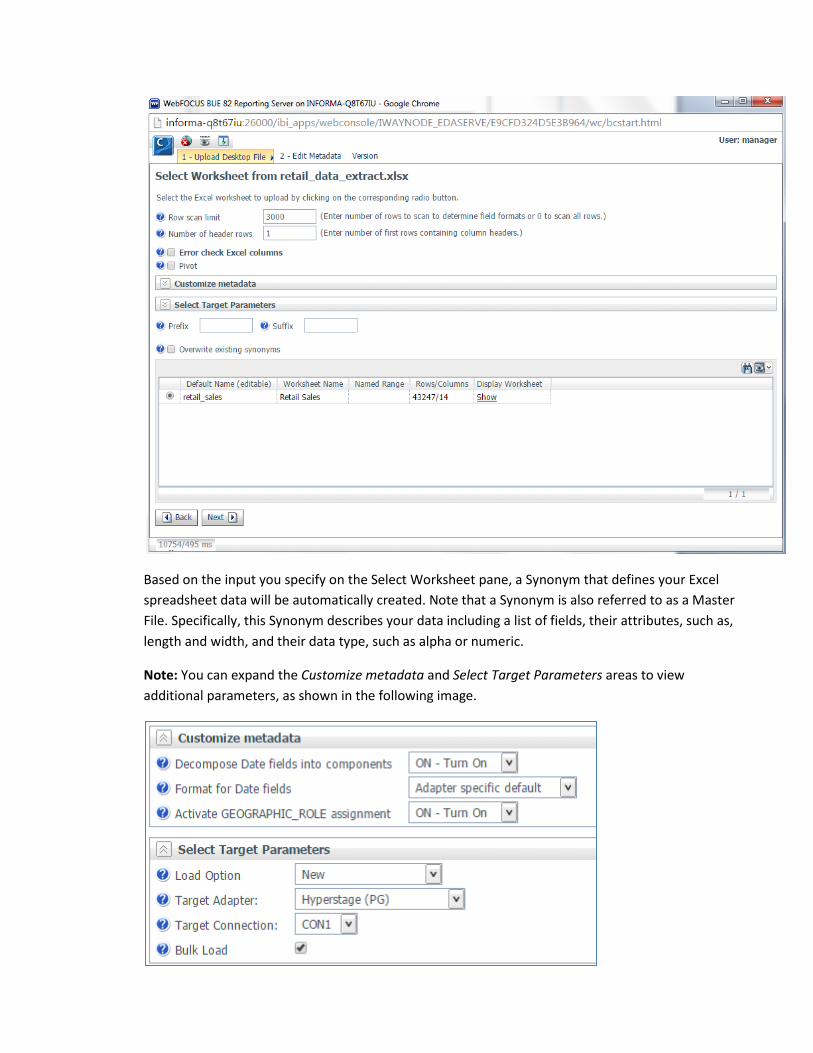
Based on the input you specify on the Select Worksheet pane, a Synonym that defines your Excel spreadsheet data will be automatically created. Note that a Synonym is also referred to as a Master File. Specifically, this Synonym describes your data including a list of fields, their attributes, such as, length and width, and their data type, such as alpha or numeric.
Note: You can expand the Customize metadata and Select Target Parameters areas to view additional parameters, as shown in the following image.
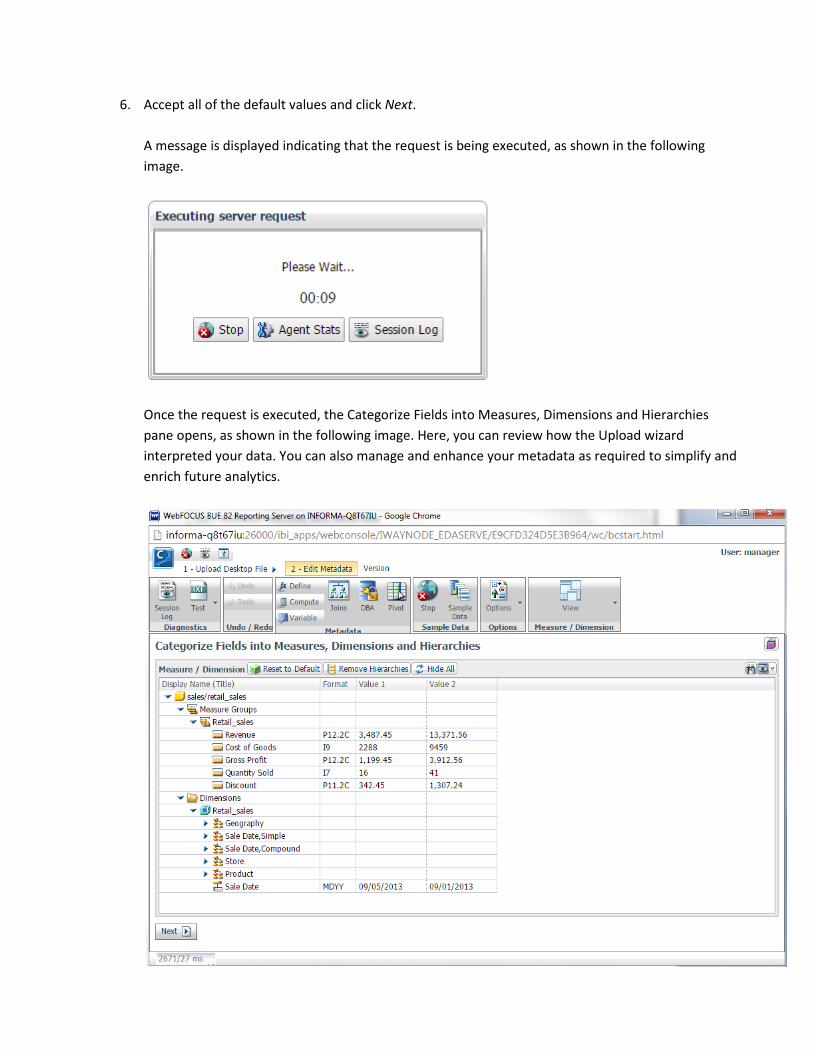
6. Accept all of the default values and click Next. A message is displayed indicating that the request is being executed, as shown in the following image.
Once the request is executed, the Categorize Fields into Measures, Dimensions and Hierarchies pane opens, as shown in the following image. Here, you can review how the Upload wizard interpreted your data. You can also manage and enhance your metadata as required to simplify and enrich future analytics.
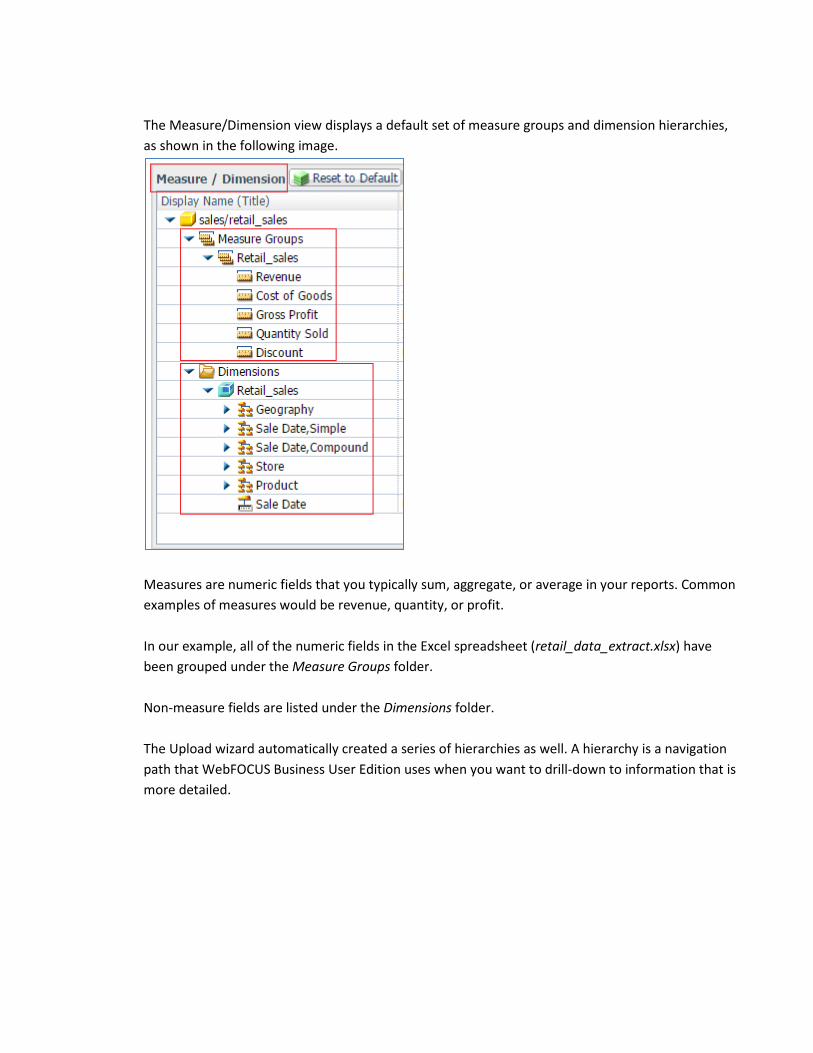
The Measure/Dimension view displays a default set of measure groups and dimension hierarchies, as shown in the following image.
Measures are numeric fields that you typically sum, aggregate, or average in your reports. Common examples of measures would be revenue, quantity, or profit. In our example, all of the numeric fields in the Excel spreadsheet (retail_data_extract.xlsx) have been grouped under the Measure Groups folder. Non-measure fields are listed under the Dimensions folder. The Upload wizard automatically created a series of hierarchies as well. A hierarchy is a navigation path that WebFOCUS Business User Edition uses when you want to drill-down to information that is more detailed.
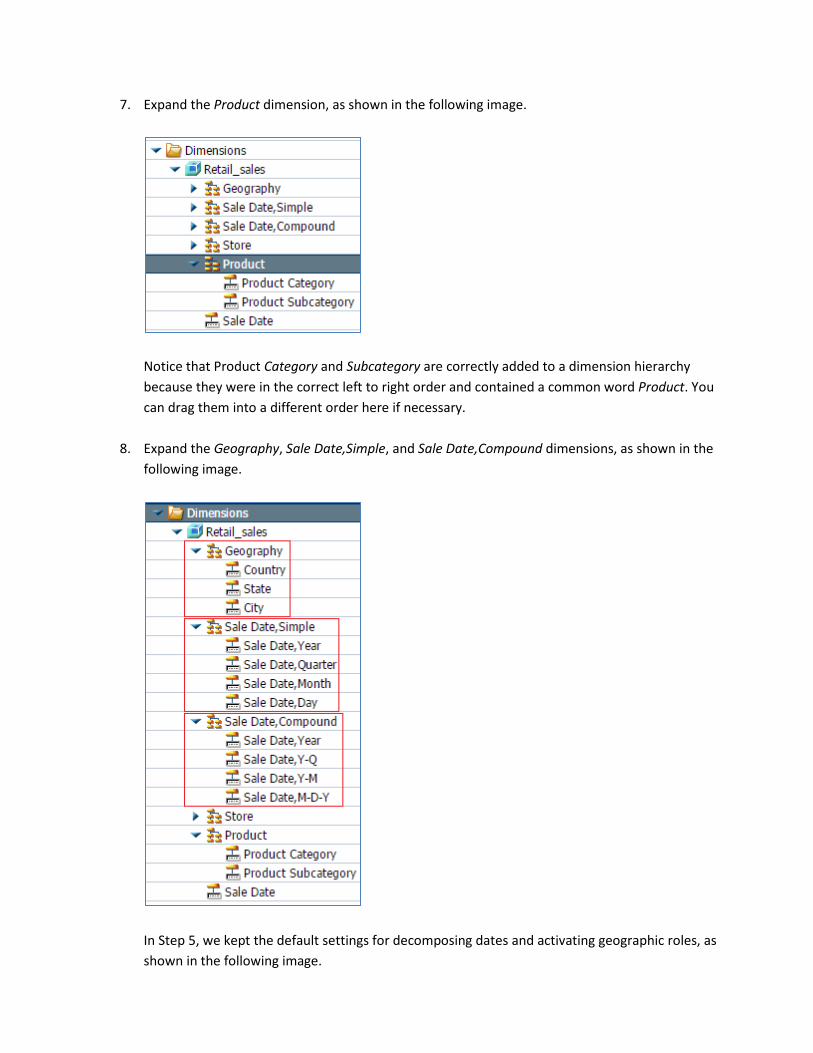
7. Expand the Product dimension, as shown in the following image.
Notice that Product Category and Subcategory are correctly added to a dimension hierarchy because they were in the correct left to right order and contained a common word Product. You can drag them into a different order here if necessary.
8. Expand the Geography, Sale Date,Simple, and Sale Date,Compound dimensions, as shown in the following image.
In Step 5, we kept the default settings for decomposing dates and activating geographic roles, as shown in the following image.
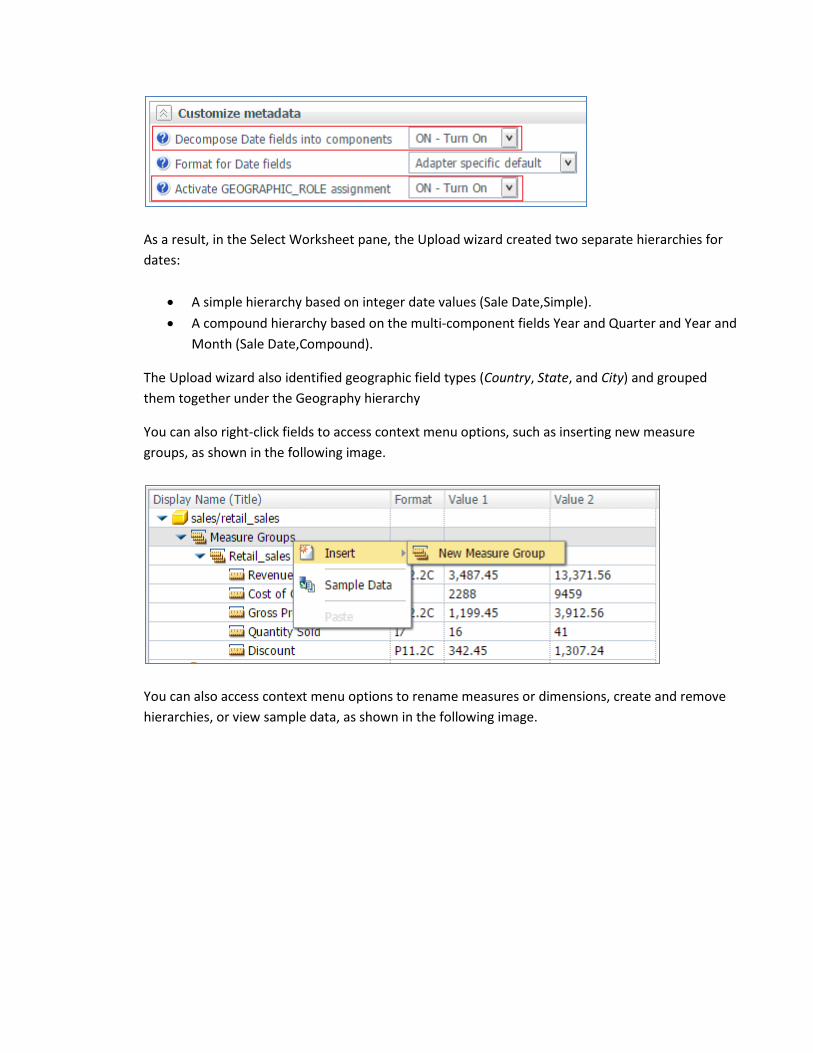
As a result, in the Select Worksheet pane, the Upload wizard created two separate hierarchies for dates:
• A simple hierarchy based on integer date values (Sale Date,Simple). • A compound hierarchy based on the multi-component fields Year and Quarter and Year and
Month (Sale Date,Compound).
The Upload wizard also identified geographic field types (Country, State, and City) and grouped them together under the Geography hierarchy
You can also right-click fields to access context menu options, such as inserting new measure groups, as shown in the following image.
You can also access context menu options to rename measures or dimensions, create and remove hierarchies, or view sample data, as shown in the following image.
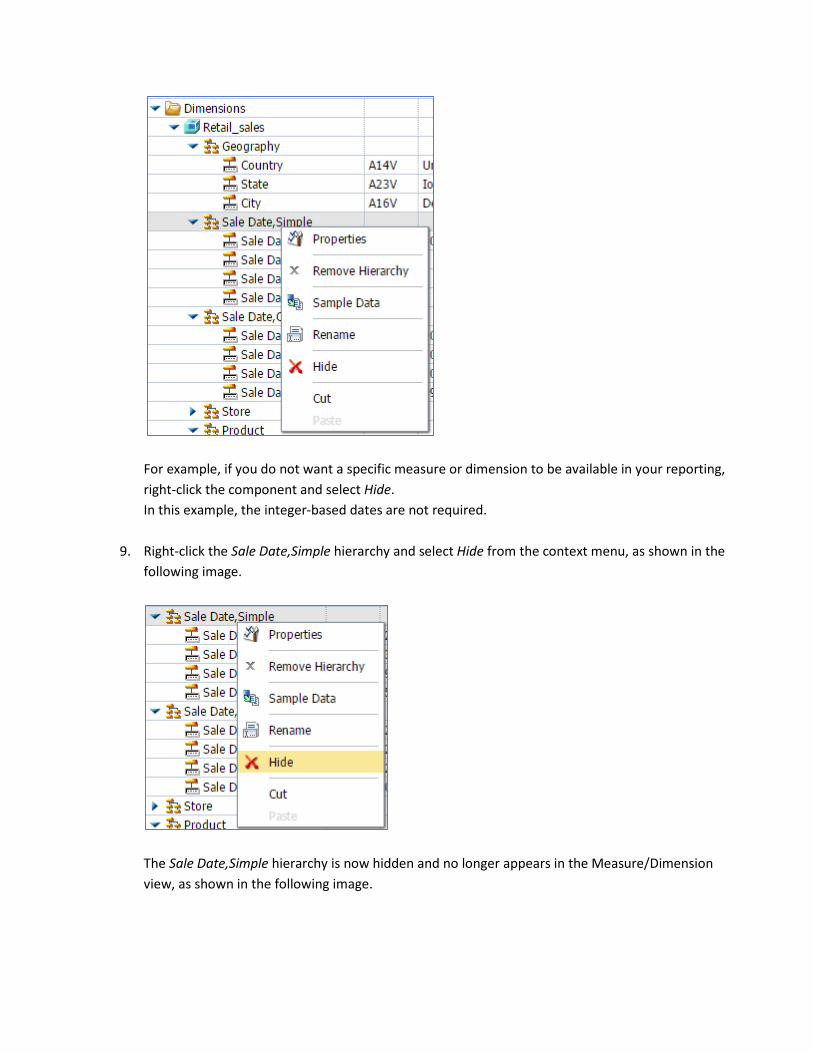
For example, if you do not want a specific measure or dimension to be available in your reporting, right-click the component and select Hide. In this example, the integer-based dates are not required.
9. Right-click the Sale Date,Simple hierarchy and select Hide from the context menu, as shown in the following image.
The Sale Date,Simple hierarchy is now hidden and no longer appears in the Measure/Dimension view, as shown in the following image.
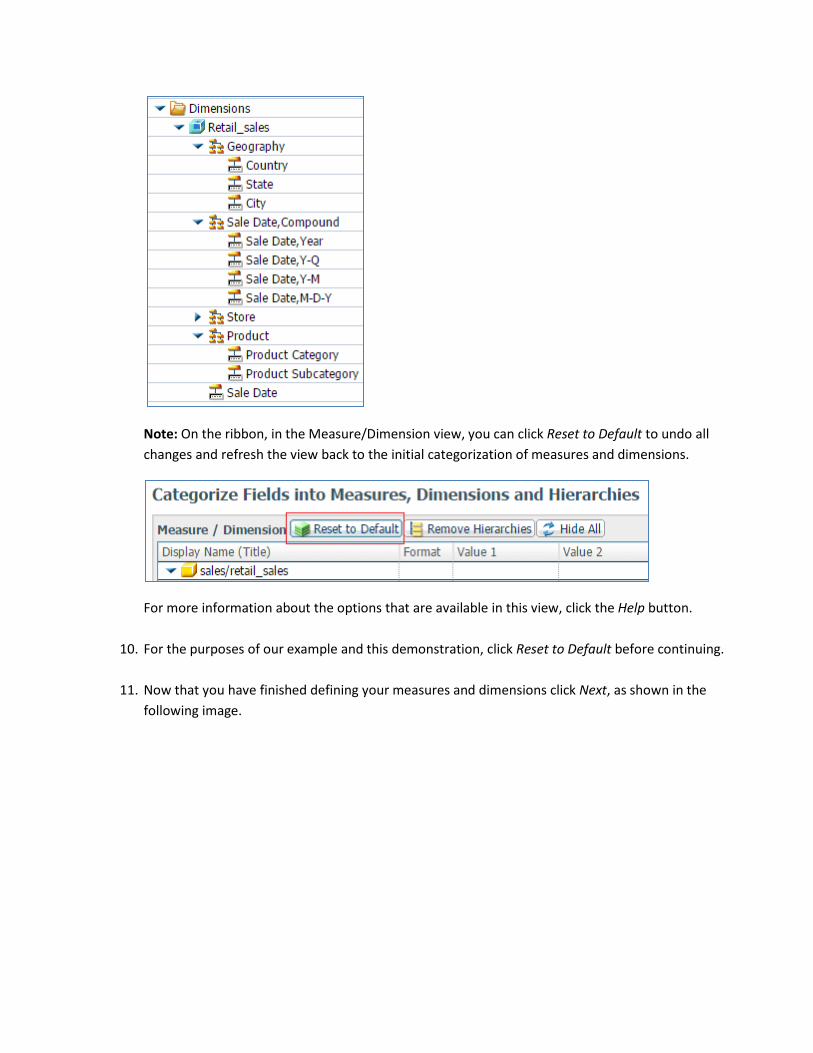
Note: On the ribbon, in the Measure/Dimension view, you can click Reset to Default to undo all changes and refresh the view back to the initial categorization of measures and dimensions.
For more information about the options that are available in this view, click the Help button.
10. For the purposes of our example and this demonstration, click Reset to Default before continuing.
11. Now that you have finished defining your measures and dimensions click Next, as shown in the following image.
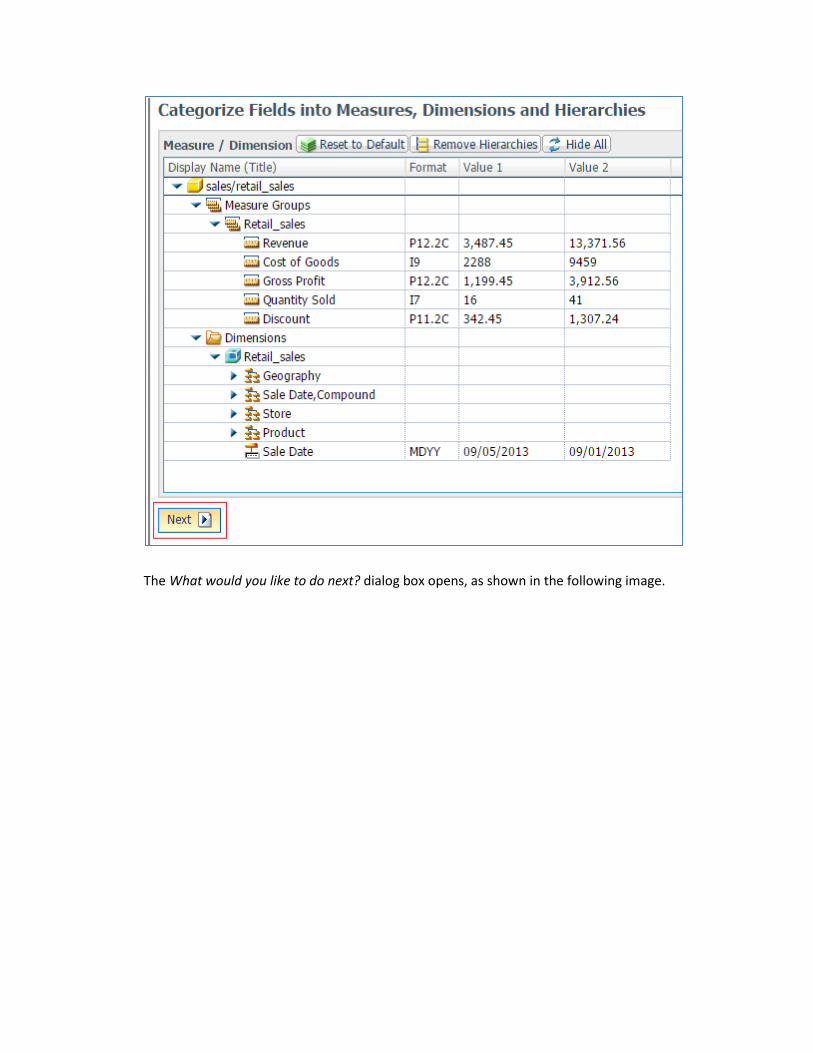
The What would you like to do next? dialog box opens, as shown in the following image.
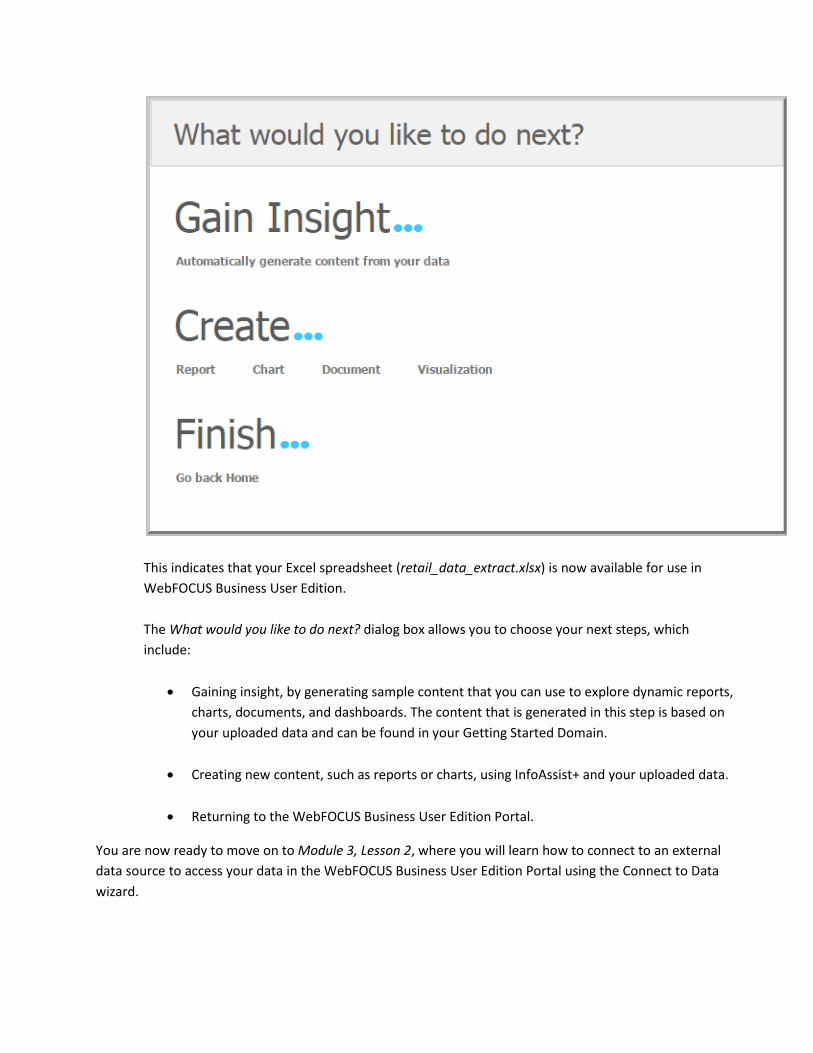
This indicates that your Excel spreadsheet (retail_data_extract.xlsx) is now available for use in WebFOCUS Business User Edition. The What would you like to do next? dialog box allows you to choose your next steps, which include:
• Gaining insight, by generating sample content that you can use to explore dynamic reports, charts, documents, and dashboards. The content that is generated in this step is based on your uploaded data and can be found in your Getting Started Domain.
• Creating new content, such as reports or charts, using InfoAssist+ and your uploaded data.
• Returning to the WebFOCUS Business User Edition Portal.
You are now ready to move on to Module 3, Lesson 2, where you will learn how to connect to an external data source to access your data in the WebFOCUS Business User Edition Portal using the Connect to Data wizard.