Embed Size (px)
Citation preview
Module 2: Creating Multidimensional
Analysis Solutions
Overview
•Developing Analysis Services Solutions
•Creating Data Sources and Data Source Views
•Creating a Cube
Lesson 1: Developing Analysis Services Solutions
•Options for Analysis Services Development
• Introduction to SQL Server Data Tools
•Source Control for Developing Analysis Services Projects
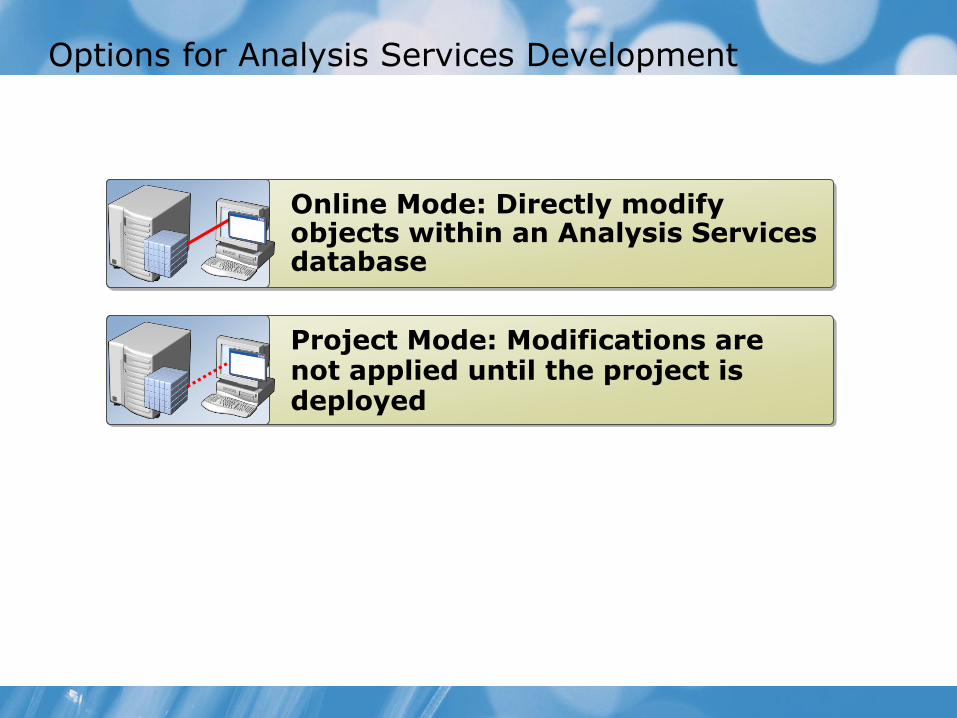
Options for Analysis Services Development
Online Mode: Directly modify objects within an Analysis Services database
Project Mode: Modifications are not applied until the project is deployed
Introduction to SQL Server Data Tools
Based on Microsoft Visual Studio
Provides a comprehensive development environment
Includes several designers and wizards to create specific objects
Uses context sensitive menus to improve ease of use
Is customizable through the Tools menu
Source Control for Developing Analysis Services Projects
Avoid conflicts when there are multiple developers
Integrated into Analysis Services development tools
Demonstration: Using Source Control for Analysis Services Projects
In this demonstration, you will see how to:
•Use Team Foundation Server to provide source control to an Analysis Services project
Lesson 2: Creating Data Sources and Data Source Views
•Data Sources and Data Source Views
•Creating a Data Source
•Creating a Data Source View
•Modifying a Data Source View
Data Sources and Data Source Views
Data sources contain connection strings to the databases that contain the fact and dimension tables
Data source views provide an abstraction layer over the underlying data sources
Creating a Data Source
Use the Data Source Wizard to define data sources in Analysis Services
The default provider for a new connection is the Native OLE DB\SQL Server Native Client
Your data source can be based on an existing data source in your solution or on an Analysis Services project
Creating a Data Source View
Use the Data Source View Wizard to define a new data source view
Select a previously defined data source, or define a new data source for the data source view
Select tables and views from the primary data source to add to the data source view
Add tables and columns from a secondary data source after you have initially defined the data source view
Modifying a Data Source View
Modify the Data Source View By:
Renaming tables and columns
Creating named queries
Creating named calculations
Creating a logical primary key
Creating relationships
Creating new diagrams
Demonstration: Using Data Source Views
In this demonstration, you will see how to:
•Create a data source
•Create a data source view
•Modify a data source view
Lesson 3: Creating a Cube
•Options for Creating a Cube
•Considerations for Time Dimensions
• The Cube Designer
•Browsing a Cube
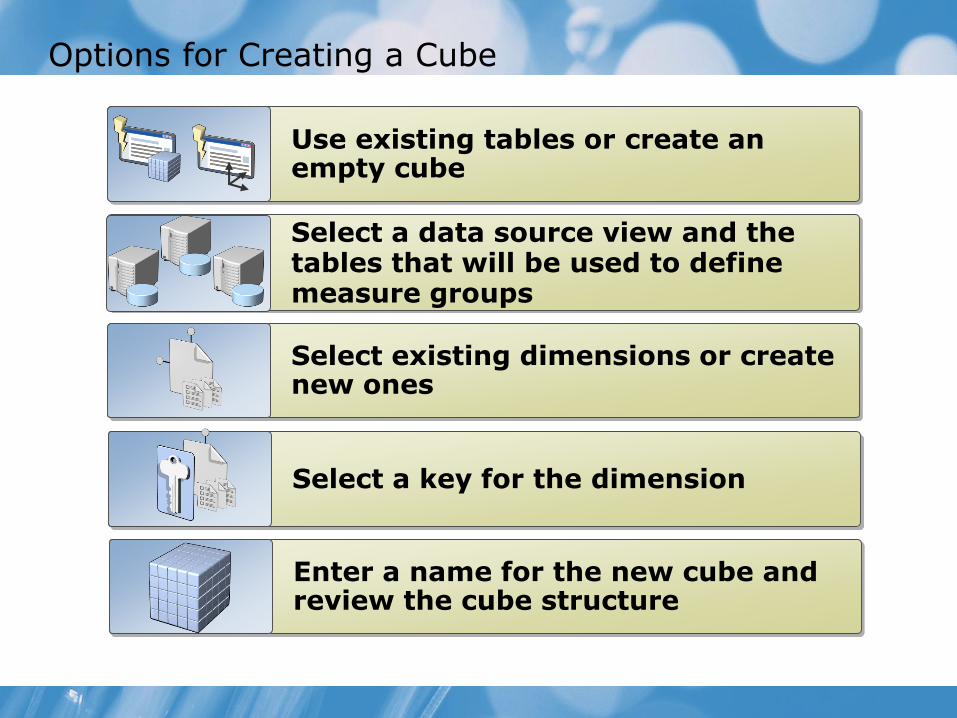
Options for Creating a Cube
Use existing tables or create an empty cube
Select a data source view and the tables that will be used to define measure groups
Select existing dimensions or create new ones
Select a key for the dimension
Enter a name for the new cube and review the cube structure
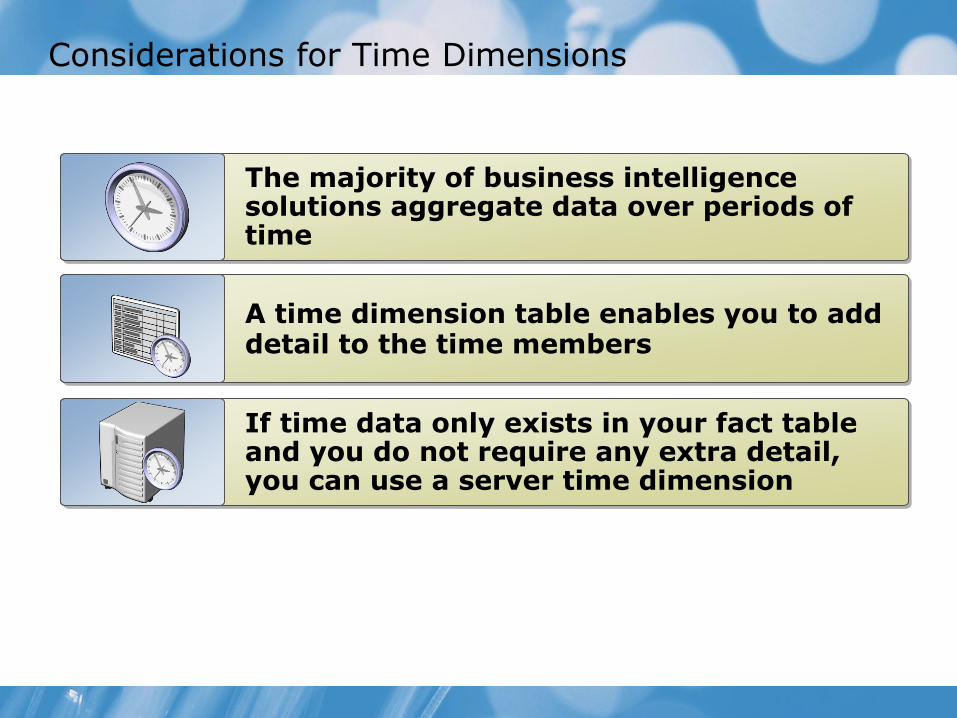
Considerations for Time Dimensions
The majority of business intelligence solutions aggregate data over periods of time
A time dimension table enables you to add detail to the time members
If time data only exists in your fact table and you do not require any extra detail, you can use a server time dimension
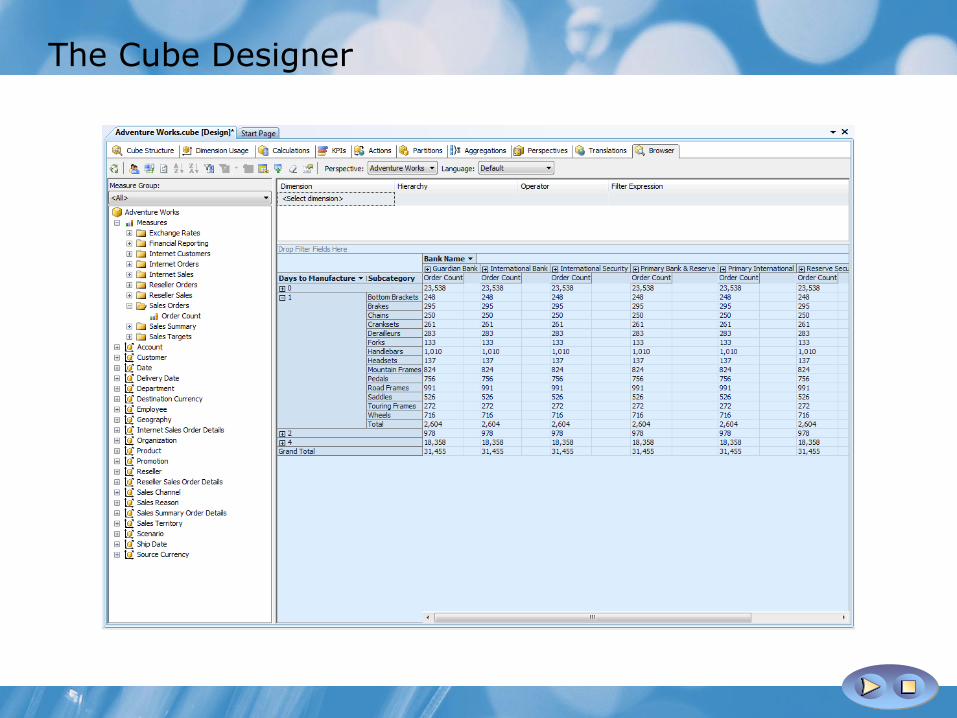
The Cube Designer
Demonstration: Designing a Cube
In this demonstration, you will see how to:
•Create a cube using the Cube Wizard
•Modify the cube using the Cube Designer
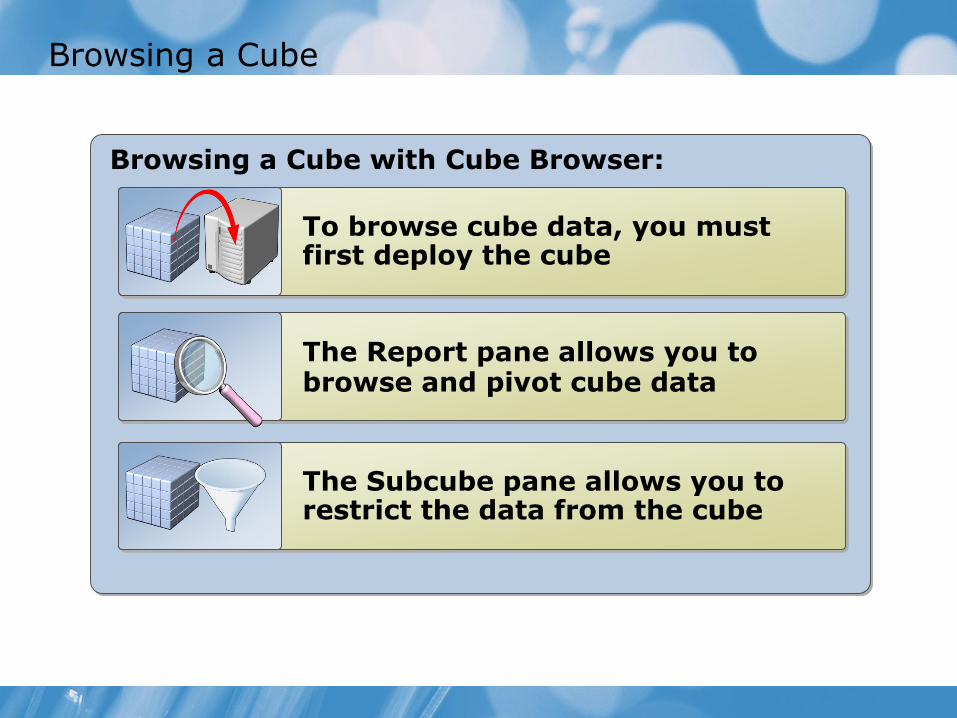
Browsing a Cube with Cube Browser:
Browsing a Cube
To browse cube data, you must first deploy the cube
The Report pane allows you to browse and pivot cube data
The Subcube pane allows you to restrict the data from the cube
Demonstration: Browsing a Cube
In this demonstration, you will see how to:
•Deploy a cube
•Browse cube data
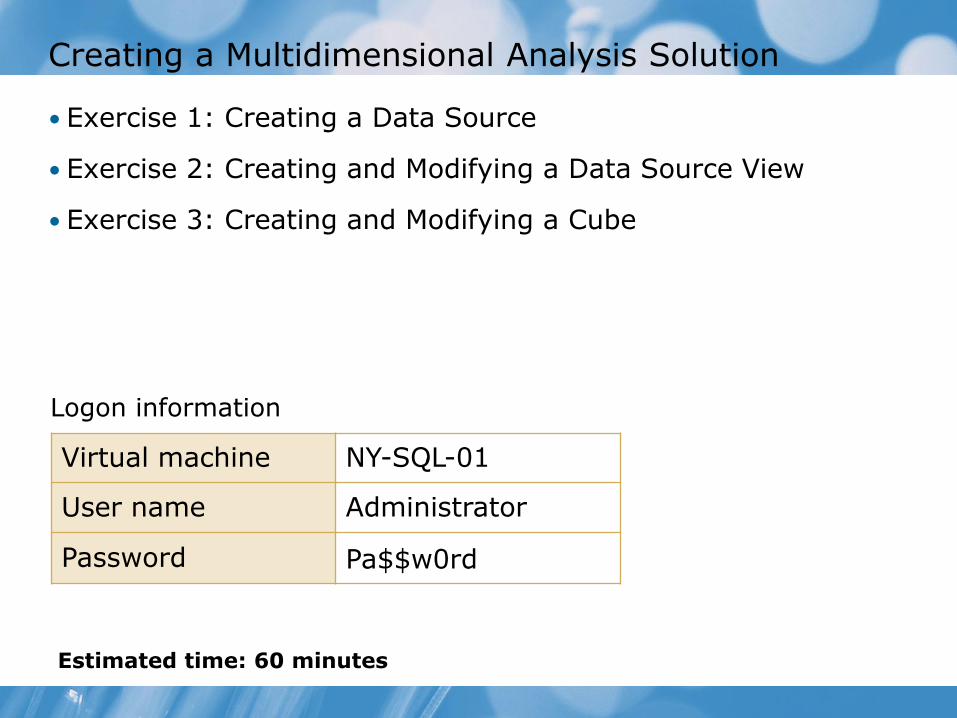
Creating a Multidimensional Analysis Solution
• Exercise 1: Creating a Data Source
• Exercise 2: Creating and Modifying a Data Source View
• Exercise 3: Creating and Modifying a Cube
Logon information
Virtual machine NY-SQL-01
User name Administrator
Password Pa$$w0rd
Estimated time: 60 minutes
Lab Scenario
• You have been asked to develop a basic Analysis Services solution to demonstrate some of the features of SQL Server Analysis Services. You will create a new Analysis Services project, create a data source for a database, create and modify a data source view, create and modify a cube, and finally browse the cube using both SQL Server Business Intelligence Development Studio and Microsoft® Office Excel® 2007.
Lab Review
•What property can you modify in the data source view to make field names easier to read?
• If the data source view contains FirstName and LastName fields, what would you use to create a field that contained the full name in a single field?
•What are the two types of tables used in creating a cube?
Module Review and Takeaways
•Review Questions
•Best Practices