Embed Size (px)
DESCRIPTION
LEan
Citation preview
Elective course, Operations Process Management (Part of CM_J49 Minor in OM) Fall 2015
Lean, Lean tools Lean implementation Module 11 – October 7, 2015
2
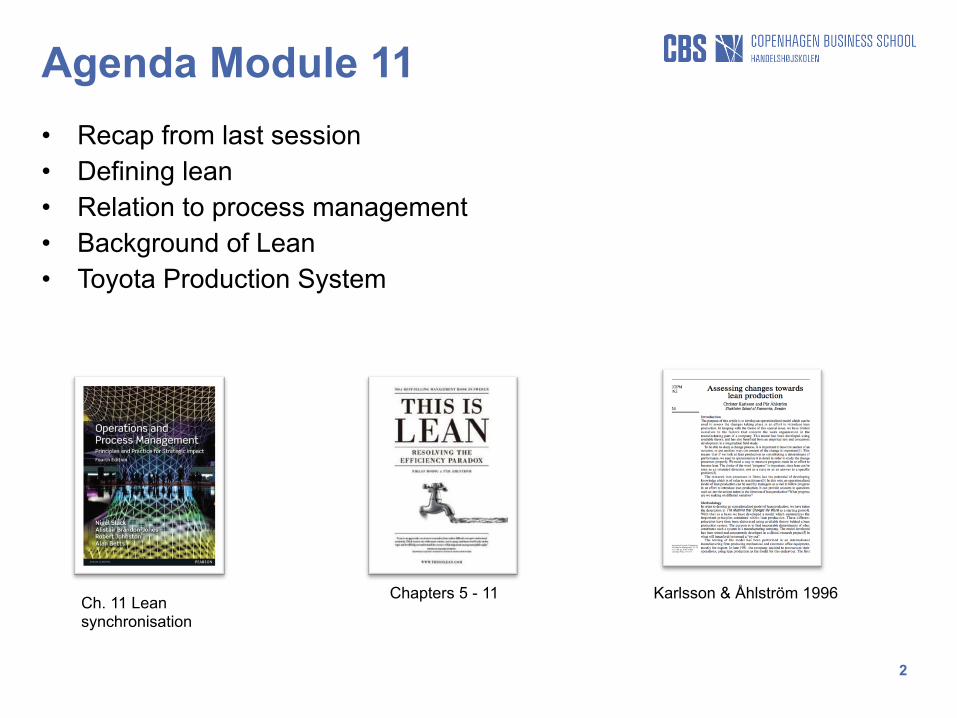
Agenda Module 11 • Recap from last session • Defining lean • Relation to process management • Background of Lean • Toyota Production System
Ch. 11 Lean synchronisation
Chapters 5 - 11 Karlsson & Åhlström 1996
3
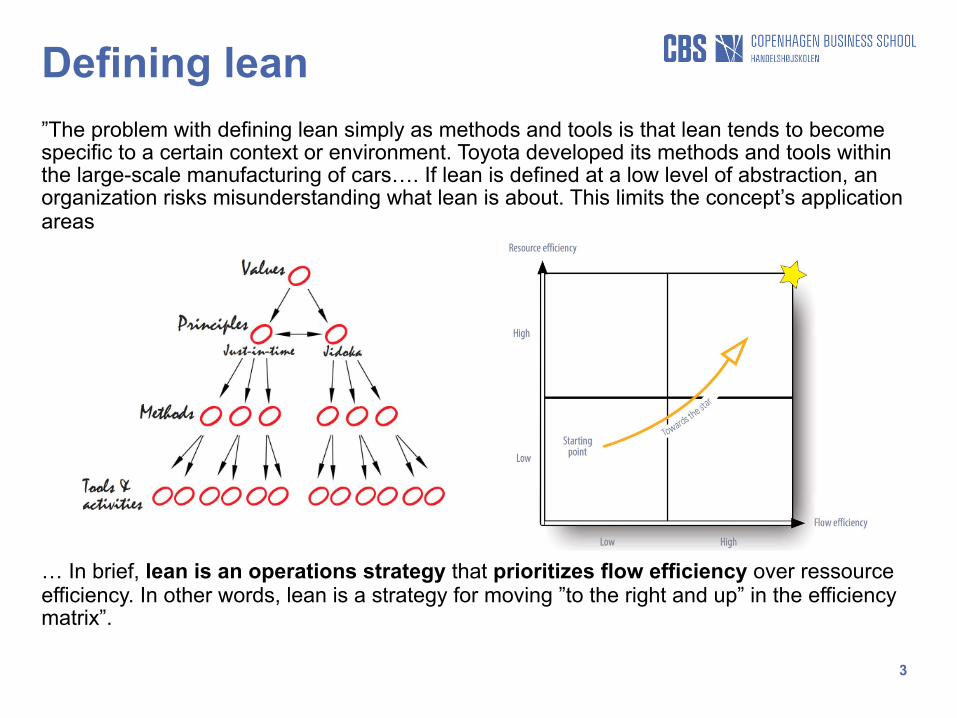
Defining lean ”The problem with defining lean simply as methods and tools is that lean tends to become specific to a certain context or environment. Toyota developed its methods and tools within the large-scale manufacturing of cars…. If lean is defined at a low level of abstraction, an organization risks misunderstanding what lean is about. This limits the concept’s application areas … In brief, lean is an operations strategy that prioritizes flow efficiency over ressource efficiency. In other words, lean is a strategy for moving ”to the right and up” in the efficiency matrix”.
4
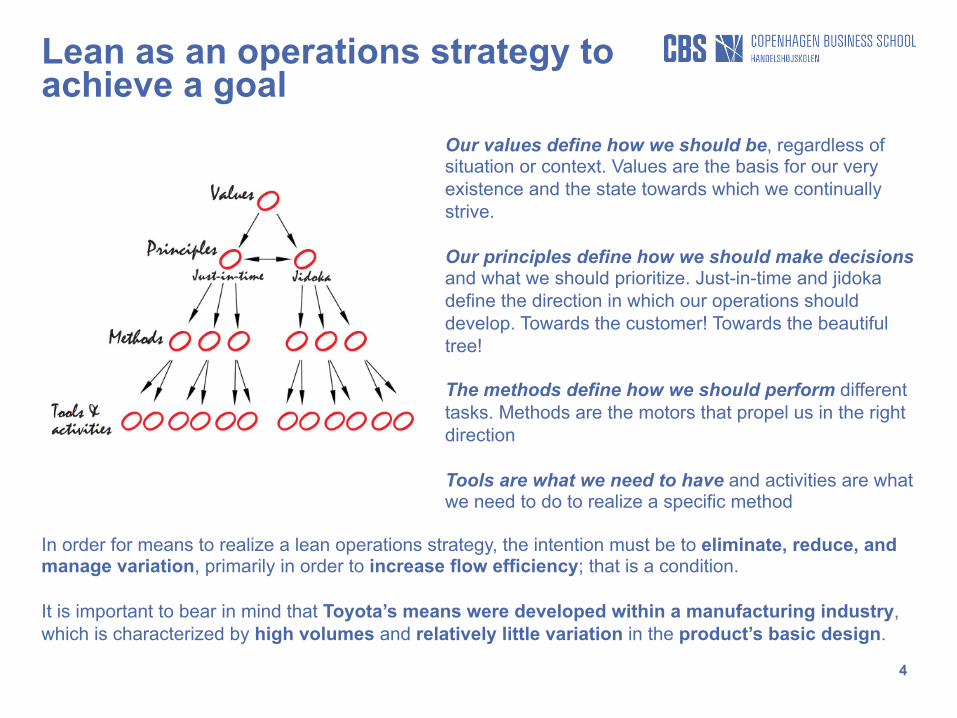
Lean as an operations strategy to achieve a goal
Our values define how we should be, regardless of situation or context. Values are the basis for our very existence and the state towards which we continually strive. Our principles define how we should make decisions and what we should prioritize. Just-in-time and jidoka define the direction in which our operations should develop. Towards the customer! Towards the beautiful tree! The methods define how we should perform different tasks. Methods are the motors that propel us in the right direction Tools are what we need to have and activities are what we need to do to realize a specific method
In order for means to realize a lean operations strategy, the intention must be to eliminate, reduce, and manage variation, primarily in order to increase flow efficiency; that is a condition. It is important to bear in mind that Toyota’s means were developed within a manufacturing industry, which is characterized by high volumes and relatively little variation in the product’s basic design.
5
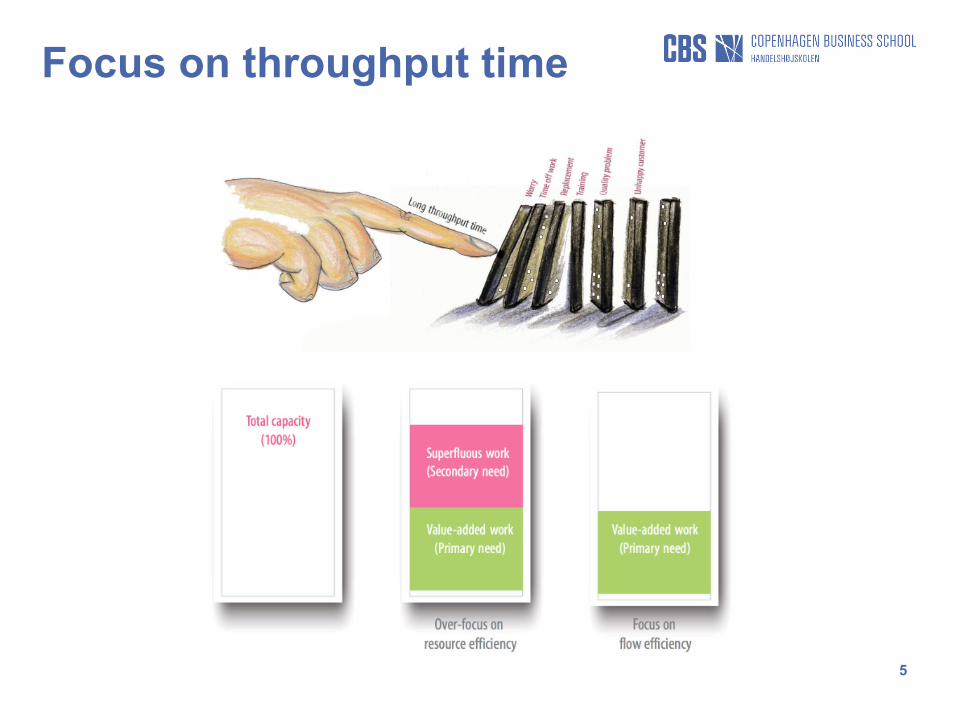
Focus on throughput time
6
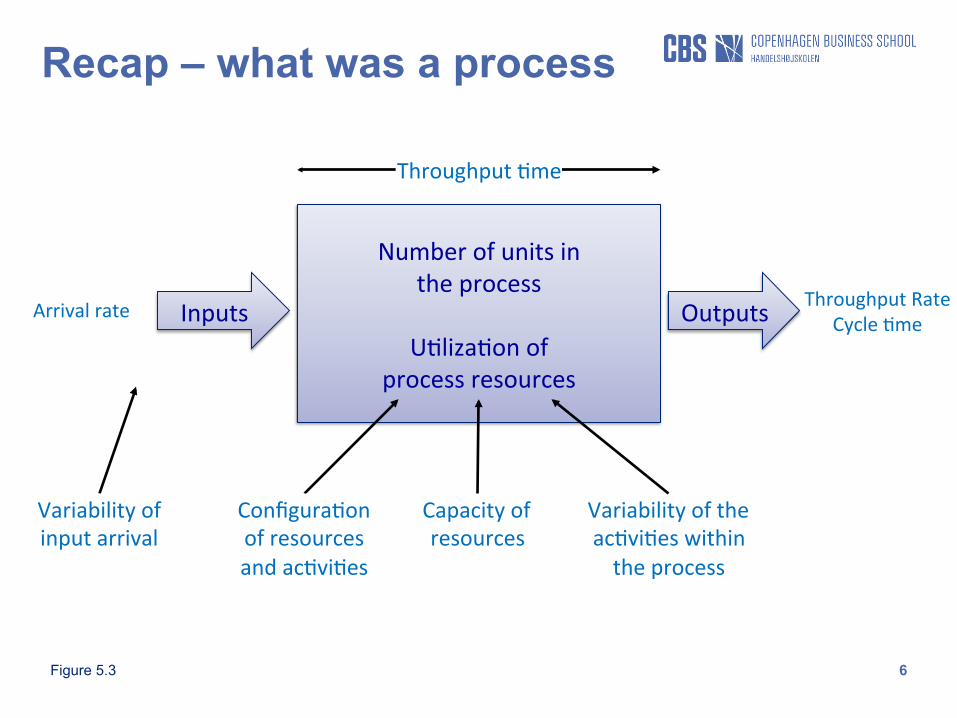
Recap – what was a process
Inputs
Number of units in the process
U3liza3on of
process resources
Outputs
Throughput 3me
Configura3on of resources and ac3vi3es
Capacity of resources
Variability of the ac3vi3es within the process
Throughput Rate Cycle 3me
Arrival rate
Variability of input arrival
Figure 5.3
7
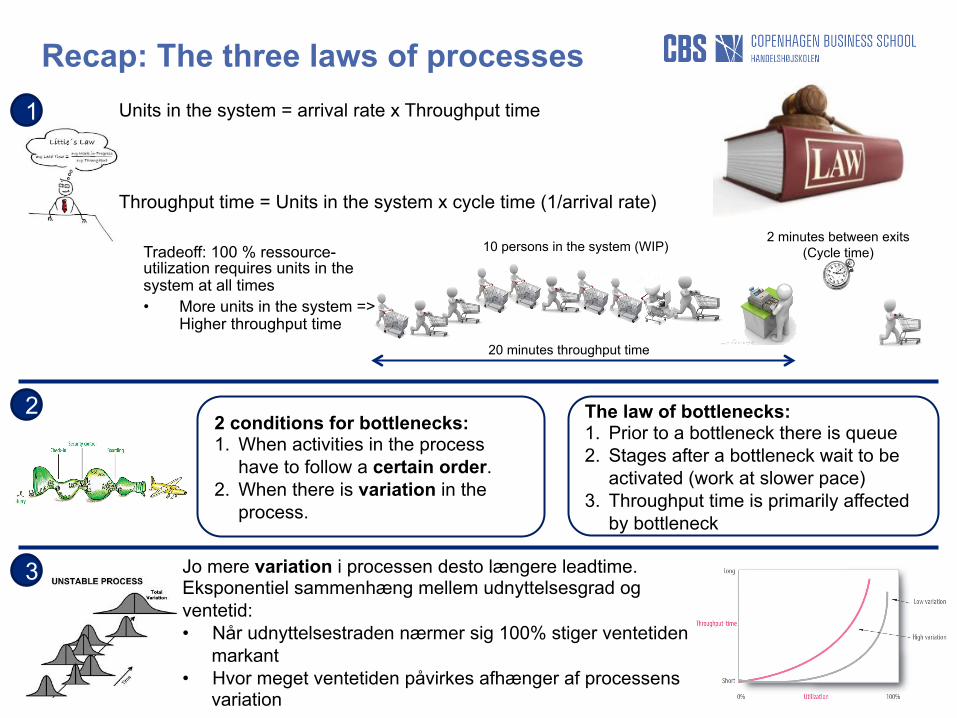
Recap: The three laws of processes
The law of bottlenecks: 1. Prior to a bottleneck there is queue 2. Stages after a bottleneck wait to be
activated (work at slower pace) 3. Throughput time is primarily affected
by bottleneck
2 conditions for bottlenecks: 1. When activities in the process
have to follow a certain order. 2. When there is variation in the
process.
Jo mere variation i processen desto længere leadtime. Eksponentiel sammenhæng mellem udnyttelsesgrad og ventetid: • Når udnyttelsestraden nærmer sig 100% stiger ventetiden
markant • Hvor meget ventetiden påvirkes afhænger af processens
variation
Units in the system = arrival rate x Throughput time
Throughput time = Units in the system x cycle time (1/arrival rate)
2 minutes between exits (Cycle time) 10 persons in the system (WIP)
20 minutes throughput time
Tradeoff: 100 % ressource-utilization requires units in the system at all times • More units in the system =>
Higher throughput time
1
2
3
8
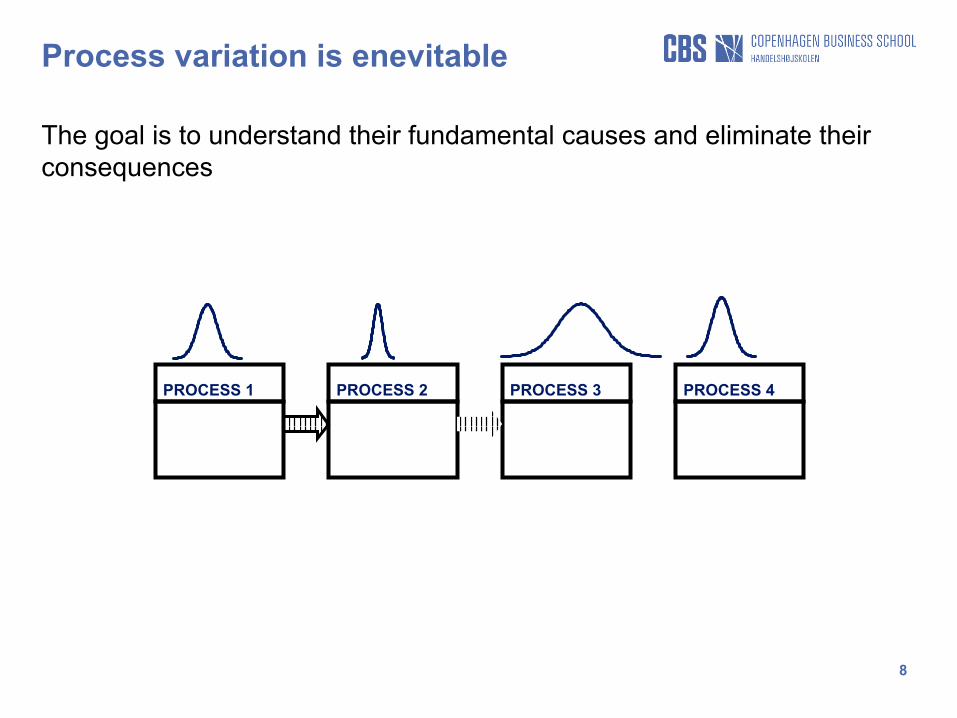
Process variation is enevitable
The goal is to understand their fundamental causes and eliminate their consequences
PROCESS 1 PROCESS 2 PROCESS 3 PROCESS 4
Late supplier delivery
Absence
Machine break down
scrap
Rush orders
Lack of space
late lab analyses
Unplanned maintenance
Training activities
demand mix changes
Fire drill
Power cuts
IT breakdown
late pick-up
Order entry error
Cooperation issues
Strikes
Error in batch reports
9
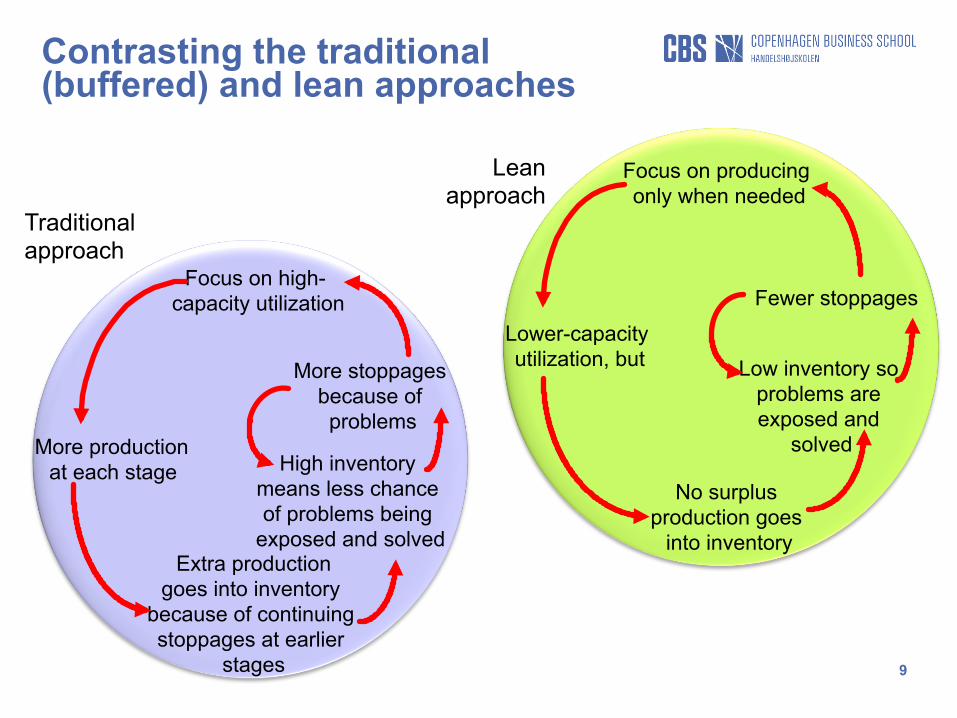
Contrasting the traditional (buffered) and lean approaches
Lean approach
Focus on producing only when needed
Lower-capacity utilization, but
No surplus production goes
into inventory
Low inventory so problems are exposed and
solved
Traditional approach
Focus on high- capacity utilization
More production at each stage
Extra production goes into inventory
because of continuing stoppages at earlier
stages
High inventory means less chance of problems being
exposed and solved
More stoppages because of problems
Fewer stoppages
10
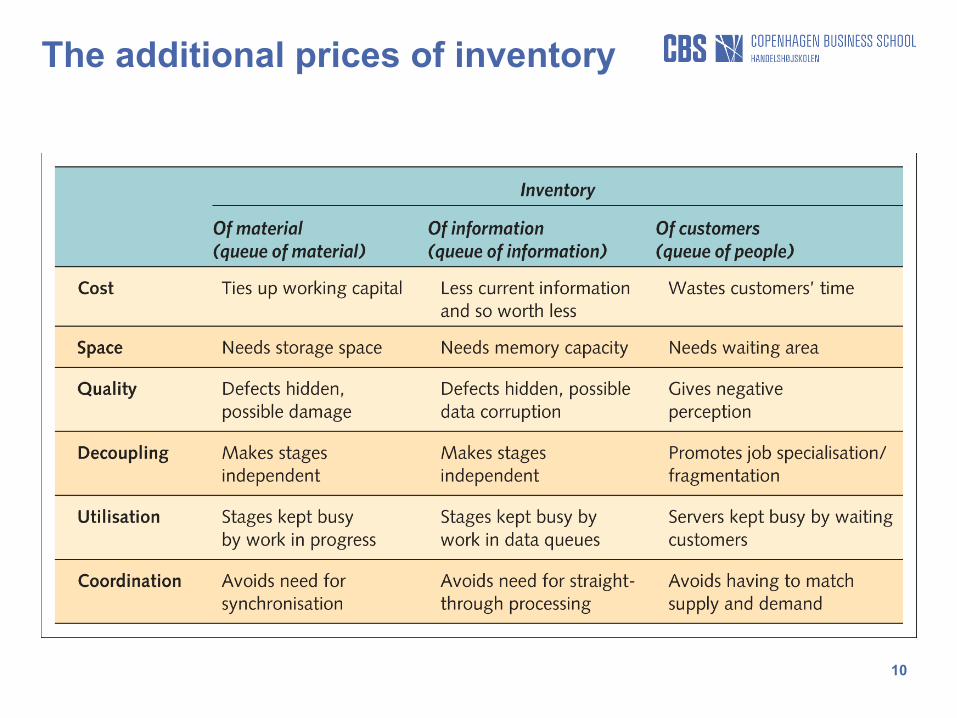
The additional prices of inventory
11
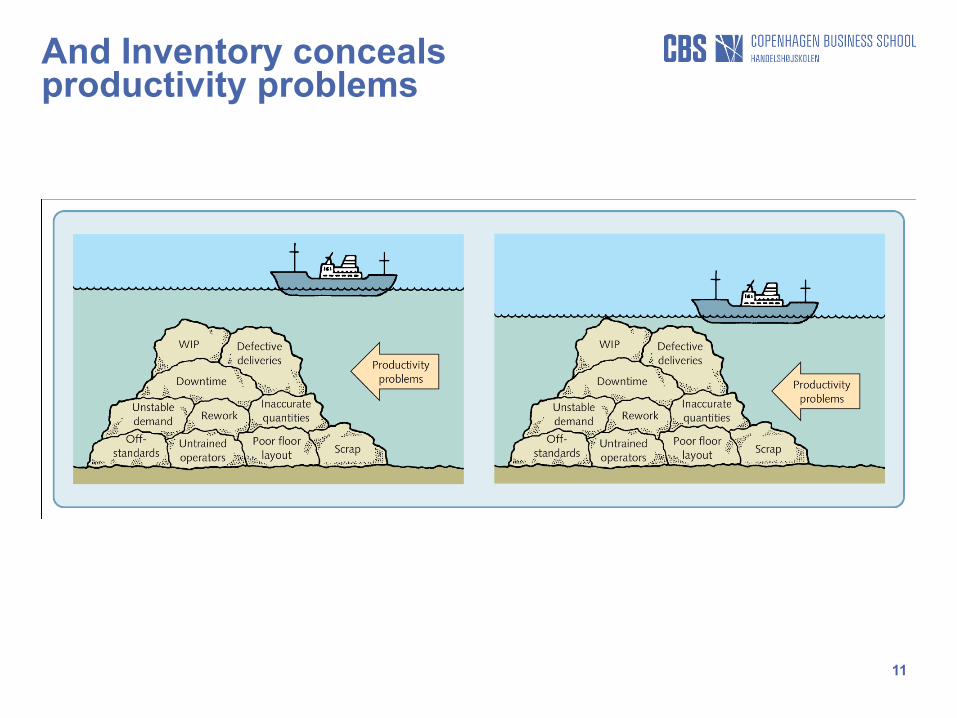
And Inventory conceals productivity problems
12
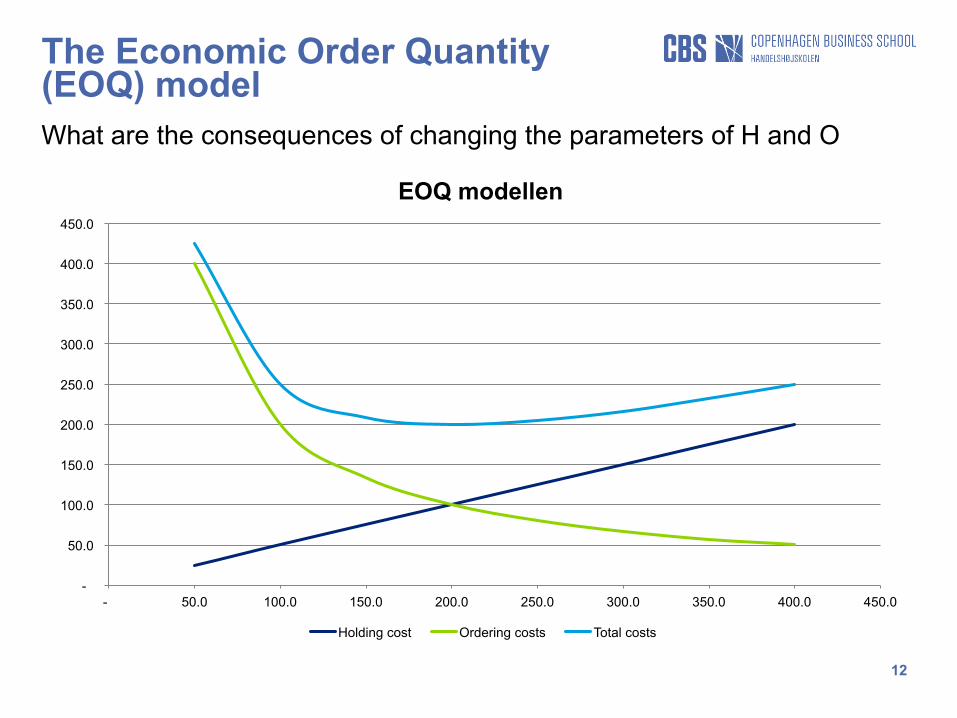
The Economic Order Quantity (EOQ) model What are the consequences of changing the parameters of H and O
-
50.0
100.0
150.0
200.0
250.0
300.0
350.0
400.0
450.0
- 50.0 100.0 150.0 200.0 250.0 300.0 350.0 400.0 450.0
EOQ modellen
Holding cost Ordering costs Total costs
Background for Lean Developments in the Automotive Indstry
14
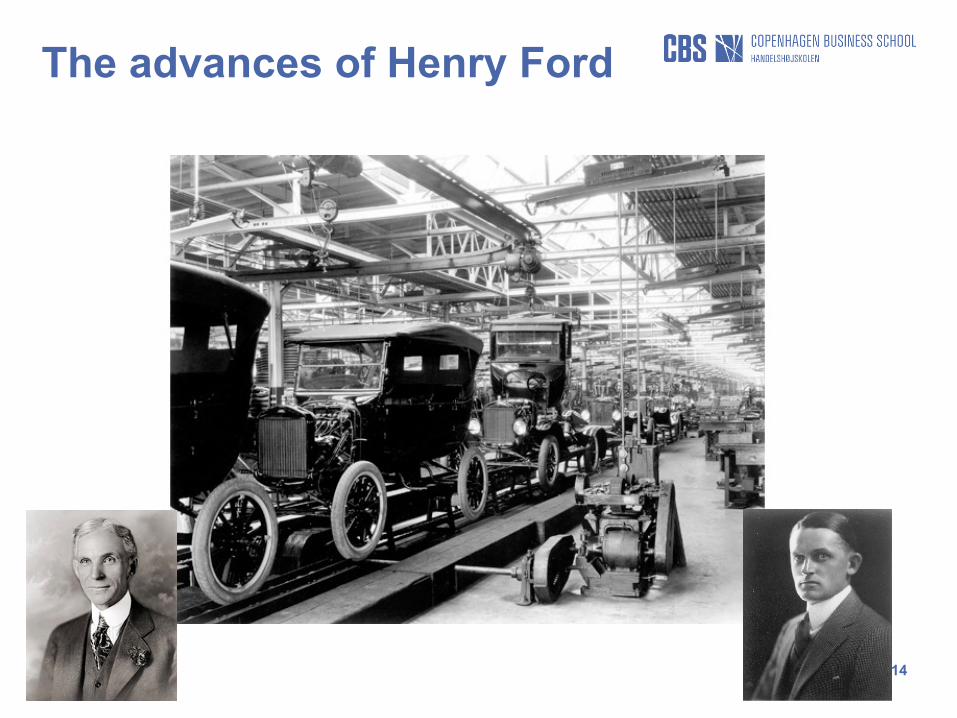
The advances of Henry Ford
15
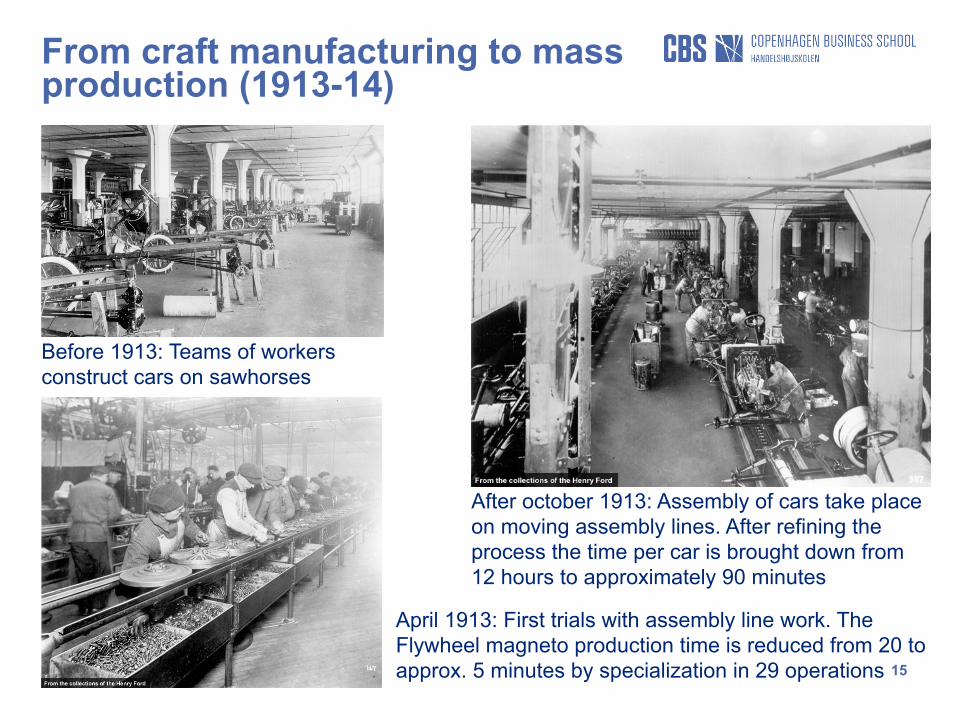
From craft manufacturing to mass production (1913-14)
Before 1913: Teams of workers construct cars on sawhorses
After october 1913: Assembly of cars take place on moving assembly lines. After refining the process the time per car is brought down from 12 hours to approximately 90 minutes
April 1913: First trials with assembly line work. The Flywheel magneto production time is reduced from 20 to approx. 5 minutes by specialization in 29 operations
16
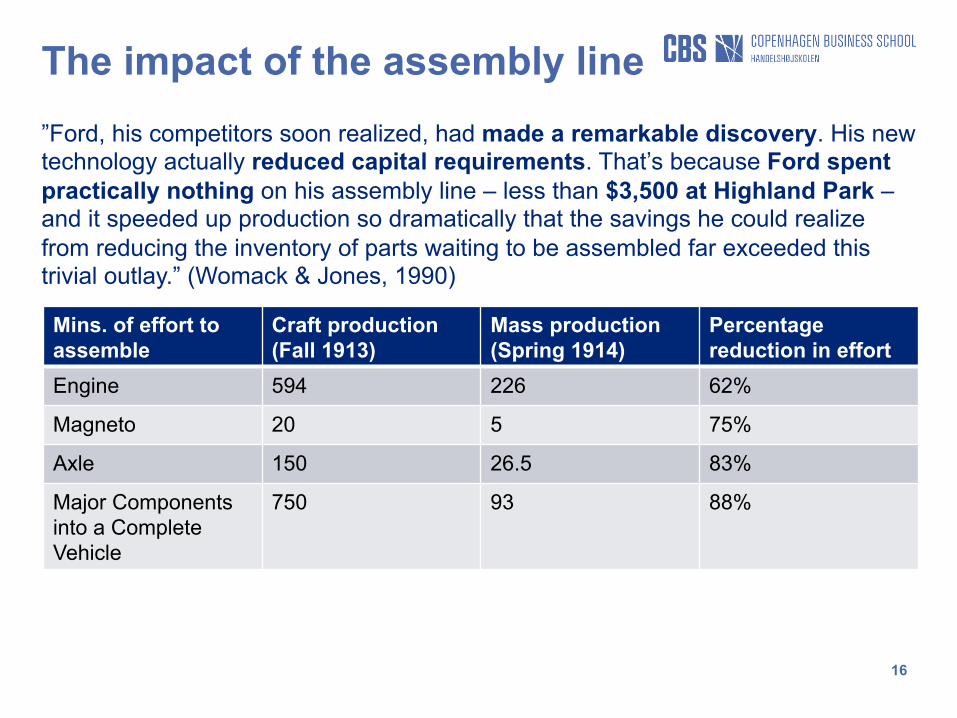
The impact of the assembly line
Mins. of effort to assemble
Craft production (Fall 1913)
Mass production (Spring 1914)
Percentage reduction in effort
Engine 594 226 62%
Magneto 20 5 75%
Axle 150 26.5 83%
Major Components into a Complete Vehicle
750 93 88%
”Ford, his competitors soon realized, had made a remarkable discovery. His new technology actually reduced capital requirements. That’s because Ford spent practically nothing on his assembly line – less than $3,500 at Highland Park – and it speeded up production so dramatically that the savings he could realize from reducing the inventory of parts waiting to be assembled far exceeded this trivial outlay.” (Womack & Jones, 1990)
17
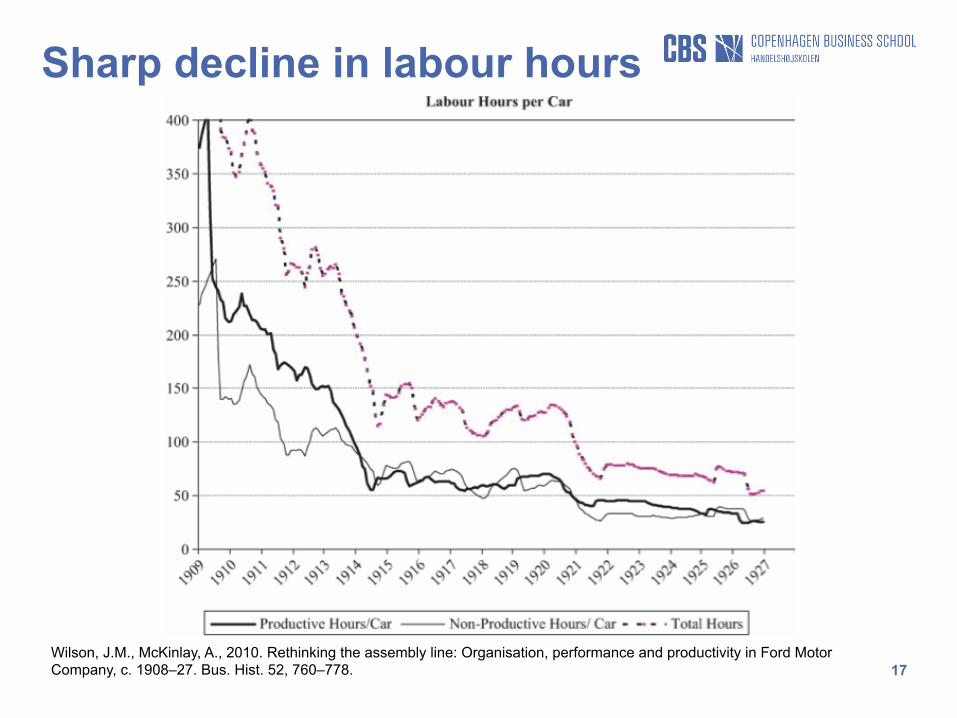
Sharp decline in labour hours
Wilson, J.M., McKinlay, A., 2010. Rethinking the assembly line: Organisation, performance and productivity in Ford Motor Company, c. 1908–27. Bus. Hist. 52, 760–778.
18
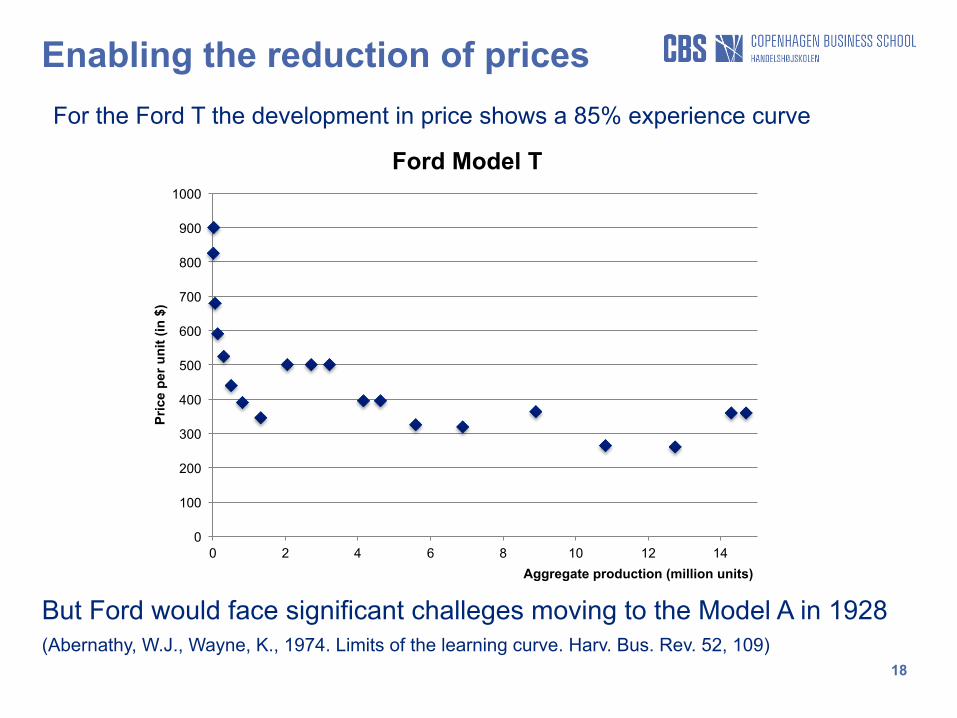
Enabling the reduction of prices
0
100
200
300
400
500
600
700
800
900
1000
0 2 4 6 8 10 12 14
Pric
e pe
r uni
t (in
$)
Aggregate production (million units)
Ford Model T
But Ford would face significant challeges moving to the Model A in 1928 (Abernathy, W.J., Wayne, K., 1974. Limits of the learning curve. Harv. Bus. Rev. 52, 109)
For the Ford T the development in price shows a 85% experience curve

19
The dominance of US automotive manufactures challenged 1955 was the first year with +7 million cars sold in the US • The big three (Ford, GM and Chrysler) completely dominated the US market for
automobiles (95% marketshare) • NA accounted for almost 75% share of the World Motor Vehicle Production • It was also the year that the downhill slide began
Womack, J.P., Jones, D.T., Roos, D., 1991. The machine that changed the world. How Japan’s secret weapon in the global auto wars will revolutionize western industry. HarperPerennial, New York, NY.
20
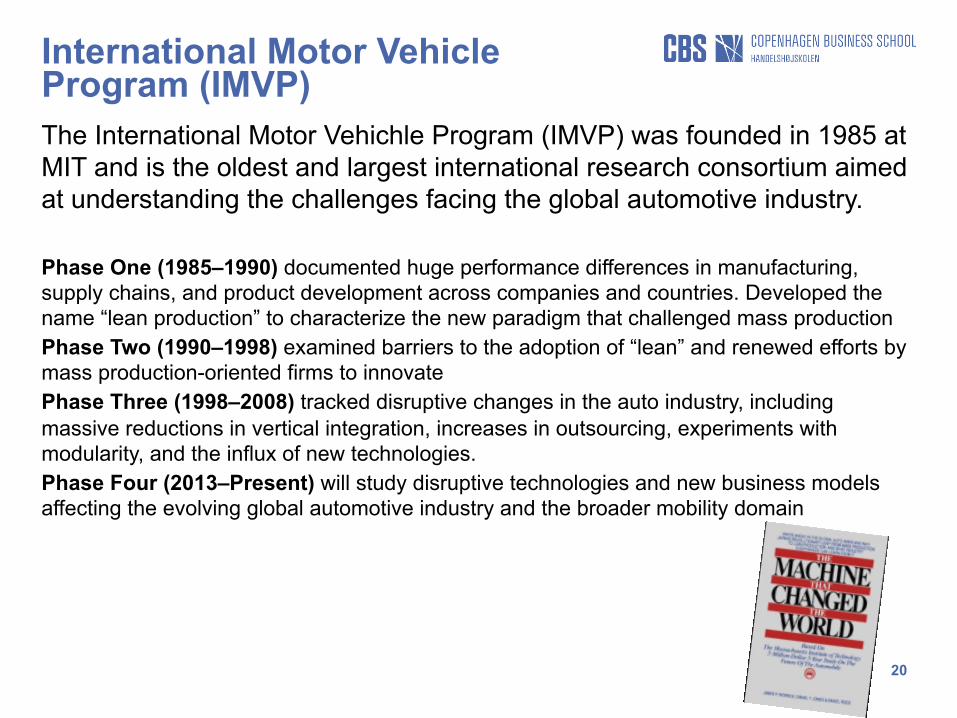
International Motor Vehicle Program (IMVP) The International Motor Vehichle Program (IMVP) was founded in 1985 at MIT and is the oldest and largest international research consortium aimed at understanding the challenges facing the global automotive industry. Phase One (1985–1990) documented huge performance differences in manufacturing, supply chains, and product development across companies and countries. Developed the name “lean production” to characterize the new paradigm that challenged mass production Phase Two (1990–1998) examined barriers to the adoption of “lean” and renewed efforts by mass production-oriented firms to innovate Phase Three (1998–2008) tracked disruptive changes in the auto industry, including massive reductions in vertical integration, increases in outsourcing, experiments with modularity, and the influx of new technologies. Phase Four (2013–Present) will study disruptive technologies and new business models affecting the evolving global automotive industry and the broader mobility domain
21
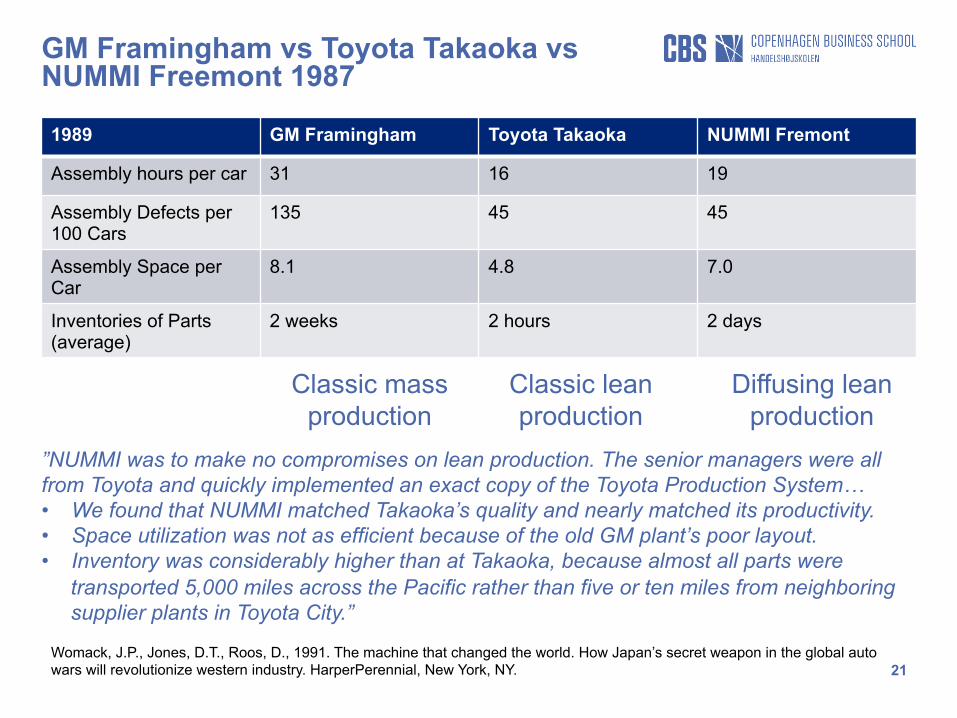
GM Framingham vs Toyota Takaoka vs NUMMI Freemont 1987
1989 GM Framingham Toyota Takaoka NUMMI Fremont
Assembly hours per car 31 16 19
Assembly Defects per 100 Cars
135 45 45
Assembly Space per Car
8.1 4.8 7.0
Inventories of Parts (average)
2 weeks 2 hours 2 days
Womack, J.P., Jones, D.T., Roos, D., 1991. The machine that changed the world. How Japan’s secret weapon in the global auto wars will revolutionize western industry. HarperPerennial, New York, NY.
Classic mass production
Diffusing lean production
Classic lean production
”NUMMI was to make no compromises on lean production. The senior managers were all from Toyota and quickly implemented an exact copy of the Toyota Production System… • We found that NUMMI matched Takaoka’s quality and nearly matched its productivity. • Space utilization was not as efficient because of the old GM plant’s poor layout. • Inventory was considerably higher than at Takaoka, because almost all parts were
transported 5,000 miles across the Pacific rather than five or ten miles from neighboring supplier plants in Toyota City.”
22
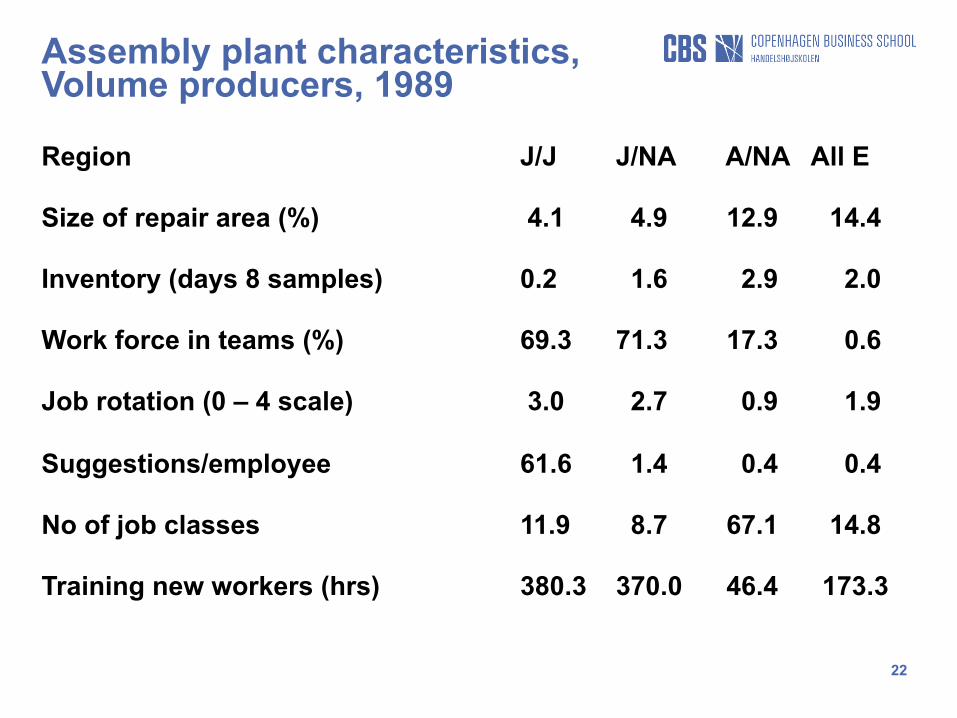
Assembly plant characteristics, Volume producers, 1989
Region J/J J/NA A/NA All E
Size of repair area (%) 4.1 4.9 12.9 14.4
Inventory (days 8 samples) 0.2 1.6 2.9 2.0
Work force in teams (%) 69.3 71.3 17.3 0.6
Job rotation (0 – 4 scale) 3.0 2.7 0.9 1.9
Suggestions/employee 61.6 1.4 0.4 0.4
No of job classes 11.9 8.7 67.1 14.8
Training new workers (hrs) 380.3 370.0 46.4 173.3
23
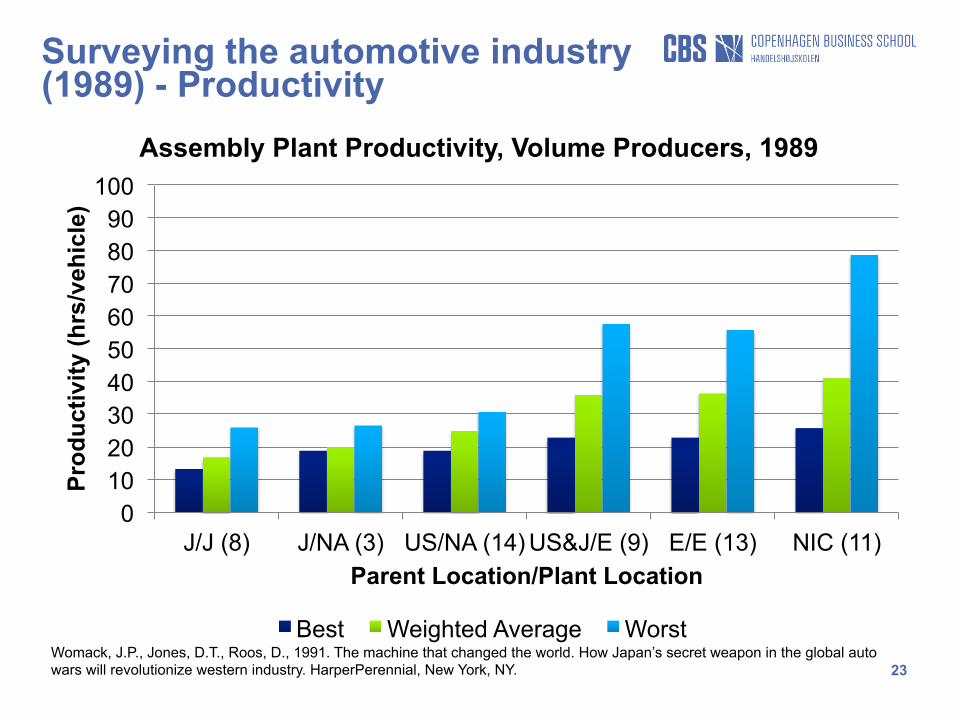
Surveying the automotive industry (1989) - Productivity
0 10 20 30 40 50 60 70 80 90
100
J/J (8) J/NA (3) US/NA (14) US&J/E (9) E/E (13) NIC (11)
Prod
uctiv
ity (h
rs/v
ehic
le)
Parent Location/Plant Location
Assembly Plant Productivity, Volume Producers, 1989
Best Weighted Average Worst Womack, J.P., Jones, D.T., Roos, D., 1991. The machine that changed the world. How Japan’s secret weapon in the global auto wars will revolutionize western industry. HarperPerennial, New York, NY.
24
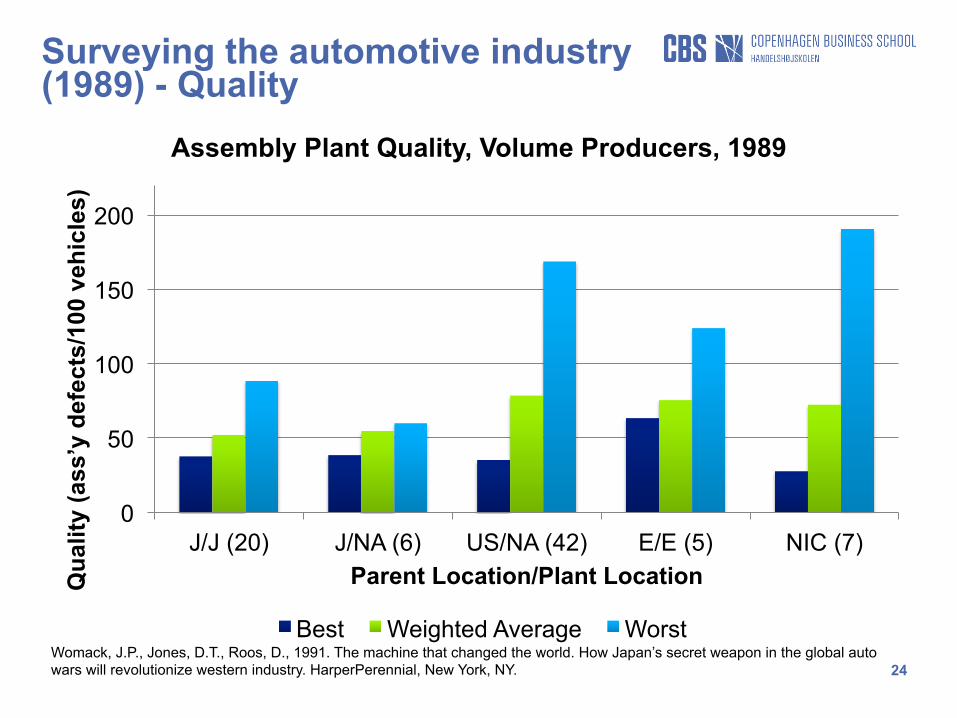
Surveying the automotive industry (1989) - Quality
0
50
100
150
200
J/J (20) J/NA (6) US/NA (42) E/E (5) NIC (7)
Qua
lity
(ass
’y d
efec
ts/1
00 v
ehic
les)
Parent Location/Plant Location
Assembly Plant Quality, Volume Producers, 1989
Best Weighted Average Worst Womack, J.P., Jones, D.T., Roos, D., 1991. The machine that changed the world. How Japan’s secret weapon in the global auto wars will revolutionize western industry. HarperPerennial, New York, NY.
25
Findings from the world survey
These findings require a dramatic reordering of our mental map of the industrial world, which we believe many readers will find very difficult: We must stop equating ”Japanese” with ”Lean” production and ”Western” with ”mass” production. In fact, some plants in Japan are not particularly lean, and a number of Japanese-owned plants in North America are now demonstrating that lean production can be practiced far away from Japan. At the same time, the best American-owned plants in North America show that lean production can be implemented fully by Western companies, and the best plants in the developing countries show that lean production can be introduced anywhere in the world.
26
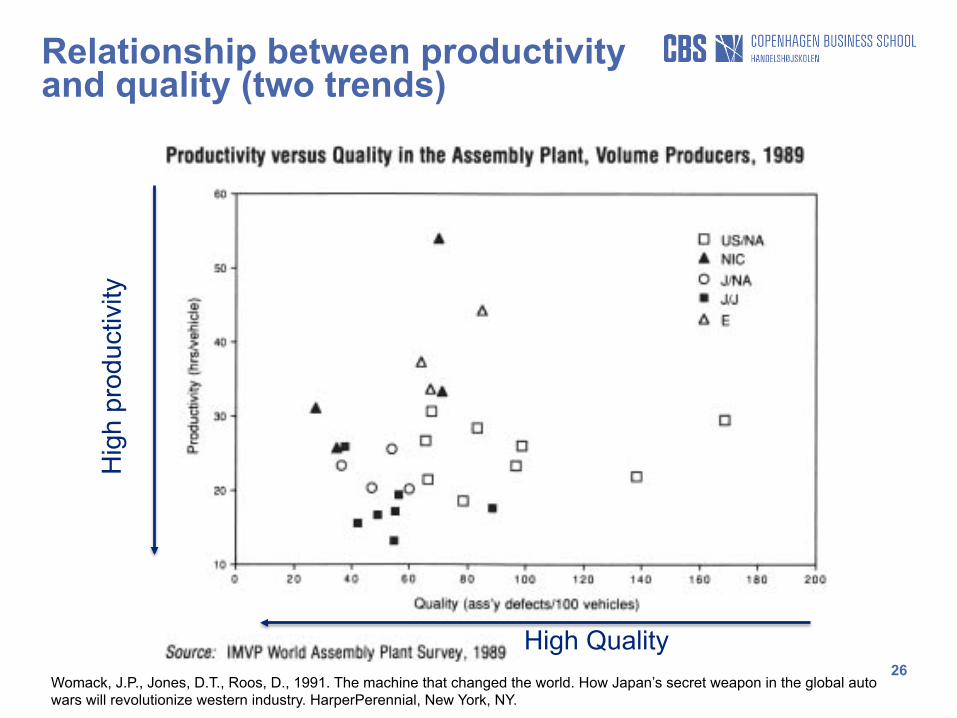
Relationship between productivity and quality (two trends)
Expected ”Trade-off” relationship
Quality is ”free” Relationship
High Quality
Hig
h pr
oduc
tivity
Womack, J.P., Jones, D.T., Roos, D., 1991. The machine that changed the world. How Japan’s secret weapon in the global auto wars will revolutionize western industry. HarperPerennial, New York, NY.
27
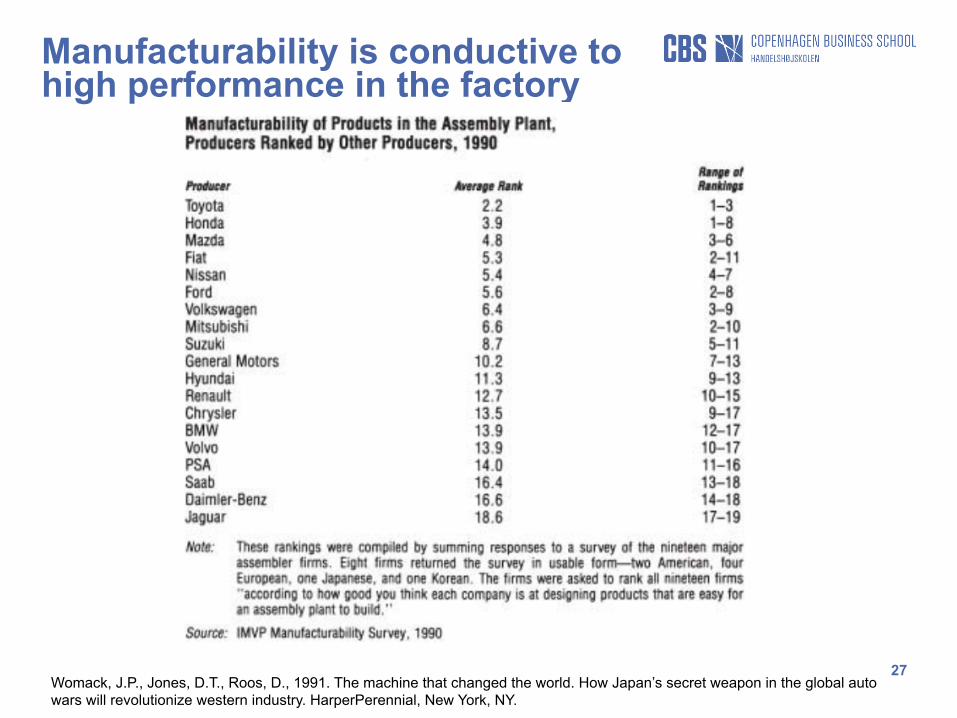
Manufacturability is conductive to high performance in the factory
Womack, J.P., Jones, D.T., Roos, D., 1991. The machine that changed the world. How Japan’s secret weapon in the global auto wars will revolutionize western industry. HarperPerennial, New York, NY.
28
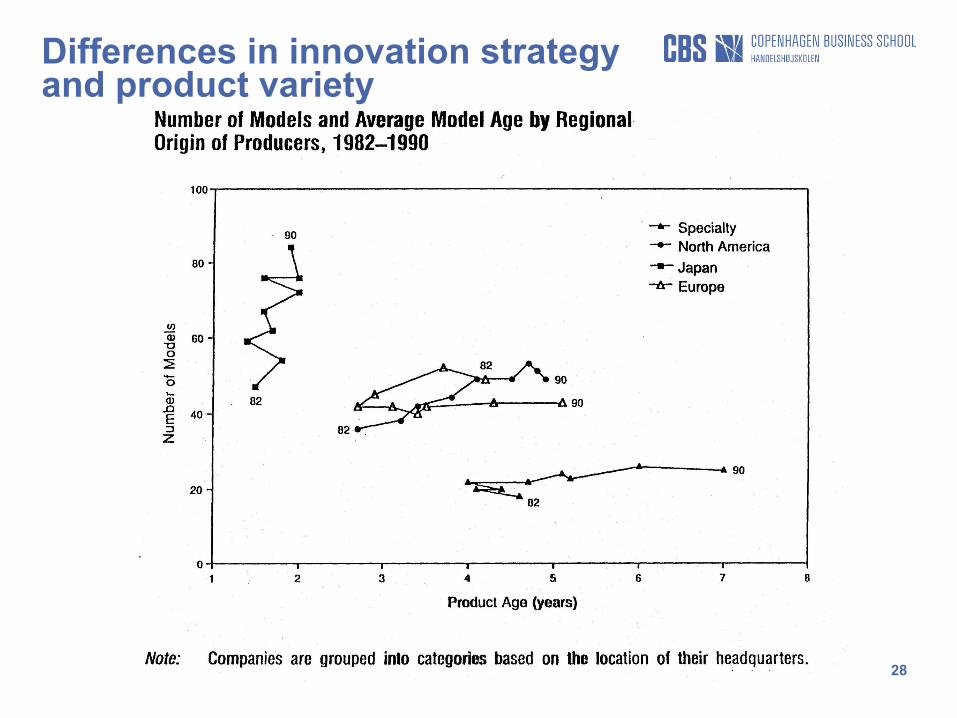
Differences in innovation strategy and product variety
29
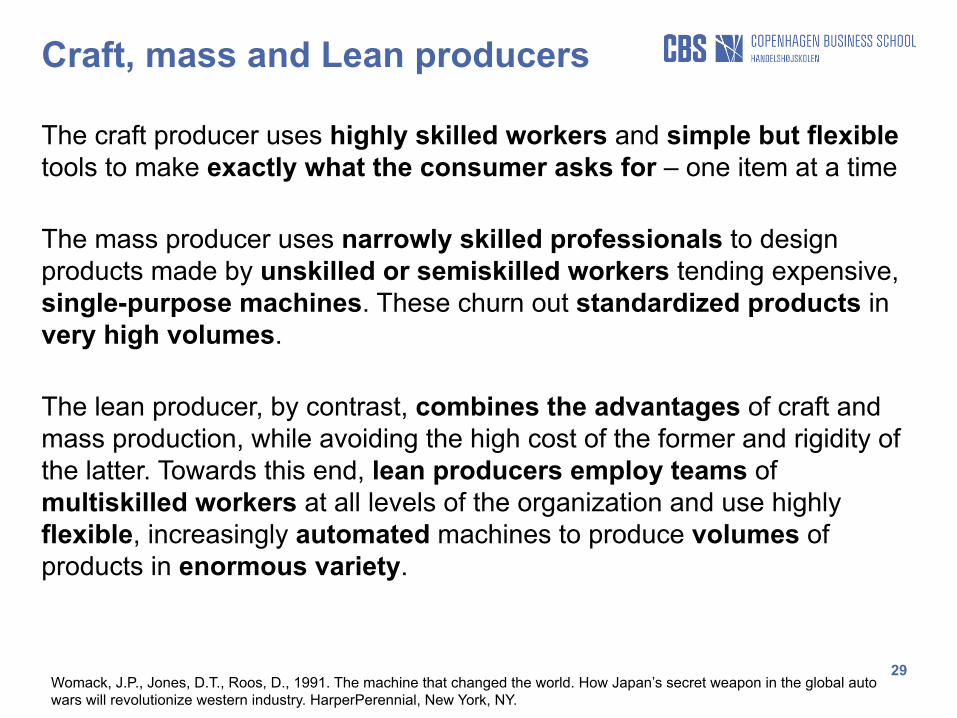
Craft, mass and Lean producers
The craft producer uses highly skilled workers and simple but flexible tools to make exactly what the consumer asks for – one item at a time The mass producer uses narrowly skilled professionals to design products made by unskilled or semiskilled workers tending expensive, single-purpose machines. These churn out standardized products in very high volumes. The lean producer, by contrast, combines the advantages of craft and mass production, while avoiding the high cost of the former and rigidity of the latter. Towards this end, lean producers employ teams of multiskilled workers at all levels of the organization and use highly flexible, increasingly automated machines to produce volumes of products in enormous variety.
Womack, J.P., Jones, D.T., Roos, D., 1991. The machine that changed the world. How Japan’s secret weapon in the global auto wars will revolutionize western industry. HarperPerennial, New York, NY.
30
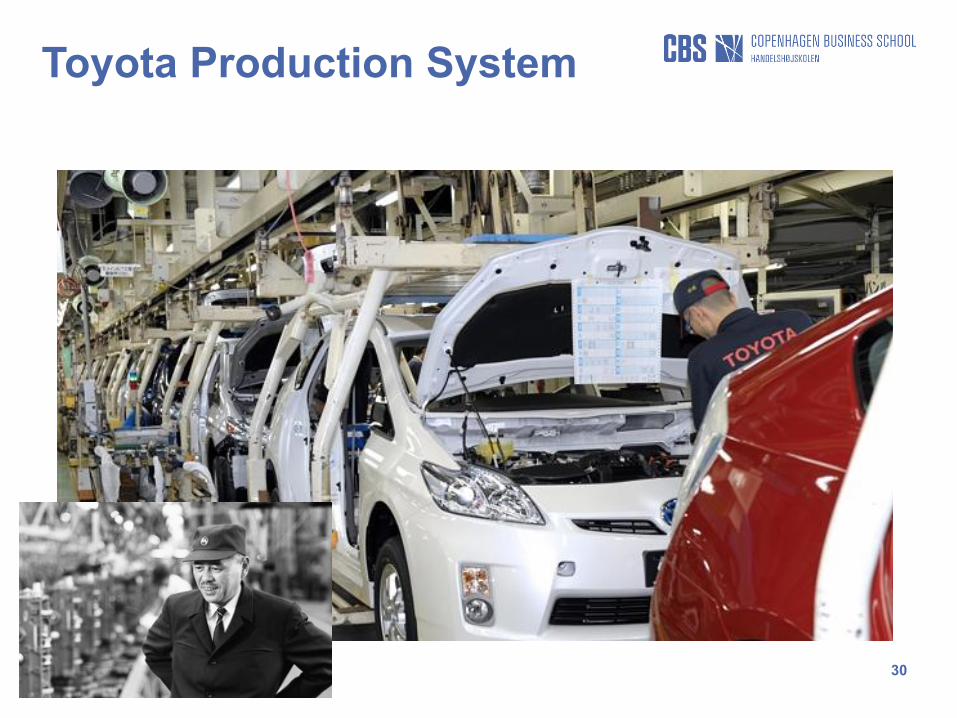
Toyota Production System
31
Toyota Production System
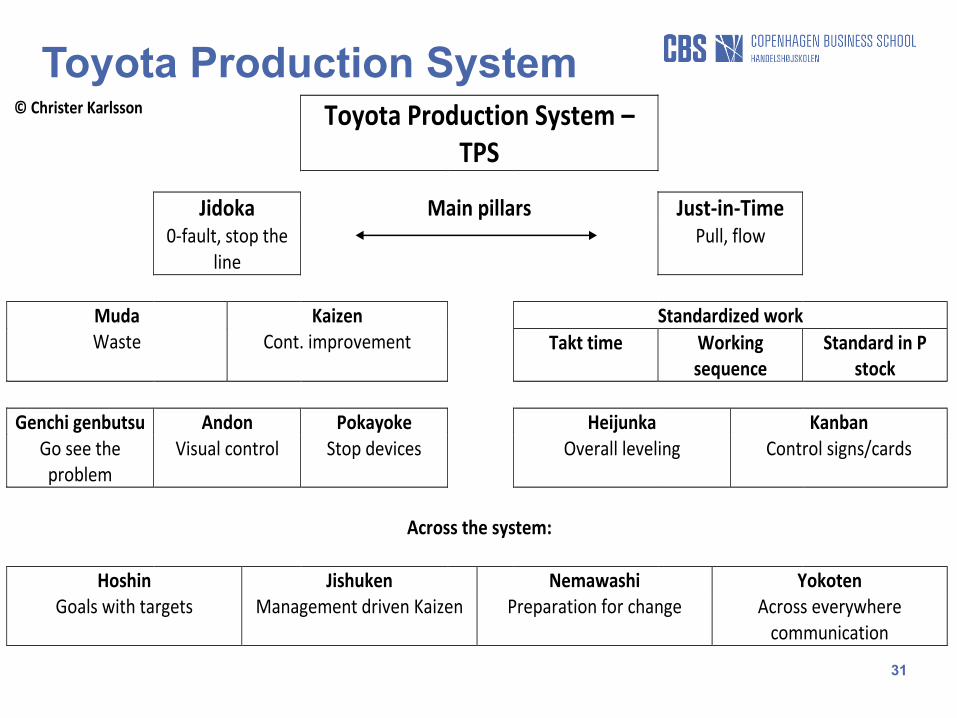
© Christer Karlsson Toyota Production System – TPS
Jidoka Main pillars Just-‐in-‐Time 0-‐fault, stop the
line Pull, flow
Muda Waste
Kaizen Cont. improvement
Standardized work Takt time Working
sequence Standard in P
stock Genchi genbutsu
Go see the problem
Andon Visual control
Pokayoke Stop devices
Heijunka Overall leveling
Kanban Control signs/cards
Across the system:
Hoshin Jishuken Nemawashi Yokoten
Goals with targets
Management driven Kaizen Preparation for change Across everywhere communication
32
TPS and Henry Fords system Toyota adapted the large-scale, highly efficient, constant-flow production philosophy of the Ford Rouge complex to its small-scale facilities in an interesting way. Unable to achieve either the vast levels of vertical integration or the standardized product volume Ford managed at this single complex, Toyota nevertheless paid homage to the concept of continous flow by byilding a local network of adaptable suppliers and integrating them with assembly plants. But instead of building a standardized product like Ford’s Model T, Toyota achieved the capability of flexibly producing a wide variety of products using continous-flow principles, something Henry Ford would never have attempted.
Womack, J.P., Jones, D.T., Roos, D., 1991. The machine that changed the world. How Japan’s secret weapon in the global auto wars will revolutionize western industry. HarperPerennial, New York, NY.
33
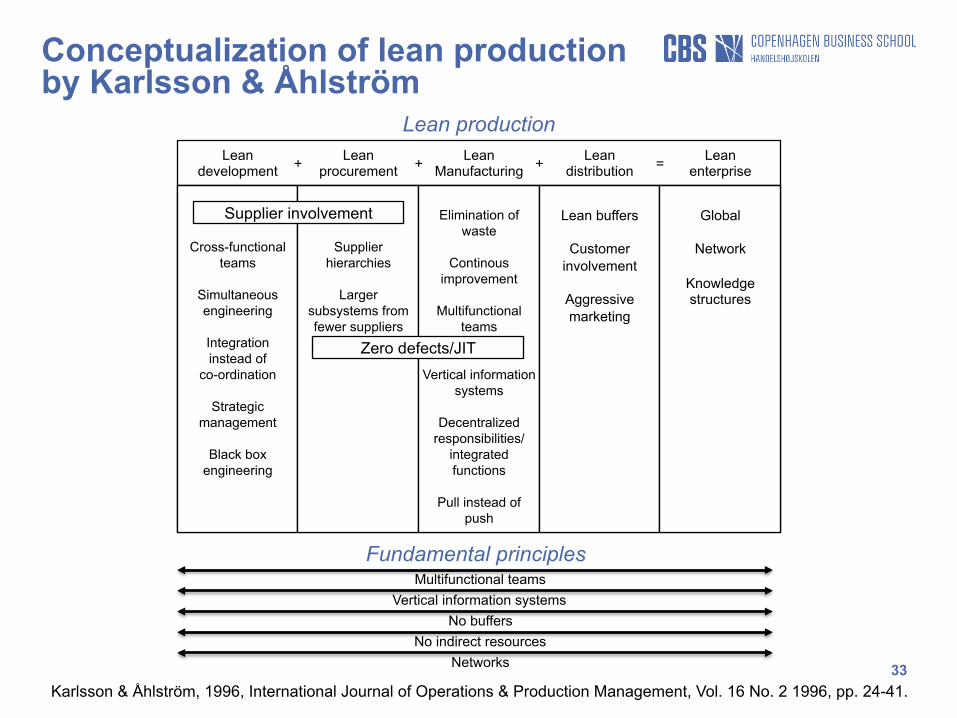
Conceptualization of lean production by Karlsson & Åhlström
Cross-functional teams
Simultaneous engineering
Integration instead of
co-ordination
Strategic management
Black box
engineering
Supplier hierarchies
Larger
subsystems from fewer suppliers
Elimination of
waste
Continous improvement
Multifunctional
teams
Vertical information systems
Decentralized
responsibilities/ integrated functions
Pull instead of
push
Lean buffers
Customer
involvement
Aggressive marketing
Global
Network
Knowledge structures
Fundamental principles Multifunctional teams
Vertical information systems No buffers
No indirect resources Networks
Lean development
Lean procurement
Lean Manufacturing
Lean distribution
Lean enterprise = + + +
Supplier involvement
Zero defects/JIT
Lean production
Karlsson & Åhlström, 1996, International Journal of Operations & Production Management, Vol. 16 No. 2 1996, pp. 24-41.
34
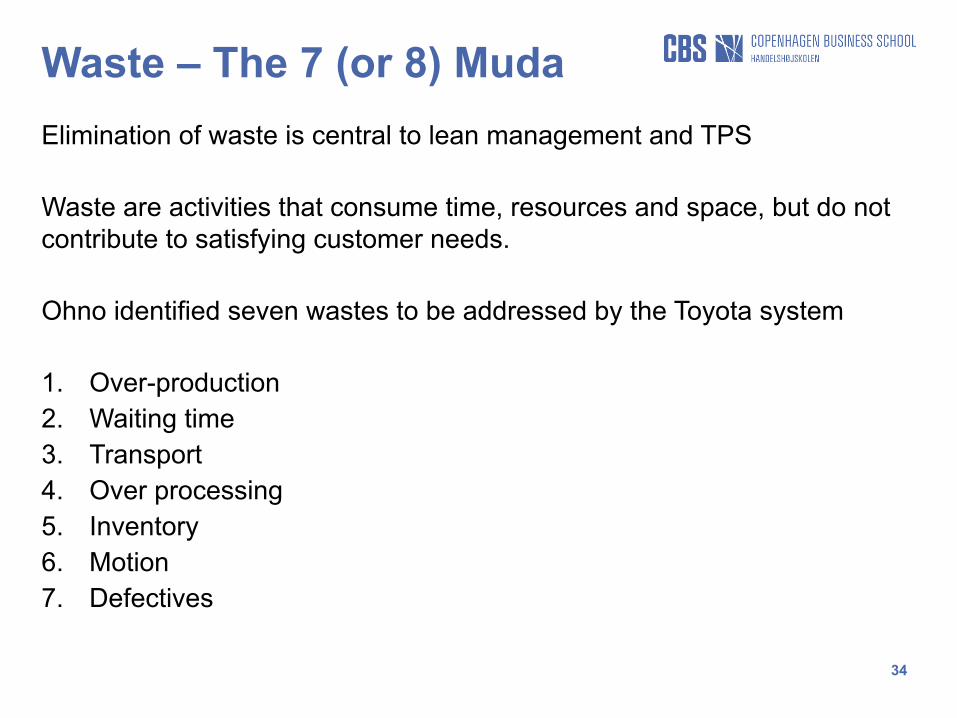
Waste – The 7 (or 8) Muda Elimination of waste is central to lean management and TPS Waste are activities that consume time, resources and space, but do not contribute to satisfying customer needs. Ohno identified seven wastes to be addressed by the Toyota system 1. Over-production 2. Waiting time 3. Transport 4. Over processing 5. Inventory 6. Motion 7. Defectives
35
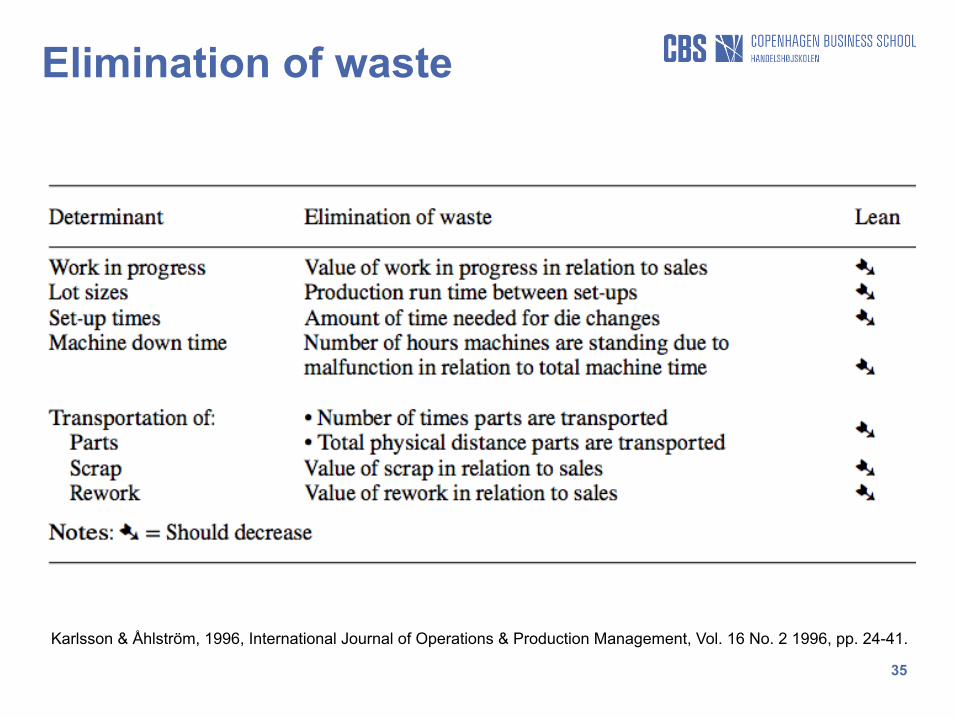
Elimination of waste
Karlsson & Åhlström, 1996, International Journal of Operations & Production Management, Vol. 16 No. 2 1996, pp. 24-41.
36
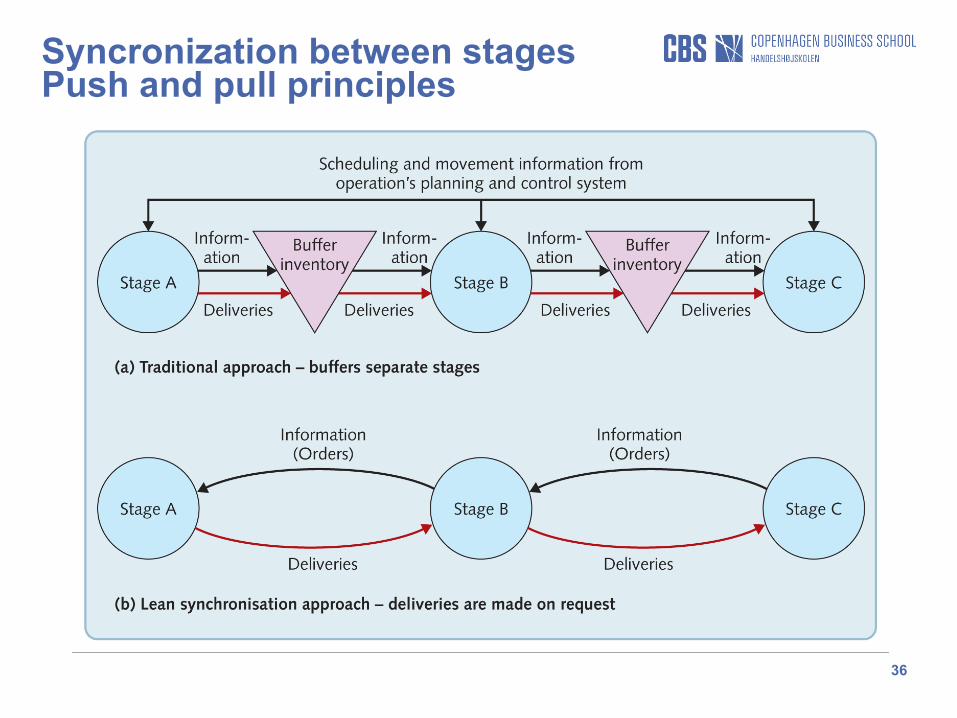
Syncronization between stages Push and pull principles
37
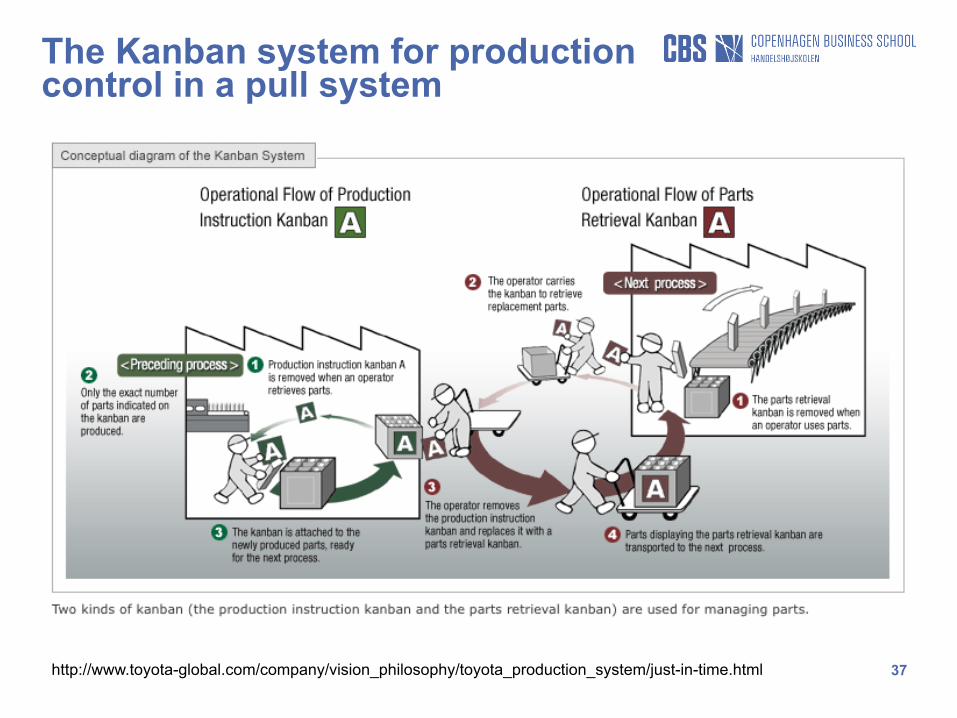
The Kanban system for production control in a pull system
http://www.toyota-global.com/company/vision_philosophy/toyota_production_system/just-in-time.html
38
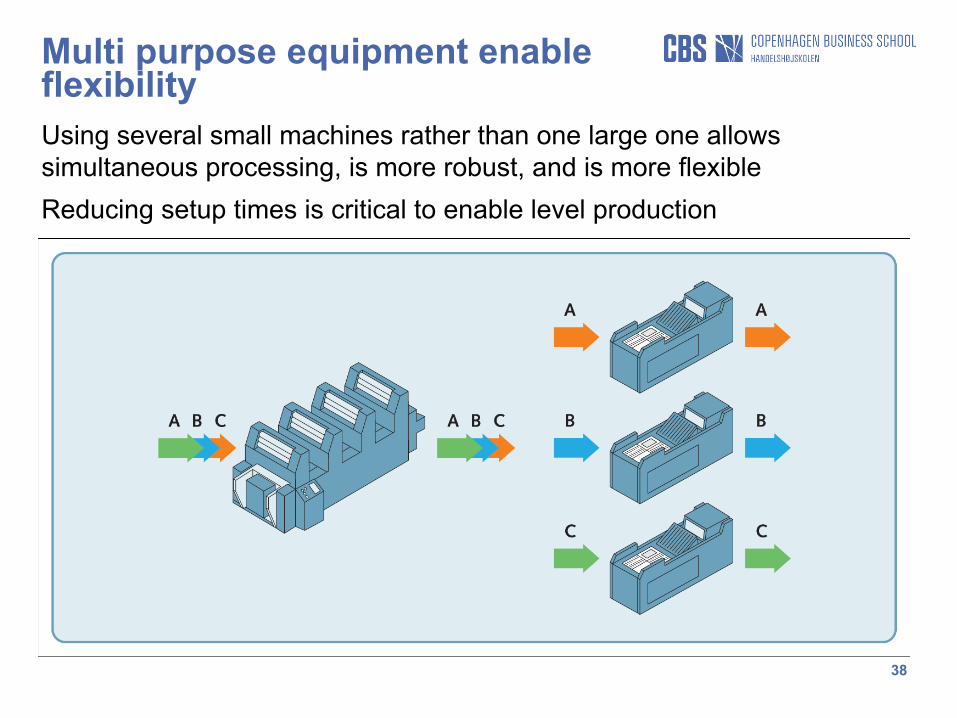
Multi purpose equipment enable flexibility Using several small machines rather than one large one allows simultaneous processing, is more robust, and is more flexible Reducing setup times is critical to enable level production
39
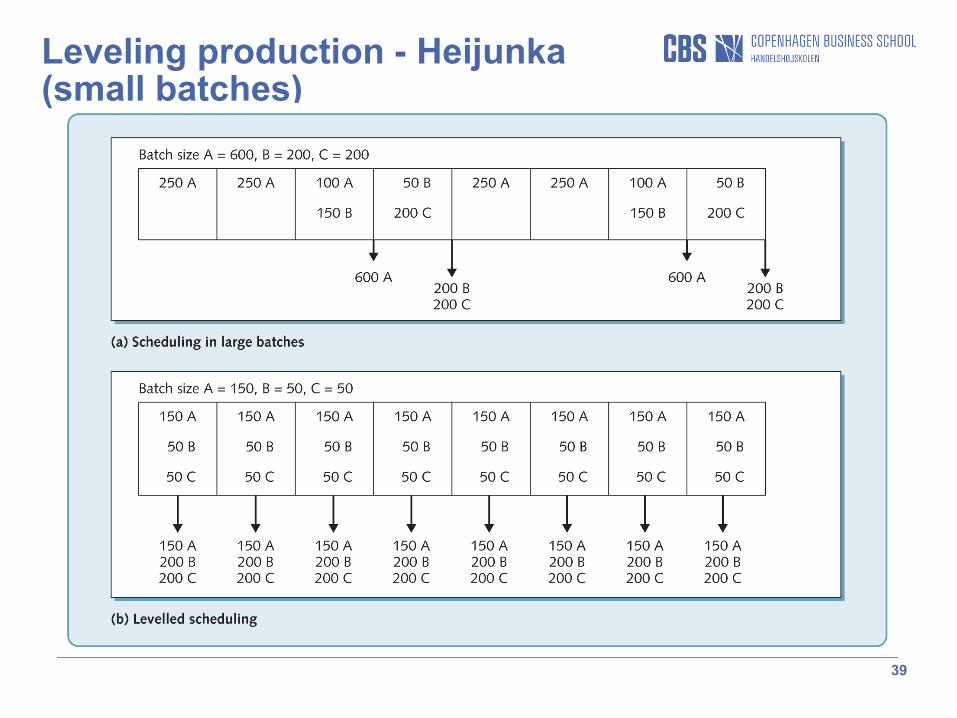
Leveling production - Heijunka (small batches)
40
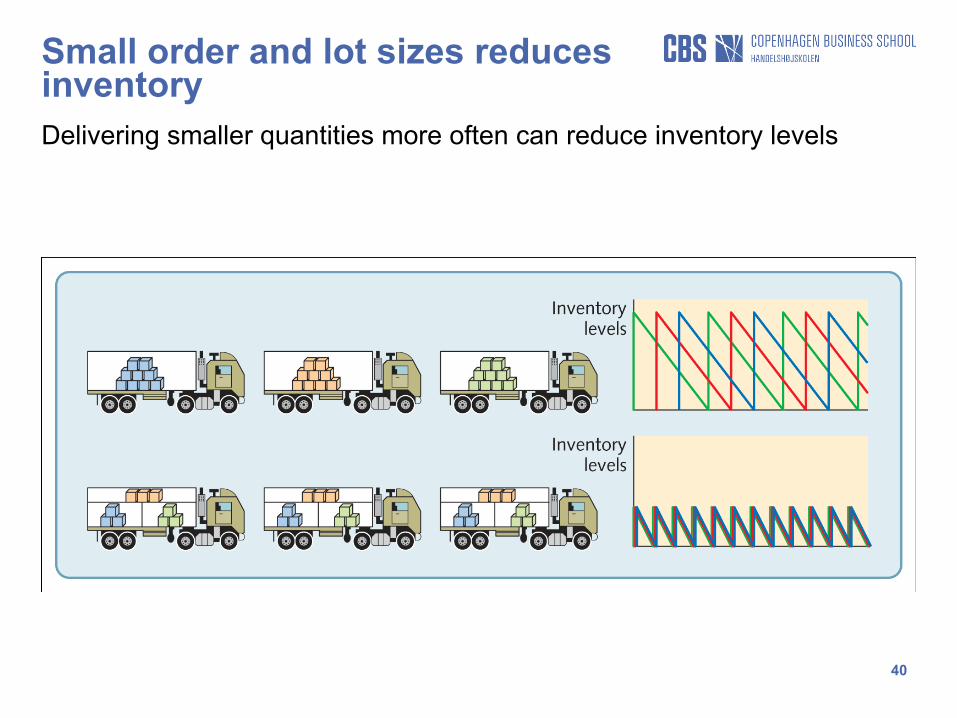
Small order and lot sizes reduces inventory Delivering smaller quantities more often can reduce inventory levels
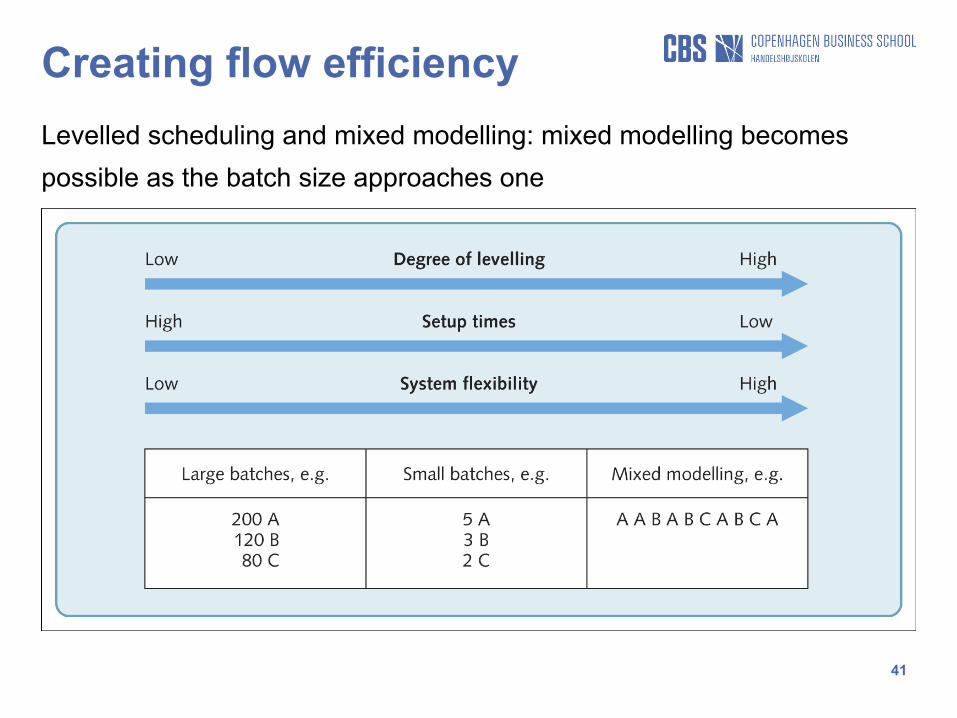
41
Creating flow efficiency Levelled scheduling and mixed modelling: mixed modelling becomes possible as the batch size approaches one
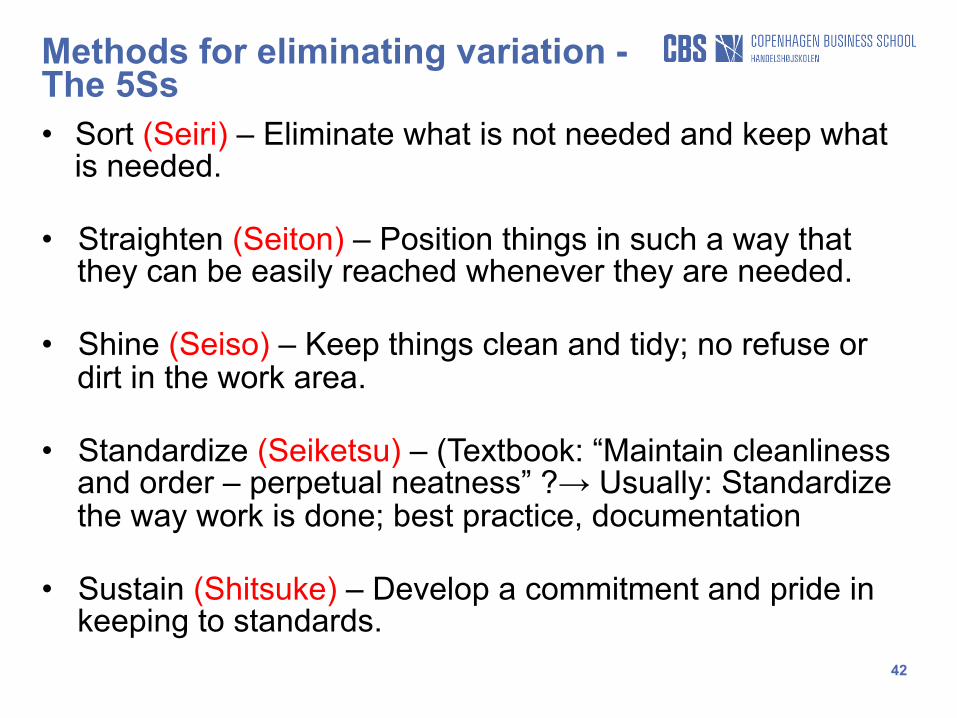
42
Methods for eliminating variation - The 5Ss • Sort (Seiri) – Eliminate what is not needed and keep what
is needed.
• Straighten (Seiton) – Position things in such a way that they can be easily reached whenever they are needed.
• Shine (Seiso) – Keep things clean and tidy; no refuse or dirt in the work area.
• Standardize (Seiketsu) – (Textbook: “Maintain cleanliness and order – perpetual neatness” ?→ Usually: Standardize the way work is done; best practice, documentation
• Sustain (Shitsuke) – Develop a commitment and pride in keeping to standards.
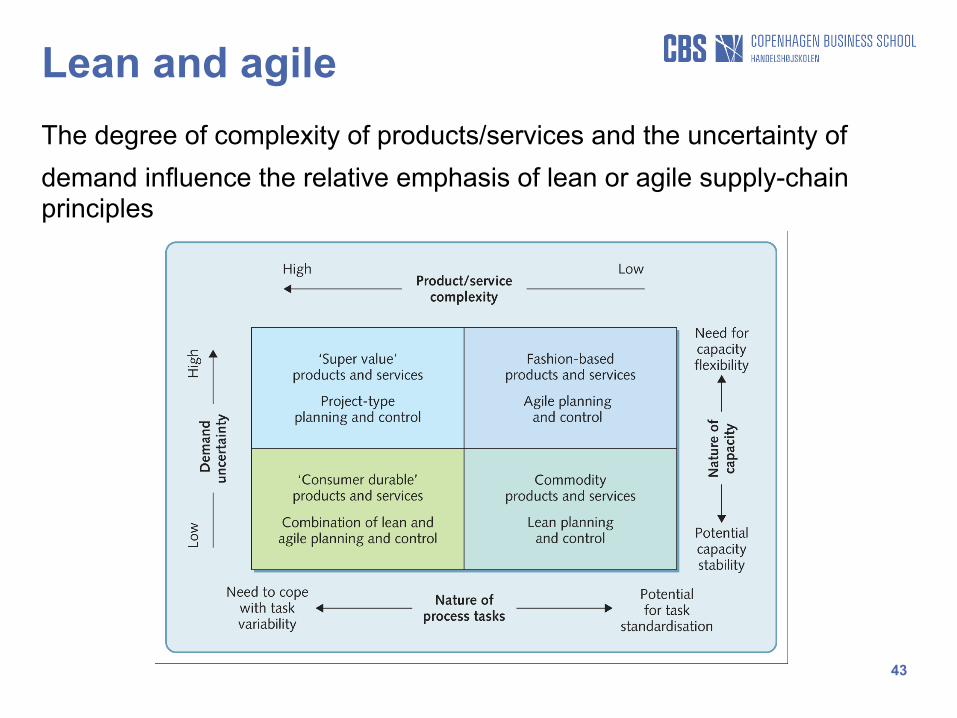
43
Lean and agile The degree of complexity of products/services and the uncertainty of demand influence the relative emphasis of lean or agile supply-chain principles
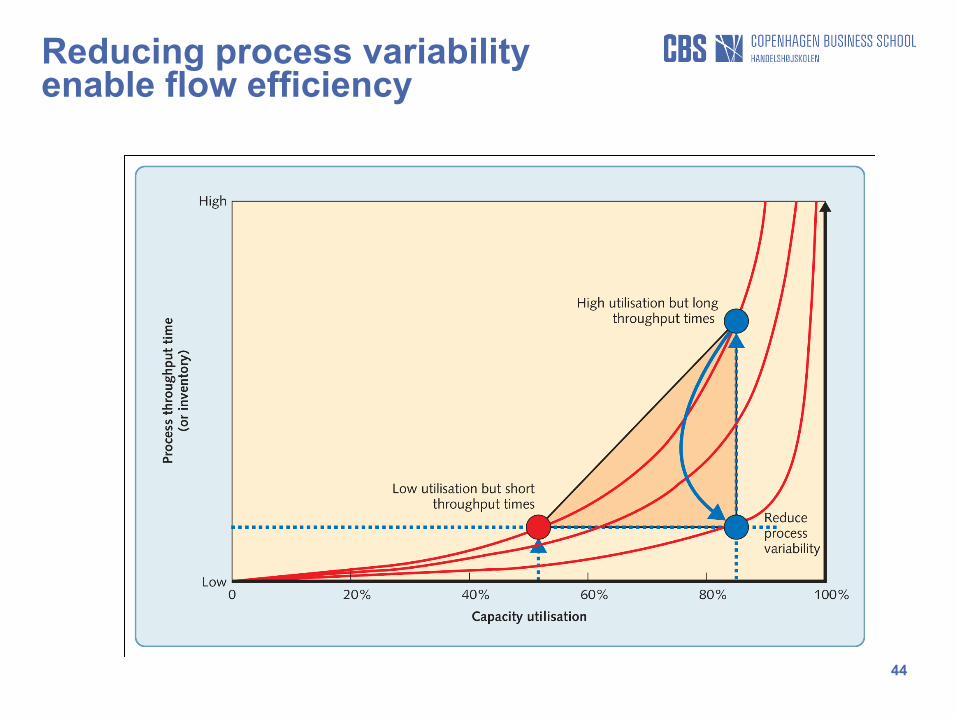
44
Reducing process variability enable flow efficiency
45
Implementing lean production
“The important point to note, however, is that lean should be seen as a direction, rather than as a state to be reached after a certain time. Therefore, the focus lies on the changes in the determinants, not on their actual values. It should also be noted that all the determinants might not point in the right direction all the time. There could be instances where they can send mixed signals. However, keeping this in mind, the model is a helpful tool for companies to check that they are not deceiving themselves.” Karlsson & Åhlström, 1996, p. 41
46
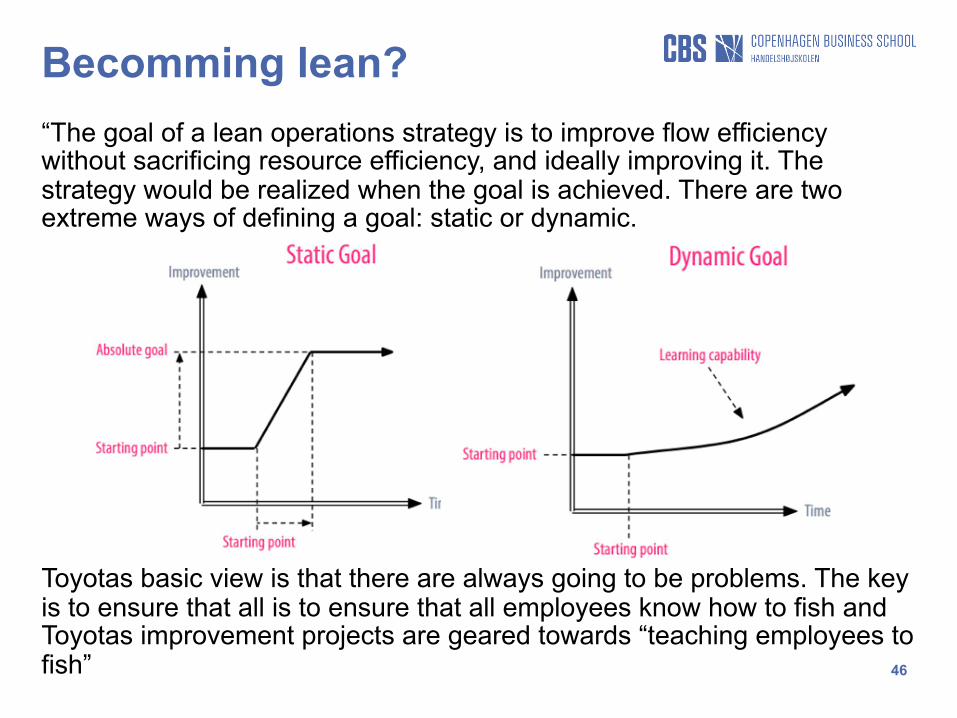
Becomming lean? “The goal of a lean operations strategy is to improve flow efficiency without sacrificing resource efficiency, and ideally improving it. The strategy would be realized when the goal is achieved. There are two extreme ways of defining a goal: static or dynamic. Toyotas basic view is that there are always going to be problems. The key is to ensure that all is to ensure that all employees know how to fish and Toyotas improvement projects are geared towards “teaching employees to fish”

Backup slides
48
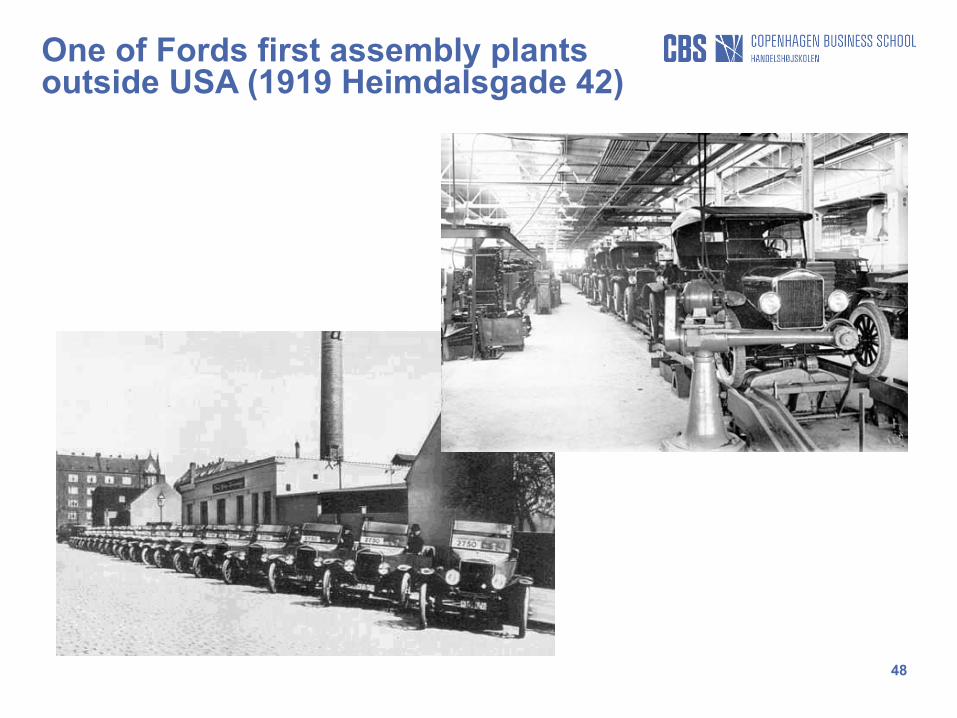
One of Fords first assembly plants outside USA (1919 Heimdalsgade 42)
49
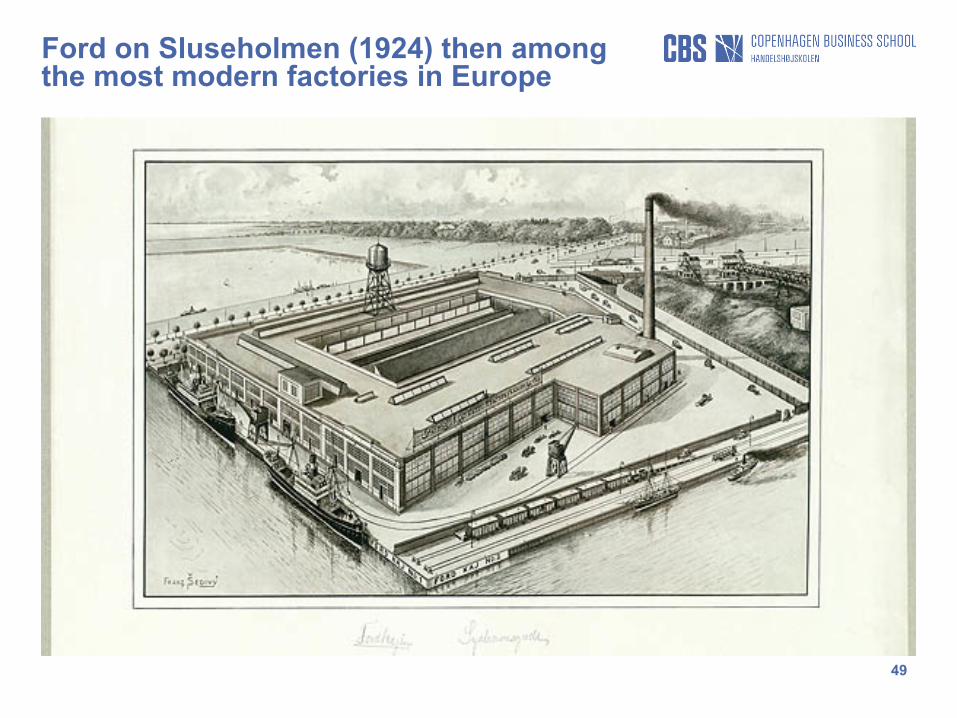
Ford on Sluseholmen (1924) then among the most modern factories in Europe