Embed Size (px)
Citation preview
5.12.17
1
Lean Six SigmaGreen Belt TrainingModule 2 - MeasureDecember 2017
www.pwc.com
2Lean Six Sigma • Green BeltPwC
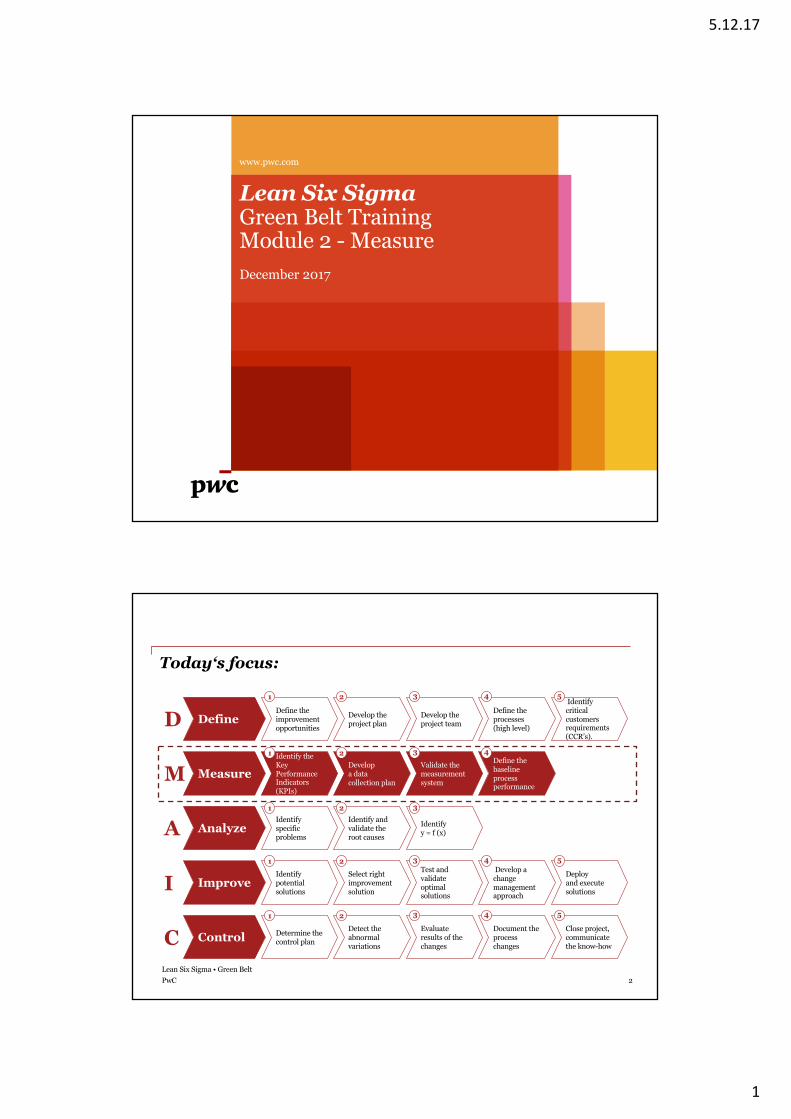
Today‘s focus:
DefineD
Measure
Analyze
Improve
Control
M
A
I
C
Define the improvement opportunities
Identify the Key Performance Indicators (KPIs)
Identify specific problems
Identify potential solutions
Determine the control plan
Develop the project plan
Develop a data collection plan
Identify and validate the root causes
Select right improvement solution
Detect the abnormal variations
Develop the project team
Validate the measurement system
Identify y = f (x)
Test and validate optimal solutions
Evaluate results of the changes
Define the processes (high level)
Define the baseline process performance
Develop a change management approach
Document the process changes
Identify critical customers requirements (CCR’s).
Deploy and execute solutions
Close project, communicate the know-how
1 2 3 4 5
1 2 3 4 5
1 2 3 4 5
1 2 3 4
1 2 3
5.12.17
2
3Lean Six Sigma • Green BeltPwCPwC
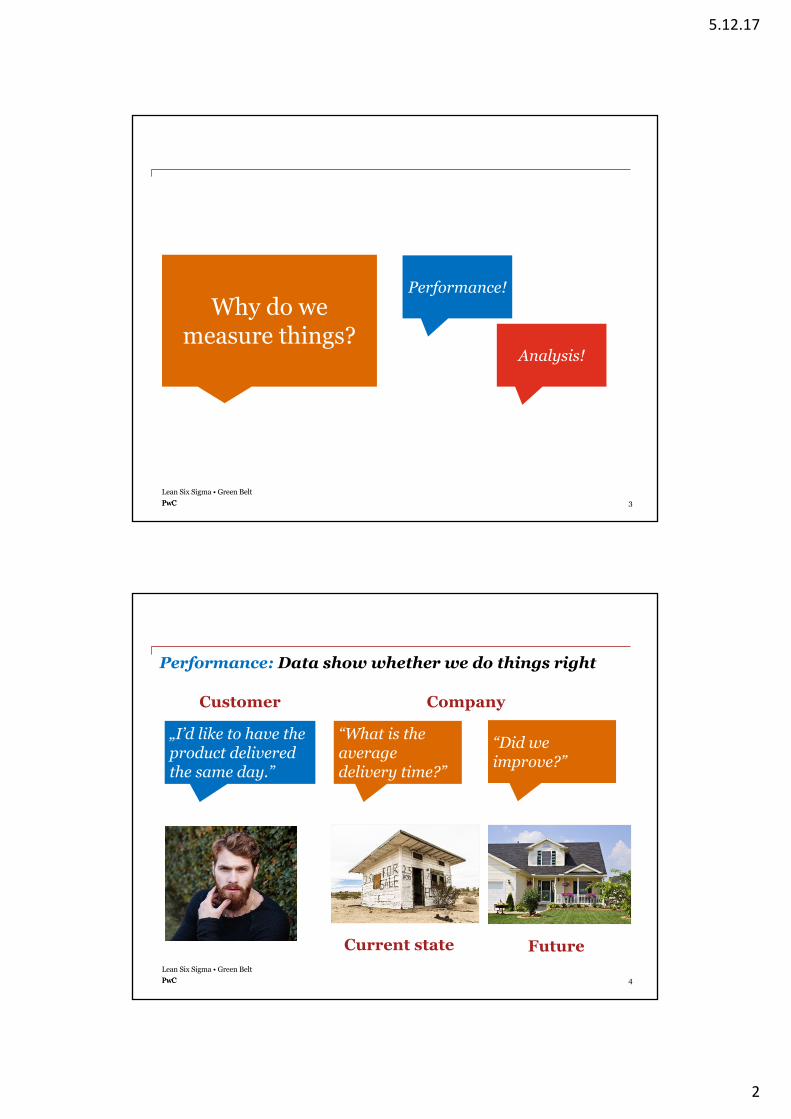
Why do wemeasure things?
Performance!
Analysis!
4Lean Six Sigma • Green BeltPwCPwC
Performance: Data show whether we do things right
„I’d like to have the product delivered the same day.”
Customer Company
“What is the average delivery time?”
“Did we improve?”
Current state Future
5.12.17
3
5Lean Six Sigma • Green BeltPwCPwC
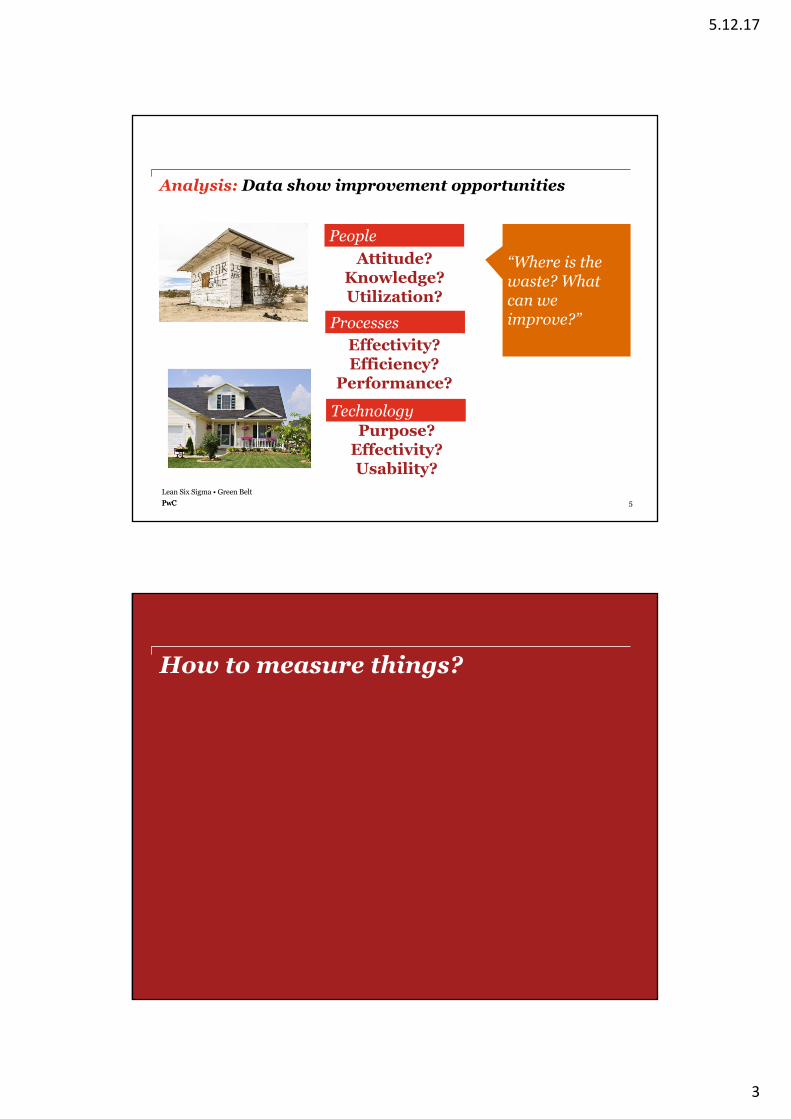
Analysis: Data show improvement opportunities
People
Processes
Technology
Attitude?Knowledge?Utilization?
Effectivity?Efficiency?Performance?
Purpose?Effectivity?Usability?
“Where is the waste? What can we improve?”
6Lean Six Sigma • Green BeltPwC
August 2013Lean Six Sigma • Black Belt Training Week 2PwC
How to measure things?
5.12.17
4
7Lean Six Sigma • Green BeltPwCPwC
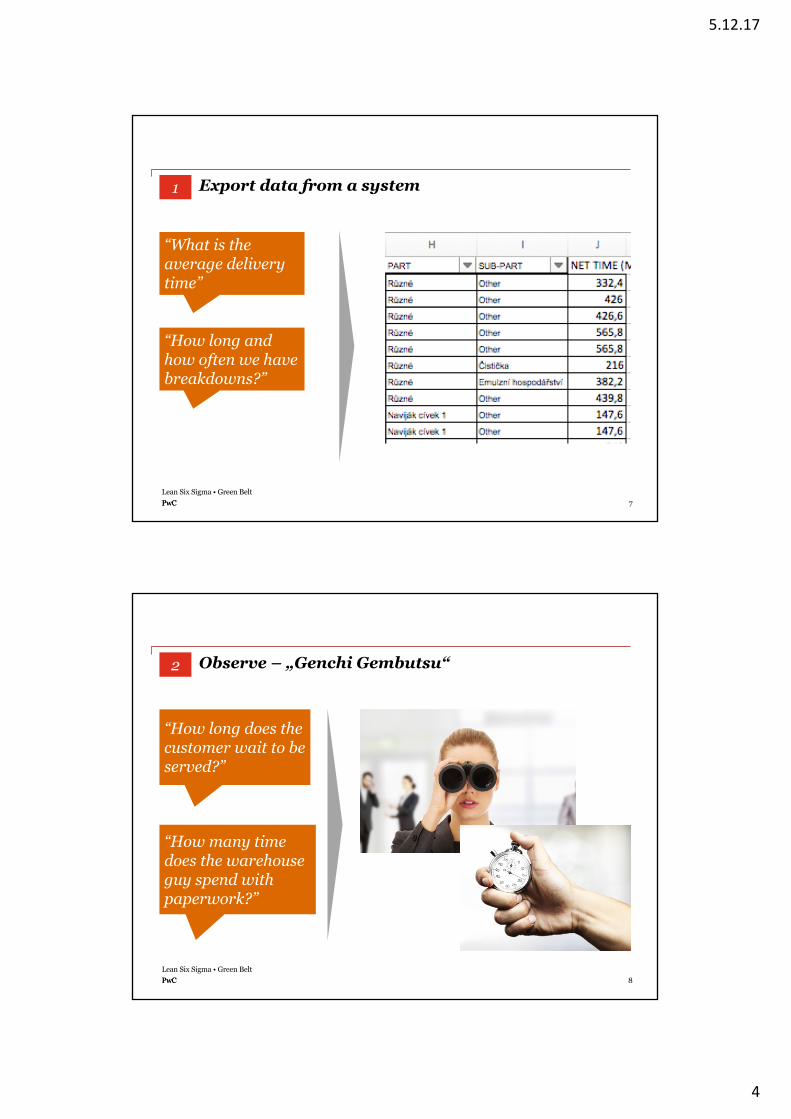
Export data from a system
“What is the average delivery time”
“How long and how often we have breakdowns?”
1
8Lean Six Sigma • Green BeltPwCPwC
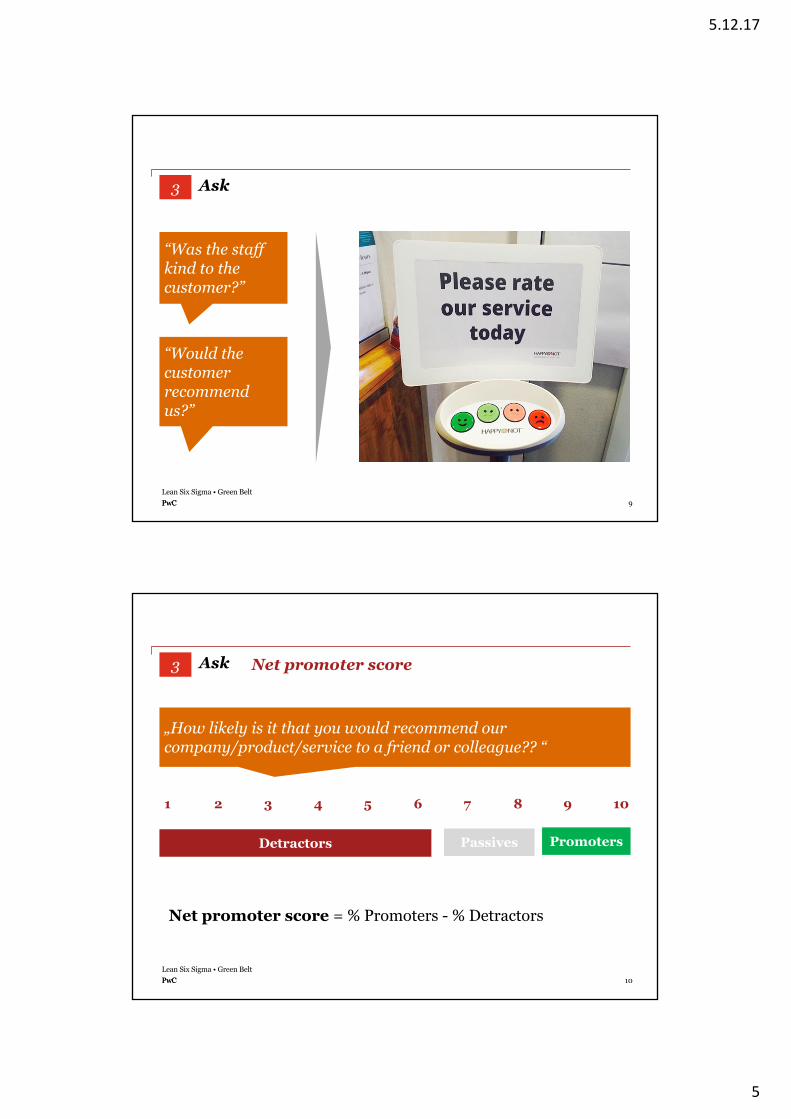
“How long does the customer wait to be served?”
“How many time does the warehouse guy spend with paperwork?”
Observe – „Genchi Gembutsu“2
5.12.17
5
9Lean Six Sigma • Green BeltPwCPwC
“Was the staff kind to the customer?”
“Would the customer recommend us?”
Ask3
10Lean Six Sigma • Green BeltPwCPwC
Net promoter score
„How likely is it that you would recommend ourcompany/product/service to a friend or colleague?? “
1 2 3 4 5 6 7 8 9 10
PromotersDetractors Passives
Net promoter score = % Promoters - % Detractors
Ask3
5.12.17
6
11Lean Six Sigma • Green BeltPwCPwC
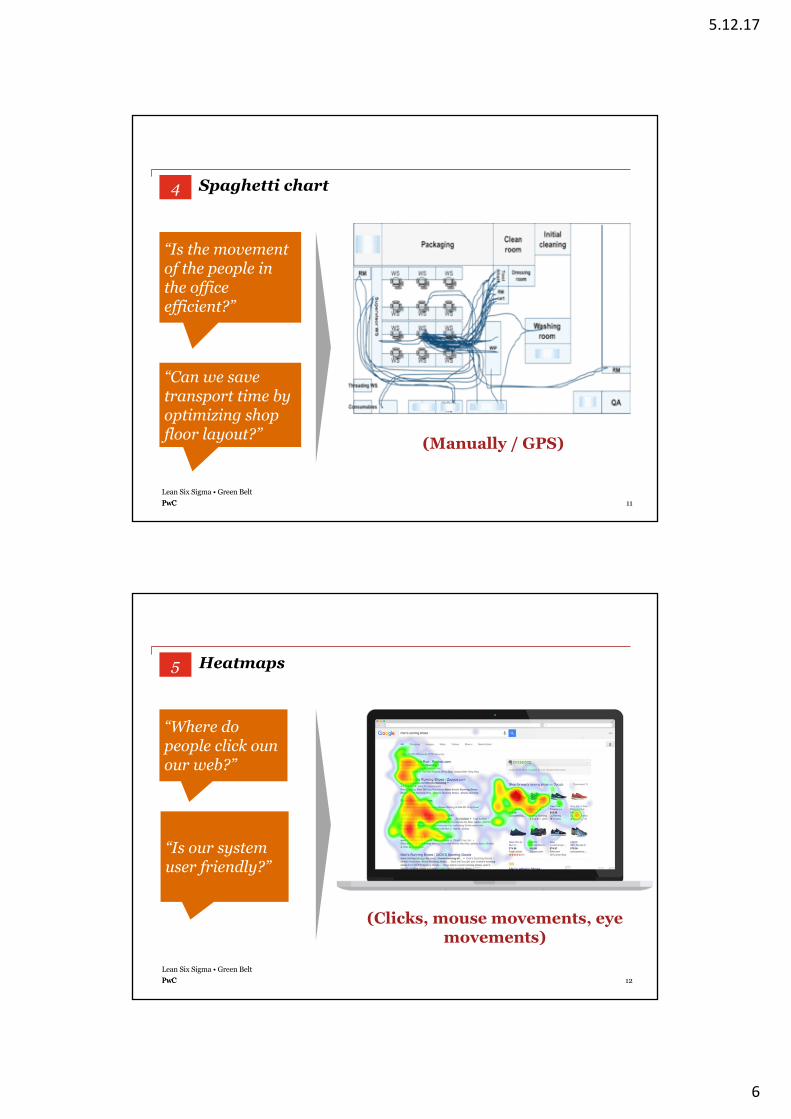
“Is the movement of the people in the office efficient?”
(Manually / GPS)
Spaghetti chart4
“Can we save transport time by optimizing shop floor layout?”
12Lean Six Sigma • Green BeltPwCPwC
“Where do people click ounour web?”
(Clicks, mouse movements, eyemovements)
“Is our system user friendly?”
Heatmaps5
5.12.17
7
13Lean Six Sigma • Green BeltPwC
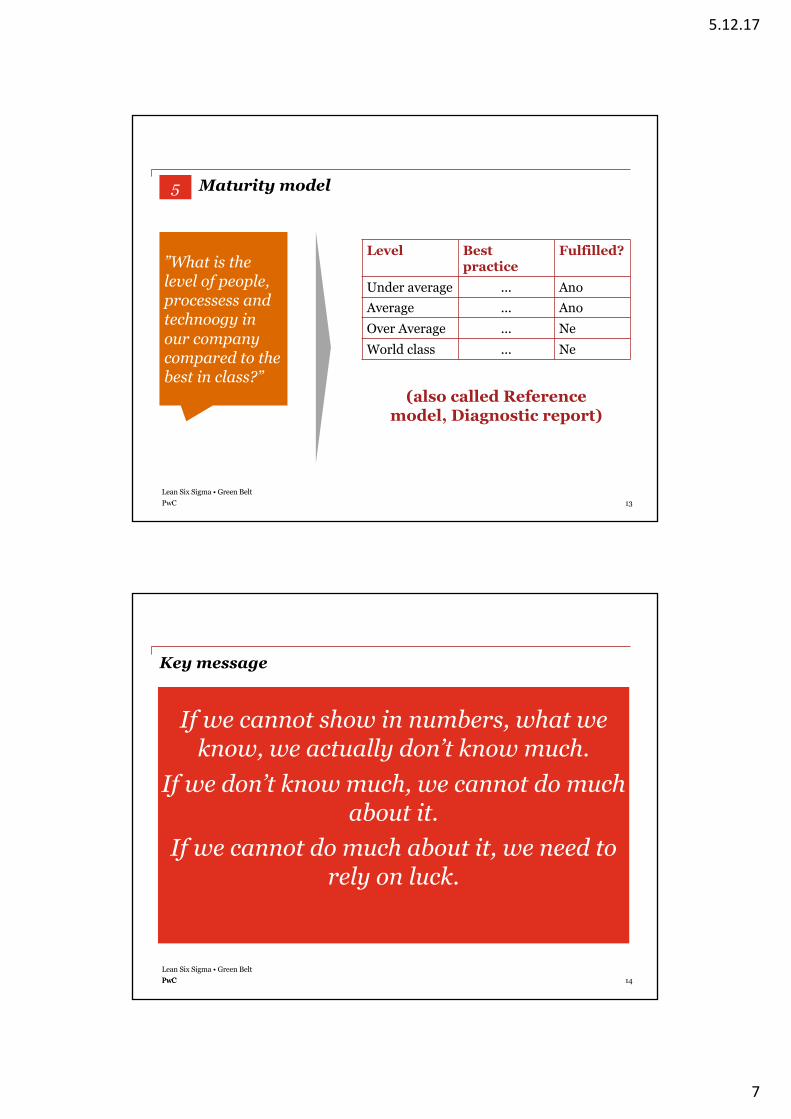
”What is the level of people, processess and technoogy in our company compared to the best in class?”
(also called Reference model, Diagnostic report)
Level Bestpractice
Fulfilled?
Under average ... AnoAverage ... AnoOver Average ... NeWorld class ... Ne
Maturity model5
14Lean Six Sigma • Green BeltPwCPwC
Key message
If we cannot show in numbers, what weknow, we actually don’t know much.
If we don’t know much, we cannot do much about it.
If we cannot do much about it, we need to rely on luck.
5.12.17
8
15Lean Six Sigma • Green BeltPwC
August 2013Lean Six Sigma • Black Belt Training Week 2PwC
How to create a KPI
1
16Lean Six Sigma • Green BeltPwCPwC
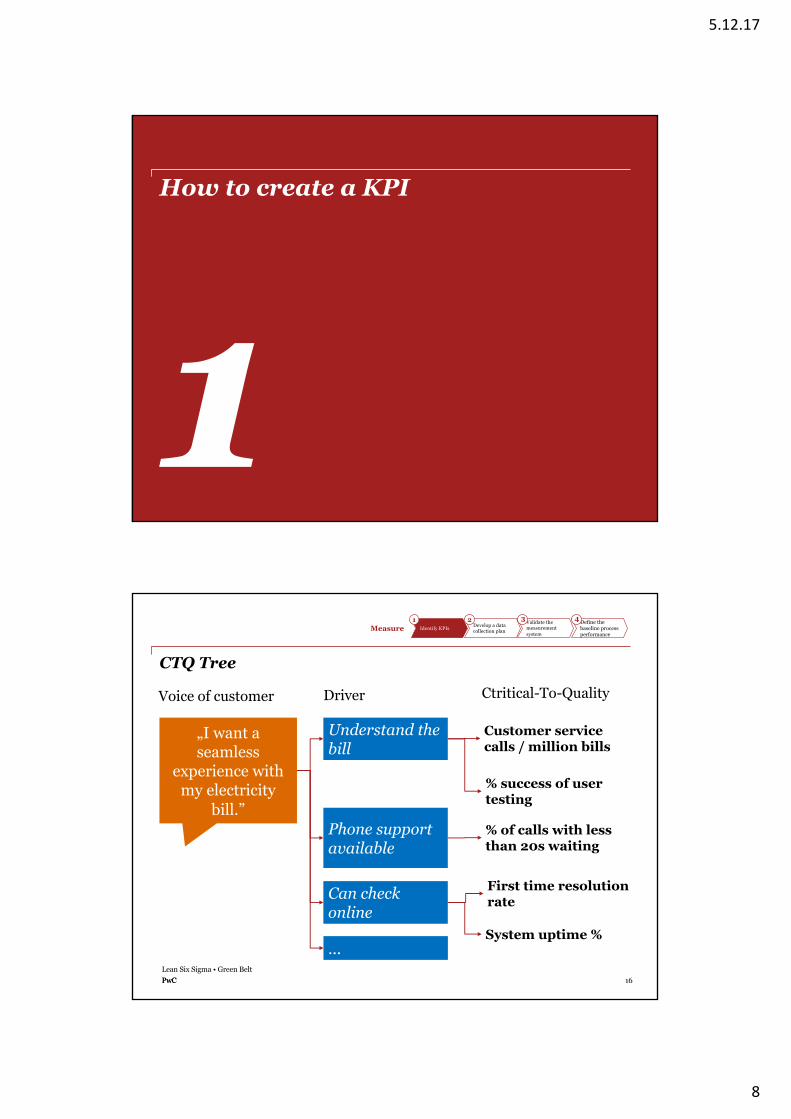
CTQ Tree
„I want a seamless
experience with my electricity
bill.”
Understand the bill
Phone support available
Can check online
...
Customer servicecalls / million bills
% success of user testing
% of calls with lessthan 20s waiting
First time resolutionrate
System uptime %
Voice of customer Driver Ctritical-To-Quality
Identify KPIs Develop a data collection plan
Validate themeasurementsystem
Define the baseline process performance
1 2 3 4Measure
5.12.17
9
17Lean Six Sigma • Green BeltPwCPwC
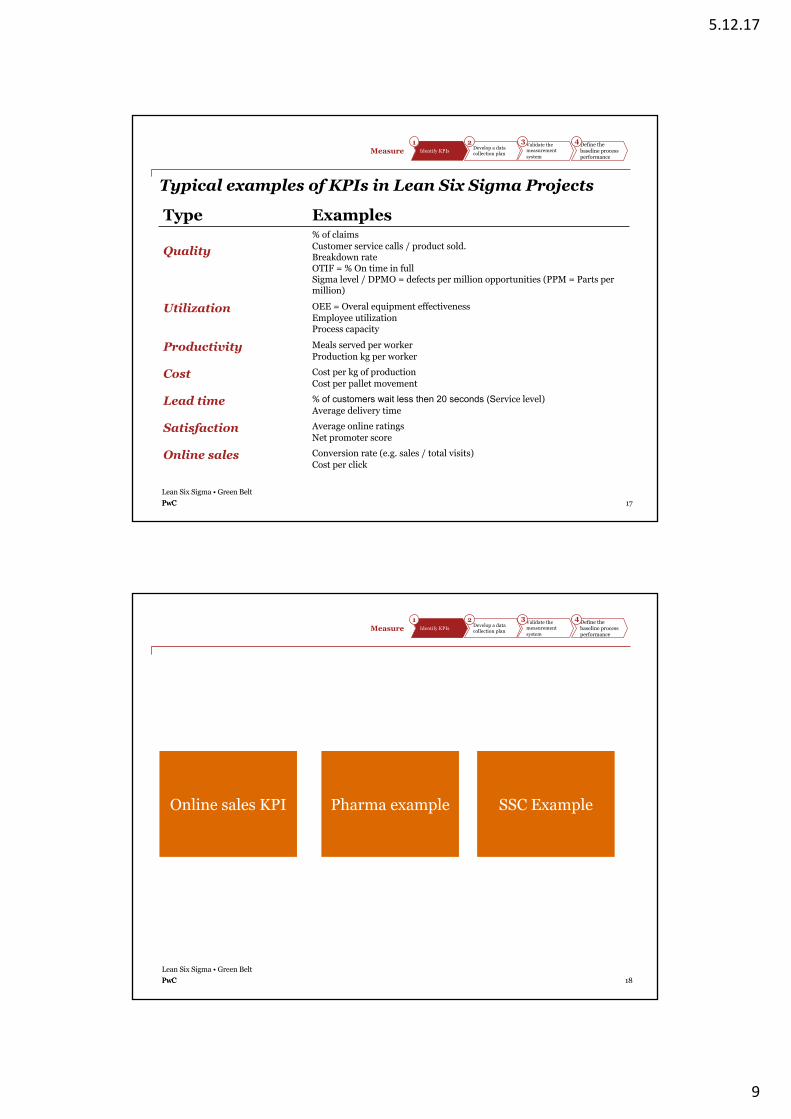
Typical examples of KPIs in Lean Six Sigma Projects
Type Examples
Quality% of claimsCustomer service calls / product sold.Breakdown rateOTIF = % On time in full Sigma level / DPMO = defects per million opportunities (PPM = Parts per million)
Utilization OEE = Overal equipment effectivenessEmployee utilizationProcess capacity
Productivity Meals served per workerProduction kg per worker
Cost Cost per kg of productionCost per pallet movement
Lead time % of customers wait less then 20 seconds (Service level)Average delivery time
Satisfaction Average online ratingsNet promoter score
Online sales Conversion rate (e.g. sales / total visits)Cost per click
Identify KPIs Develop a data collection plan
Validate themeasurementsystem
Define the baseline process performance
1 2 3 4Measure
18Lean Six Sigma • Green BeltPwCPwC
Identify KPIs Develop a data collection plan
Validate themeasurementsystem
Define the baseline process performance
1 2 3 4Measure
Online sales KPI Pharma example SSC Example
5.12.17
10
19Lean Six Sigma • Green BeltPwCPwC
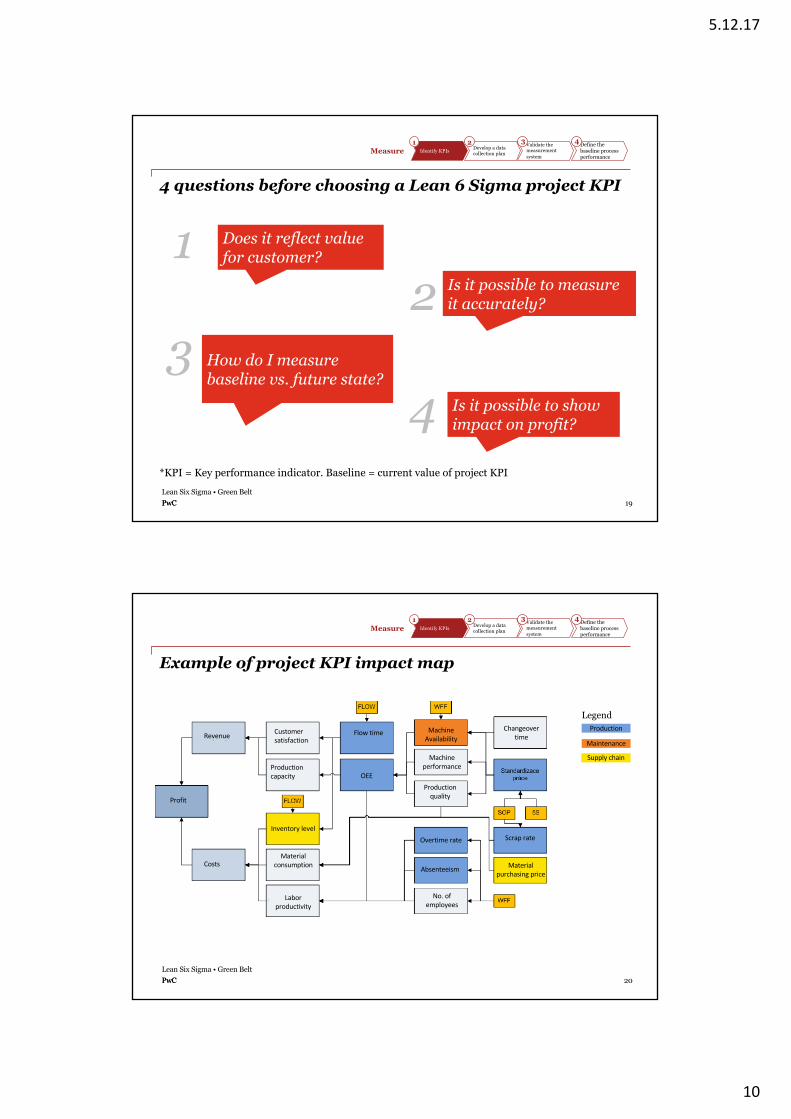
4 questions before choosing a Lean 6 Sigma project KPI
Identify KPIs Develop a data collection plan
Validate themeasurementsystem
Define the baseline process performance
1 2 3 4Measure
Does it reflect value for customer?
Is it possible to measure it accurately?
How do I measure baseline vs. future state?
Is it possible to show impact on profit?
12
34
*KPI = Key performance indicator. Baseline = current value of project KPI
20Lean Six Sigma • Green BeltPwCPwC
Example of project KPI impact map
Identify KPIs Develop a data collection plan
Validate themeasurementsystem
Define the baseline process performance
1 2 3 4Measure
Profit
Revenue
Costs
Customersatisfaction
Productioncapacity
Flowtime
OEE
MachineAvailability
Machineperformance
Productionquality
Changeovertime
Production
ScraprateOvertimerate
Absenteeism
No.ofemployees
Laborproductivity
Materialconsumption Material
purchasingprice
Inventorylevel
Maintenance
Supplychain
Legend
5.12.17
11
21Lean Six Sigma • Green BeltPwCPwC
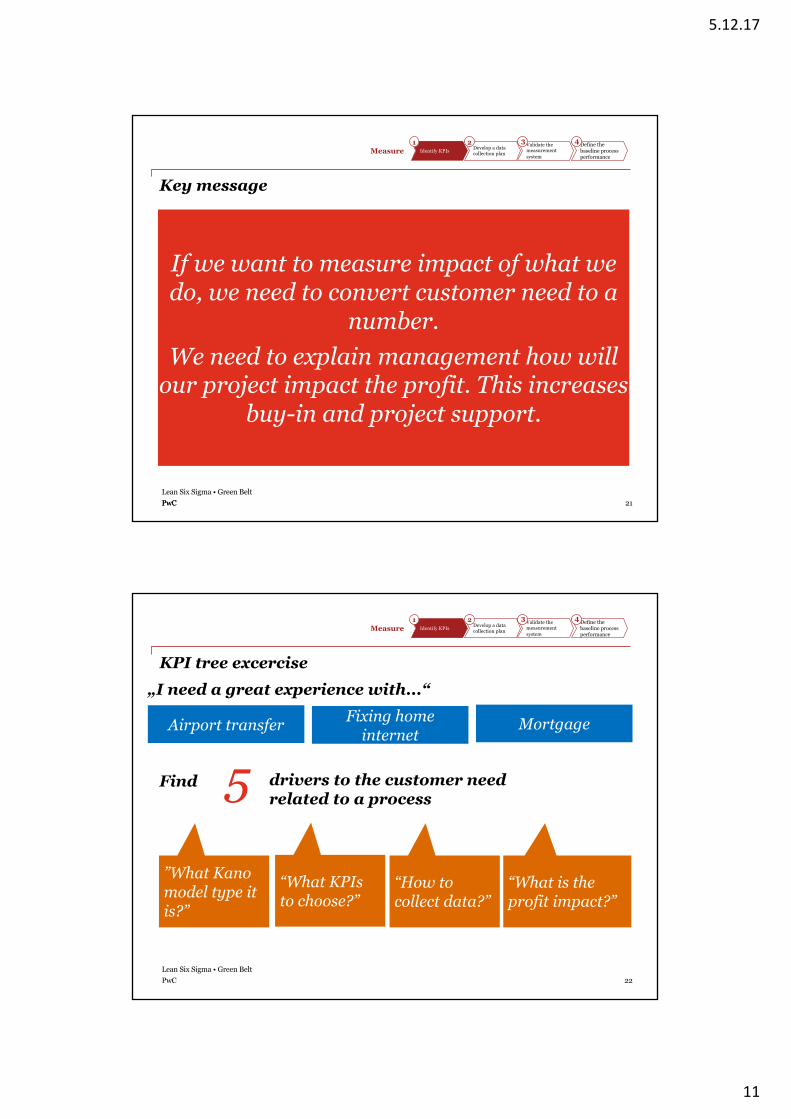
Key message
If we want to measure impact of what wedo, we need to convert customer need to a
number. We need to explain management how will
our project impact the profit. This increasesbuy-in and project support.
Identify KPIs Develop a data collection plan
Validate themeasurementsystem
Define the baseline process performance
1 2 3 4Measure
22Lean Six Sigma • Green BeltPwC
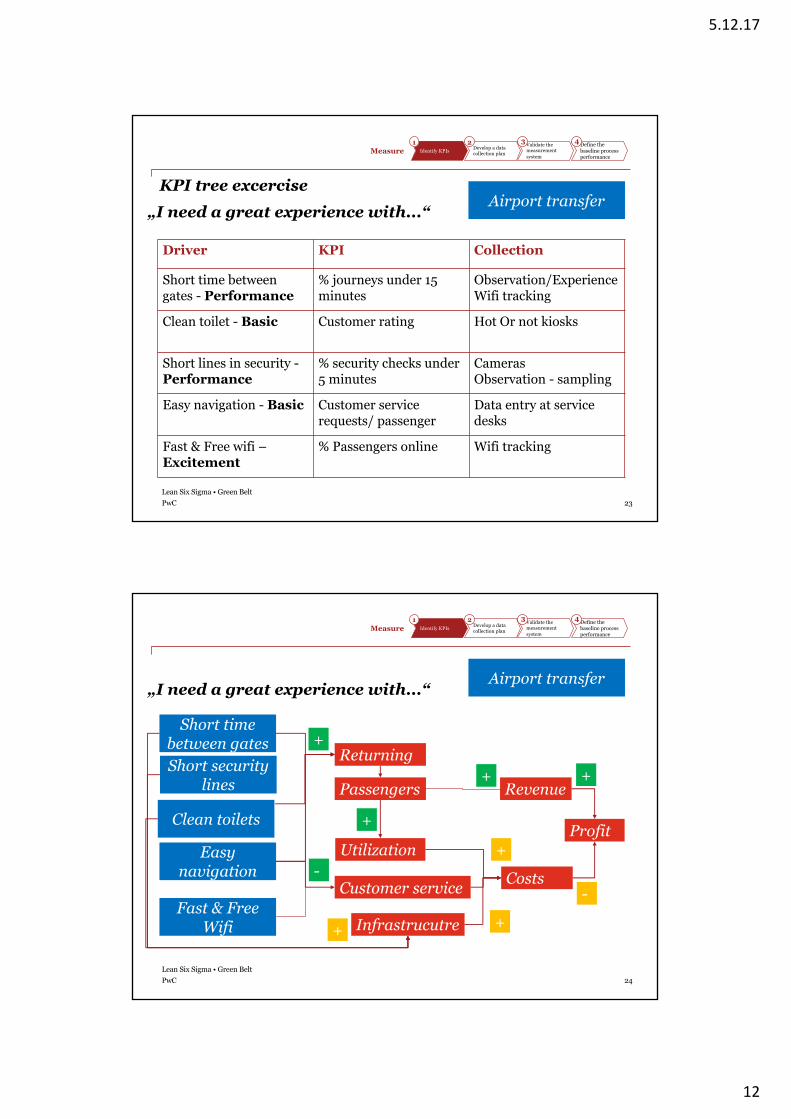
KPI tree excercise
5Find drivers to the customer needrelated to a process
“How to collect data?”
”What Kano model type it is?”
“What is the profit impact?”
Airport transfer Fixing homeinternet
Identify KPIs Develop a data collection plan
Validate themeasurementsystem
Define the baseline process performance
1 2 3 4Measure
Mortgage
„I need a great experience with...“
“What KPIs to choose?”
5.12.17
12
23Lean Six Sigma • Green BeltPwC
KPI tree excerciseAirport transfer
Identify KPIs Develop a data collection plan
Validate themeasurementsystem
Define the baseline process performance
1 2 3 4Measure
„I need a great experience with...“
Driver KPI Collection
Short time between gates - Performance
% journeys under 15 minutes
Observation/ExperienceWifi tracking
Clean toilet - Basic Customer rating Hot Or not kiosks
Short lines in security -Performance
% security checks under 5 minutes
CamerasObservation - sampling
Easy navigation - Basic Customer service requests/ passenger
Data entry at service desks
Fast & Free wifi –Excitement
% Passengers online Wifi tracking
24Lean Six Sigma • Green BeltPwC
Airport transfer
Identify KPIs Develop a data collection plan
Validate themeasurementsystem
Define the baseline process performance
1 2 3 4Measure
„I need a great experience with...“
Profit
Revenue
Costs
Passengers
Utilization
Short timebetween gates
Clean toilets
Easynavigation
Fast & Free Wifi
Returning
Infrastrucutre
Customer service
Short securitylines + +
-
+
+
-
+
+
+
5.12.17
13
25Lean Six Sigma • Green BeltPwC
August 2013Lean Six Sigma • Black Belt Training Week 2PwC
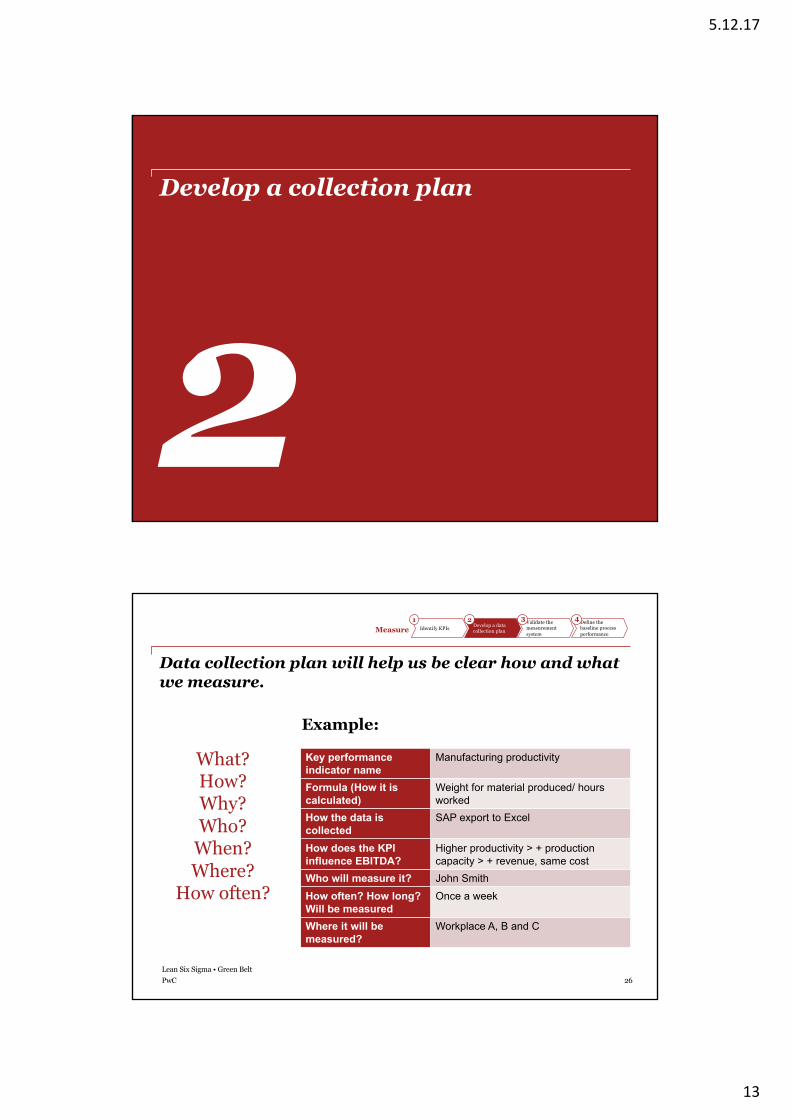
Develop a collection plan
2
26Lean Six Sigma • Green BeltPwC
Data collection plan will help us be clear how and whatwe measure.
Key performance indicator name
Manufacturing productivity
Formula (How it is calculated)
Weight for material produced/ hours worked
How the data is collected
SAP export to Excel
How does the KPI influence EBITDA?
Higher productivity > + production capacity > + revenue, same cost
Who will measure it? John SmithHow often? How long? Will be measured
Once a week
Where it will be measured?
Workplace A, B and C
What?How?Why?Who?
When?Where?
How often?
Example:
Measure Identify KPIs Develop a data collection plan
Validate themeasurementsystem
Define the baseline process performance
1 2 3 4
5.12.17
14
27Lean Six Sigma • Green BeltPwCPwC
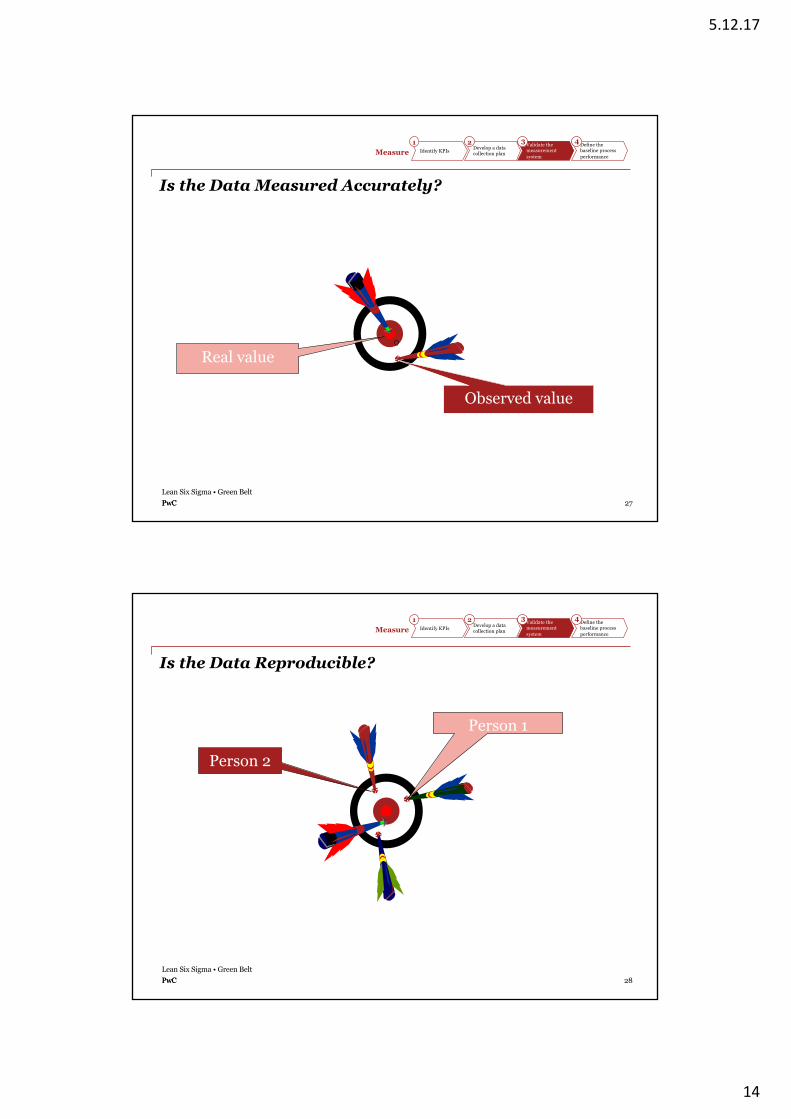
Is the Data Measured Accurately?
Real value
Observed value
Measure Identify KPIs Develop a data collection plan
Validate themeasurementsystem
Define the baseline process performance
1 2 3 4
28Lean Six Sigma • Green BeltPwCPwC
Is the Data Reproducible?
Person 2
Person 1
Measure Identify KPIs Develop a data collection plan
Validate themeasurementsystem
Define the baseline process performance
1 2 3 4
5.12.17
15
29Lean Six Sigma • Green BeltPwCPwC
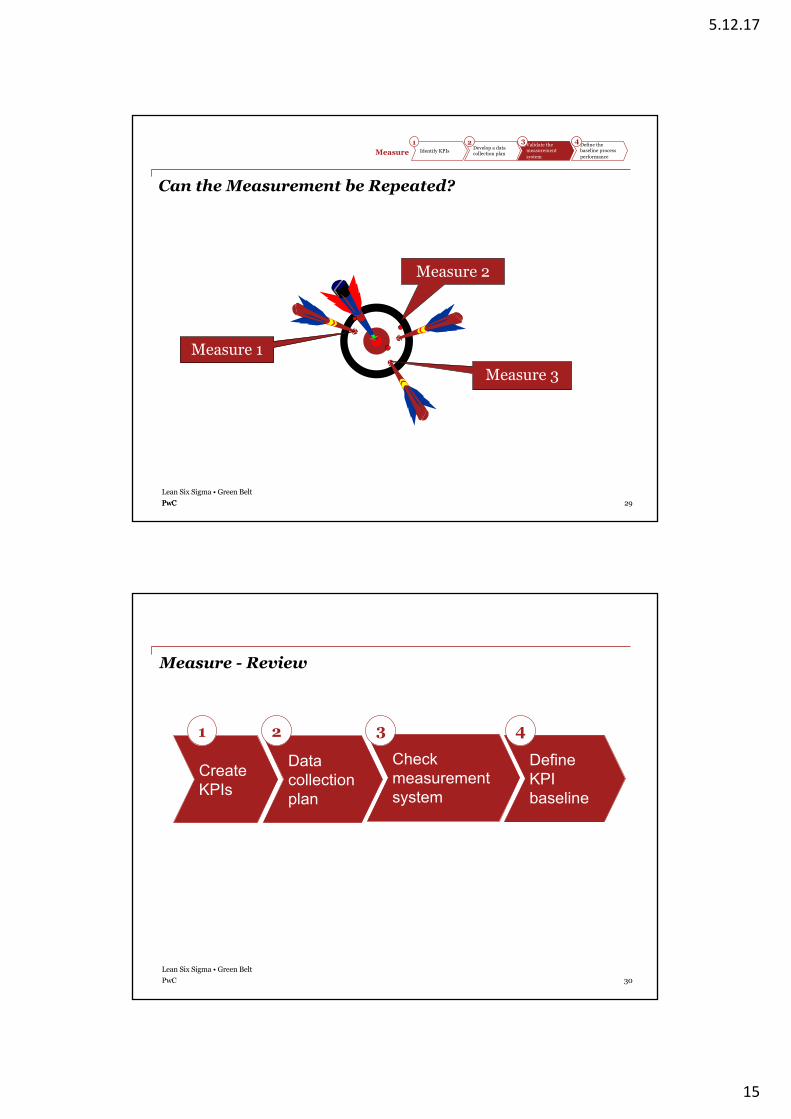
Can the Measurement be Repeated?
Measure 3Measure 1
Measure 2
Measure Identify KPIs Develop a data collection plan
Validate themeasurementsystem
Define the baseline process performance
1 2 3 4
30Lean Six Sigma • Green BeltPwC
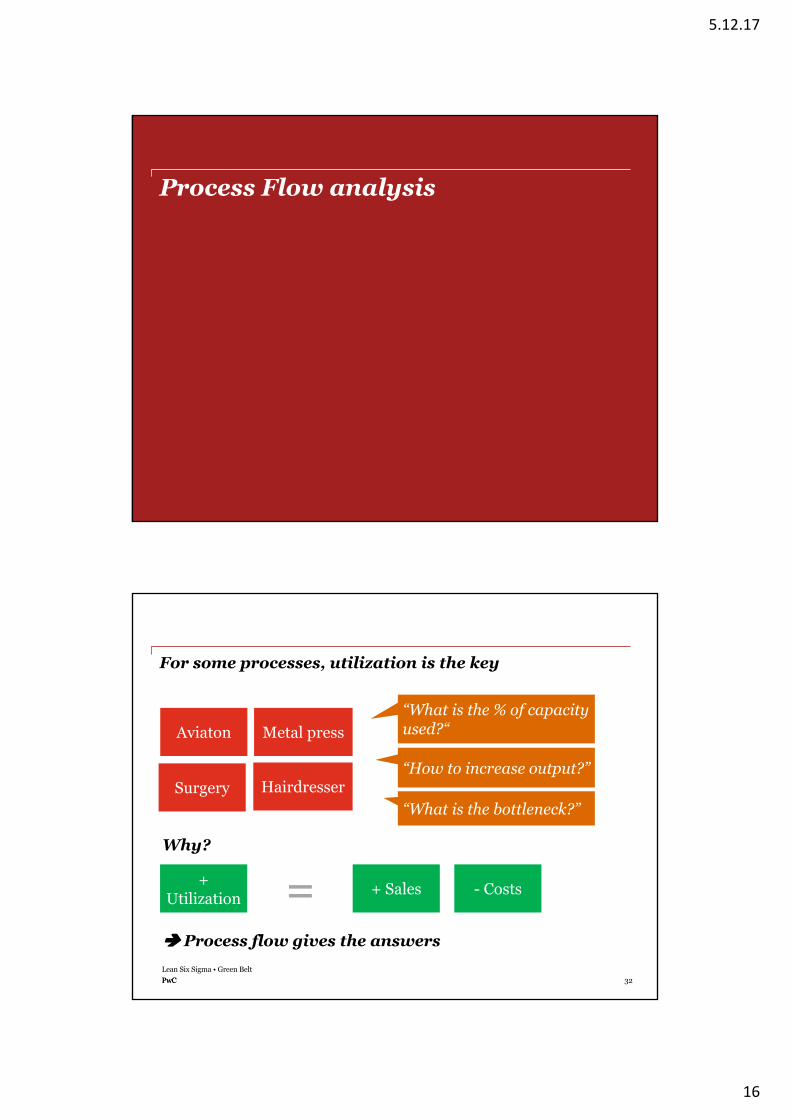
Measure - Review
CreateKPIs
Data collectionplan
Checkmeasurementsystem
DefineKPI baseline
1 2 3 4
5.12.17
16
31Lean Six Sigma • Green BeltPwC
August 2013Lean Six Sigma • Black Belt Training Week 2PwC
Process Flow analysis
32Lean Six Sigma • Green BeltPwCPwC
For some processes, utilization is the key
Aviaton
Surgery
Metal press
Hairdresser
“What is the % of capacityused?“
“What is the bottleneck?”
“How to increase output?”
+ Utilization + Sales - Costs=Why?
è Process flow gives the answers
5.12.17
17
33Lean Six Sigma • Green BeltPwCPwC
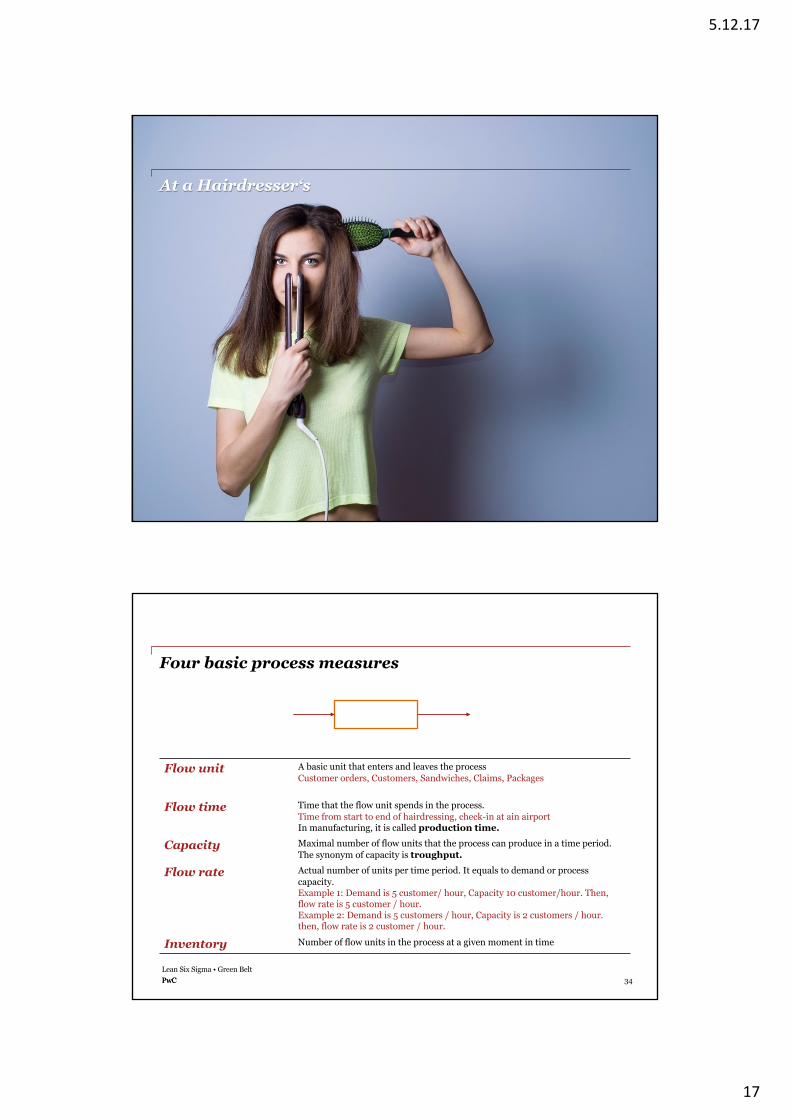
At a Hairdresser‘s
34Lean Six Sigma • Green BeltPwCPwC
Four basic process measures
Flow unit A basic unit that enters and leaves the process Customer orders, Customers, Sandwiches, Claims, Packages
Flow time Time that the flow unit spends in the process.Time from start to end of hairdressing, check-in at ain airportIn manufacturing, it is called production time.
Capacity Maximal number of flow units that the process can produce in a time period.The synonym of capacity is troughput.
Flow rate Actual number of units per time period. It equals to demand or processcapacity.Example 1: Demand is 5 customer/ hour, Capacity 10 customer/hour. Then, flow rate is 5 customer / hour.Example 2: Demand is 5 customers / hour, Capacity is 2 customers / hour. then, flow rate is 2 customer / hour.
Inventory Number of flow units in the process at a given moment in time
5.12.17
18
35Lean Six Sigma • Green BeltPwCPwC
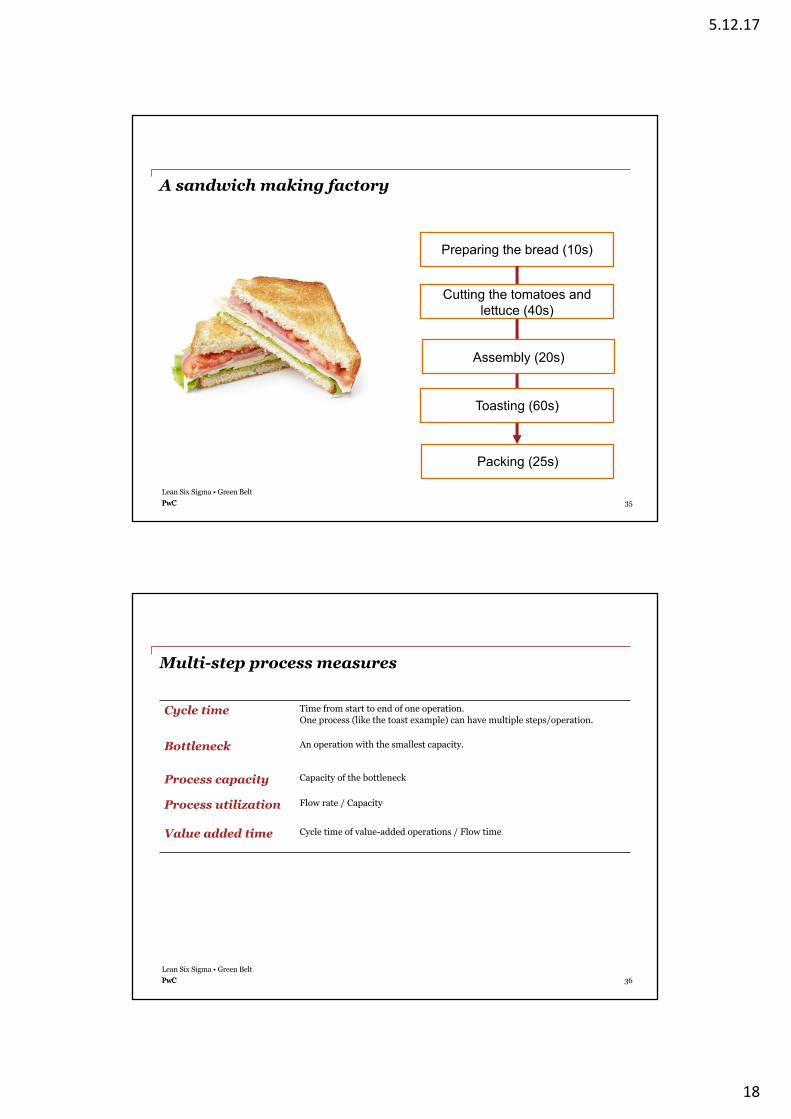
A sandwich making factory
Preparing the bread (10s)
Packing (25s)
Cutting the tomatoes and lettuce (40s)
Toasting (60s)
Assembly (20s)
36Lean Six Sigma • Green BeltPwCPwC
Multi-step process measures
Cycle time Time from start to end of one operation.One process (like the toast example) can have multiple steps/operation.
Bottleneck An operation with the smallest capacity.
Process capacity Capacity of the bottleneck
Process utilization Flow rate / Capacity
Value added time Cycle time of value-added operations / Flow time
5.12.17
19
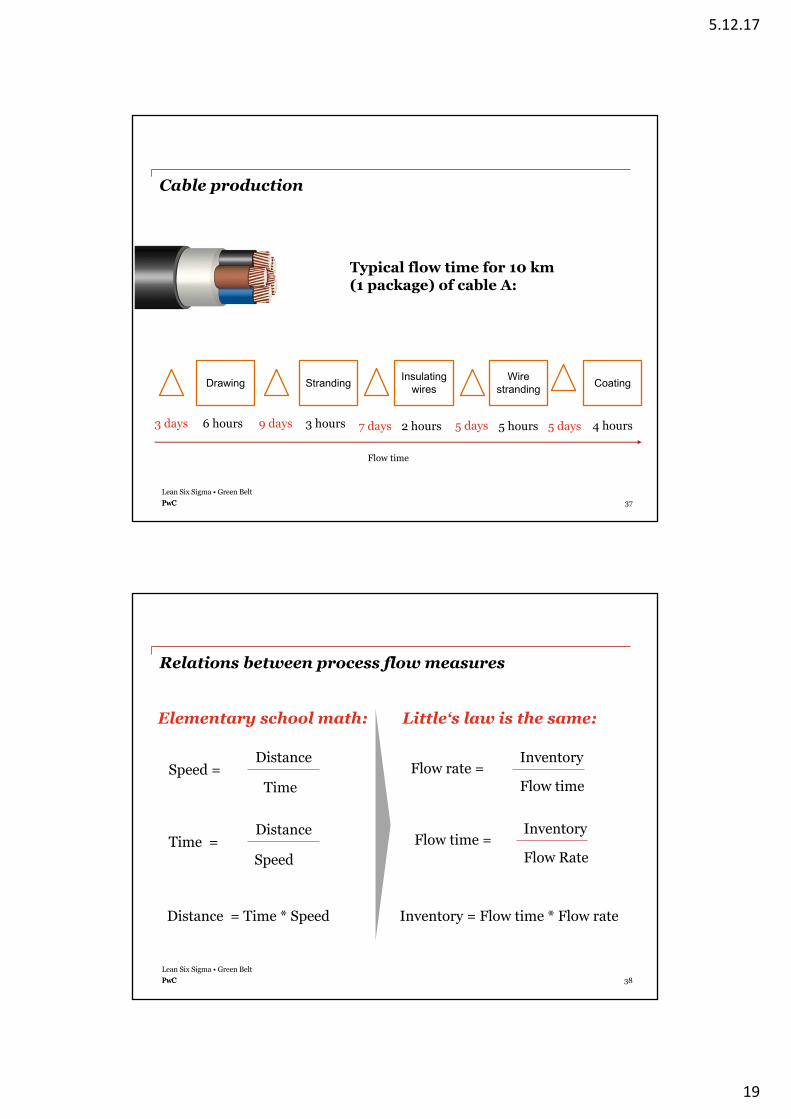
37Lean Six Sigma • Green BeltPwCPwC
Cable production
Drawing Stranding Insulating wires
Wire stranding Coating
3 days 6 hours 9 days 3 hours 2 hours7 days 5 days 5 hours 4 hours5 days
Flow time
Typical flow time for 10 km (1 package) of cable A:
38Lean Six Sigma • Green BeltPwCPwC
Relations between process flow measures
Speed = Distance
Time
Time = Distance
Speed
Distance = Time * Speed
Elementary school math: Little‘s law is the same:
Flow rate = Inventory
Flow time
Flow time = Inventory
Flow Rate
Inventory = Flow time * Flow rate
5.12.17
20
39Lean Six Sigma • Green BeltPwCPwC
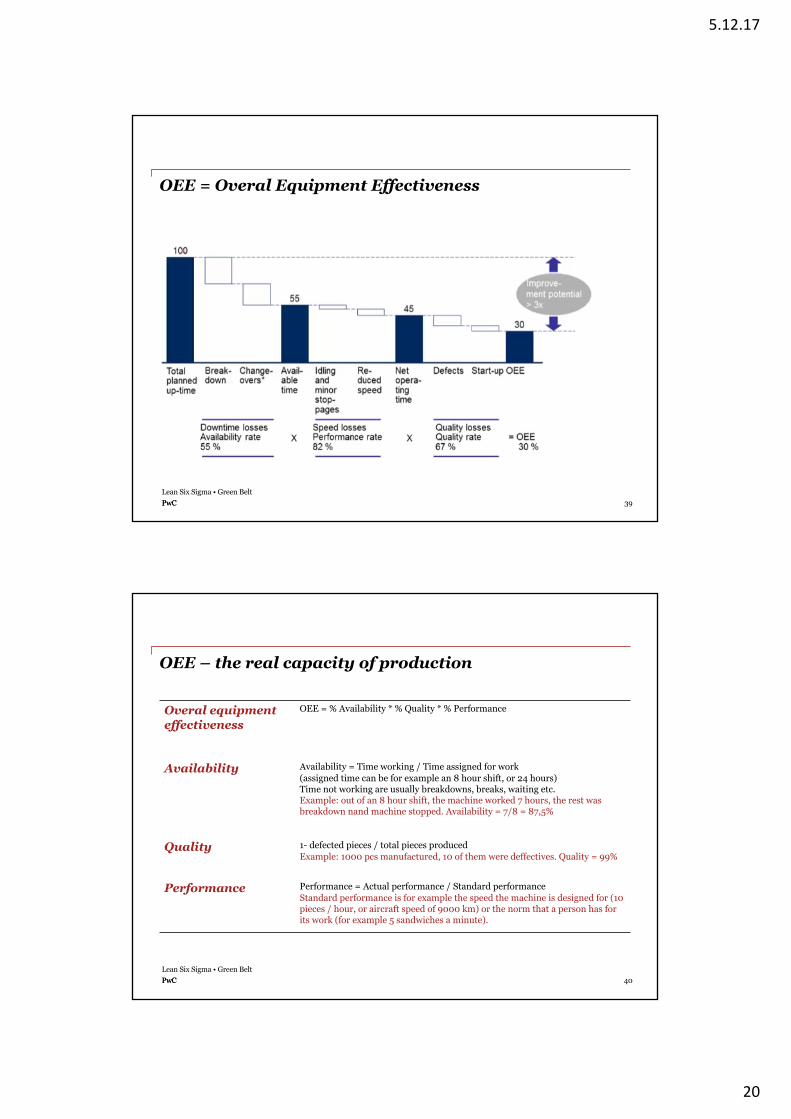
OEE = Overal Equipment Effectiveness
40Lean Six Sigma • Green BeltPwCPwC
OEE – the real capacity of production
Overal equipmenteffectiveness
OEE = % Availability * % Quality * % Performance
Availability Availability = Time working / Time assigned for work(assigned time can be for example an 8 hour shift, or 24 hours)Time not working are usually breakdowns, breaks, waiting etc.Example: out of an 8 hour shift, the machine worked 7 hours, the rest wasbreakdown nand machine stopped. Availability = 7/8 = 87,5%
Quality 1- defected pieces / total pieces producedExample: 1000 pcs manufactured, 10 of them were deffectives. Quality = 99%
Performance Performance = Actual performance / Standard performanceStandard performance is for example the speed the machine is designed for (10 pieces / hour, or aircraft speed of 9000 km) or the norm that a person has for its work (for example 5 sandwiches a minute).

5.12.17
21
41Lean Six Sigma • Green BeltPwCPwC
Key message
The waste decreasing availability, performance and quality is multipled. OEE
can be suprisingly low.
42Lean Six Sigma • Green BeltPwCPwC
Customer lead time = Time from order to deliveryTwo situations typically occur:
Make to order:
Customer order Production start
Production finish
Customer delivery
Lead time
Make to stock
Customer orderProduction start
Production finish
Customer delivery
Lead time
Flowtime
Flowtime
5.12.17
22
43Lean Six Sigma • Green BeltPwCPwC
Key message
Customers prefers “make to order“. However, if the flow time is longer thanthe customer wants to wait, we need to
make to stock.
44Lean Six Sigma • Green BeltPwC
August 2013Lean Six Sigma • Black Belt Training Week 2PwC
Data analysis
5
5.12.17
23
45Lean Six Sigma • Green BeltPwCPwC
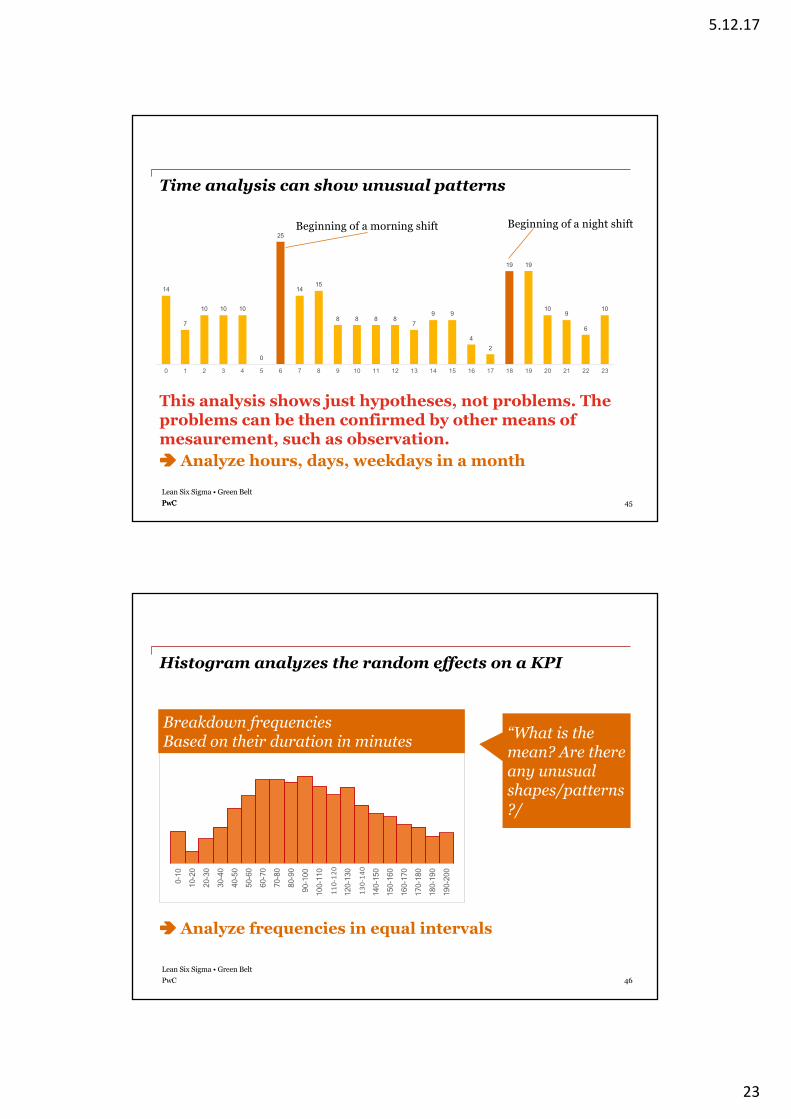
Time analysis can show unusual patterns
This analysis shows just hypotheses, not problems. The problems can be then confirmed by other means of mesaurement, such as observation.
14
7
10 10 10
0
25
1415
8 8 8 87
9 9
42
19 19
109
6
10
0 1 2 3 4 5 6 7 8 9 10 11 12 13 14 15 16 17 18 19 20 21 22 23
Beginning of a morning shift Beginning of a night shift
è Analyze hours, days, weekdays in a month
46Lean Six Sigma • Green BeltPwC
Histogram analyzes the random effects on a KPI
0-10
10-20
20
-30
30-40
40
-50
50-60
60
-70
70-80
80
-90
90-10
0 10
0-110
11
0-12
0
120-1
30
130-14
0
140-1
50
150-1
60
160-1
70
170-1
80
180-1
90
190-2
00
Četnostiporuchpodlečasu “What is the mean? Are there any unusual shapes/patterns?/
è Analyze frequencies in equal intervals
Breakdown frequenciesBased on their duration in minutes
5.12.17
24
47Lean Six Sigma • Green BeltPwC
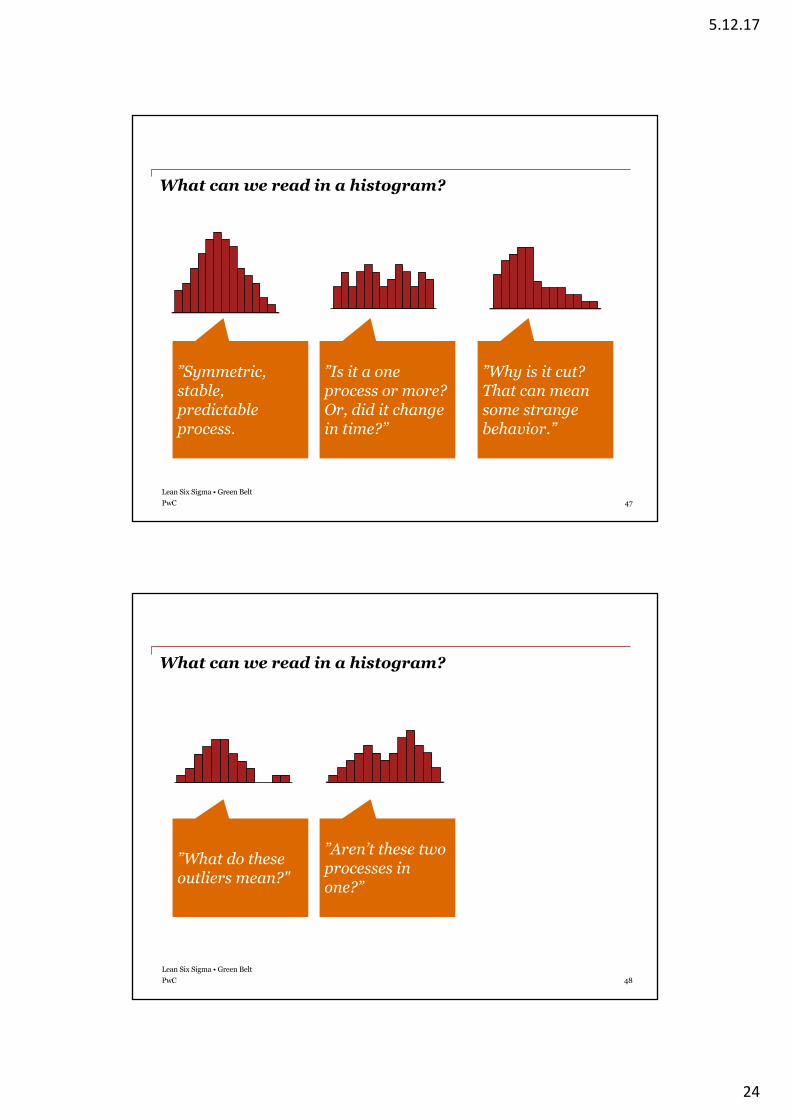
What can we read in a histogram?
”Symmetric, stable, predictable process.
”Is it a one process or more? Or, did it change in time?”
”Why is it cut? That can mean some strange behavior.”
48Lean Six Sigma • Green BeltPwC
What can we read in a histogram?
”What do these outliers mean?"
”Aren’t these two processes in one?”
5.12.17
25
49Lean Six Sigma • Green BeltPwCPwC
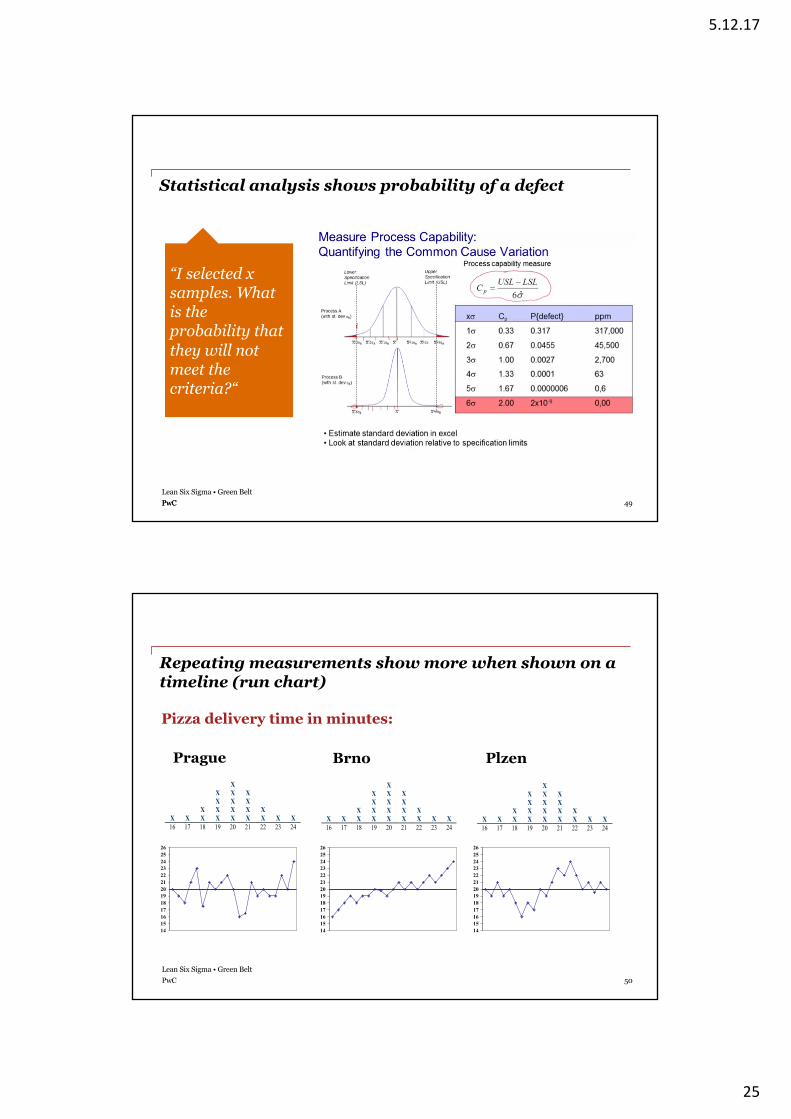
Statistical analysis shows probability of a defect
“I selected xsamples. Whatis theprobability thatthey will not meet thecriteria?“
50Lean Six Sigma • Green BeltPwC
Repeating measurements show more when shown on a timeline (run chart)
Pizza delivery time in minutes:
X X X X X X X X X X X X
X X X X X X X X X 16 17 18 19 20 21 22 23 24
14151617181920212223242526
14151617181920212223242526
14151617181920212223242526
Prague Brno Plzen X X X X X X X X X X X X
X X X X X X X X X 16 17 18 19 20 21 22 23 24
X X X X X X X X X X X X
X X X X X X X X X 16 17 18 19 20 21 22 23 24
5.12.17
26
51Lean Six Sigma • Green BeltPwCPwC
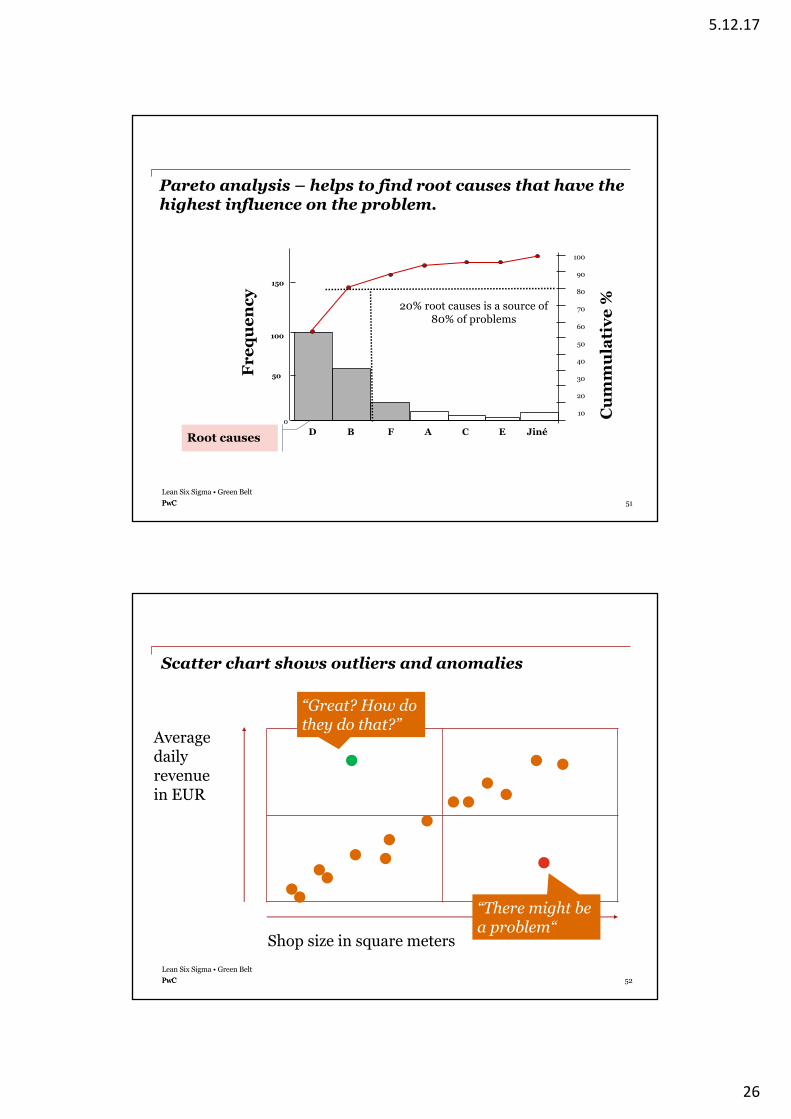
Pareto analysis – helps to find root causes that have the highest influence on the problem.
Frequency
Cummulative%
100
90
80
70
60
50
40
30
20
10
D B F A C E Jiné0
50
100
150
20% root causes is a source of80% of problems
Root causes
52Lean Six Sigma • Green BeltPwCPwC
Scatter chart shows outliers and anomalies
Shop size in square meters
Averagedailyrevenuein EUR
“Great? How do they do that?”
“There might bea problem“
5.12.17
27
53Lean Six Sigma • Green BeltPwCPwC
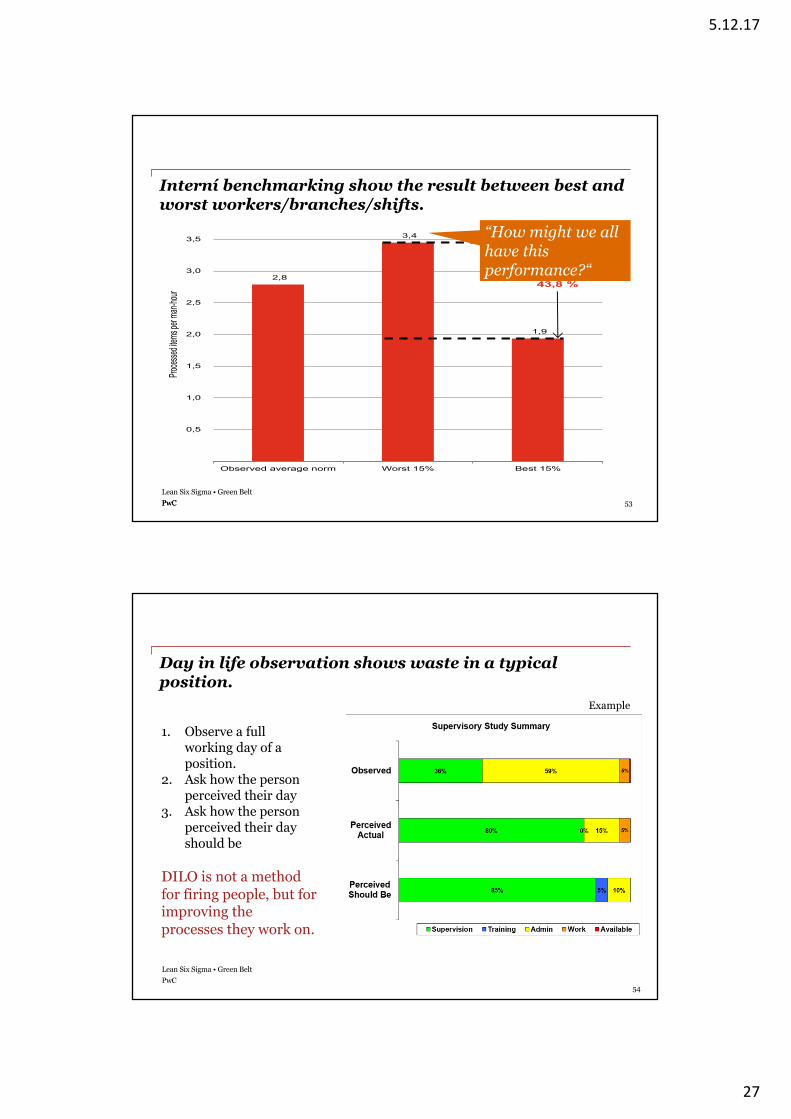
Interní benchmarking show the result between best and worst workers/branches/shifts.
2,8
3,4
1,9
0,5
1,0
1,5
2,0
2,5
3,0
3,5
4,0
Observed average norm Worst 15% Best 15%
Proces
sed ite
ms pe
r man-
hour 43,8 %
“How might we allhave thisperformance?“
Lean Six Sigma • Green BeltPwC
54
Day in life observation shows waste in a typicalposition.
1. Observe a full working day of a position.
2. Ask how the person perceived their day
3. Ask how the person perceived their day should be
DILO is not a method for firing people, but for improving the processes they work on.
Example
5.12.17
28
Lean Six Sigma • Green BeltPwC
55
Contact
Jiří Benedikt
Trainer, ConsultantI help people work smarter
Lean Six Sigma | Design thinking | Digital skills
777 253 754
www.jiribenedikt.com
56Lean Six Sigma • Green BeltPwC
August 2013Lean Six Sigma • Black Belt Training Week 2PwC
Appendix
5.12.17
29
Lean Six Sigma • Green BeltPwC
57
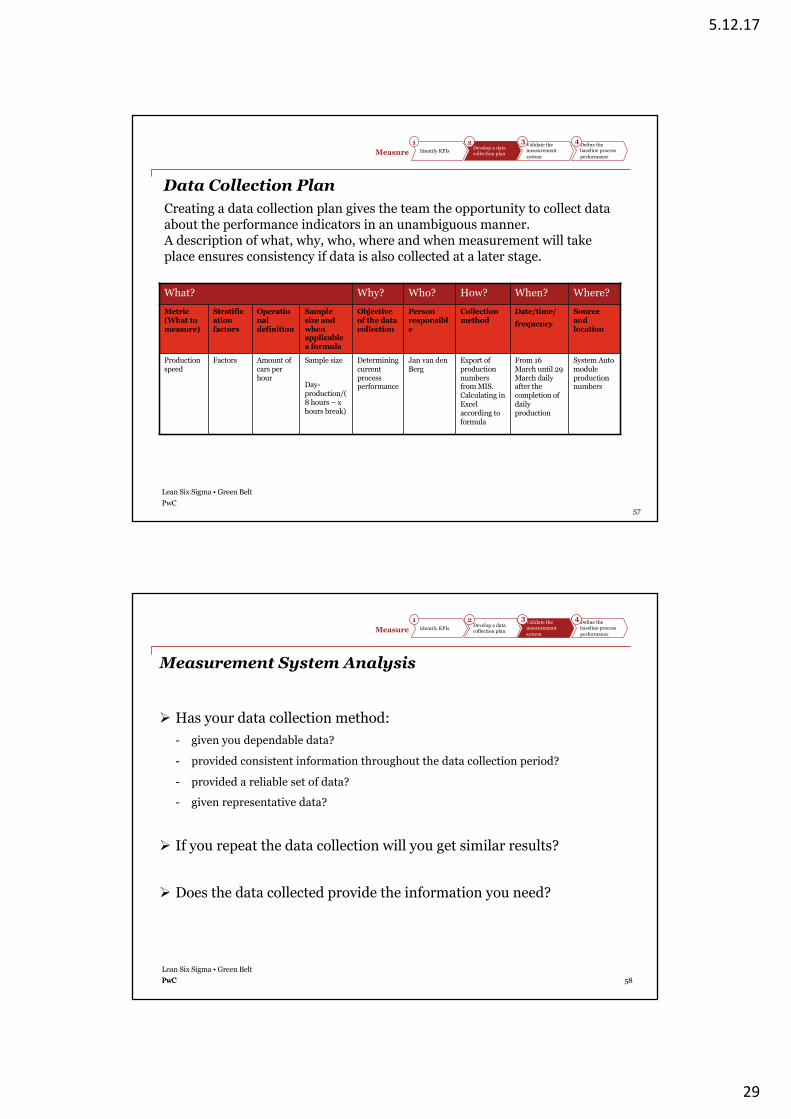
Data Collection Plan
Measure Identify KPIs Develop a data collection plan
Validate themeasurementsystem
Define the baseline process performance
1 2 3 4
What? Why? Who? How? When? Where?Metric (What to measure)
Stratification factors
Operational definition
Sample size and when applicable a formula
Objective of the data collection
Person responsible
Collection method
Date/time/frequency
Source and location
Production speed
Factors Amount of cars per hour
Sample size
Day-production/(8 hours – x hours break)
Determining current process performance
Jan van den Berg
Export of production numbers from MIS. Calculating in Excel according to formula
From 16 March until 29 March daily after the completion of daily production
System Auto module production numbers
Creating a data collection plan gives the team the opportunity to collect data about the performance indicators in an unambiguous manner. A description of what, why, who, where and when measurement will take place ensures consistency if data is also collected at a later stage.
58Lean Six Sigma • Green BeltPwCPwC
Measurement System Analysis
Ø Has your data collection method:- given you dependable data?
- provided consistent information throughout the data collection period?
- provided a reliable set of data?
- given representative data?
Ø If you repeat the data collection will you get similar results?
Ø Does the data collected provide the information you need?
Measure Identify KPIs Develop a data collection plan
Validate themeasurementsystem
Define the baseline process performance
1 2 3 4
5.12.17
30
59Lean Six Sigma • Green BeltPwCPwC
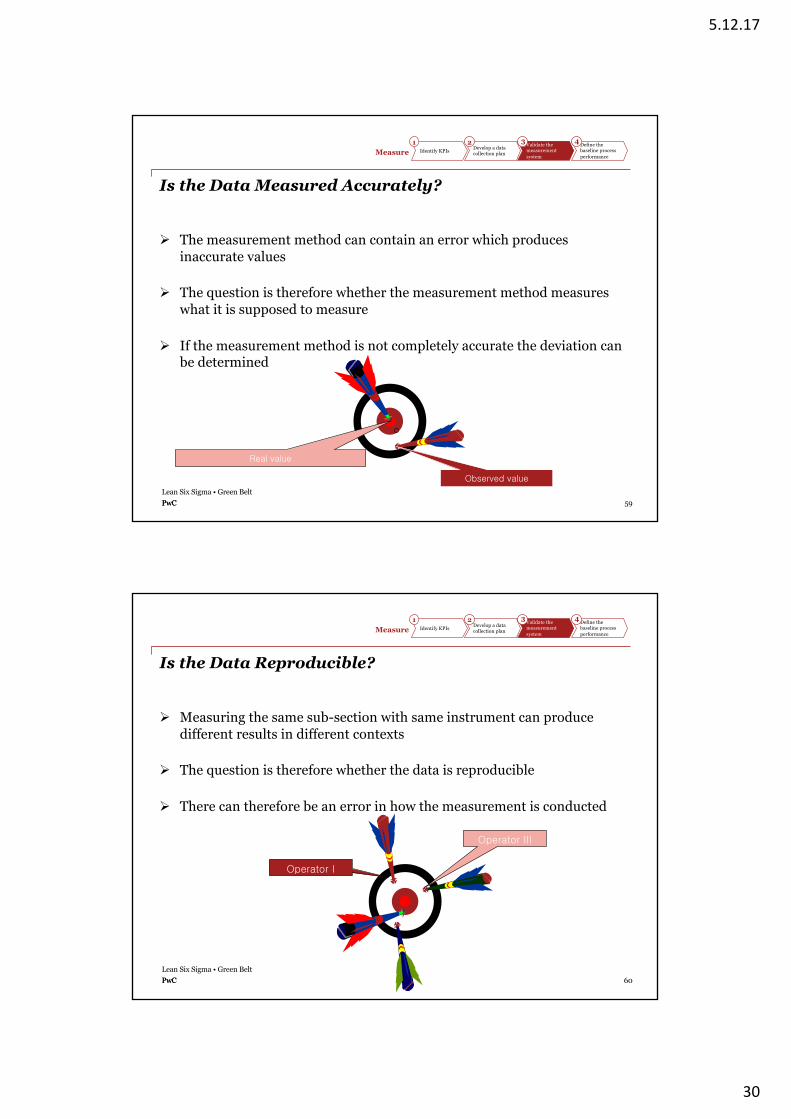
Is the Data Measured Accurately?
Ø The measurement method can contain an error which produces inaccurate values
Ø The question is therefore whether the measurement method measures what it is supposed to measure
Ø If the measurement method is not completely accurate the deviation can be determined
Real value
Observed value
Measure Identify KPIs Develop a data collection plan
Validate themeasurementsystem
Define the baseline process performance
1 2 3 4
60Lean Six Sigma • Green BeltPwCPwC
Is the Data Reproducible?
Ø Measuring the same sub-section with same instrument can produce different results in different contexts
Ø The question is therefore whether the data is reproducible
Ø There can therefore be an error in how the measurement is conducted
Operator I
Operator III
Measure Identify KPIs Develop a data collection plan
Validate themeasurementsystem
Define the baseline process performance
1 2 3 4
5.12.17
31
61Lean Six Sigma • Green BeltPwCPwC
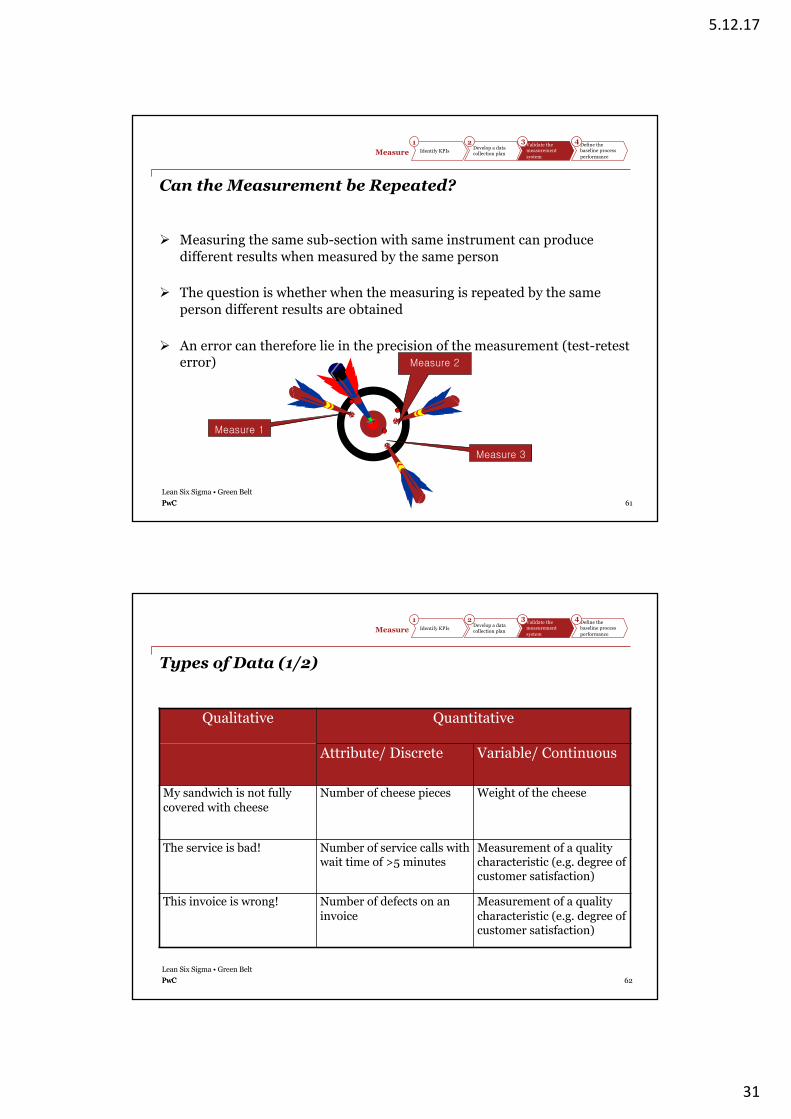
Can the Measurement be Repeated?
Ø Measuring the same sub-section with same instrument can produce different results when measured by the same person
Ø The question is whether when the measuring is repeated by the same person different results are obtained
Ø An error can therefore lie in the precision of the measurement (test-retest error)
Measure 3
Measure 1
Measure 2
Measure Identify KPIs Develop a data collection plan
Validate themeasurementsystem
Define the baseline process performance
1 2 3 4
62Lean Six Sigma • Green BeltPwCPwC
Types of Data (1/2)
Qualitative Quantitative
Attribute/ Discrete Variable/ Continuous
My sandwich is not fully covered with cheese
Number of cheese pieces Weight of the cheese
The service is bad! Number of service calls with wait time of >5 minutes
Measurement of a quality characteristic (e.g. degree of customer satisfaction)
This invoice is wrong! Number of defects on an invoice
Measurement of a quality characteristic (e.g. degree of customer satisfaction)
Measure Identify KPIs Develop a data collection plan
Validate themeasurementsystem
Define the baseline process performance
1 2 3 4

5.12.17
32
63Lean Six Sigma • Green BeltPwCPwC
Types of Data (2/2)
Continuous or variable dataMeasured on a continuum or scale. Usually continuous measures can be divided into parts and still make sense. For example:
• Time can be divided into days, hours, minutes, or seconds (cycle time)
• Money can logically be divided or specified in increments (sales, costs, losses)
• Satisfaction if measured with a continuous scale, (i.e. very dissatisfied, dissatisfied, neither satisfied nor dissatisfied, satisfied, very satisfied) can logically be calculated and expressed in an average level of satisfaction on a scale.
Discrete, categorical or attribute dataMeasured by counting. For example:
• Defects (yes/no, approved/disapproved, pass/fail, met customer requirement/did not meet customer requirement)
• Categories (days of the week, locations, type of customer, type of product, risk - low/medium/high)
• Satisfaction (poor/fair/good/excellent or dissatisfied/satisfied)
Measure Identify KPIs Develop a data collection plan
Validate themeasurementsystem
Define the baseline process performance
1 2 3 4
64Lean Six Sigma • Green BeltPwCPwC
What is a Histogram?
A histogram is a bar graph that displays the results for a sample of performance data in picture form. This picture is sometimes called a frequency distribution because it shows clearly how frequently each separate value appears in the data.
Identify KPIs Develop a data collection plan
Validate themeasurementsystem
Define the baseline process performance
1 2 3 4Measure
5.12.17
33
65Lean Six Sigma • Green BeltPwCPwC
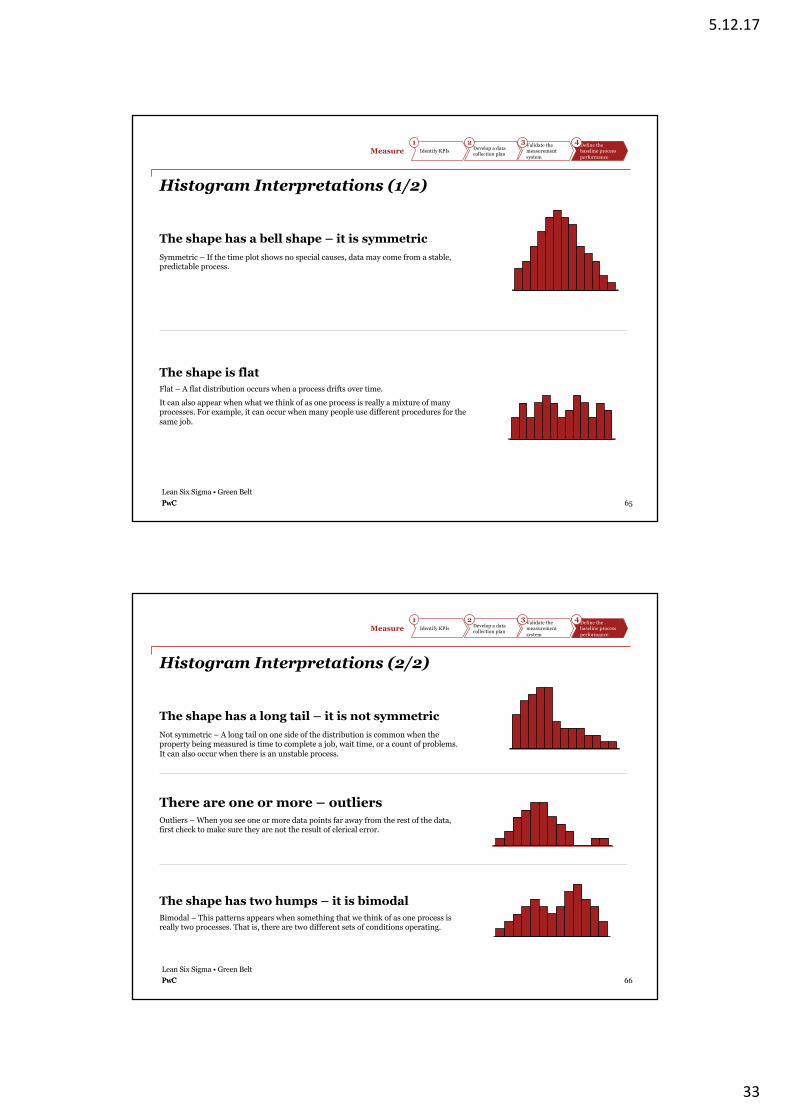
Histogram Interpretations (1/2)
The shape has a bell shape – it is symmetricSymmetric – If the time plot shows no special causes, data may come from a stable, predictable process.
The shape is flatFlat – A flat distribution occurs when a process drifts over time. It can also appear when what we think of as one process is really a mixture of many processes. For example, it can occur when many people use different procedures for the same job.
Identify KPIs Develop a data collection plan
Validate themeasurementsystem
Define the baseline process performance
1 2 3 4Measure
66Lean Six Sigma • Green BeltPwCPwC
Histogram Interpretations (2/2)
The shape has a long tail – it is not symmetricNot symmetric – A long tail on one side of the distribution is common when the property being measured is time to complete a job, wait time, or a count of problems. It can also occur when there is an unstable process.
There are one or more – outliers Outliers – When you see one or more data points far away from the rest of the data, first check to make sure they are not the result of clerical error.
The shape has two humps – it is bimodalBimodal – This patterns appears when something that we think of as one process is really two processes. That is, there are two different sets of conditions operating.
Identify KPIs Develop a data collection plan
Validate themeasurementsystem
Define the baseline process performance
1 2 3 4Measure
5.12.17
34
67Lean Six Sigma • Green BeltPwC
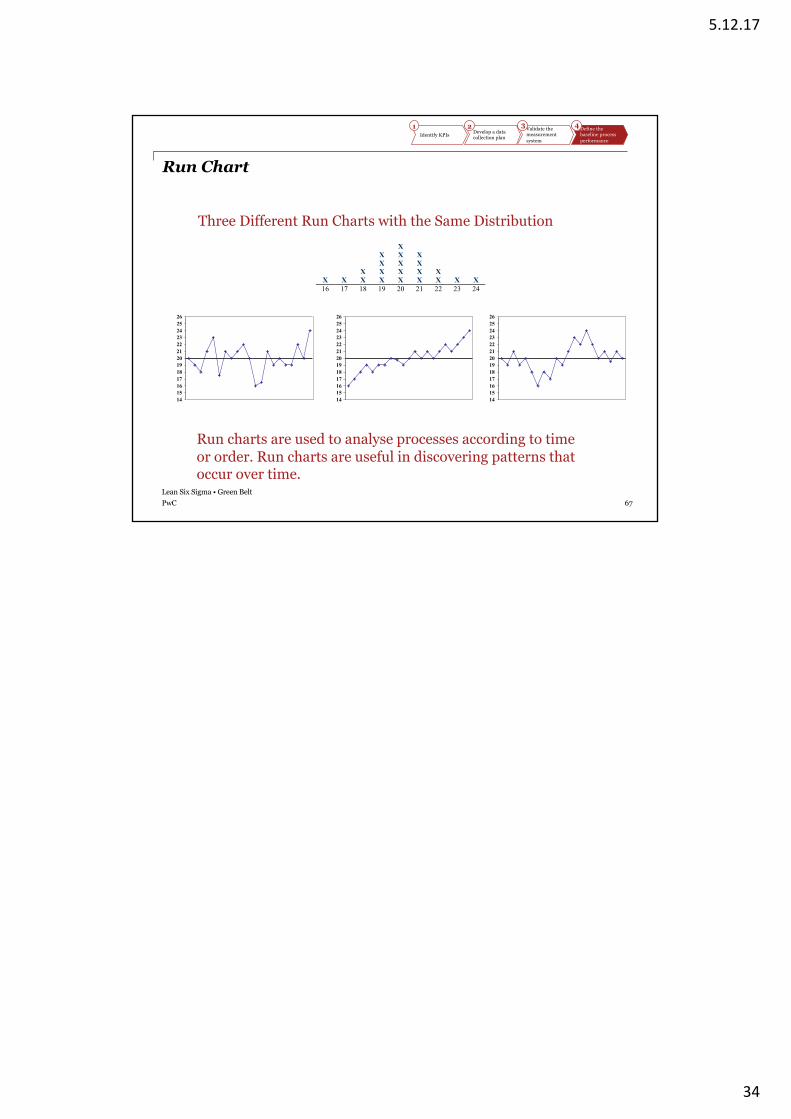
Run Chart
Three Different Run Charts with the Same Distribution X X X X X X X X X X X X
X X X X X X X X X 16 17 18 19 20 21 22 23 24
14151617181920212223242526
14151617181920212223242526
14151617181920212223242526
Run charts are used to analyse processes according to time or order. Run charts are useful in discovering patterns that occur over time.
Identify KPIs Develop a data collection plan
Validate themeasurementsystem
Define the baseline process performance
1 2 3 4