Embed Size (px)
Citation preview
MODULE 1:WATER TREATMENT10 WEEK PLAN
Reproduction of this work in whole or part, by any means, is prohibited without the prior express approval of Busselton Water.
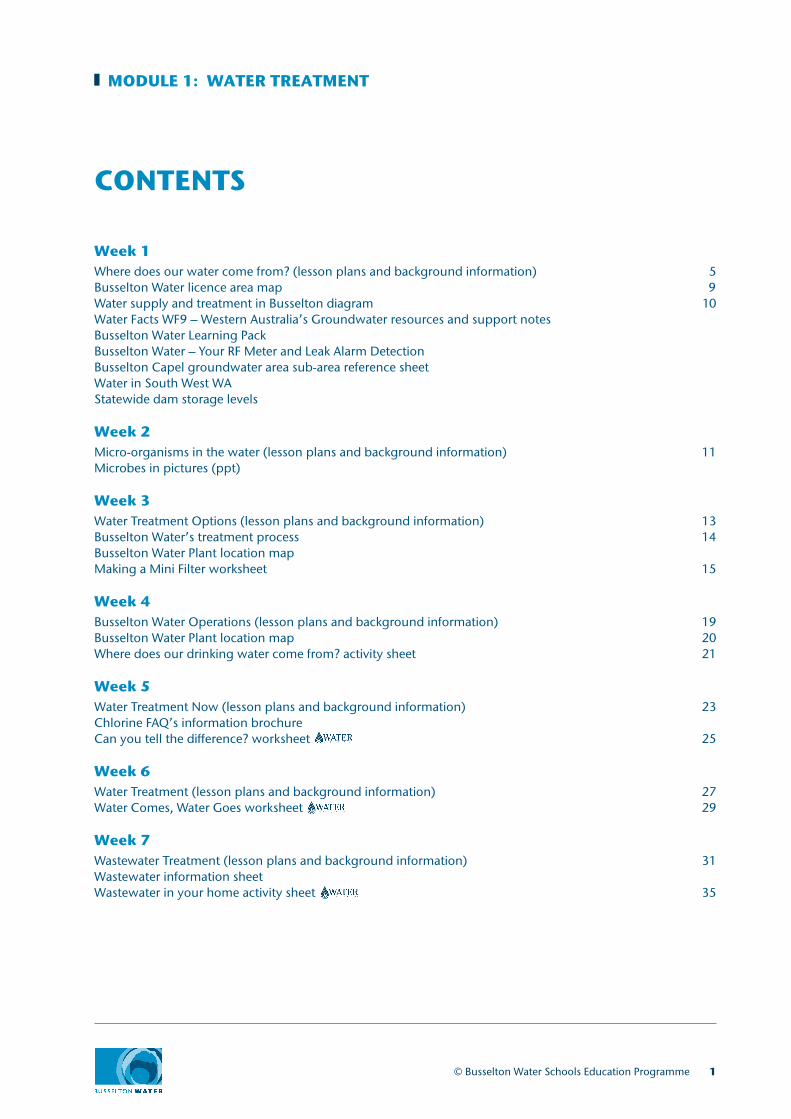
CONTENTS
MODULE 1: WATER TREATMENT
Week 1Where does our water come from? (lesson plans and background information) 5Busselton Water licence area map 9Water supply and treatment in Busselton diagram 10 Water Facts WF9 – Western Australia’s Groundwater resources and support notes Busselton Water Learning Pack Busselton Water – Your RF Meter and Leak Alarm Detection Busselton Capel groundwater area sub-area reference sheet Water in South West WA Statewide dam storage levels
Week 2Micro-organisms in the water (lesson plans and background information) 11Microbes in pictures (ppt)
Week 3Water Treatment Options (lesson plans and background information) 13Busselton Water’s treatment process 14Busselton Water Plant location map Making a Mini Filter worksheet 15
Week 4Busselton Water Operations (lesson plans and background information) 19Busselton Water Plant location map 20Where does our drinking water come from? activity sheet 21
Week 5Water Treatment Now (lesson plans and background information) 23Chlorine FAQ’s information brochure Can you tell the difference? worksheet 25
Week 6Water Treatment (lesson plans and background information) 27Water Comes, Water Goes worksheet 29
Week 7 Wastewater Treatment (lesson plans and background information) 31Wastewater information sheet Wastewater in your home activity sheet 35
© Busselton Water Schools Education Programme 1

2 © Busselton Water Schools Education Programme
Week 8 Alternative Technologies – greywater (lesson plans and background information) 37Greywater reuse and recycling
Week 9 Alternative Technologies – desalination plants (lesson plans and background information) 39Desalination in Western Australia The Perth Seawater Desalination Plant Understanding desalination activity sheet Making a solar desalination plant activity sheet 41
Week 10Water Treatment in Other Countries 43
© Busselton Water Schools Education Programme 3
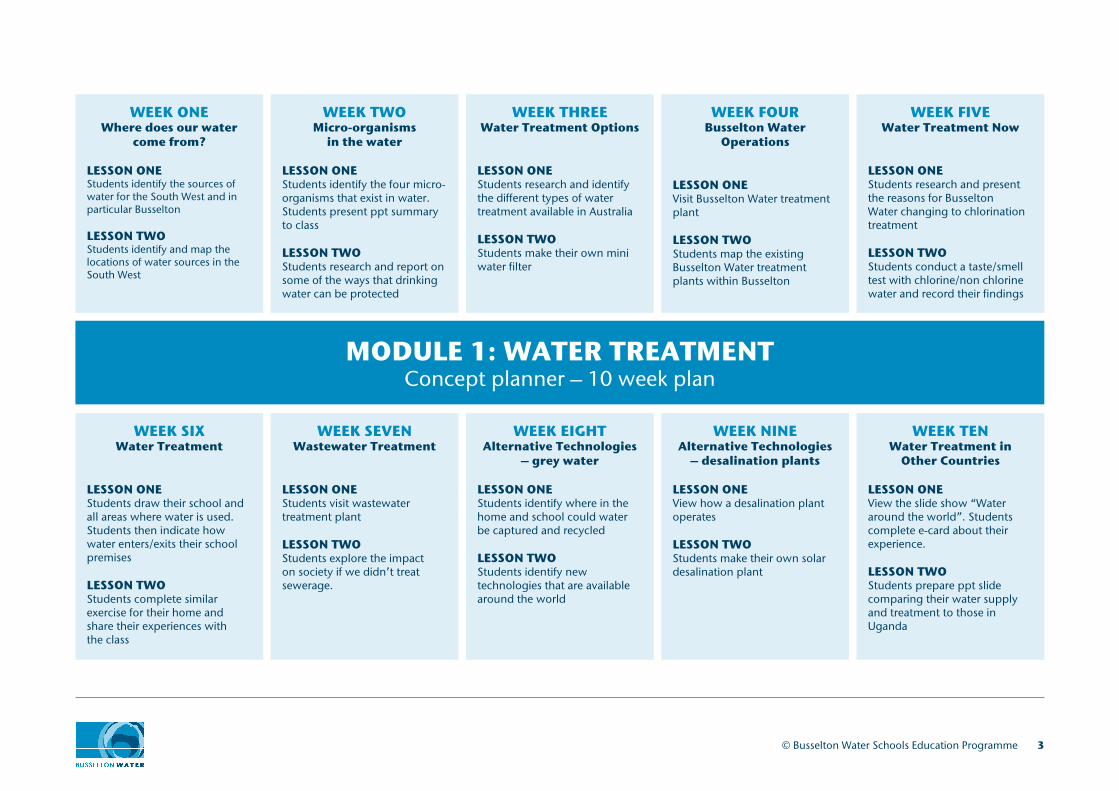
MODULE 1: WATER TREATMENT Concept planner – 10 week plan
WEEK ONEWhere does our water
come from?
LESSON ONEStudents identify the sources of water for the South West and in particular Busselton
LESSON TWOStudents identify and map the locations of water sources in the South West
WEEK TWOMicro-organisms
in the water
LESSON ONEStudents identify the four micro-organisms that exist in water. Students present ppt summary to class
LESSON TWOStudents research and report on some of the ways that drinking water can be protected
WEEK THREEWater Treatment Options
LESSON ONEStudents research and identify the different types of water treatment available in Australia
LESSON TWOStudents make their own mini water filter
WEEK FOURBusselton Water
Operations
LESSON ONEVisit Busselton Water treatment plant
LESSON TWOStudents map the existing Busselton Water treatment plants within Busselton
WEEK FIVEWater Treatment Now
LESSON ONEStudents research and present the reasons for Busselton Water changing to chlorination treatment
LESSON TWOStudents conduct a taste/smell test with chlorine/non chlorine water and record their findings
WEEK SIXWater Treatment
LESSON ONEStudents draw their school and all areas where water is used. Students then indicate how water enters/exits their school premises
LESSON TWOStudents complete similar exercise for their home and share their experiences with the class
WEEK SEVENWastewater Treatment
LESSON ONEStudents visit wastewater treatment plant
LESSON TWOStudents explore the impact on society if we didn’t treat sewerage.
WEEK EIGHTAlternative Technologies
– grey water
LESSON ONEStudents identify where in the home and school could water be captured and recycled
LESSON TWOStudents identify new technologies that are available around the world
WEEK NINEAlternative Technologies
– desalination plants
LESSON ONEView how a desalination plant operates
LESSON TWOStudents make their own solar desalination plant
WEEK TENWater Treatment in
Other Countries
LESSON ONEView the slide show “Water around the world”. Students complete e-card about their experience.
LESSON TWOStudents prepare ppt slide comparing their water supply and treatment to those in Uganda
CURRICULUM LINKS
© Busselton Water Schools Education Programme
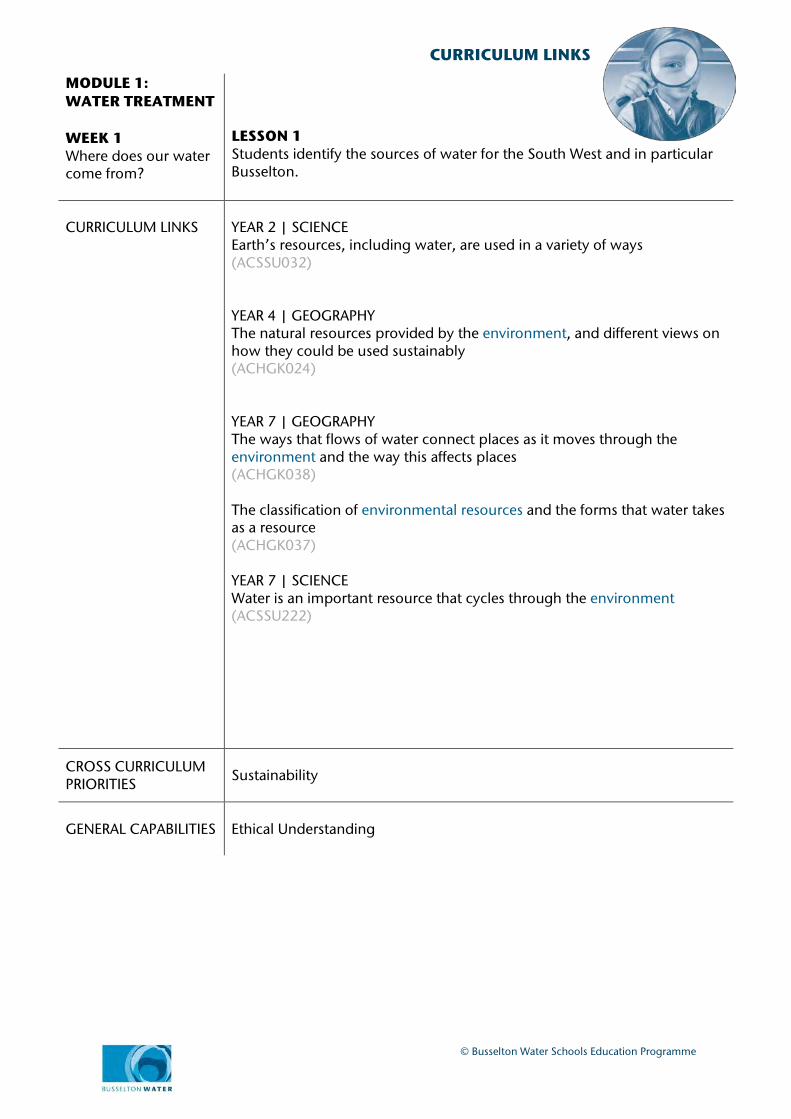
MODULE 1: WATER TREATMENT WEEK 1 Where does our water come from?
LESSON 1 Students identify the sources of water for the South West and in particular Busselton.
CURRICULUM LINKS
YEAR 2 | SCIENCE Earth’s resources, including water, are used in a variety of ways (ACSSU032) YEAR 4 | GEOGRAPHY The natural resources provided by the environment, and different views on how they could be used sustainably (ACHGK024) YEAR 7 | GEOGRAPHY The ways that flows of water connect places as it moves through the environment and the way this affects places (ACHGK038) The classification of environmental resources and the forms that water takes as a resource (ACHGK037) YEAR 7 | SCIENCE Water is an important resource that cycles through the environment (ACSSU222)
CROSS CURRICULUM PRIORITIES
Sustainability
GENERAL CAPABILITIES Ethical Understanding
CURRICULUM LINKS
© Busselton Water Schools Education Programme
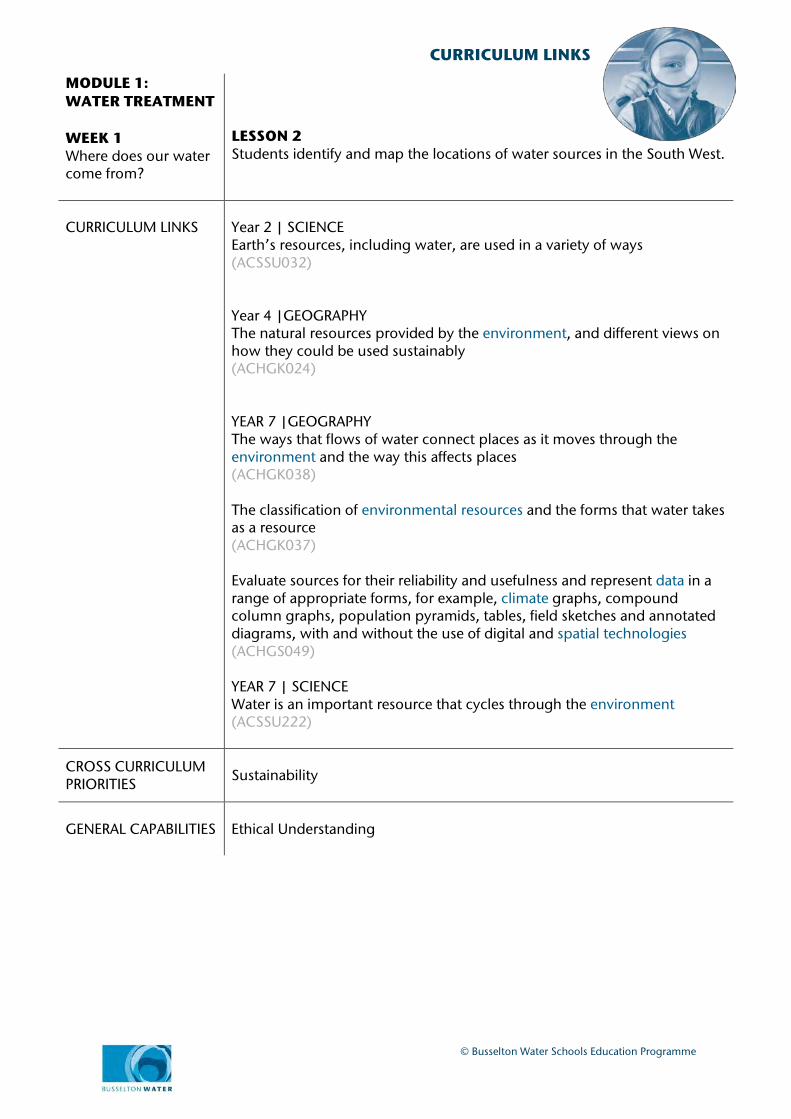
MODULE 1: WATER TREATMENT WEEK 1 Where does our water come from?
LESSON 2 Students identify and map the locations of water sources in the South West.
CURRICULUM LINKS
Year 2 | SCIENCE Earth’s resources, including water, are used in a variety of ways (ACSSU032) Year 4 |GEOGRAPHY The natural resources provided by the environment, and different views on how they could be used sustainably (ACHGK024) YEAR 7 |GEOGRAPHY The ways that flows of water connect places as it moves through the environment and the way this affects places (ACHGK038) The classification of environmental resources and the forms that water takes as a resource (ACHGK037) Evaluate sources for their reliability and usefulness and represent data in a range of appropriate forms, for example, climate graphs, compound column graphs, population pyramids, tables, field sketches and annotated diagrams, with and without the use of digital and spatial technologies (ACHGS049) YEAR 7 | SCIENCE Water is an important resource that cycles through the environment (ACSSU222)
CROSS CURRICULUM PRIORITIES
Sustainability
GENERAL CAPABILITIES Ethical Understanding
CURRICULUM LINKS
© Busselton Water Schools Education Programme
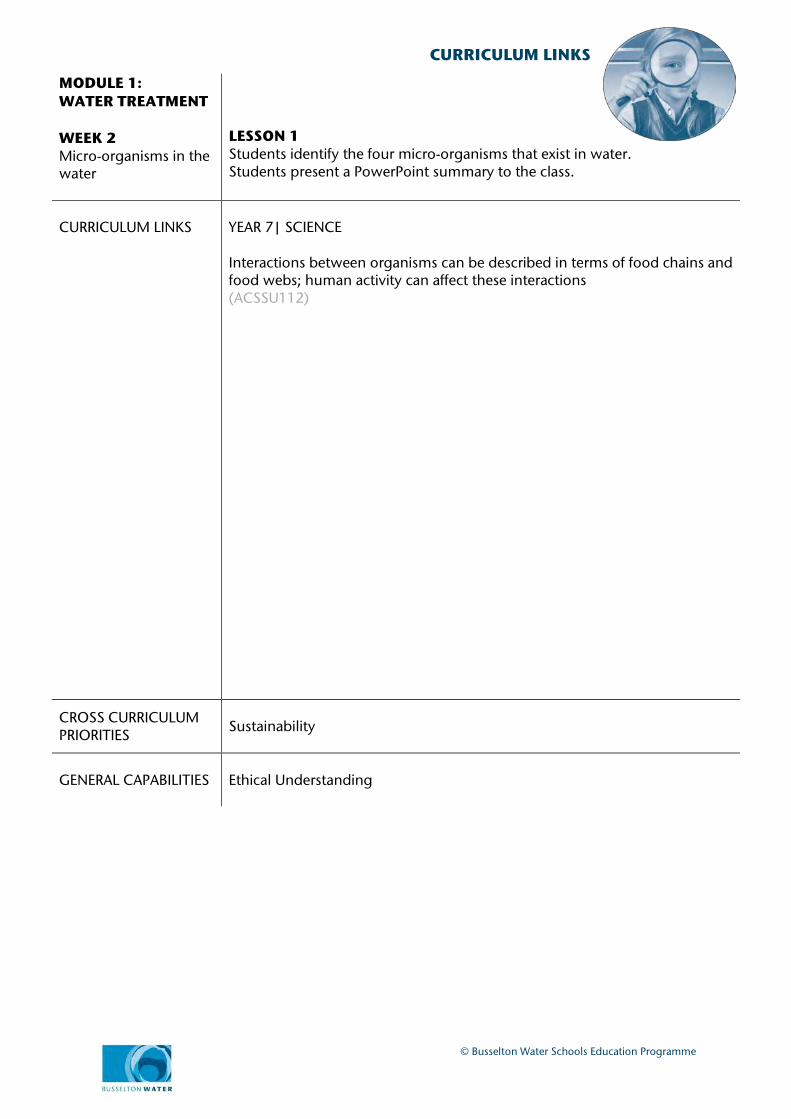
MODULE 1: WATER TREATMENT WEEK 2 Micro-organisms in the water
LESSON 1 Students identify the four micro-organisms that exist in water. Students present a PowerPoint summary to the class.
CURRICULUM LINKS
YEAR 7| SCIENCE Interactions between organisms can be described in terms of food chains and food webs; human activity can affect these interactions (ACSSU112)
CROSS CURRICULUM PRIORITIES
Sustainability
GENERAL CAPABILITIES Ethical Understanding

CURRICULUM LINKS
© Busselton Water Schools Education Programme
MODULE 1: WATER TREATMENT WEEK 2 Micro-organisms in the water
LESSON 2 Students research and report on some of the ways that drinking water can be protected.
CURRICULUM LINKS
YEAR 7 | SCIENCE Science understanding influences the development of practices in areas of human activity such as industry, agriculture and marine and terrestrial resource management (ACSHE121) Water is an important resource that cycles through the environment (ACSSU222) YEAR 9 | SCIENCE Multi-cellular organisms rely on coordinated and interdependent internal systems to respond to changes to their environment (ACSSU175)
CROSS CURRICULUM PRIORITIES
Sustainability
GENERAL CAPABILITIES Ethical Understanding
CURRICULUM LINKS
© Busselton Water Schools Education Programme
MODULE 1: WATER TREATMENT WEEK3 Water treatment options
LESSON 1 Students research and identify the different types of water treatment available in Australia.
CURRICULUM LINKS
YEAR 2 | SCIENCE Earth’s resources, including water, are used in a variety of ways (ACSSU032) YEAR 4 | GEOGRAPHY The sustainable management of waste from production and consumption (ACHGK025) YEAR 7 | SCIENCE Science understanding influences the development of practices in areas of human activity such as industry, agriculture and marine and terrestrial resource management (ACSHE121) Water is an important resource that cycles through the environment (ACSSU222)
CROSS CURRICULUM PRIORITIES Sustainability
GENERAL CAPABILITIES Ethical Understanding
CURRICULUM LINKS
© Busselton Water Schools Education Programme
MODULE 1: WATER TREATMENT WEEK3 Water treatment options
LESSON 2 Students make their own mini water filter.
CURRICULUM LINKS
YEAR 2 |SCIENCE Earth’s resources, including water, are used in a variety of ways (ACSSU032) YEAR 4 |GEOGRAPHY The sustainable management of waste from production and consumption (ACHGK025) YEAR 7 | SCIENCE Science understanding influences the development of practices in areas of human activity such as industry, agriculture and marine and terrestrial resource management (ACSHE121) Mixtures, including solutions, contain a combination of pure substances that can be separated using a range of techniques (ACSSU113)
CROSS CURRICULUM PRIORITIES
Sustainability
GENERAL CAPABILITIES Ethical Understanding

CURRICULUM LINKS
© Busselton Water Schools Education Programme
MODULE 1: WATER TREATMENT WEEK 4 Busselton Water Operations
LESSON 1 Visit the Busselton Water treatment plant.
CURRICULUM LINKS
YEAR 2 | SCIENCE Earth’s resources, including water, are used in a variety of ways(ACSSU032)
YEAR 4 | GEOGRAPHY The natural resources provided by the environment, and different views on how they could be used sustainably (ACHGK024)
The sustainable management of waste from production and consumption (ACHGK025)
Year 7 | SCIENCE Water is an important resource that cycles through the environment (ACSSU222)
YEAR 7 | GEOGRAPHY The classification of environmental resources and the forms that water takes as a resource (ACHGK037)
The ways that flows of water connect places as it moves through the environment and the way this affects places (ACHGK038)
The quantity and variability of Australia’s water resources compared with those in other continents (ACHGK039)
The nature of water scarcity and ways of overcoming it, including studies drawn from Australia and West Asia and/or North Africa (ACHGK040)
The economic, cultural, spiritual and aesthetic value of water for people, including Aboriginal and Torres Strait Islander Peoples and peoples of the Asia region (ACHGK041)
The factors that influence the decisions people make about where to live and their perceptions of the liveability of places (ACHGK043)
The influence of accessibility to services and facilities on the liveability of places (ACHGK044)
The influence of environmental quality on the liveability of places (ACHGK045)
The strategies used to enhance the liveability of places, especially for young people, including examples from Australia and Europe (ACHGK047)
CROSS CURRICULUM PRIORITIES Sustainability
GENERAL CAPABILITIES Ethical Understanding

CURRICULUM LINKS
© Busselton Water Schools Education Programme
MODULE 1: WATER TREATMENT WEEK 4 Busselton Water Operations
LESSON 2 Students map the existing Busselton Water treatment plants within Busselton.
CURRICULUM LINKS
YEAR 2 | SCIENCE Earth’s resources, including water, are used in a variety of ways(ACSSU032)
YEAR 4 | GEOGRAPHY The natural resources provided by the environment, and different views on how they could be used sustainably (ACHGK024)
The sustainable management of waste from production and consumption (ACHGK025)
Year 7 | SCIENCE Water is an important resource that cycles through the environment (ACSSU222)
YEAR 7 | GEOGRAPHY The classification of environmental resources and the forms that water takes as a resource (ACHGK037)
The ways that flows of water connect places as it moves through the environment and the way this affects places (ACHGK038)
The quantity and variability of Australia’s water resources compared with those in other continents (ACHGK039)
The nature of water scarcity and ways of overcoming it, including studies drawn from Australia and West Asia and/or North Africa (ACHGK040)
The economic, cultural, spiritual and aesthetic value of water for people, including Aboriginal and Torres Strait Islander Peoples and peoples of the Asia region (ACHGK041)
The factors that influence the decisions people make about where to live and their perceptions of the liveability of places (ACHGK043)
The influence of accessibility to services and facilities on the liveability of places (ACHGK044)
The influence of environmental quality on the liveability of places (ACHGK045)
The strategies used to enhance the liveability of places, especially for young people, including examples from Australia and Europe (ACHGK047)
CROSS CURRICULUM PRIORITIES Sustainability
GENERAL CAPABILITIES Ethical Understanding
CURRICULUM LINKS
© Busselton Water Schools Education Programme
MODULE 1: WATER TREATMENT WEEK5 Water treatment now
LESSON 1 Students research and present the reasons for Busselton Water changing to chlorination treatment.
CURRICULUM LINKS
YEAR 4 | GEOGRAPHY The sustainable management of waste from production and consumption (ACHGK025) YEAR 7 | SCIENCE Science understanding influences the development of practices in areas of human activity such as industry, agriculture and marine and terrestrial resource management (ACSHE121)
CROSS CURRICULUM PRIORITIES Sustainability
GENERAL CAPABILITIES Ethical Understanding
CURRICULUM LINKS
© Busselton Water Schools Education Programme
MODULE 1: WATER TREATMENT WEEK5 Water treatment now
LESSON 2 Students conduct a taste/smell test with chlorine/non chlorine water and record their findings.
CURRICULUM LINKS
SCIENCE ENQUIRY – ACROSS ALL YEAR LEVELS Science Enquiry involves identifying and posing questions; planning, conducting and reflecting on investigations; processing, analysing and interpreting evidence; and communicating findings. This strand is concerned with evaluating claims, investigating ideas, solving problems, drawing valid conclusions and developing evidence-based arguments. Specific curriculum links to the following year levels; YEAR 2 | SCIENCE Earth’s resources, including water, are used in a variety of ways (ACSSU032) YEAR 4 | GEOGRAPHY The sustainable management of waste from production and consumption (ACHGK025) YEAR 7 | GEOGRAPHY The influence of environmental quality on the liveability of places (ACHGK045)
CROSS CURRICULUM PRIORITIES
Sustainability
GENERAL CAPABILITIES Ethical Understanding
CURRICULUM LINKS
© Busselton Water Schools Education Programme
MODULE 1: WATER TREATMENT WEEK 6 Water Treatment
LESSON 1 Students draw their school and all areas where water is used. Students then indicate how water enters/exits their school premises.
CURRICULUM LINKS
YEAR 2 | SCIENCE Earth’s resources, including water, are used in a variety of ways (ACSSU032) YEAR 4 | GEOGRAPHY The natural resources provided by the environment, and different views on how they could be used sustainably (ACHGK024) YEAR 7 | GEOGRAPHY The classification of environmental resources and the forms that water takes as a resource (ACHGK037)
CROSS CURRICULUM PRIORITIES Sustainability
GENERAL CAPABILITIES Ethical Understanding

CURRICULUM LINKS
© Busselton Water Schools Education Programme
MODULE 1: WATER TREATMENT WEEK 6 Water Treatment
LESSON 1 Students complete similar exercise for their home and share their experiences with the class.
CURRICULUM LINKS
YEAR 2 | SCIENCE Earth’s resources, including water, are used in a variety of ways (ACSSU032) YEAR 4 | GEOGRAPHY The natural resources provided by the environment, and different views on how they could be used sustainably (ACHGK024) YEAR 7 | GEOGRAPHY The classification of environmental resources and the forms that water takes as a resource (ACHGK037)
CROSS CURRICULUM PRIORITIES
Sustainability
GENERAL CAPABILITIES Ethical Understanding
CURRICULUM LINKS
© Busselton Water Schools Education Programme
MODULE 1: WATER TREATMENT WEEK 7 Wastewater Treatment
LESSON 1 Students visit wastewater treatment plant.
CURRICULUM LINKS
YEAR 4 | GEOGRAPHY The sustainable management of waste from production and consumption (ACHGK025) YEAR 7 | GEOGRAPHY The classification of environmental resources and the forms that water takes as a resource (ACHGK037) The nature of water scarcity and ways of overcoming it, including studies drawn from Australia and West Asia and/or North Africa (ACHGK040 The influence of environmental quality on the liveability of places (ACHGK045)
CROSS CURRICULUM PRIORITIES Sustainability
GENERAL CAPABILITIES Ethical Understanding

CURRICULUM LINKS
© Busselton Water Schools Education Programme
MODULE 1: WATER TREATMENT WEEK 7 Wastewater Treatment
LESSON 2 Students explore the impact on society if we didn’t treat sewerage.
CURRICULUM LINKS
YEAR 4 | GEOGRAPHY The sustainable management of waste from production and consumption (ACHGK025) YEAR 7| GEOGRAPHY The classification of environmental resources and the forms that water takes as a resource (ACHGK037)
The ways that flows of water connect places as it moves through the environment and the way this affects places (ACHGK038)
The quantity and variability of Australia’s water resources compared with those in other continents (ACHGK039)
The nature of water scarcity and ways of overcoming it, including studies drawn from Australia and West Asia and/or North Africa (ACHGK040)
The economic, cultural, spiritual and aesthetic value of water for people, including Aboriginal and Torres Strait Islander Peoples and peoples of the Asia region (ACHGK041)
The factors that influence the decisions people make about where to live and their perceptions of the liveability of places (ACHGK043)
The influence of accessibility to services and facilities on the liveability of places (ACHGK044)
The influence of environmental quality on the liveability of places (ACHGK045)
The strategies used to enhance the liveability of places, especially for young people, including examples from Australia and Europe (ACHGK047)
CROSS CURRICULUM PRIORITIES Sustainability
GENERAL CAPABILITIES Ethical Understanding

CURRICULUM LINKS
© Busselton Water Schools Education Programme
MODULE 1: WATER TREATMENT WEEK 8 Alternative technologies – grey water
LESSON 1 Students identify where in the home and school could water be captured and recycled.
CURRICULUM LINKS
YEAR 4 | GEOGRAPHY The sustainable management of waste from production and consumption (ACHGK025) YR 7 | GEOGRAPHY The classification of environmental resources and the forms that water takes as a resource (ACHGK037) The nature of water scarcity and ways of overcoming it, including studies drawn from Australia and West Asia and/or North Africa (ACHGK040) The quantity and variability of Australia’s water resources compared with those in other continents (ACHGK039)
CROSS CURRICULUM PRIORITIES Sustainability
GENERAL CAPABILITIES Ethical Understanding
CURRICULUM LINKS
© Busselton Water Schools Education Programme
MODULE 1: WATER TREATMENT WEEK 8 Alternative technologies – grey water
LESSON 2 Students identify new technologies that are available around the world.
CURRICULUM LINKS
YEAR 7 | SCIENCE Science and technology contribute to finding solutions to a range of contemporary issues; these solutions may impact on other areas of society and involve ethical considerations (ACSHE120) Science understanding influences the development of practices in areas of human activity such as industry, agriculture and marine and terrestrial resource management (ACSHE121) YEAR 7| GEOGRAPHY The classification of environmental resources and the forms that water takes as a resource (ACHGK037) The ways that flows of water connect places as it moves through the environment and the way this affects places (ACHGK038) The quantity and variability of Australia’s water resources compared with those in other continents (ACHGK039) The nature of water scarcity and ways of overcoming it, including studies drawn from Australia and West Asia and/or North Africa (ACHGK040)
CROSS CURRICULUM PRIORITIES Sustainability
GENERAL CAPABILITIES Ethical Understanding
CURRICULUM LINKS
© Busselton Water Schools Education Programme
MODULE 1: WATER TREATMENT WEEK 9 Alternative technologies – desalination plants
LESSON 1 View how a desalination plant operates.
CURRICULUM LINKS
YEAR 7 | GEOGRAPHY The nature of water scarcity and ways of overcoming it, including studies drawn from Australia and West Asia and/or North Africa (ACHGK040)
CROSS CURRICULUM PRIORITIES
Sustainability
GENERAL CAPABILITIES Ethical Understanding
CURRICULUM LINKS
© Busselton Water Schools Education Programme
MODULE 1: WATER TREATMENT WEEK 9 Alternative technologies – desalination plants
LESSON 2 Students make their own solar desalination plant.
CURRICULUM LINKS
YEAR 7 | GEOGRAPHY The nature of water scarcity and ways of overcoming it, including studies drawn from Australia and West Asia and/or North Africa (ACHGK040)
CROSS CURRICULUM PRIORITIES
Sustainability
GENERAL CAPABILITIES Ethical Understanding
CURRICULUM LINKS
© Busselton Water Schools Education Programme
MODULE 1: WATER TREATMENT WEEK 10 Water Treatment in other countries
LESSON 1 View the slide show, “Water around the world.” Students complete the e-card about their experience.
CURRICULUM LINKS
YEAR 7 | GEOGRAPHY The nature of water scarcity and ways of overcoming it, including studies drawn from Australia and West Asia and/or North Africa (ACHGK040) The factors that influence the decisions people make about where to live and their perceptions of the liveability of places (ACHGK043) The influence of environmental quality on the liveability of places (ACHGK045)
CROSS CURRICULUM PRIORITIES Sustainability
GENERAL CAPABILITIES Ethical Understanding

CURRICULUM LINKS
© Busselton Water Schools Education Programme
MODULE 1: WATER TREATMENT WEEK 10 Water Treatment in other countries
LESSON 2 Students prepare a PowerPoint slide comparing their water supply and treatment to those in Uganda.
CURRICULUM LINKS
YEAR 7 | GEOGRAPHY The nature of water scarcity and ways of overcoming it, including studies drawn from Australia and West Asia and/or North Africa (ACHGK040) The factors that influence the decisions people make about where to live and their perceptions of the liveability of places (ACHGK043) The influence of environmental quality on the liveability of places (ACHGK045)
CROSS CURRICULUM PRIORITIES Sustainability
GENERAL CAPABILITIES Ethical Understanding
WEEK 1: Where does our water come from?
MODULE 1:WATER TREATMENT
MO
DU
LE 1W
EEK 1

CURRICULUM LINKS
© Busselton Water Schools Education Programme
MODULE 1: WATER TREATMENT WEEK 1 Where does our water come from?
LESSON 1 Students identify the sources of water for the South West and in particular Busselton.
CURRICULUM LINKS
YEAR 2 | SCIENCE Earth’s resources, including water, are used in a variety of ways (ACSSU032) YEAR 4 | GEOGRAPHY The natural resources provided by the environment, and different views on how they could be used sustainably (ACHGK024) YEAR 7 | GEOGRAPHY The ways that flows of water connect places as it moves through the environment and the way this affects places (ACHGK038) The classification of environmental resources and the forms that water takes as a resource (ACHGK037) YEAR 7 | SCIENCE Water is an important resource that cycles through the environment (ACSSU222)
CROSS CURRICULUM PRIORITIES
Sustainability
GENERAL CAPABILITIES Ethical Understanding

CURRICULUM LINKS
© Busselton Water Schools Education Programme
MODULE 1: WATER TREATMENT WEEK 1 Where does our water come from?
LESSON 2 Students identify and map the locations of water sources in the South West.
CURRICULUM LINKS
Year 2 | SCIENCE Earth’s resources, including water, are used in a variety of ways (ACSSU032) Year 4 |GEOGRAPHY The natural resources provided by the environment, and different views on how they could be used sustainably (ACHGK024) YEAR 7 |GEOGRAPHY The ways that flows of water connect places as it moves through the environment and the way this affects places (ACHGK038) The classification of environmental resources and the forms that water takes as a resource (ACHGK037) Evaluate sources for their reliability and usefulness and represent data in a range of appropriate forms, for example, climate graphs, compound column graphs, population pyramids, tables, field sketches and annotated diagrams, with and without the use of digital and spatial technologies (ACHGS049) YEAR 7 | SCIENCE Water is an important resource that cycles through the environment (ACSSU222)
CROSS CURRICULUM PRIORITIES
Sustainability
GENERAL CAPABILITIES Ethical Understanding
TEACHER’S NOTES
MODULE 1: WATER TREATMENTWEEK 1
Where does our water come from?
Review documents as follows:
• Busselton Water licence area map• Water supply and treatment in Busselton diagram• Water Facts WF9 – Western Australia’s groundwater resources and support notes• Busselton Water Learning Pack• Busselton Water – Your RF Meter and Leak Alarm Detection• Busselton Capel groundwater area sub-area reference sheet• Water in South West WA• Statewide dam storage levels
Additional information
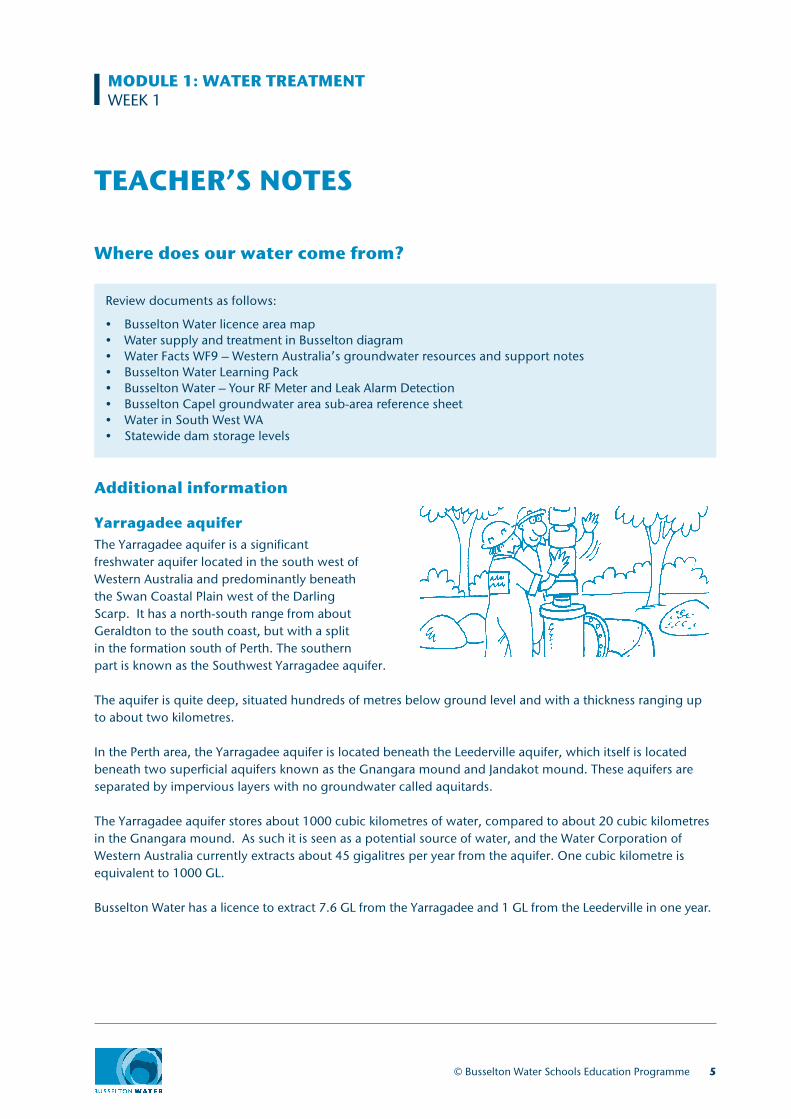
Yarragadee aquiferThe Yarragadee aquifer is a significant freshwater aquifer located in the south west of Western Australia and predominantly beneath the Swan Coastal Plain west of the Darling Scarp. It has a north-south range from about Geraldton to the south coast, but with a split in the formation south of Perth. The southern part is known as the Southwest Yarragadee aquifer.
The aquifer is quite deep, situated hundreds of metres below ground level and with a thickness ranging up to about two kilometres.
In the Perth area, the Yarragadee aquifer is located beneath the Leederville aquifer, which itself is located beneath two superficial aquifers known as the Gnangara mound and Jandakot mound. These aquifers are separated by impervious layers with no groundwater called aquitards.
The Yarragadee aquifer stores about 1000 cubic kilometres of water, compared to about 20 cubic kilometres in the Gnangara mound. As such it is seen as a potential source of water, and the Water Corporation of Western Australia currently extracts about 45 gigalitres per year from the aquifer. One cubic kilometre is equivalent to 1000 GL.
Busselton Water has a licence to extract 7.6 GL from the Yarragadee and 1 GL from the Leederville in one year.
© Busselton Water Schools Education Programme 5
MODULE 1: WATER TREATMENTWEEK 1: TEACHER’S NOTES
Ultimately the Yarragadee aquifer is replenished by rainfall. This recharging is usually where there are outcroppings near other aquifers like the Leederville Aquifer. There are also outcrops near the surface in the vicinity of the Blackwood River. Current models estimate this recharge at about 280 to 340 GL per year. This groundwater can remain in the aquifer for many years; in some areas the age of the groundwater is over 30,000 years.
Geologically, the aquifer is part of what is known as the Yarragadee formation, which is a relatively thick geological unit in the Perth basin. Formed during the Jurassic period, the Yarragadee formation is composed primarily of non-marine fluviatile feldspathic, poorly sorted sandstones which are porous and poorly cemented which allows for considerable groundwater reserves. It grades from a shale-siltstone dominated base to a cleaner sandstone in the upper portions of the formation, probably representing increased subsidence or filling of the basin during the late Jurassic period.
New technologies
Southern Seawater Desalination plant The Water Corporation opened the Southern Seawater Desalination plant in 2011, the second seawater desalination plant on the coast about 160 kilometres south of Perth. It is designed to have an initial annual output of 50 gigalitres – slightly higher than that of the Perth plant – with the potential to double this to about 100 gigalitres.
The plant operates on par with the Kwinana model, utilising reverse osmosis technology. The reverse osmosis process uses high pressure and a very fine membrane to extract fresh water from salty water. The membrane acts like a strainer, allowing water molecules to pass through and retaining salt and other impurities.
Environmental considerations were also a major factor in the design of this plant, costing about $A955 million. The two climate independent seawater desalination plants were designed with the combined capacity to provide almost one third of Perth’s drinking water.
Surface water – dams
• Balingup Dam• Big Brook Dam• Boyup Brook Dam• Drakes Brook Dam• Dumpling Gully (1 and 2) Greenbushes• Glen Mervyn Dam• Harris Dam• Harvey Dam• Hester Dam• Kirup Dam• Logue Brook Dam• Manjimup Dam
• Millstream Dam• Mungalup Dam• Nannup Dam• Phillips Creek Dam• Quinninup Dam• Samson Brook Dam• Stirling Dam• Ten Mile Brook Dam• Waroona Dam• Wellington Dam
6 © Busselton Water Schools Education Programme
MODULE 1: WATER TREATMENTWEEK 1: TEACHER’S NOTES
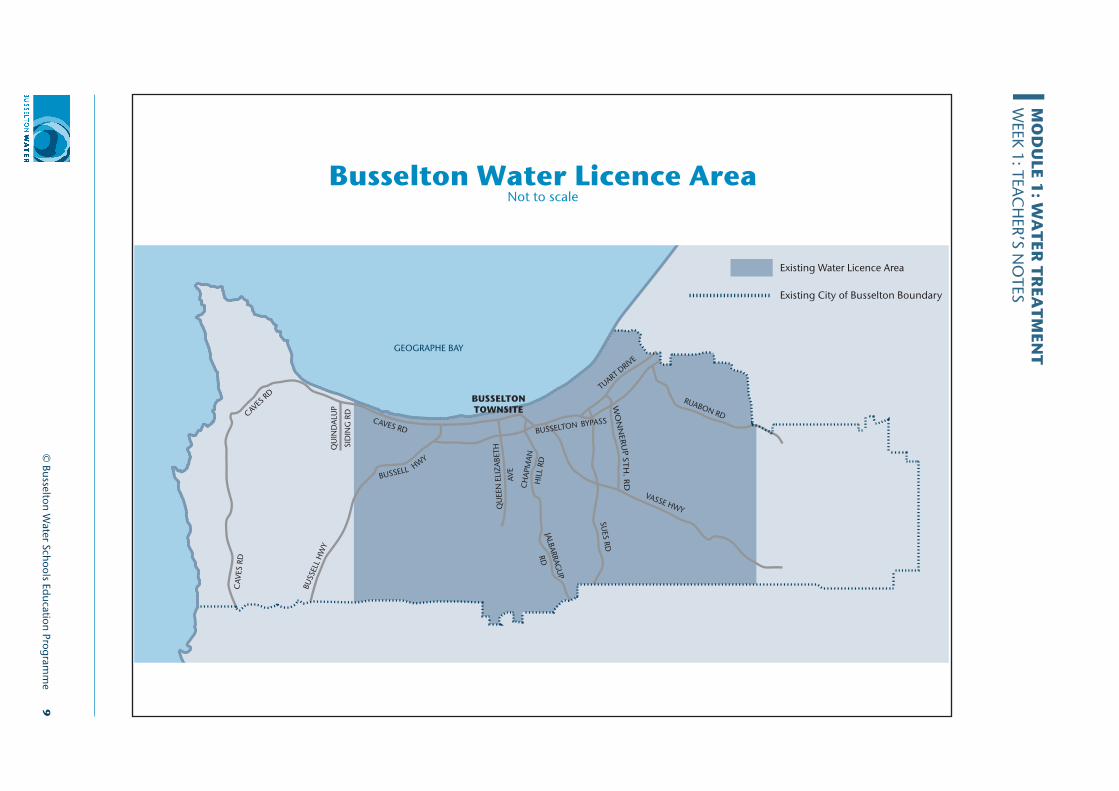
Discuss with the students that there are various water sources that are available to residents in the South West and Busselton. These water sources comprise of groundwater (Yarragadee, Leederville aquifers), surface water such as dams and new technologies such as desalination plants. Provide students with a copy of the map indicating which area is managed by Busselton Water. Explain that there are other service providers in the South West including Aqwest (Bunbury) and Water Corporation. Advise students that Busselton Water and Aqwest are only responsible for providing drinking water, whereas Water Corporation provide sewerage treatment across the South West and drinking water in those areas not serviced by Busselton Water or Aqwest.
Have students research on the internet the various water sources that are available in the South West. Students choose one of these sources and provide a detailed report outlining:• Where is this water source located?• Which government agency is responsible for managing this water source?• Which areas does this water source service?• What is the size of this water source?• Is there a life expectancy for this water source?• Any additional information that is relevant.
LESSON ONE
In groups students plot as many of the various water sources in the South West on a map of the area. Students colour code the water sources according to ground water, surface water and alternative technologies. Students then place their maps on display and compare to see which sources they omitted from their maps.
LESSON TWO
Additional creative ideas
Persuasive writing/debateShould Perth be able to access the Yarragadee for its water requirements? Students write an essay outlining both sides of the argument.
Assessment/evaluationWhat other water technologies could WA consider when planning for future supply? Research new technologies that are being trialed elsewhere in the world. Create a power point presentation with the best solution you think would suit the South West.
How is the water derived from the Yarragadee used in the South West ie what is the allocation for farming usage, houses etc. How do you think this will change over time?
Create a terrarium to demonstrate the water cycle.
© Busselton Water Schools Education Programme 7
© Busselton W
ater Schools Education Programm
e 9
MO
DU
LE 1: W
ATER
TREA
TMEN
TW
EEK 1: TEAC
HER’S N
OTES
Busselton Water Licence AreaNot to scale
GEOGRAPHE BAY
BUSSELTONTOWNSITE
CAV
ES R
D
CAVES RD
CAVES RD
QU
IND
ALU
P
SID
ING
RD
BUSS
ELL
HW
Y
BUSSELL HWY
QU
EEN
ELI
ZABE
TH
AVE
JALBARRAGU
P
RD
CH
APM
AN
HIL
L RD
TUART DRIVE
SUES RD
WO
NN
ERU
P
RUABON RD
VASSE HWY
BUSSELTON BYPASS
Existing City of Busselton Boundary
Existing Water Licence Area
ST
H. R
D
10
© Busselton W
ater Schools Education Programm
e
MO
DU
LE 1: W
ATER
TREA
TMEN
TW
EEK 1: TEAC
HER’S N
OTES
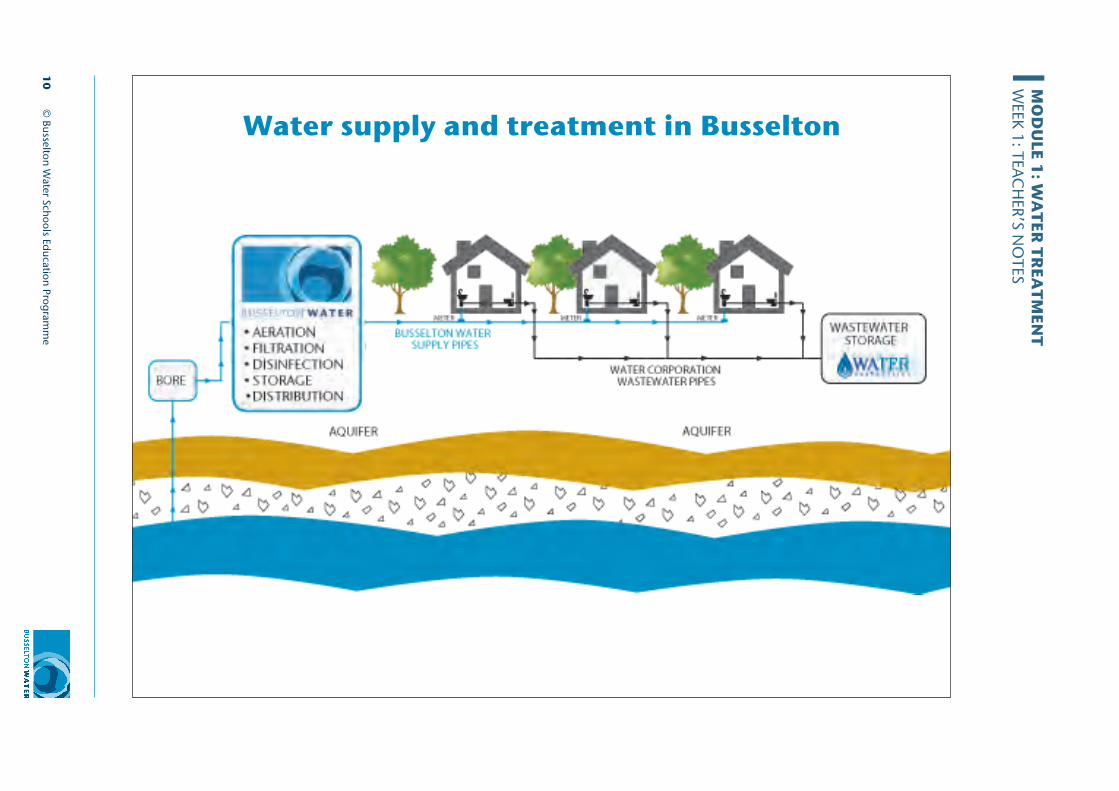
Water supply and treatment in Busselton
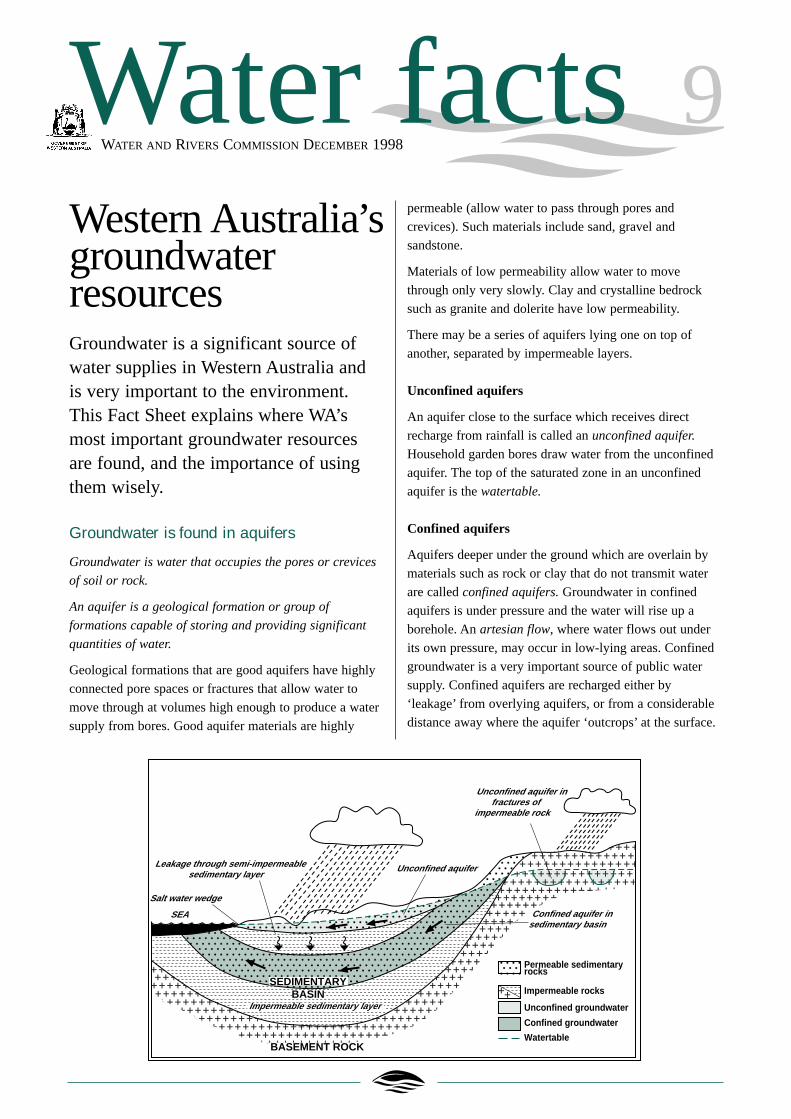
Western Australia’sgroundwaterresourcesGroundwater is a significant source ofwater supplies in Western Australia and is very important to the environment.This Fact Sheet explains where WA’smost important groundwater resourcesare found, and the importance of usingthem wisely.
Groundwater is found in aquifers
Groundwater is water that occupies the pores or crevices
of soil or rock.
An aquifer is a geological formation or group of
formations capable of storing and providing significant
quantities of water.
Geological formations that are good aquifers have highly
connected pore spaces or fractures that allow water to
move through at volumes high enough to produce a water
supply from bores. Good aquifer materials are highly
permeable (allow water to pass through pores and
crevices). Such materials include sand, gravel and
sandstone.
Materials of low permeability allow water to move
through only very slowly. Clay and crystalline bedrock
such as granite and dolerite have low permeability.
There may be a series of aquifers lying one on top of
another, separated by impermeable layers.
Unconfined aquifers
An aquifer close to the surface which receives direct
recharge from rainfall is called an unconfined aquifer.
Household garden bores draw water from the unconfined
aquifer. The top of the saturated zone in an unconfined
aquifer is the watertable.
Confined aquifers
Aquifers deeper under the ground which are overlain by
materials such as rock or clay that do not transmit water
are called confined aquifers. Groundwater in confined
aquifers is under pressure and the water will rise up a
borehole. An artesian flow, where water flows out under
its own pressure, may occur in low-lying areas. Confined
groundwater is a very important source of public water
supply. Confined aquifers are recharged either by
‘leakage’ from overlying aquifers, or from a considerable
distance away where the aquifer ‘outcrops’ at the surface.
Water facts 9WATER AND RIVERS COMMISSION DECEMBER 1998
BASEMENT ROCK
SEDIMENTARYBASIN
Leakage through semi-impermeablesedimentary layer
Unconfined aquifer
Confined aquifer insedimentary basin
Unconfined aquifer infractures of
impermeable rock
Salt water wedge
SEA
Permeable sedimentaryrocks
Impermeable rocks
Unconfined groundwater
Confined groundwater
Watertable
Impermeable sedimentary layer
Where is WA’s groundwater found?
Groundwater basins
The largest bodies of groundwater are found in extensive
deposits of sand or sandstone. These cover 40% of
Western Australia (see map), and may be as much as
20 kilometres thick. They are called sedimentary basins.
Fresh groundwater generally occurs in the uppermost few
hundred metres but can extend down to a depth of three
kilometres. Below this, groundwater is mostly saline
(salty).
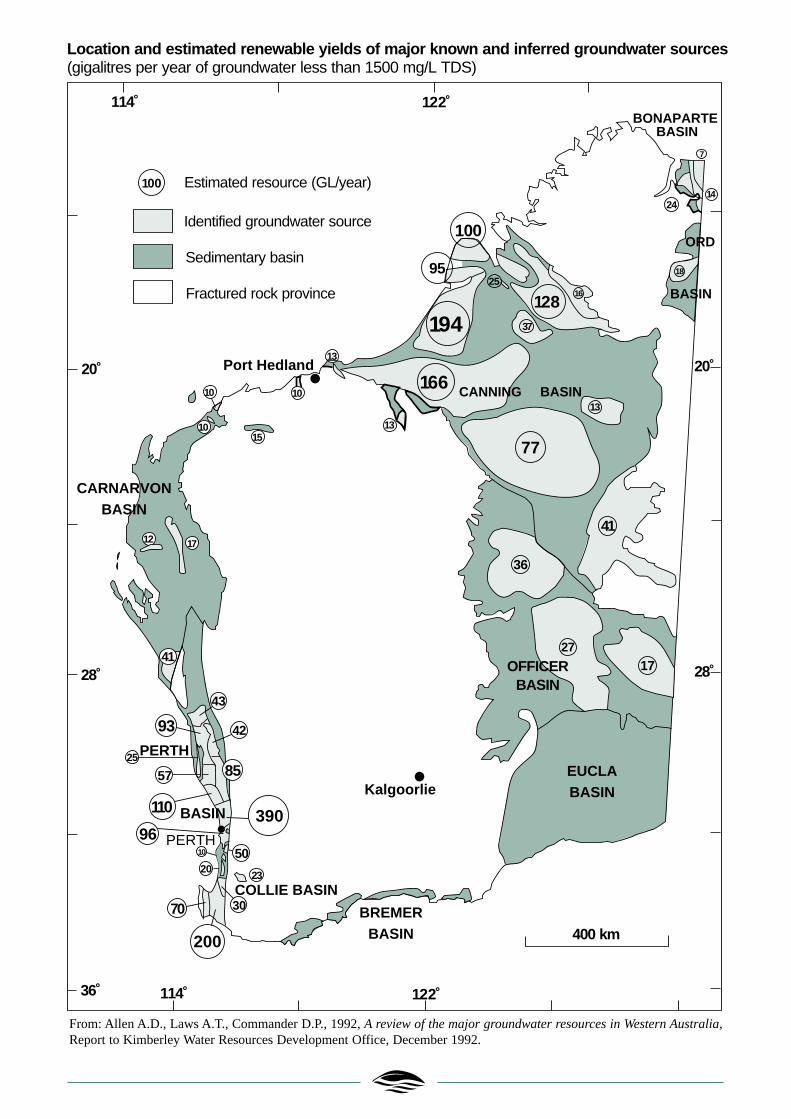
The confined aquifers in the sedimentary basins contain
most of the state’s groundwater resources. The Canning
Basin has the largest amount of stored groundwater. The
map shows the distribution of Western Australia’s major
groundwater resources.
Other sources
Unconfined groundwater can also be important for water
supplies. The largest unconfined groundwater source
currently used for water supply is the Gnangara Mound
just to the north of Perth. Deposits of sand, gravel and
limestone near river beds can also yield groundwater
supplies.
Where is groundwater not available?
The remaining 60% of the State is made up of hard
crystalline basement rocks, such as granite and basalt, or
of sedimentary rocks which have no pore spaces. These
rocks may contain some water in fractures in the upper
few hundred metres which can provide small local sources
of groundwater. There are poor prospects of groundwater
from the weathering of these rocks.
How much groundwater?
The confined aquifers in the sedimentary basins contain
most of the State’s groundwater. The largest groundwater
resource is believed to be the Canning Basin, which has
an estimated storage of over 12 million gigalitres (one
gigalitre is a thousand million litres).
Groundwater which is fresh enough to contribute to use
for water supply may contain up to 1500 milligrams per
litre total dissolved salts (mg/L TDS). Groundwater in
some areas is only suitable for stock (up to 14 000 mg/L),
or ore processing (up to 200 000 mg/L).
The annual renewable amount of groundwater in Western
Australia’s sedimentary basins that is fresh enough to
contribute to water supplies is estimated to be about 2500
gigalitres per year, of which approximately 1400 gigalitres
is in the Perth Basin. This is about twelve times Perth’s
current scheme water consumption.
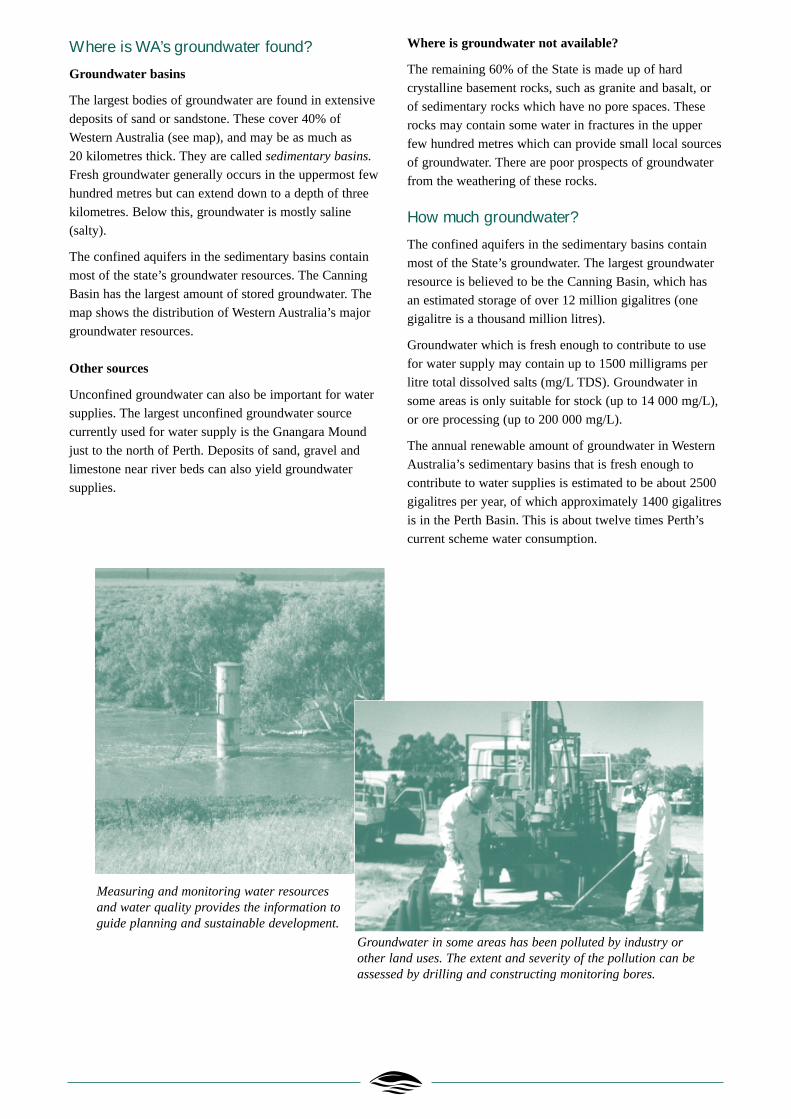
Measuring and monitoring water resourcesand water quality provides the information toguide planning and sustainable development.
Groundwater in some areas has been polluted by industry orother land uses. The extent and severity of the pollution can beassessed by drilling and constructing monitoring bores.
7
2414
BONAPARTE BASIN
ORD
BASIN
12
12816
194
25
CANNING BASIN13
166
41
EUCLABASIN
BREMERBASIN
COLLIE BASIN
Kalgoorlie
200
70 30
50
23
10PERTH96
BASIN 390•
110
PERTH25
57
20
85
4293
41
17
CARNARVONBASIN
1510
10
Port Hedland•10
13
13
114˚ 122˚
114˚ 122˚36˚
28˚
20˚ 20˚
28˚
400 km
100 Estimated resource (GL/year)
Identified groundwater source
Sedimentary basin
Fractured rock province
37
18
77
43
12
Location and estimated renewable yields of major known and inferred groundwater sources(gigalitres per year of groundwater less than 1500 mg/L TDS)
•
36
2717OFFICER
BASIN
100
95
From: Allen A.D., Laws A.T., Commander D.P., 1992, A review of the major groundwater resources in Western Australia,Report to Kimberley Water Resources Development Office, December 1992.
A renewable resource
Much of our rainfall flows away as surface runoff,
evaporates or is used by vegetation. However, a
proportion of rainfall percolates below the reach of plant
roots and recharges aquifers. The proportion of rainfall
contributing to groundwater (recharge) ranges from nearly
50% below pasture in the wetter south west of the state, to
a fraction of a per cent in desert areas. Of the 1700 million
kilolitres of rainfall that fall on the Gnangara Mound on
average each year, about 500 million kilolitres recharges
the Mound.
The recharge is a renewable resource and this quantity can
be used each year on a sustainable basis. The amount of
renewable groundwater is small in comparison to the total
amount of groundwater stored beneath the ground. Fresh
groundwater storage in the sedimentary basins is
estimated to be over a thousand times the renewable
quantity. The additional groundwater storage can be drawn
upon in times of drought, when the rainfall supply is
insufficient.
Further reading
Groundwater pollution, Water Facts 10, Water and Rivers
Commission, 1998.
Hydrogeology and groundwater resources of the Perth
Metropolitan Area, Geological Survey of Western
Australia, Bulletin 142.
The water cycle, Water Facts 7, Water and Rivers
Commission, 1998.
What is groundwater? Water Facts 8, Water and Rivers
Commission, 1998.
The role of the Water and RiversCommissionThe Water and Rivers Commission manages Western
Australia’s water resources to enable sustainable
development and maintain environmental and social
values.
The Commission manages use of groundwater
resources to balance the needs of people and the
environment by:
• carrying out research, investigations and monitoring
to provide the information needed to guide planning
and management
• allocating groundwater to make sure that it is shared
fairly between users and the environment is protected
Allocation involves:
• allocating water for uses including public and private
water supplies
• planning for future water supplies
• licensing surface and groundwater use, including the
Water Corporation’s public water supply
developments
• education and training on the efficient use of water.
The Commission also has an important role in
protecting water quality (see Water Facts 10).
For more information contact
Level 2 Hyatt Centre
3 Plain Street
East Perth Western Australia 6004
Telephone: (08) 9278 0300
Facsimile: (08) 9278 0301
Website: http://www.wrc.wa.gov.au
or your regional office.
This Water Facts sheet is one in a series providing information on
water issues of interest to the community.
Printed on recycled paper December 1998
ISSN 1326-2042 ISBN 0 7309 7401 4
WATER AND RIVERS COMMISSION
LEARNING PACK
DO YOU KNOW WHERE OUR WATER COMES FROM?
You might have poured it from a tap or bought it at the store, but it had to come from somewhere before that. Any guesses?
The ocean? That would be a good guess because the ocean contains most of earth’s water, about 97%! But would you drink a glass of seawater?
No! The salt would make you sick.
We need fresh water. Not just any fresh water though. Did you know most of the world’s fresh water is frozen solid? Nearly 80% is locked up in ice sheets and glaciers. We can’t drink that.
So where do you get your drinking water from? In Busselton our water comes from underground sources called aquifers.
It’s the water hidden below our feet, some rainwater seeps into the ground. This ground water becomes part of an aquifer, which is an underground water supply. Water in an aquifer is usually cleaner than surface water, especially if it’s deep or has been underground a long time.
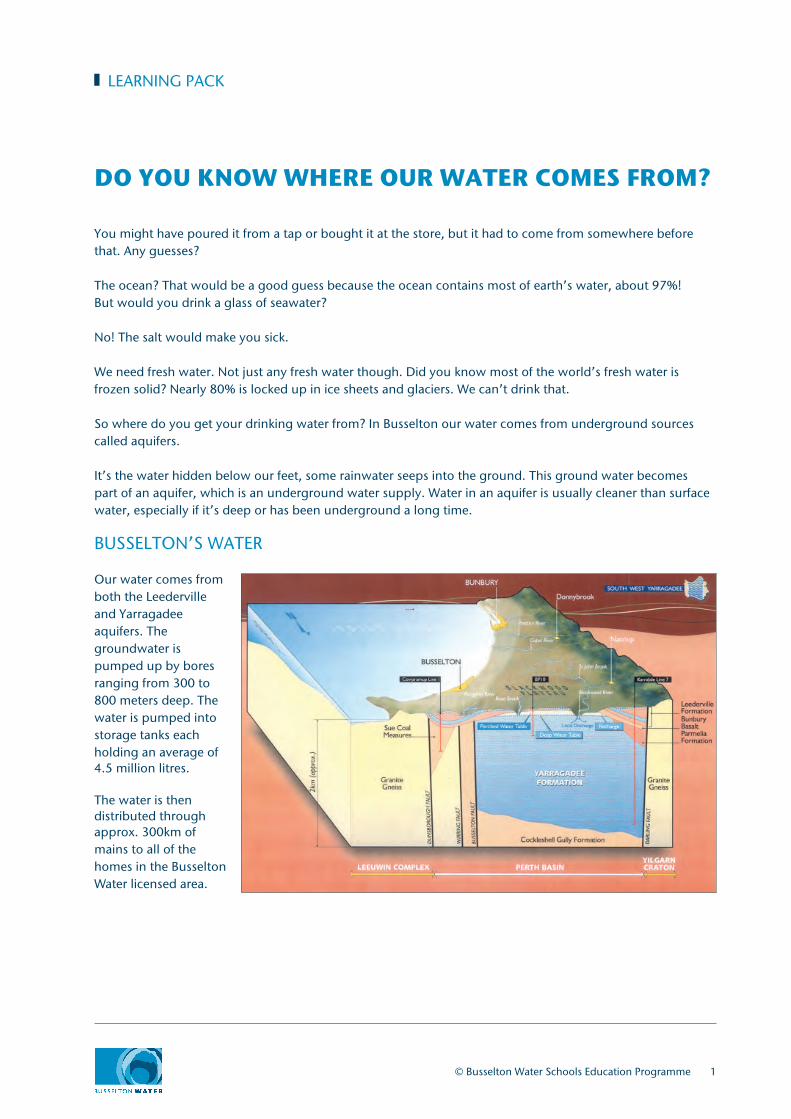
BUSSELTON’S WATER
Our water comes from both the Leederville and Yarragadee aquifers. The groundwater is pumped up by bores ranging from 300 to 800 meters deep. The water is pumped into storage tanks each holding an average of 4.5 million litres. The water is then distributed through approx. 300km of mains to all of the homes in the Busselton Water licensed area.
© Busselton Water Schools Education Programme 1
LEARNING PACK
2 © Busselton Water Schools Education Programme
LEARNING PACK
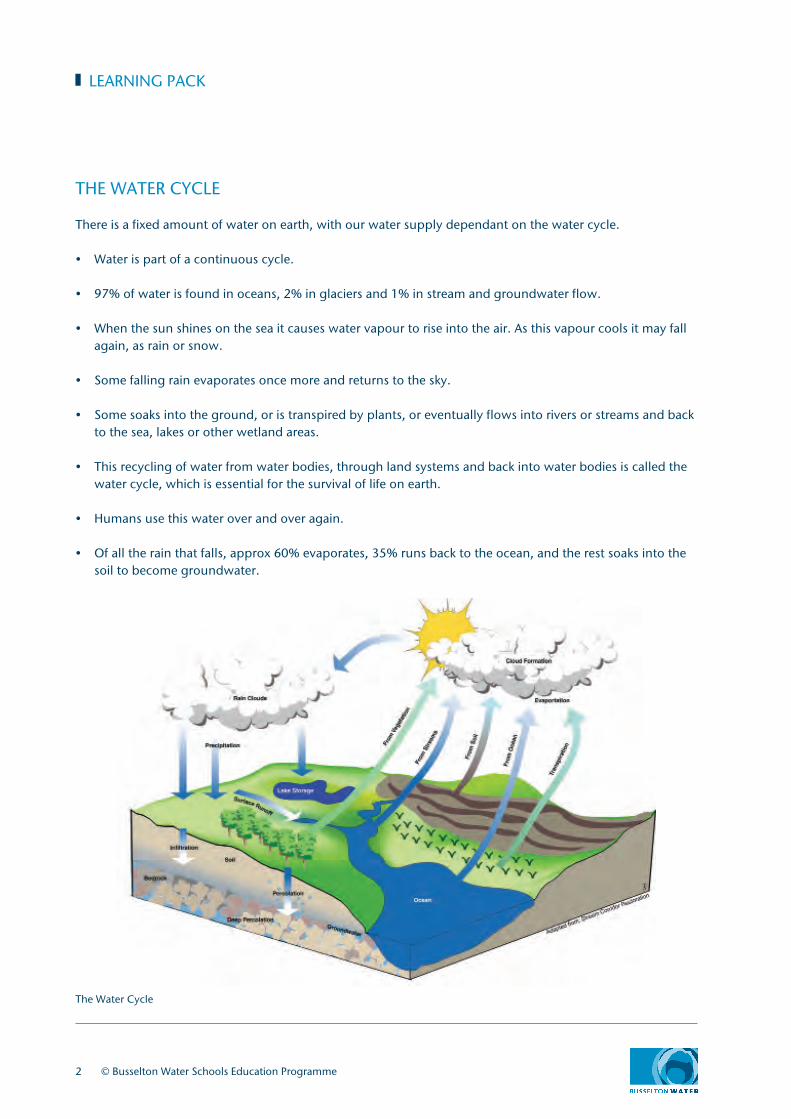
THE WATER CYCLE
There is a fixed amount of water on earth, with our water supply dependant on the water cycle.
• Water is part of a continuous cycle.
• 97% of water is found in oceans, 2% in glaciers and 1% in stream and groundwater flow.
• When the sun shines on the sea it causes water vapour to rise into the air. As this vapour cools it may fall again, as rain or snow.
• Some falling rain evaporates once more and returns to the sky.
• Some soaks into the ground, or is transpired by plants, or eventually flows into rivers or streams and back to the sea, lakes or other wetland areas.
• This recycling of water from water bodies, through land systems and back into water bodies is called the water cycle, which is essential for the survival of life on earth.
• Humans use this water over and over again.
• Of all the rain that falls, approx 60% evaporates, 35% runs back to the ocean, and the rest soaks into the soil to become groundwater.
The Water Cycle
© Busselton Water Schools Education Programme 3
LEARNING PACK
HOW DOES BUSSELTON WATER GET THE WATER FROM THE AQUIFER TO YOUR HOME?
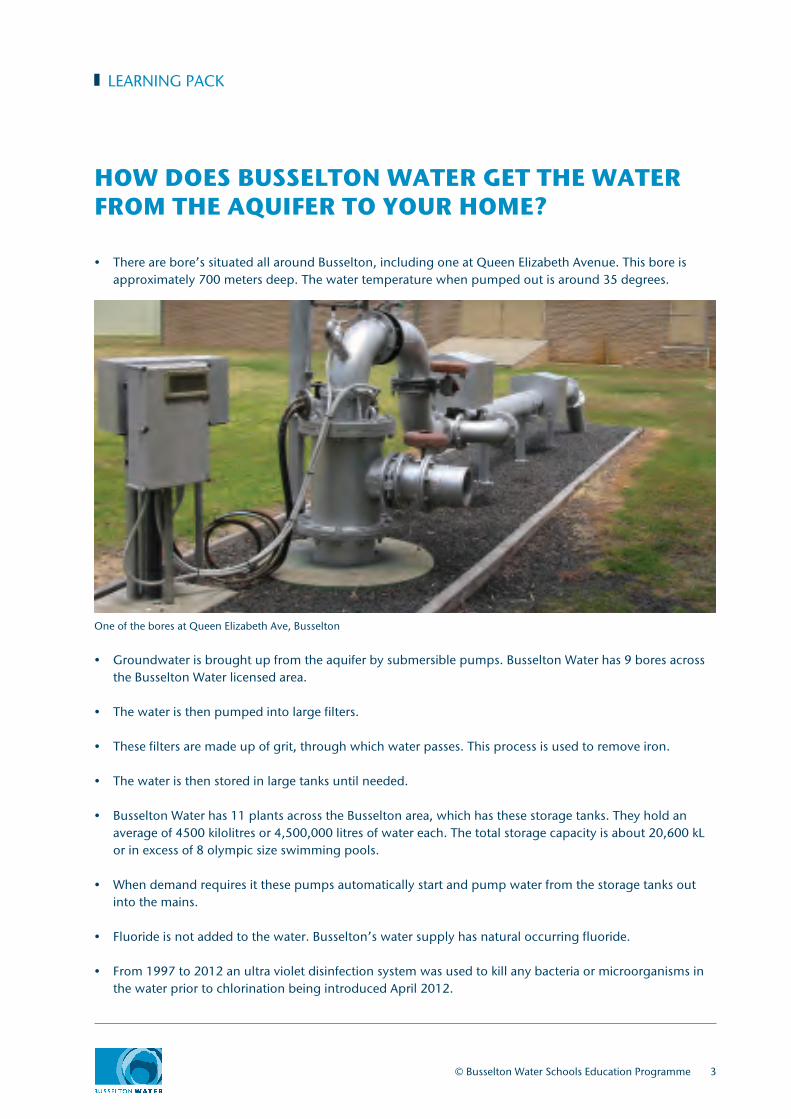
• There are bore’s situated all around Busselton, including one at Queen Elizabeth Avenue. This bore is approximately 700 meters deep. The water temperature when pumped out is around 35 degrees.
One of the bores at Queen Elizabeth Ave, Busselton
• Groundwater is brought up from the aquifer by submersible pumps. Busselton Water has 9 bores across the Busselton Water licensed area.
• The water is then pumped into large filters.
• These filters are made up of grit, through which water passes. This process is used to remove iron.
• The water is then stored in large tanks until needed.
• Busselton Water has 11 plants across the Busselton area, which has these storage tanks. They hold an average of 4500 kilolitres or 4,500,000 litres of water each. The total storage capacity is about 20,600 kL or in excess of 8 olympic size swimming pools.
• When demand requires it these pumps automatically start and pump water from the storage tanks out into the mains.
• Fluoride is not added to the water. Busselton’s water supply has natural occurring fluoride.
• From 1997 to 2012 an ultra violet disinfection system was used to kill any bacteria or microorganisms in the water prior to chlorination being introduced April 2012.
4 © Busselton Water Schools Education Programme
LEARNING PACK
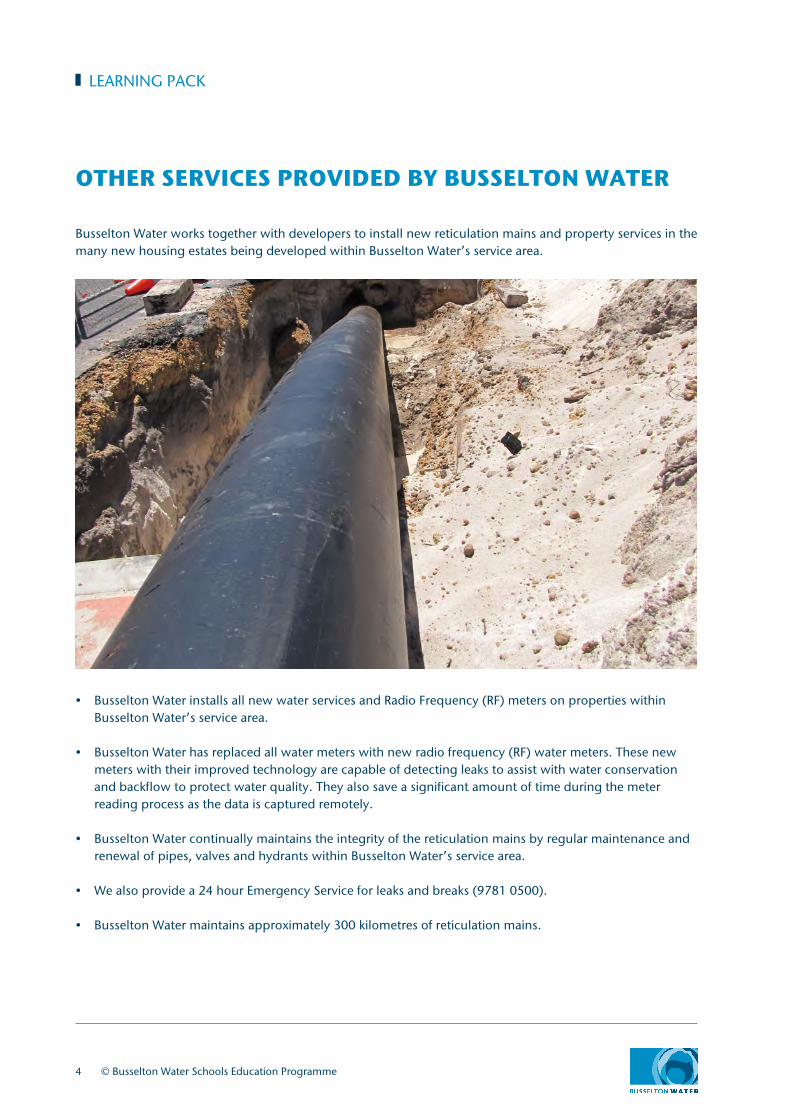
OTHER SERVICES PROVIDED BY BUSSELTON WATER
Busselton Water works together with developers to install new reticulation mains and property services in the many new housing estates being developed within Busselton Water’s service area.
• Busselton Water installs all new water services and Radio Frequency (RF) meters on properties within Busselton Water’s service area.
• Busselton Water has replaced all water meters with new radio frequency (RF) water meters. These new meters with their improved technology are capable of detecting leaks to assist with water conservation and backflow to protect water quality. They also save a significant amount of time during the meter reading process as the data is captured remotely.
• Busselton Water continually maintains the integrity of the reticulation mains by regular maintenance and renewal of pipes, valves and hydrants within Busselton Water’s service area.
• We also provide a 24 hour Emergency Service for leaks and breaks (9781 0500).
• Busselton Water maintains approximately 300 kilometres of reticulation mains.
© Busselton Water Schools Education Programme 5
WATER CONSUMPTION
Your water account depends on how much water you use. The more water you use the more you pay. It makes good sense to be aware of water usage and conserve as much as possible. For an up-to-date pricing structure, please contact Busselton Water.
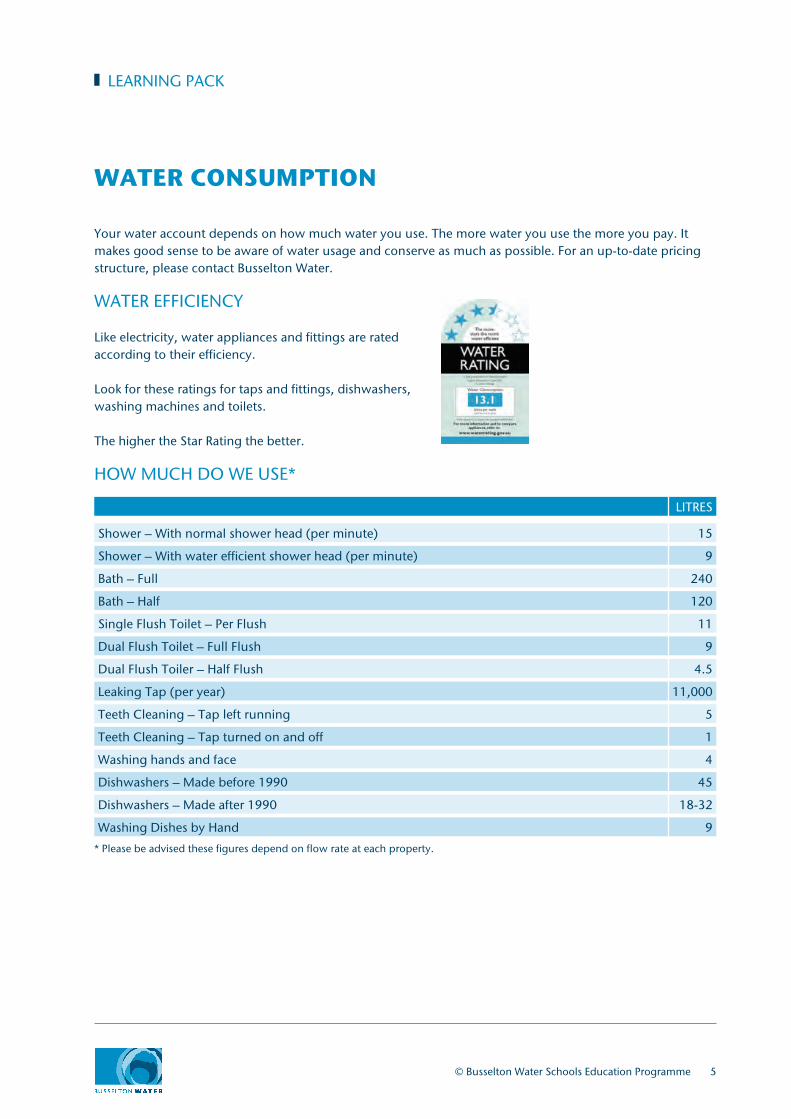
WATER EFFICIENCY
Like electricity, water appliances and fittings are ratedaccording to their efficiency.
Look for these ratings for taps and fittings, dishwashers,washing machines and toilets.
The higher the Star Rating the better.
HOW MUCH DO WE USE*
LEARNING PACK
Shower – With normal shower head (per minute) 15
Shower – With water efficient shower head (per minute) 9
Bath – Full 240
Bath – Half 120
Single Flush Toilet – Per Flush 11
Dual Flush Toilet – Full Flush 9
Dual Flush Toiler – Half Flush 4.5
Leaking Tap (per year) 11,000
Teeth Cleaning – Tap left running 5
Teeth Cleaning – Tap turned on and off 1
Washing hands and face 4
Dishwashers – Made before 1990 45
Dishwashers – Made after 1990 18-32
Washing Dishes by Hand 9
* Please be advised these figures depend on flow rate at each property.
LITRES
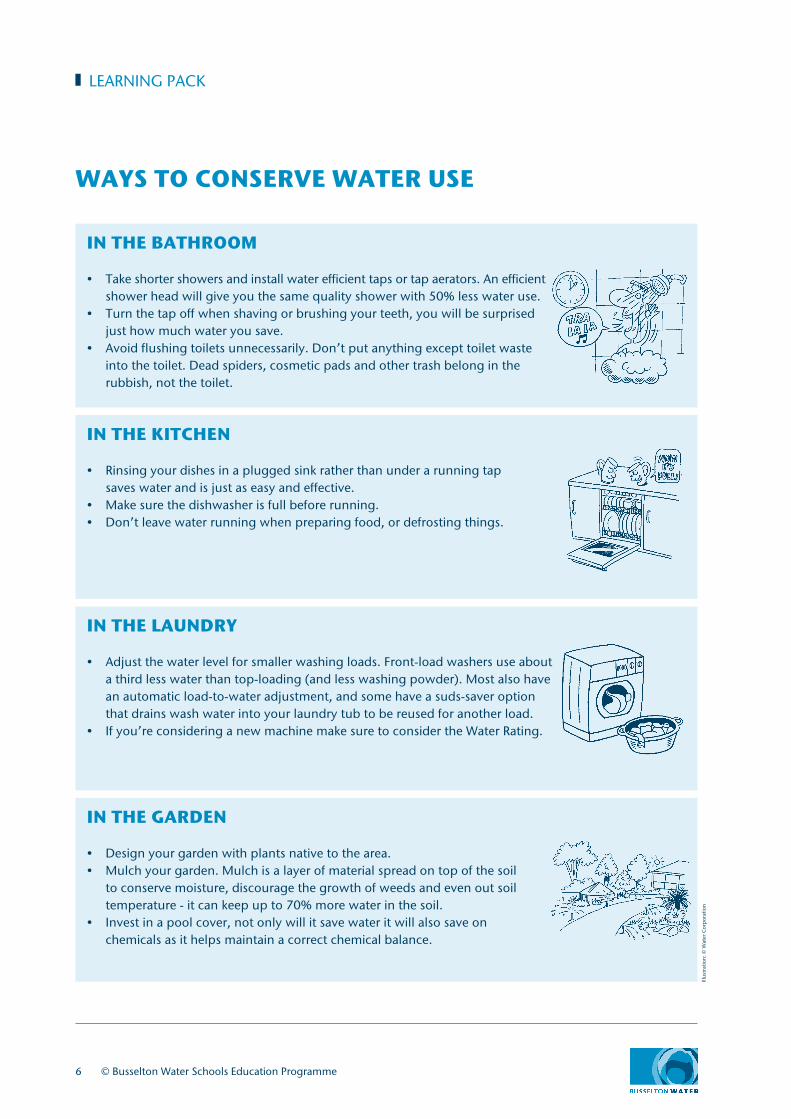
IN THE BATHROOM
• Take shorter showers and install water efficient taps or tap aerators. An efficient shower head will give you the same quality shower with 50% less water use.
• Turn the tap off when shaving or brushing your teeth, you will be surprised just how much water you save.
• Avoid flushing toilets unnecessarily. Don’t put anything except toilet waste into the toilet. Dead spiders, cosmetic pads and other trash belong in the rubbish, not the toilet.
6 © Busselton Water Schools Education Programme
LEARNING PACK
WAYS TO CONSERVE WATER USE
IN THE KITCHEN
• Rinsing your dishes in a plugged sink rather than under a running tap saves water and is just as easy and effective.
• Make sure the dishwasher is full before running.• Don’t leave water running when preparing food, or defrosting things.
IN THE LAUNDRY
• Adjust the water level for smaller washing loads. Front-load washers use about a third less water than top-loading (and less washing powder). Most also have an automatic load-to-water adjustment, and some have a suds-saver option that drains wash water into your laundry tub to be reused for another load.
• If you’re considering a new machine make sure to consider the Water Rating.
IN THE GARDEN
• Design your garden with plants native to the area.• Mulch your garden. Mulch is a layer of material spread on top of the soil
to conserve moisture, discourage the growth of weeds and even out soil temperature - it can keep up to 70% more water in the soil.
• Invest in a pool cover, not only will it save water it will also save on chemicals as it helps maintain a correct chemical balance.
Illus
trat
ion:
© W
ater
Cor
por
atio
n
© Busselton Water Schools Education Programme 7
LEARNING PACK
WATER EFFICIENCY MEASURES
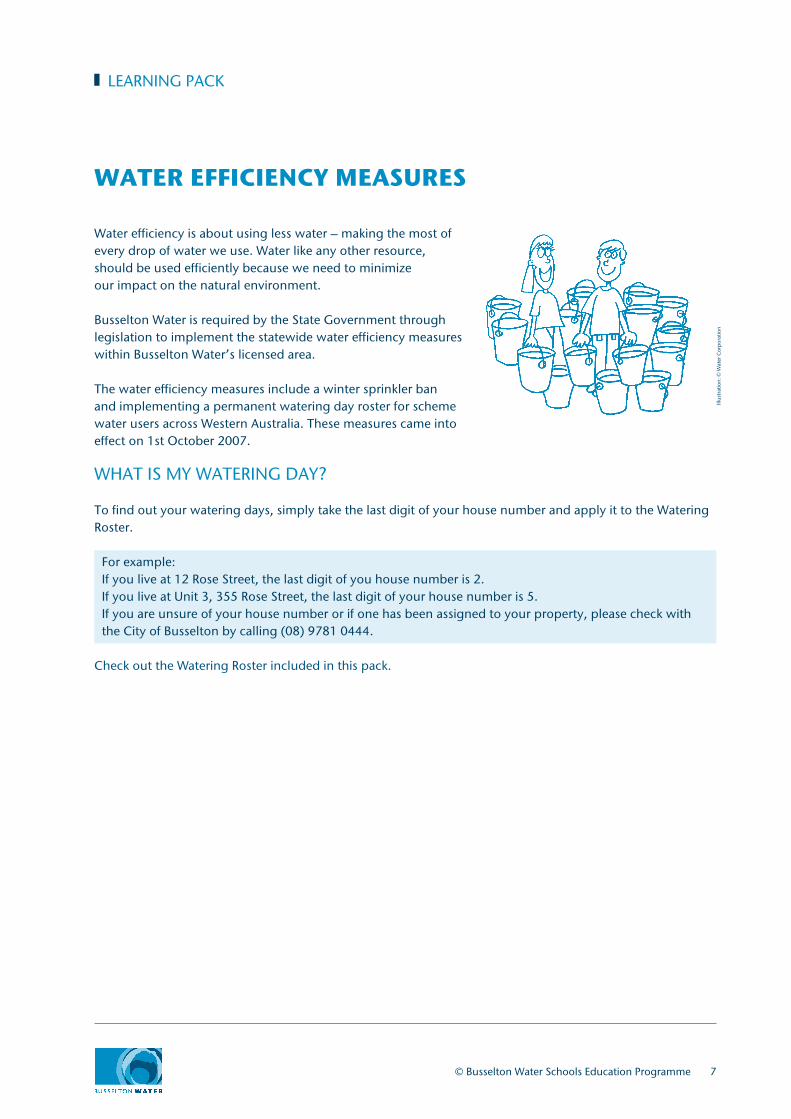
Water efficiency is about using less water – making the most of every drop of water we use. Water like any other resource, should be used efficiently because we need to minimize our impact on the natural environment.
Busselton Water is required by the State Government through legislation to implement the statewide water efficiency measures within Busselton Water’s licensed area.
The water efficiency measures include a winter sprinkler ban and implementing a permanent watering day roster for scheme water users across Western Australia. These measures came into effect on 1st October 2007.
WHAT IS MY WATERING DAY?
To find out your watering days, simply take the last digit of your house number and apply it to the Watering Roster.
For example:If you live at 12 Rose Street, the last digit of you house number is 2.If you live at Unit 3, 355 Rose Street, the last digit of your house number is 5.If you are unsure of your house number or if one has been assigned to your property, please check with the City of Busselton by calling (08) 9781 0444.
Check out the Watering Roster included in this pack.
Illus
trat
ion:
© W
ater
Cor
por
atio
n
8 © Busselton Water Schools Education Programme
LEARNING PACK
CHECKING FOR LEAKS
All water that passes through the meter to your property is your responsibility. A hidden leak at your home can potentially cost a lot of money and water our precious resource.
While major leaks may be easily noticed and repaired quickly, a hidden underground leak is not always so noticeable and can go on for sometime before you realise. The new RF meter will assist to identify leaks but you should be diligent and regularly check yourself.
Here is a quick and easy activity to check for a leak on your property.
• Turn all water-using appliances off so that no water is being used. This means turning off all water inside and outside the house including showers, sinks, washing machines and any appliance that uses water. If you have a sprinkler irrigation system this must also be turned off manually.
• Locate your meter. This is usually located at the front boundary of your property. You’ll recognise it as a low metal pipe structure with a tap handle and meter dial. Should you have any trouble finding your meter contact Busselton Water.
• Watch the meter. If any of the digits begin to flip over you may have an internal leak and will need to contact a plumber to have this fixed.
Illus
trat
ion:
© W
ater
Cor
por
atio
n
Wa t e r Ros t e r
For water saving tips visit busseltonwater.wa.gov.au9781 0500 24hr Emergencies
bu
sselto
nw
ate
r.wa
.go
v.a
u
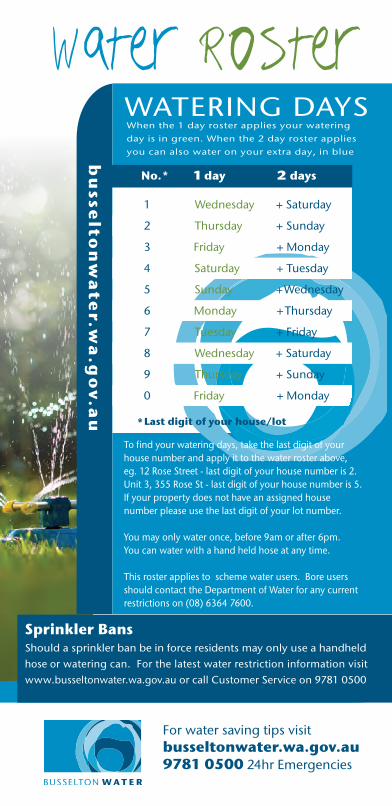
WATERING DAYS
*Last digit of your house/lot
When the 1 day roster applies your watering
day is in green. When the 2 day roster applies
you can also water on your extra day, in blue
No.* 1 day 2 days
Wednesday + Saturday1
Thursday + Sunday2
Friday + Monday3
Saturday + Tuesday4
Sunday + Wednesday5
Monday + Thursday6
Tuesday + Friday7
Wednesday + Saturday8
Thursday + Sunday9
Friday + Monday0
To find your watering days, take the last digit of your house number and apply it to the water roster above,eg. 12 Rose Street - last digit of your house number is 2.Unit 3, 355 Rose St - last digit of your house number is 5.If your property does not have an assigned house number please use the last digit of your lot number.
You may only water once, before 9am or after 6pm.You can water with a hand held hose at any time.
This roster applies to scheme water users. Bore users should contact the Department of Water for any current restrictions on (08) 6364 7600.
Sprinkler BansShould a sprinkler ban be in force residents may only use a handheld hose or watering can. For the latest water restriction information visit www.busseltonwater.wa.gov.au or call Customer Service on 9781 0500
WORKING TOGETHER FOR OUR WATER FUTURE
9781 0500
24 HRS FOR EMERGENCIES
1 FAIRBAIRN ROADBUSSELTON WA 6280
CONTACT [email protected]
RF WATER METERand
WATER LOSS DETECTION
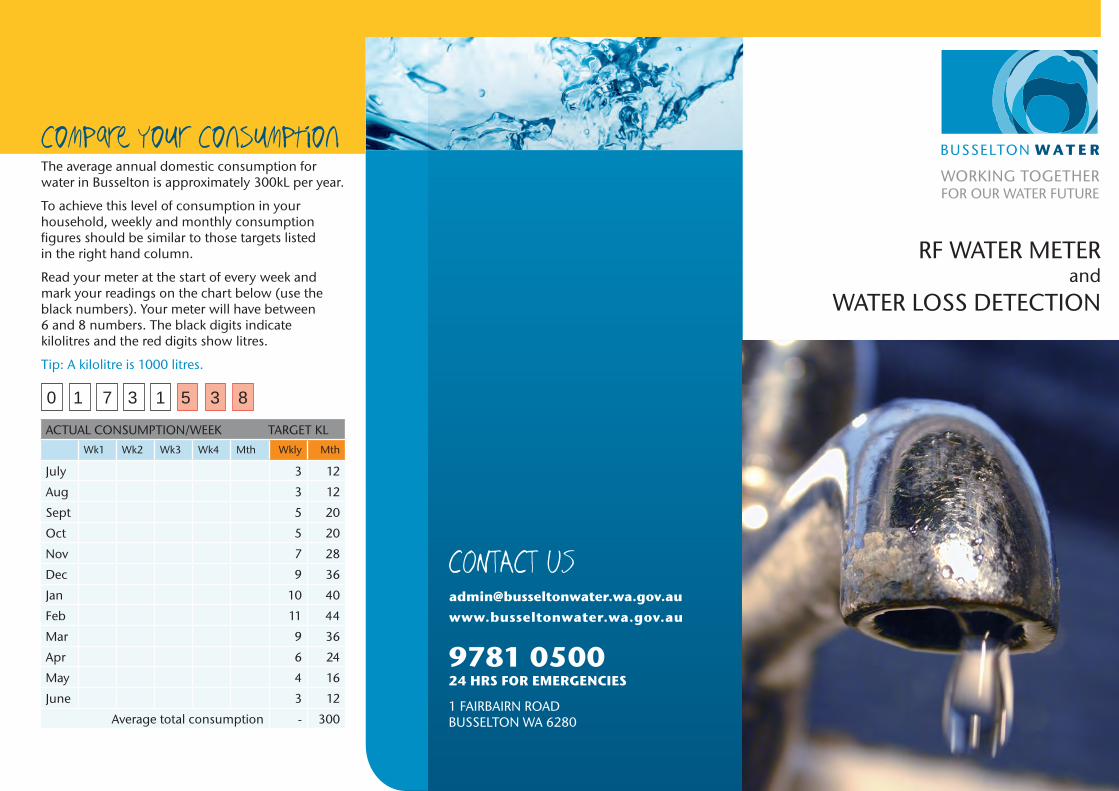
Compare Your Consumption
0 1 7 3 1 5 3 8
ACTUAL CONSUMPTION/WEEK TARGET KL
Wk1 Wk2 Wk3 Wk4 Mth Wkly Mth
July 3 12
Aug 3 12
Sept 5 20
Oct 5 20
Nov 7 28
Dec 9 36
Jan 10 40
Feb 11 44
Mar 9 36
Apr 6 24
May 4 16
June 3 12
Average total consumption - 300
The average annual domestic consumption forwater in Busselton is approximately 300kL per year.
To achieve this level of consumption in yourhousehold, weekly and monthly consumptionfigures should be similar to those targets listedin the right hand column.
Read your meter at the start of every week andmark your readings on the chart below (use theblack numbers). Your meter will have between6 and 8 numbers. The black digits indicatekilolitres and the red digits show litres.
Tip: A kilolitre is 1000 litres.
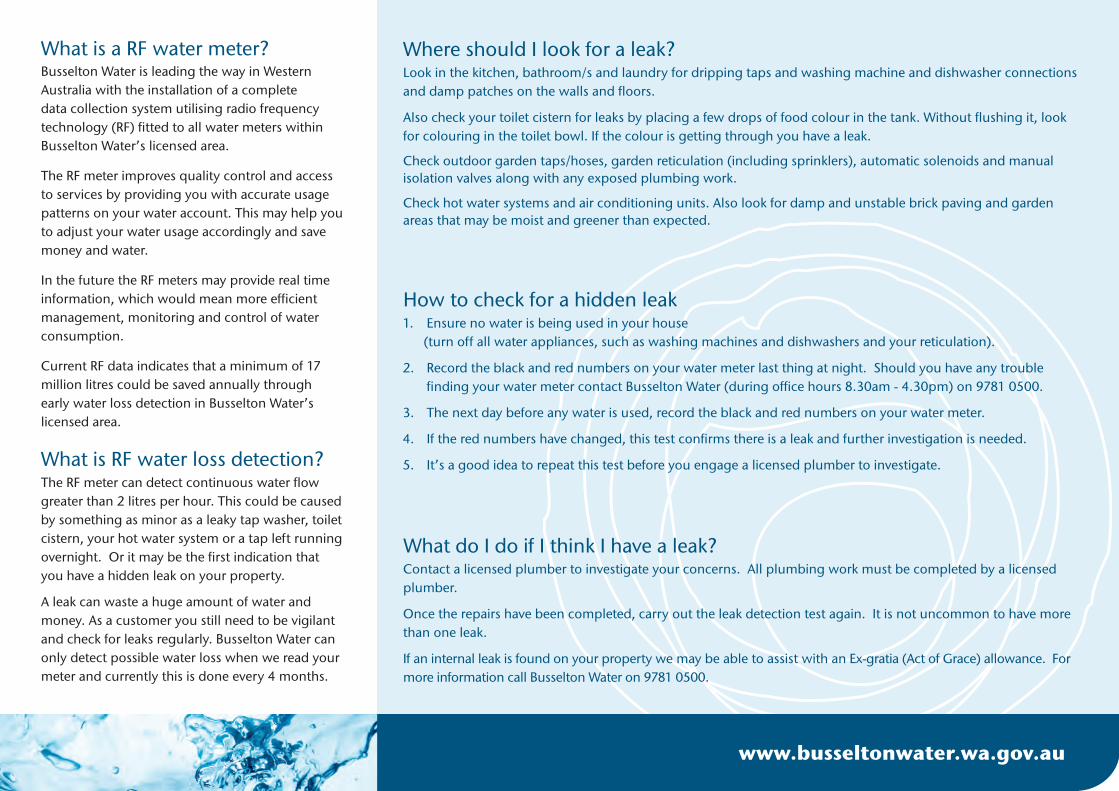
What is a RF water meter?
The RF meter can detect continuous water flow greater than 2 litres per hour. This could be caused by something as minor as a leaky tap washer, toilet cistern, your hot water system or a tap left running overnight. Or it may be the first indication that you have a hidden leak on your property.
A leak can waste a huge amount of water and money. As a customer you still need to be vigilant and check for leaks regularly. Busselton Water can only detect possible water loss when we read your meter and currently this is done every 4 months.
1. Ensure no water is being used in your house (turn off all water appliances, such as washing machines and dishwashers and your reticulation).
2. Record the black and red numbers on your water meter last thing at night. Should you have any trouble finding your water meter contact Busselton Water (during office hours 8.30am - 4.30pm) on 9781 0500.
3. The next day before any water is used, record the black and red numbers on your water meter.
4. If the red numbers have changed, this test confirms there is a leak and further investigation is needed.
5. It’s a good idea to repeat this test before you engage a licensed plumber to investigate.What is RF water loss detection?
How to check for a hidden leak
What do I do if I think I have a leak?
www.busseltonwater.wa.gov.au
Busselton Water is leading the way in Western Australia with the installation of a complete data collection system utilising radio frequency technology (RF) fitted to all water meters within Busselton Water’s licensed area.
The RF meter improves quality control and access to services by providing you with accurate usage patterns on your water account. This may help you to adjust your water usage accordingly and save money and water.
In the future the RF meters may provide real time information, which would mean more efficient management, monitoring and control of water consumption.
Current RF data indicates that a minimum of 17 million litres could be saved annually through early water loss detection in Busselton Water’s licensed area.
Contact a licensed plumber to investigate your concerns. All plumbing work must be completed by a licensed plumber.
Once the repairs have been completed, carry out the leak detection test again. It is not uncommon to have more than one leak.
If an internal leak is found on your property we may be able to assist with an Ex-gratia (Act of Grace) allowance. For more information call Busselton Water on 9781 0500.
Where should I look for a leak?Look in the kitchen, bathroom/s and laundry for dripping taps and washing machine and dishwasher connections and damp patches on the walls and floors.
Also check your toilet cistern for leaks by placing a few drops of food colour in the tank. Without flushing it, look for colouring in the toilet bowl. If the colour is getting through you have a leak.
Check outdoor garden taps/hoses, garden reticulation (including sprinklers), automatic solenoids and manual isolation valves along with any exposed plumbing work.
Check hot water systems and air conditioning units. Also look for damp and unstable brick paving and garden areas that may be moist and greener than expected.
Busselton–Capel groundwater area subarea reference sheets
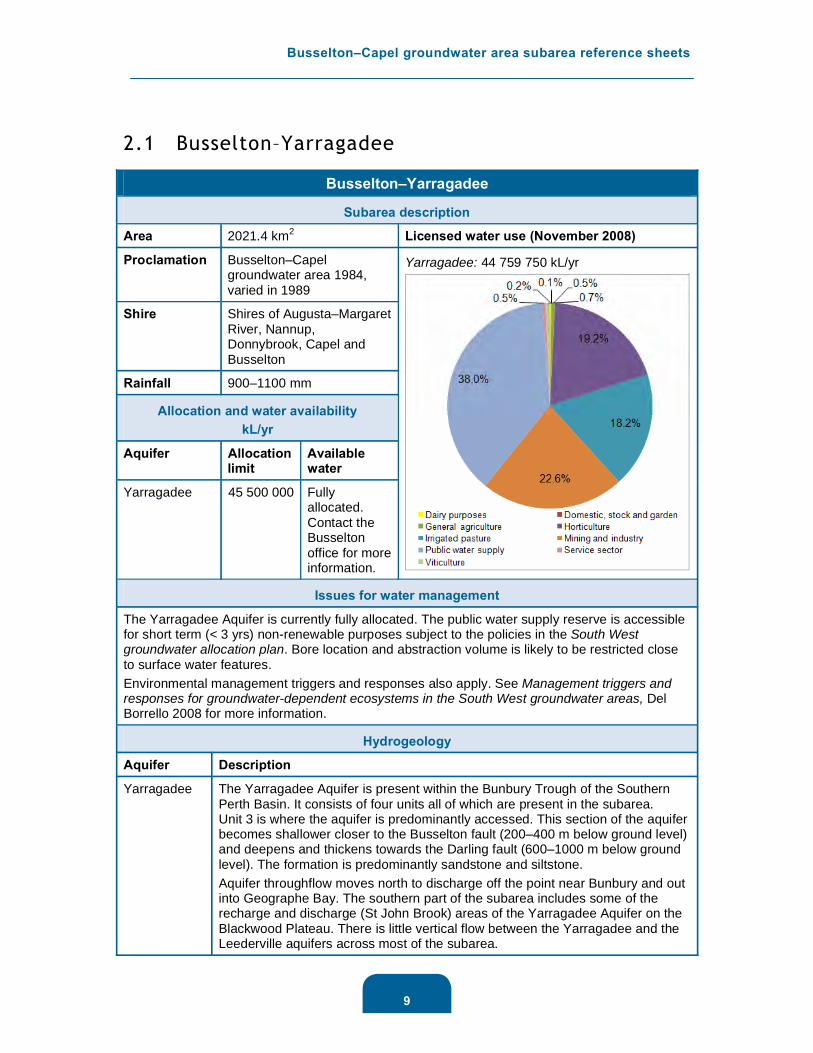
2.1 Busselton–Yarragadee
Busselton–Yarragadee
Subarea description
Area 2021.4 km2 Licensed water use (November 2008)
Proclamation Busselton–Capelgroundwater area 1984, varied in 1989
Shire Shires of Augusta–Margaret River, Nannup, Donnybrook, Capel and Busselton
Rainfall 900–1100 mm
Allocation and water availability kL/yr
Aquifer Allocationlimit
Availablewater
Yarragadee 45 500 000 Fullyallocated.Contact the Busseltonoffice for more information.
Yarragadee: 44 759 750 kL/yr
Issues for water management
The Yarragadee Aquifer is currently fully allocated. The public water supply reserve is accessible for short term (< 3 yrs) non-renewable purposes subject to the policies in the South West groundwater allocation plan. Bore location and abstraction volume is likely to be restricted close to surface water features. Environmental management triggers and responses also apply. See Management triggers and responses for groundwater-dependent ecosystems in the South West groundwater areas, Del Borrello 2008 for more information.
Hydrogeology
Aquifer Description
Yarragadee The Yarragadee Aquifer is present within the Bunbury Trough of the Southern Perth Basin. It consists of four units all of which are present in the subarea. Unit 3 is where the aquifer is predominantly accessed. This section of the aquifer becomes shallower closer to the Busselton fault (200–400 m below ground level) and deepens and thickens towards the Darling fault (600–1000 m below ground level). The formation is predominantly sandstone and siltstone. Aquifer throughflow moves north to discharge off the point near Bunbury and out into Geographe Bay. The southern part of the subarea includes some of the recharge and discharge (St John Brook) areas of the Yarragadee Aquifer on the Blackwood Plateau. There is little vertical flow between the Yarragadee and the Leederville aquifers across most of the subarea.
9
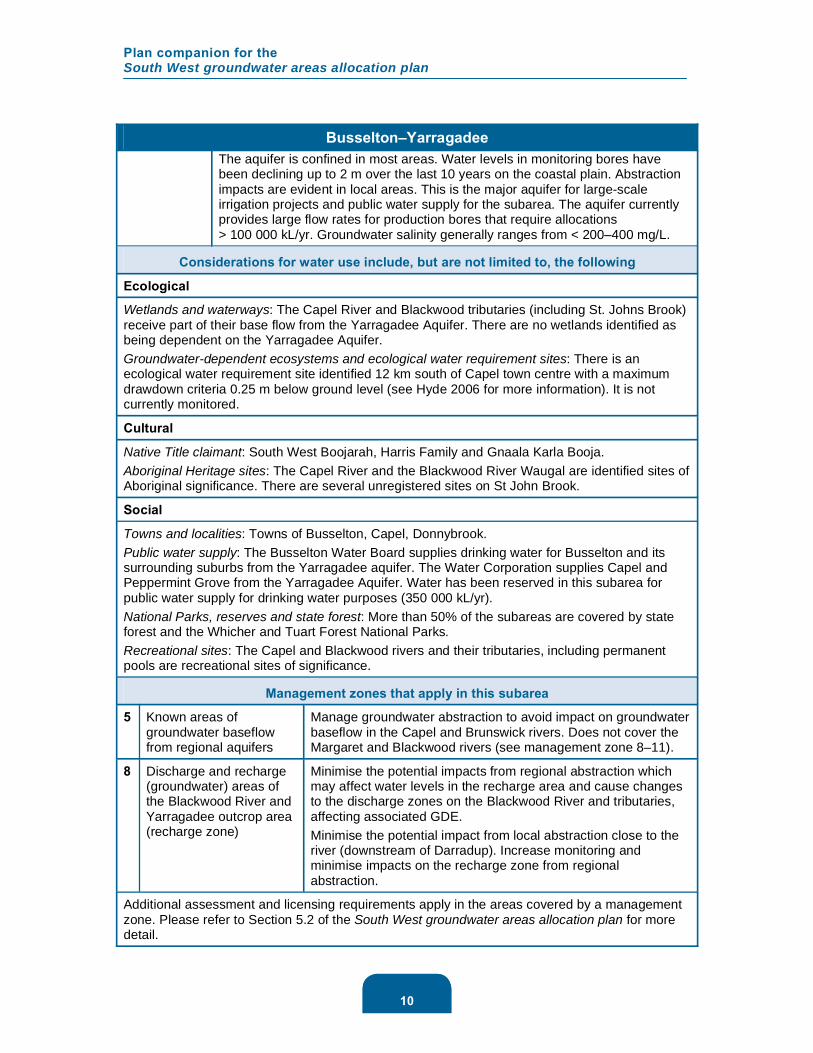
Plan companion for the South West groundwater areas allocation plan
Busselton–Yarragadee The aquifer is confined in most areas. Water levels in monitoring bores have been declining up to 2 m over the last 10 years on the coastal plain. Abstraction impacts are evident in local areas. This is the major aquifer for large-scale irrigation projects and public water supply for the subarea. The aquifer currently provides large flow rates for production bores that require allocations > 100 000 kL/yr. Groundwater salinity generally ranges from < 200–400 mg/L.
Considerations for water use include, but are not limited to, the following
Ecological
Wetlands and waterways: The Capel River and Blackwood tributaries (including St. Johns Brook) receive part of their base flow from the Yarragadee Aquifer. There are no wetlands identified as being dependent on the Yarragadee Aquifer. Groundwater-dependent ecosystems and ecological water requirement sites: There is an ecological water requirement site identified 12 km south of Capel town centre with a maximum drawdown criteria 0.25 m below ground level (see Hyde 2006 for more information). It is not currently monitored.
Cultural
Native Title claimant: South West Boojarah, Harris Family and Gnaala Karla Booja. Aboriginal Heritage sites: The Capel River and the Blackwood River Waugal are identified sites of Aboriginal significance. There are several unregistered sites on St John Brook.
Social
Towns and localities: Towns of Busselton, Capel, Donnybrook. Public water supply: The Busselton Water Board supplies drinking water for Busselton and its surrounding suburbs from the Yarragadee aquifer. The Water Corporation supplies Capel and Peppermint Grove from the Yarragadee Aquifer. Water has been reserved in this subarea for public water supply for drinking water purposes (350 000 kL/yr). National Parks, reserves and state forest: More than 50% of the subareas are covered by state forest and the Whicher and Tuart Forest National Parks.Recreational sites: The Capel and Blackwood rivers and their tributaries, including permanent pools are recreational sites of significance.
Management zones that apply in this subarea
5 Known areas of groundwater baseflow from regional aquifers
Manage groundwater abstraction to avoid impact on groundwater baseflow in the Capel and Brunswick rivers. Does not cover the Margaret and Blackwood rivers (see management zone 8–11).
8 Discharge and recharge (groundwater) areas of the Blackwood River and Yarragadee outcrop area (recharge zone)
Minimise the potential impacts from regional abstraction which may affect water levels in the recharge area and cause changes to the discharge zones on the Blackwood River and tributaries, affecting associated GDE.Minimise the potential impact from local abstraction close to the river (downstream of Darradup). Increase monitoring and minimise impacts on the recharge zone from regional abstraction.
Additional assessment and licensing requirements apply in the areas covered by a management zone. Please refer to Section 5.2 of the South West groundwater areas allocation plan for more detail.
10
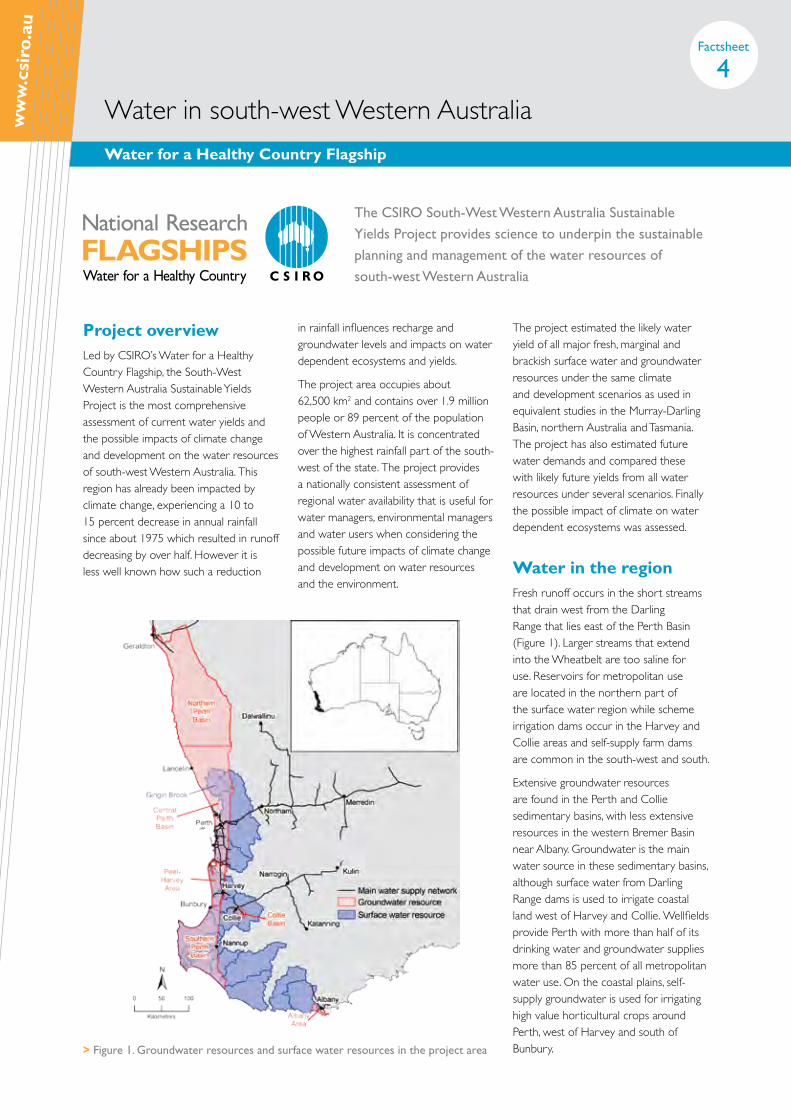
Water for a Healthy Country Flagship
Water in south-west Western Australia
The CSIRO South-West Western Australia Sustainable
Yields Project provides science to underpin the sustainable
planning and management of the water resources of
south-west Western Australia
> Figure 1. Groundwater resources and surface water resources in the project area
Project overviewLed by CSIRO’s Water for a Healthy Country Flagship, the South-West Western Australia Sustainable Yields Project is the most comprehensive assessment of current water yields and the possible impacts of climate change and development on the water resources of south-west Western Australia. This region has already been impacted by climate change, experiencing a 10 to 15 percent decrease in annual rainfall since about 1975 which resulted in runoff decreasing by over half. However it is less well known how such a reduction
in rainfall influences recharge and groundwater levels and impacts on water dependent ecosystems and yields.
The project area occupies about 62,500 km2 and contains over 1.9 million people or 89 percent of the population of Western Australia. It is concentrated over the highest rainfall part of the south-west of the state. The project provides a nationally consistent assessment of regional water availability that is useful for water managers, environmental managers and water users when considering the possible future impacts of climate change and development on water resources and the environment.
The project estimated the likely water yield of all major fresh, marginal and brackish surface water and groundwater resources under the same climate and development scenarios as used in equivalent studies in the Murray-Darling Basin, northern Australia and Tasmania. The project has also estimated future water demands and compared these with likely future yields from all water resources under several scenarios. Finally the possible impact of climate on water dependent ecosystems was assessed.
Water in the regionFresh runoff occurs in the short streams that drain west from the Darling Range that lies east of the Perth Basin (Figure 1). Larger streams that extend into the Wheatbelt are too saline for use. Reservoirs for metropolitan use are located in the northern part of the surface water region while scheme irrigation dams occur in the Harvey and Collie areas and self-supply farm dams are common in the south-west and south.
Extensive groundwater resources are found in the Perth and Collie sedimentary basins, with less extensive resources in the western Bremer Basin near Albany. Groundwater is the main water source in these sedimentary basins, although surface water from Darling Range dams is used to irrigate coastal land west of Harvey and Collie. Wellfields provide Perth with more than half of its drinking water and groundwater supplies more than 85 percent of all metropolitan water use. On the coastal plains, self-supply groundwater is used for irrigating high value horticultural crops around Perth, west of Harvey and south of Bunbury.
Factsheet
4
dryland agriculture in the northern Perth Basin are not as marked as they were in previous decades. The almost complete absence of very wet seasons and the occasional wet year has been particularly influential as it is often these periods that result in the greatest runoff and recharge.
In the southern part of the project area the recent past (1997 to 2007) has not been any drier than in the previous two decades.
Key finding 3 Almost all daily global climate models used by the Inter-governmental Panel on Climate Change Fourth Assessment Report predict that the climate in the region will get hotter and drier by 2030 relative to the 1990 base period
Fourteen of the 15 daily global climate models (GCMs) used in the Intergovernmental Panel of Climate Change Fourth Assessment Report predict that the 2030 climate will be drier than during the historical period of 1975 to 2007. The 15th model does not estimate any significant change. The average reduction in rainfall projected to occur is 7 percent with a 10th and 90th percentile range of 1 to 14 percent reduction.
It is unusual to find such high agreement between so many climate models. The 7 percent reduction is in addition to the 10 to 15 percent reduction already acknowledged to have occurred since the mid-1970s.
Key finding 4 Surface water modelling has indicated that the future yields in the region are likely to be on average 24 percent lower by 2030, with a possible range of 4 to 49 percent lower
A number of rainfall-runoff models were used to assess future water yields should the climate dry as indicated by the GCMs. Under the median future climate surface water yields (i.e. water
that can be safely diverted from streams) are projected to decline by an average of 24 percent. Under the wet extreme climate the yield decline is only 4 percent but under the dry extreme climate the decline is 49 percent.
The highest yielding areas of Harvey and Collie are less affected by climate change, with estimated reductions of 15 and 22 percent respectively. In comparison, the Donnelly and Warren management areas are projected to experience reductions of 39 and 36 percent respectively. All four of these regions are important for irrigated agriculture. Under the dry extreme climate more than a third of all surface water areas would experience a decline in yields in excess of 60 percent.
Key finding 5 A median future climate is expected to decrease summer and winter runoff by 20 to 30 percent and especially affect water dependent ecosystems that depend on high flows
Stream biota and riparian zones rely on river flows for their functioning. The modelling has indicated that both winter and summer flows may reduce by between 20 and 30 percent under the median future climate. The impact may be most severe on functions that require high flows which influence channel scouring, channel morphology and the inundation of floodplains. The relative lack of high intensity rainfall events has been a feature of the climate shift that has been experienced since the mid-1970s.
Key finding 6 Significant gaps between water yields and demands are expected to occur by about 2020 in areas where surface water resources are used for irrigation
Surface water irrigation catchments are expected to experience both reduced water yields and increased demands as the economy and population grow which will result in a deficit of water. This is already apparent in some areas but will
Key finding 1 South-west Western Australia has experienced significant climate change since the mid-1970s which has impacted on surface water and groundwater yields, and water dependent ecosystems
Previous work has shown that annual rainfall in south-west Western Australia has declined by 10 to 15 percent since about 1975 when compared with earlier records. The decline in autumn and early winter is most marked, as has been a reduction in rainfall intensities, runoff into dams and recharge into aquifers. Wetlands and perennial streams that were relatively abundant in the mid-twentieth century have either decreased or dried out as a result of this change. Climate modelling has indicated that there is a high probability that a proportion of the change is due to the presence of greenhouse gases. Some studies have indicated that wet and dry decades may be a feature of the region’s historical climate.
Key finding 2 Over central and northern parts of the project area the mean annual rainfall has been lower during the recent past than during the historical past
The period in the late 1970s was dry in the south-west region but there have been even drier periods recorded in the northern and central parts of the project area since the mid-1990s. Long-term rises in groundwater levels under
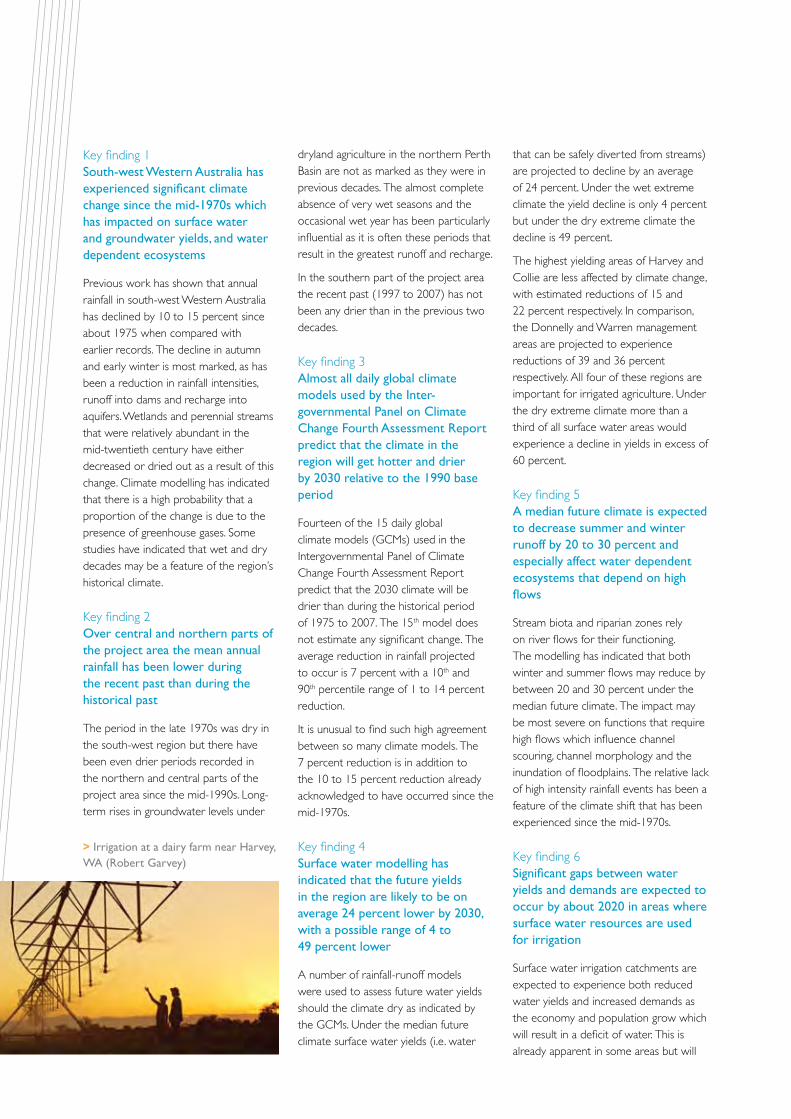
> Irrigation at a dairy farm near Harvey, WA (Robert Garvey)
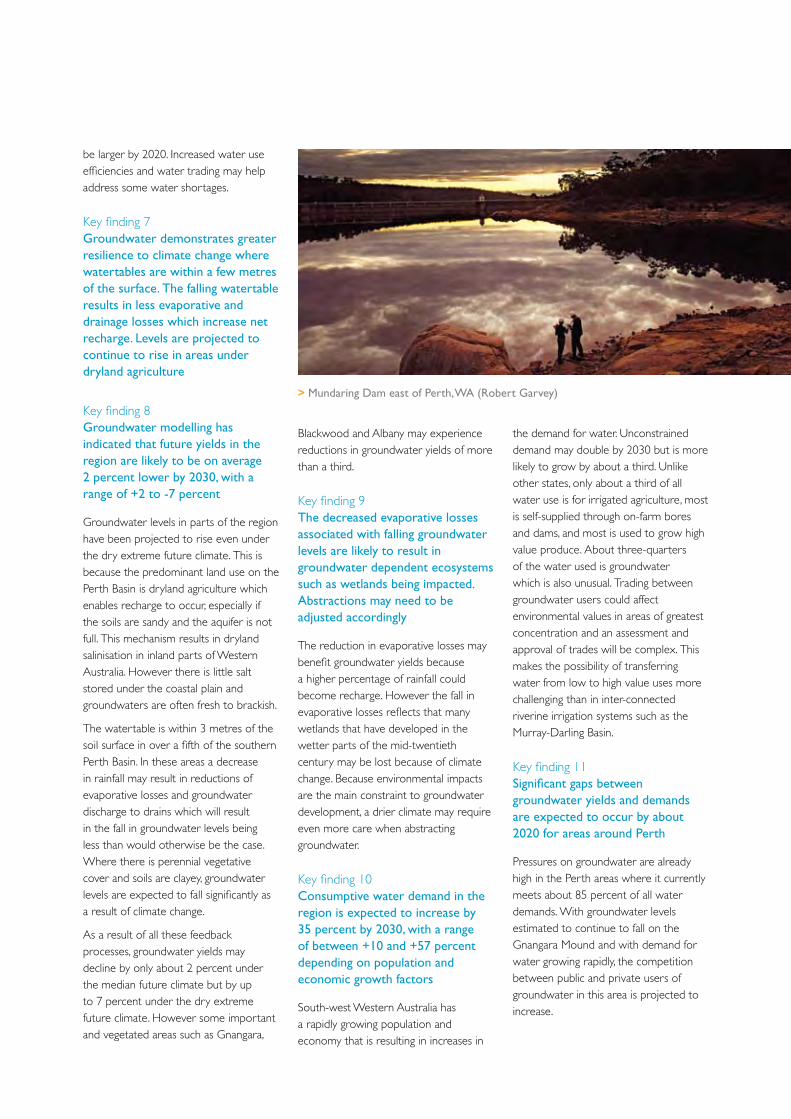
> Mundaring Dam east of Perth, WA (Robert Garvey)
be larger by 2020. Increased water use efficiencies and water trading may help address some water shortages.
Key finding 7 Groundwater demonstrates greater resilience to climate change where watertables are within a few metres of the surface. The falling watertable results in less evaporative and drainage losses which increase net recharge. Levels are projected to continue to rise in areas under dryland agriculture
Key finding 8 Groundwater modelling has indicated that future yields in the region are likely to be on average 2 percent lower by 2030, with a range of +2 to -7 percent
Groundwater levels in parts of the region have been projected to rise even under the dry extreme future climate. This is because the predominant land use on the Perth Basin is dryland agriculture which enables recharge to occur, especially if the soils are sandy and the aquifer is not full. This mechanism results in dryland salinisation in inland parts of Western Australia. However there is little salt stored under the coastal plain and groundwaters are often fresh to brackish.
The watertable is within 3 metres of the soil surface in over a fifth of the southern Perth Basin. In these areas a decrease in rainfall may result in reductions of evaporative losses and groundwater discharge to drains which will result in the fall in groundwater levels being less than would otherwise be the case. Where there is perennial vegetative cover and soils are clayey, groundwater levels are expected to fall significantly as a result of climate change.
As a result of all these feedback processes, groundwater yields may decline by only about 2 percent under the median future climate but by up to 7 percent under the dry extreme future climate. However some important and vegetated areas such as Gnangara,
Blackwood and Albany may experience reductions in groundwater yields of more than a third.
Key finding 9 The decreased evaporative losses associated with falling groundwater levels are likely to result in groundwater dependent ecosystems such as wetlands being impacted. Abstractions may need to be adjusted accordingly
The reduction in evaporative losses may benefit groundwater yields because a higher percentage of rainfall could become recharge. However the fall in evaporative losses reflects that many wetlands that have developed in the wetter parts of the mid-twentieth century may be lost because of climate change. Because environmental impacts are the main constraint to groundwater development, a drier climate may require even more care when abstracting groundwater.
Key finding 10 Consumptive water demand in the region is expected to increase by 35 percent by 2030, with a range of between +10 and +57 percent depending on population and economic growth factors
South-west Western Australia has a rapidly growing population and economy that is resulting in increases in
the demand for water. Unconstrained demand may double by 2030 but is more likely to grow by about a third. Unlike other states, only about a third of all water use is for irrigated agriculture, most is self-supplied through on-farm bores and dams, and most is used to grow high value produce. About three-quarters of the water used is groundwater which is also unusual. Trading between groundwater users could affect environmental values in areas of greatest concentration and an assessment and approval of trades will be complex. This makes the possibility of transferring water from low to high value uses more challenging than in inter-connected riverine irrigation systems such as the Murray-Darling Basin.
Key finding 11 Significant gaps between groundwater yields and demands are expected to occur by about 2020 for areas around Perth
Pressures on groundwater are already high in the Perth areas where it currently meets about 85 percent of all water demands. With groundwater levels estimated to continue to fall on the Gnangara Mound and with demand for water growing rapidly, the competition between public and private users of groundwater in this area is projected to increase.
For further information:
CSIRO Water for a Healthy Country FlagshipProject LeaderDr Don McFarlane Phone: (08) 9333 6215 Email: [email protected] Web: www.csiro.au/partnerships/SWSY
MC
K218
Dec
200
9 •
SWSY
_Ove
rvie
w_F
acts
heet
.indd
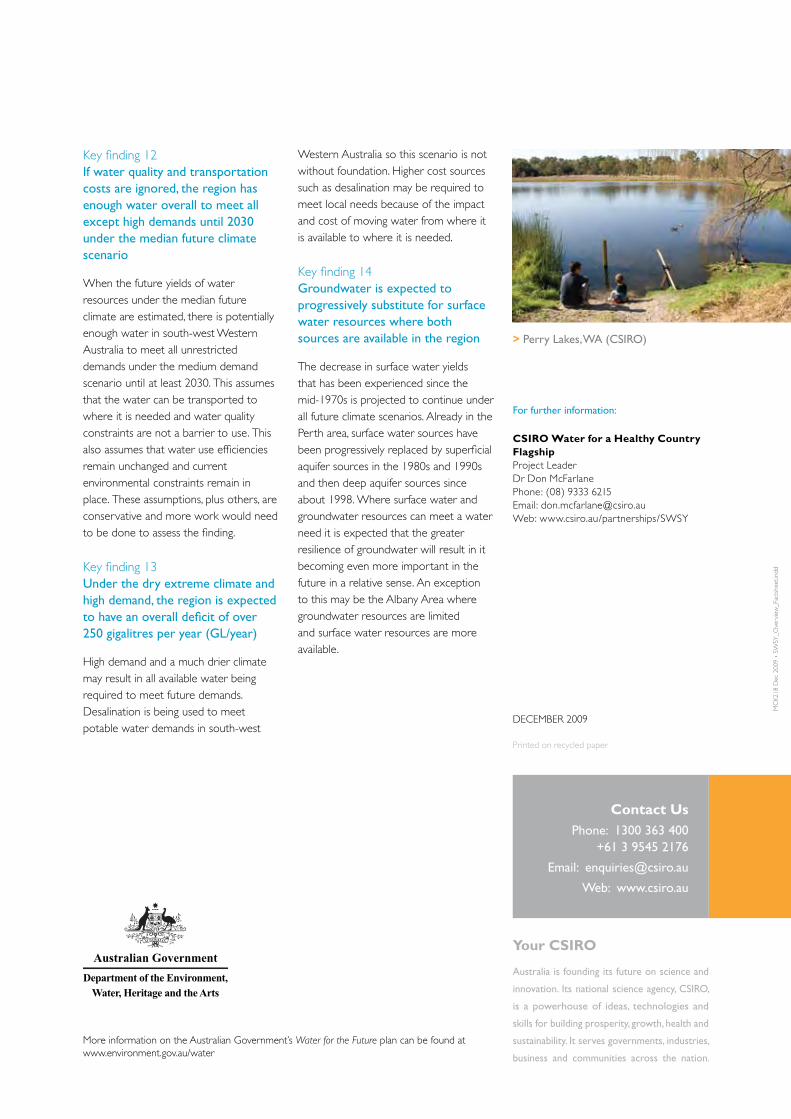
Key finding 12 If water quality and transportation costs are ignored, the region has enough water overall to meet all except high demands until 2030 under the median future climate scenario
When the future yields of water resources under the median future climate are estimated, there is potentially enough water in south-west Western Australia to meet all unrestricted demands under the medium demand scenario until at least 2030. This assumes that the water can be transported to where it is needed and water quality constraints are not a barrier to use. This also assumes that water use efficiencies remain unchanged and current environmental constraints remain in place. These assumptions, plus others, are conservative and more work would need to be done to assess the finding.
Key finding 13 Under the dry extreme climate and high demand, the region is expected to have an overall deficit of over 250 gigalitres per year (GL/year)
High demand and a much drier climate may result in all available water being required to meet future demands. Desalination is being used to meet potable water demands in south-west
Western Australia so this scenario is not without foundation. Higher cost sources such as desalination may be required to meet local needs because of the impact and cost of moving water from where it is available to where it is needed.
Key finding 14 Groundwater is expected to progressively substitute for surface water resources where both sources are available in the region
The decrease in surface water yields that has been experienced since the mid-1970s is projected to continue under all future climate scenarios. Already in the Perth area, surface water sources have been progressively replaced by superficial aquifer sources in the 1980s and 1990s and then deep aquifer sources since about 1998. Where surface water and groundwater resources can meet a water need it is expected that the greater resilience of groundwater will result in it becoming even more important in the future in a relative sense. An exception to this may be the Albany Area where groundwater resources are limited and surface water resources are more available.
> Perry Lakes, WA (CSIRO)
Printed on recycled paper
DECEMBER 2009
More information on the Australian Government’s Water for the Future plan can be found at www.environment.gov.au/water
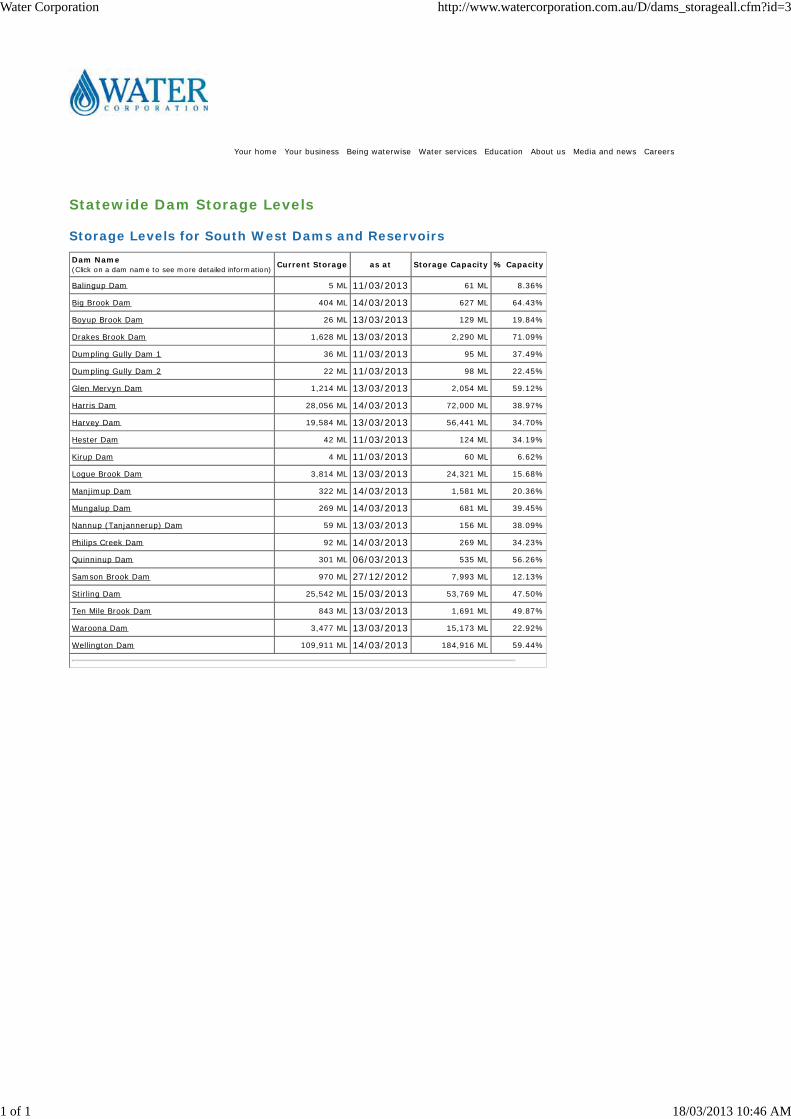
Statewide Dam Storage Levels
Storage Levels for South West Dams and Reservoirs
Dam Name(Click on a dam name to see more detailed information) Current Storage as at Storage Capacity % Capacity
Balingup Dam 5 ML 11/03/2013 61 ML 8.36%
Big Brook Dam 404 ML 14/03/2013 627 ML 64.43%
Boyup Brook Dam 26 ML 13/03/2013 129 ML 19.84%
Drakes Brook Dam 1,628 ML 13/03/2013 2,290 ML 71.09%
Dumpling Gully Dam 1 36 ML 11/03/2013 95 ML 37.49%
Dumpling Gully Dam 2 22 ML 11/03/2013 98 ML 22.45%
Glen Mervyn Dam 1,214 ML 13/03/2013 2,054 ML 59.12%
Harris Dam 28,056 ML 14/03/2013 72,000 ML 38.97%
Harvey Dam 19,584 ML 13/03/2013 56,441 ML 34.70%
Hester Dam 42 ML 11/03/2013 124 ML 34.19%
Kirup Dam 4 ML 11/03/2013 60 ML 6.62%
Logue Brook Dam 3,814 ML 13/03/2013 24,321 ML 15.68%
Manjimup Dam 322 ML 14/03/2013 1,581 ML 20.36%
Mungalup Dam 269 ML 14/03/2013 681 ML 39.45%
Nannup (Tanjannerup) Dam 59 ML 13/03/2013 156 ML 38.09%
Philips Creek Dam 92 ML 14/03/2013 269 ML 34.23%
Quinninup Dam 301 ML 06/03/2013 535 ML 56.26%
Samson Brook Dam 970 ML 27/12/2012 7,993 ML 12.13%
Stirling Dam 25,542 ML 15/03/2013 53,769 ML 47.50%
Ten Mile Brook Dam 843 ML 13/03/2013 1,691 ML 49.87%
Waroona Dam 3,477 ML 13/03/2013 15,173 ML 22.92%
Wellington Dam 109,911 ML 14/03/2013 184,916 ML 59.44%
Your home Your business Being waterwise Water services Education About us Media and news Careers
Water Corporation http://www.watercorporation.com.au/D/dams_storageall.cfm?id=3
1 of 1 18/03/2013 10:46 AM
WEEK 2: Micro-organisms in the water
MODULE 1:WATER TREATMENT
MO
DU
LE 1W
EEK 2

CURRICULUM LINKS
© Busselton Water Schools Education Programme
MODULE 1: WATER TREATMENT WEEK 2 Micro-organisms in the water
LESSON 1 Students identify the four micro-organisms that exist in water. Students present a PowerPoint summary to the class.
CURRICULUM LINKS
YEAR 7| SCIENCE Interactions between organisms can be described in terms of food chains and food webs; human activity can affect these interactions (ACSSU112)
CROSS CURRICULUM PRIORITIES
Sustainability
GENERAL CAPABILITIES Ethical Understanding
CURRICULUM LINKS
© Busselton Water Schools Education Programme
MODULE 1: WATER TREATMENT WEEK 2 Micro-organisms in the water
LESSON 2 Students research and report on some of the ways that drinking water can be protected.
CURRICULUM LINKS
YEAR 7 | SCIENCE Science understanding influences the development of practices in areas of human activity such as industry, agriculture and marine and terrestrial resource management (ACSHE121) Water is an important resource that cycles through the environment (ACSSU222) YEAR 9 | SCIENCE Multi-cellular organisms rely on coordinated and interdependent internal systems to respond to changes to their environment (ACSSU175)
CROSS CURRICULUM PRIORITIES
Sustainability
GENERAL CAPABILITIES Ethical Understanding
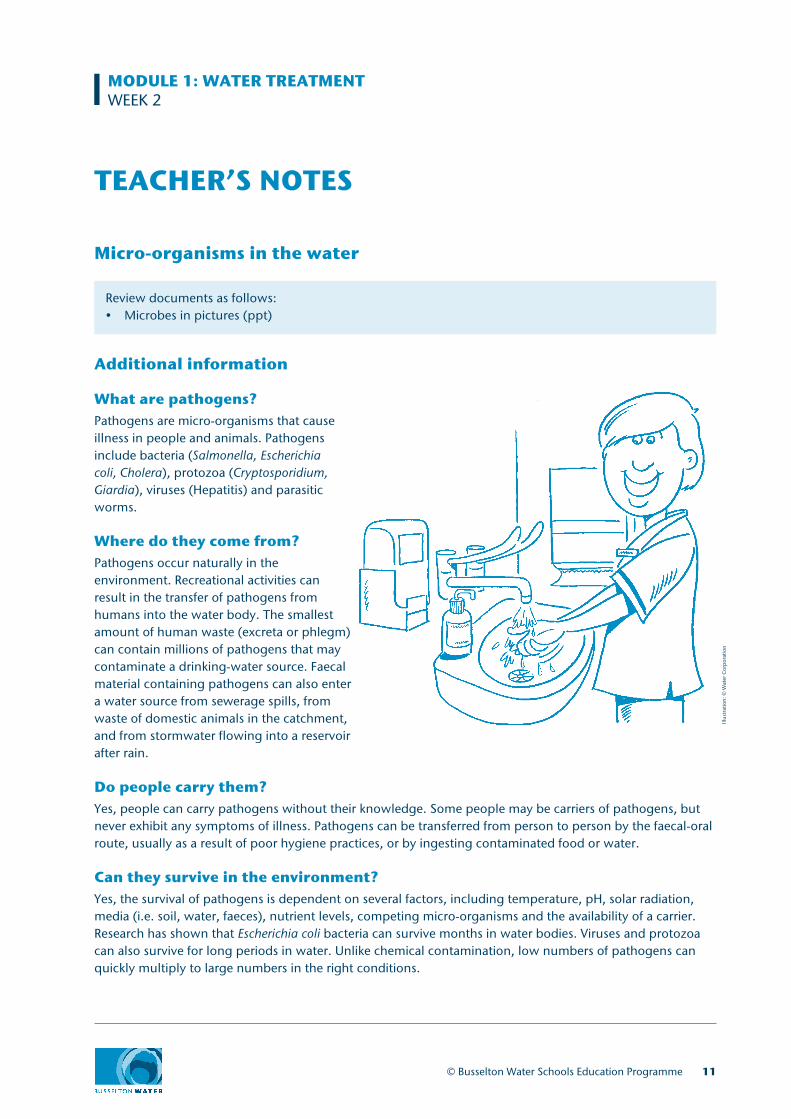
TEACHER’S NOTES
Micro-organisms in the water
Review documents as follows:• Microbes in pictures (ppt)
Additional information
What are pathogens?Pathogens are micro-organisms that cause illness in people and animals. Pathogens include bacteria (Salmonella, Escherichia coli, Cholera), protozoa (Cryptosporidium, Giardia), viruses (Hepatitis) and parasitic worms.
Where do they come from?Pathogens occur naturally in the environment. Recreational activities can result in the transfer of pathogens from humans into the water body. The smallest amount of human waste (excreta or phlegm) can contain millions of pathogens that may contaminate a drinking-water source. Faecal material containing pathogens can also enter a water source from sewerage spills, from waste of domestic animals in the catchment, and from stormwater flowing into a reservoir after rain.
Do people carry them?Yes, people can carry pathogens without their knowledge. Some people may be carriers of pathogens, but never exhibit any symptoms of illness. Pathogens can be transferred from person to person by the faecal-oral route, usually as a result of poor hygiene practices, or by ingesting contaminated food or water.
Can they survive in the environment?Yes, the survival of pathogens is dependent on several factors, including temperature, pH, solar radiation, media (i.e. soil, water, faeces), nutrient levels, competing micro-organisms and the availability of a carrier. Research has shown that Escherichia coli bacteria can survive months in water bodies. Viruses and protozoa can also survive for long periods in water. Unlike chemical contamination, low numbers of pathogens can quickly multiply to large numbers in the right conditions.
© Busselton Water Schools Education Programme 11
Illus
trat
ion:
© W
ater
Cor
por
atio
n
MODULE 1: WATER TREATMENTWEEK 2
12 © Busselton Water Schools Education Programme
Teachers provide an overview of harmful pathogens through the presentation of the powerpoint Microbes in pictures. Create four groups in the classroom, with each group investigating one of the four types of pathogens (bacteria, protozoa, viruses and parasitic worms). Students then present a powerpoint slide show that covers:• Where these pathogens can be found (outside of water)• What are the effects of these pathogens on the human body?• What they appear like (under a microscope)• How you can be treated if you consume a pathogen based disease • What you can do to prevent the transfer of pathogens
LESSON ONE
Additional creative ideas
Explore what other factors can contaminate water beside pathogens e.g. hazardous waste, livestock, leaks from landfill. What can we do to keep our water safe i.e. don’t put chemicals down the drain etc. Design a poster showing what we can do to keep our water sources safe.
Website links
8http://www.public.health.wa.gov.au/3/961/2/drinking_water_contaminants.pm8http://www.nhmrc.gov.au/_files_nhmrc/file/publications/synopses/eh33.pdf
Explain to students that in order to prevent harmful pathogens within the water supply there are a number of drinking guidelines and standards which are developed and maintained by the WA Health Department. Students undertake research to determine some of the ways that our drinking water can be protected. For example:• protecting the catchments and source water• holding water in protected reservoirs or storage• treatment• disinfection• protecting the distribution system• maintenance of the distribution system.
Students choose one of the topics and outline what steps can be taken to ensure that WA water is safe to drink.
LESSON TWO
MODULE 1: WATER TREATMENTWEEK 2: TEACHER’S NOTES

Micro-organisms
The word MICRO means very small. (So you need a Microscope to see it!)
Micro-organism Man!
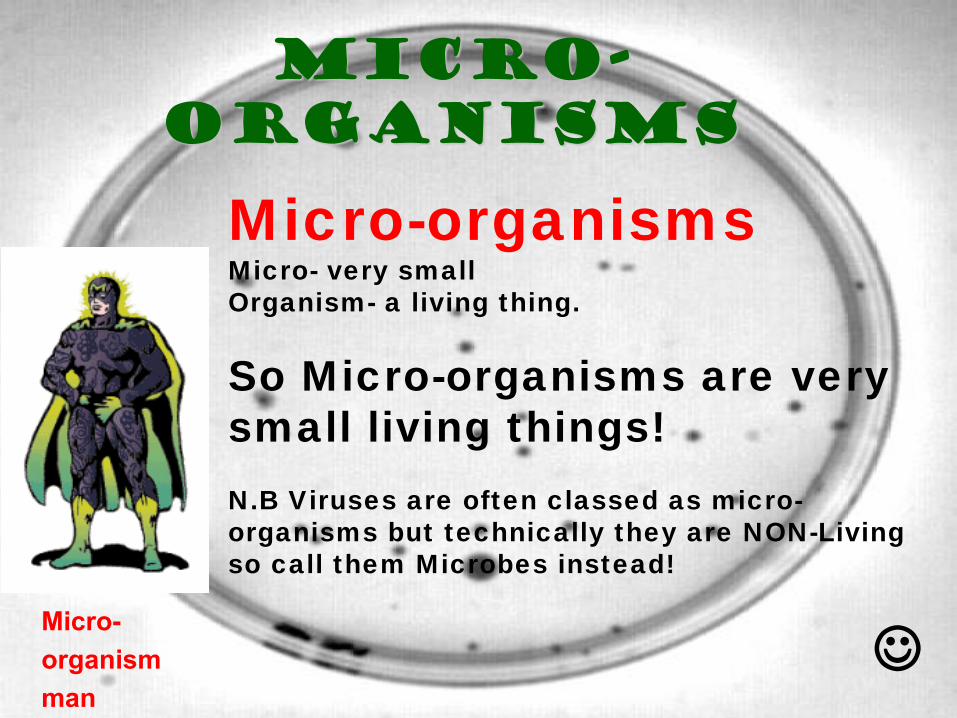
Micro-organisms
Micro-organisms Micro- very small Organism- a living thing.
So Micro-organisms are very small living things! N.B Viruses are often classed as micro- organisms but technically they are NON-Living so call them Microbes instead!
Micro- organism man

Bacteria The good the bad and the ugly!
Bacteria are small living single celled organisms that can come in good (beneficial) forms and bad (pathogenic) forms that cause disease.
Some different shapes of bacteria

Structure of bacteria
Flagellum (Tail for movement)
Cell wall
Cell membrane Slimy capsule
Strand of DNA
Cytoplasm

Bacteria can double in number every 20 minutes!

The motility (movement) of some
bacteria in culture.
Pseudomonas aeruginosa
How fast!
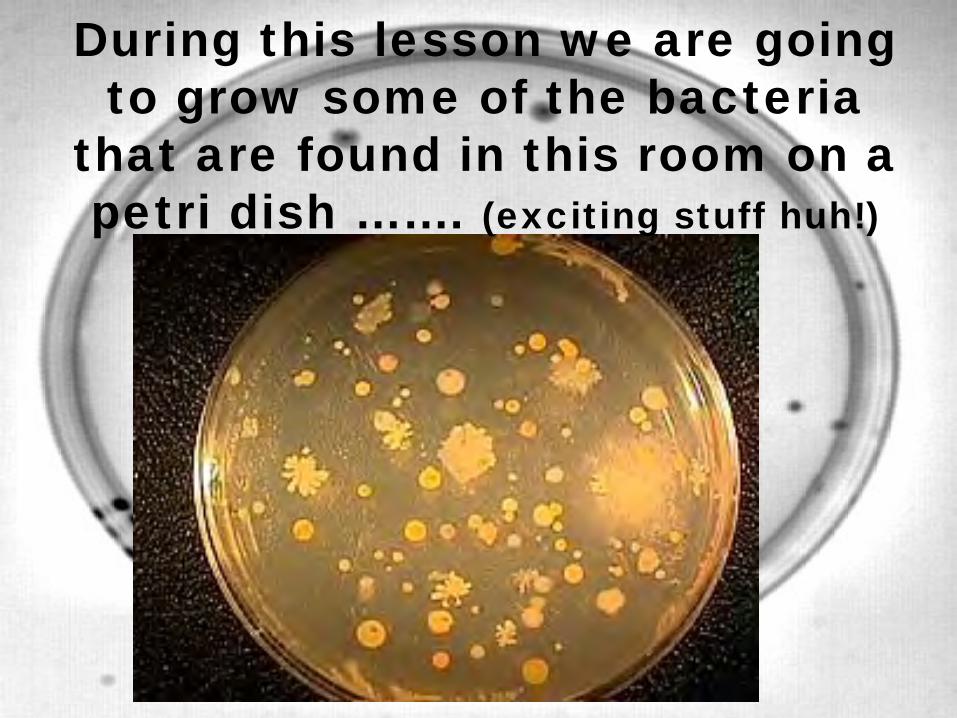
During this lesson we are going to grow some of the bacteria
that are found in this room on a petri dish ……. (exciting stuff huh!)
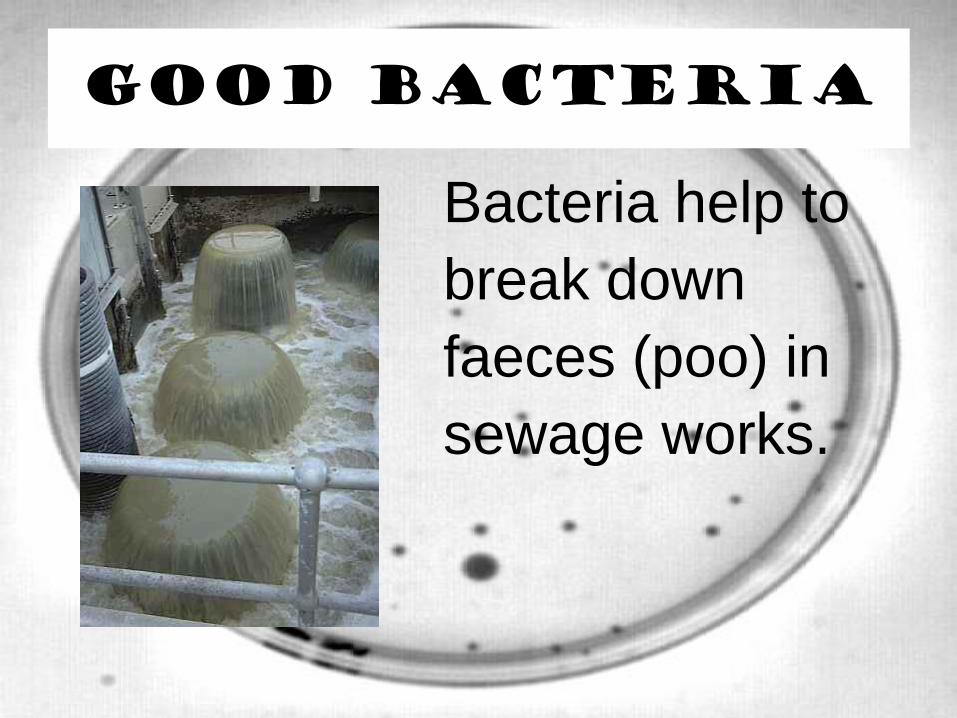
Good bacteria
Bacteria help to break down faeces (poo) in sewage works.
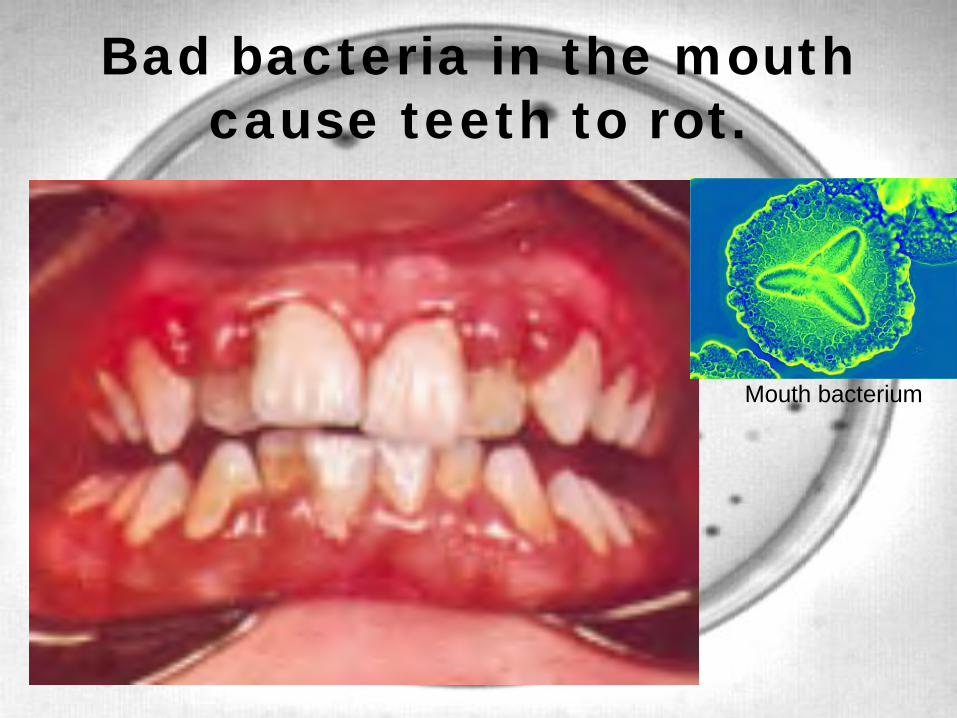
Bad bacteria in the mouth cause teeth to rot.
Mouth bacteria
Mouth bacterium

Viruses Viruses are extremely small (much smaller than bacteria)
NON-LIVING microbes that need a host cell so that they can
reproduce and survive.
NON-LIVING because they
do not fulfil all of the MRS GREN criteria.
It’s not popcorn! It’s a picture of a virus!

Structure of viruses

How viruses replicate inside
cells
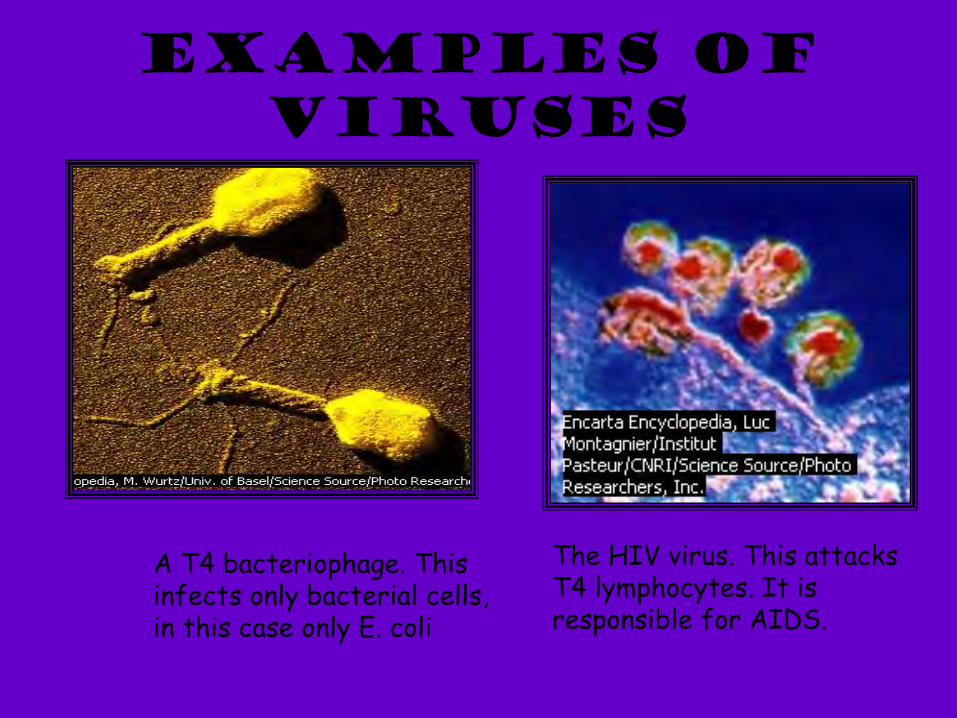
Examples of viruses
A T4 bacteriophage. This infects only bacterial cells, in this case only E. coli
The HIV virus. This attacks T4 lymphocytes. It is responsible for AIDS.

One sneeze can
transmit many cold virus particles
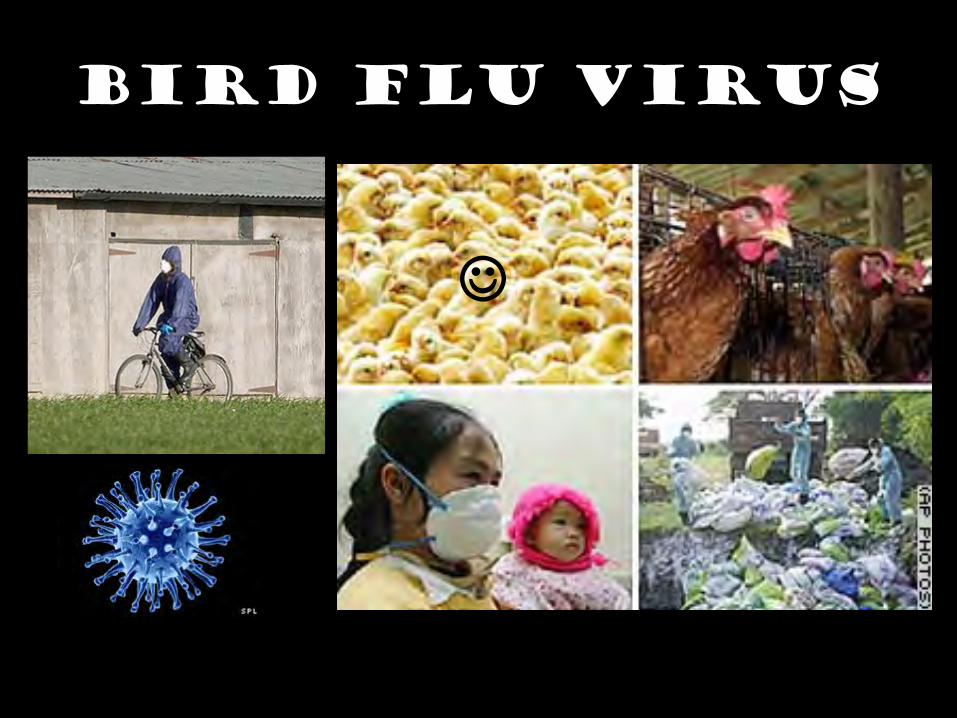
Bird flu virus
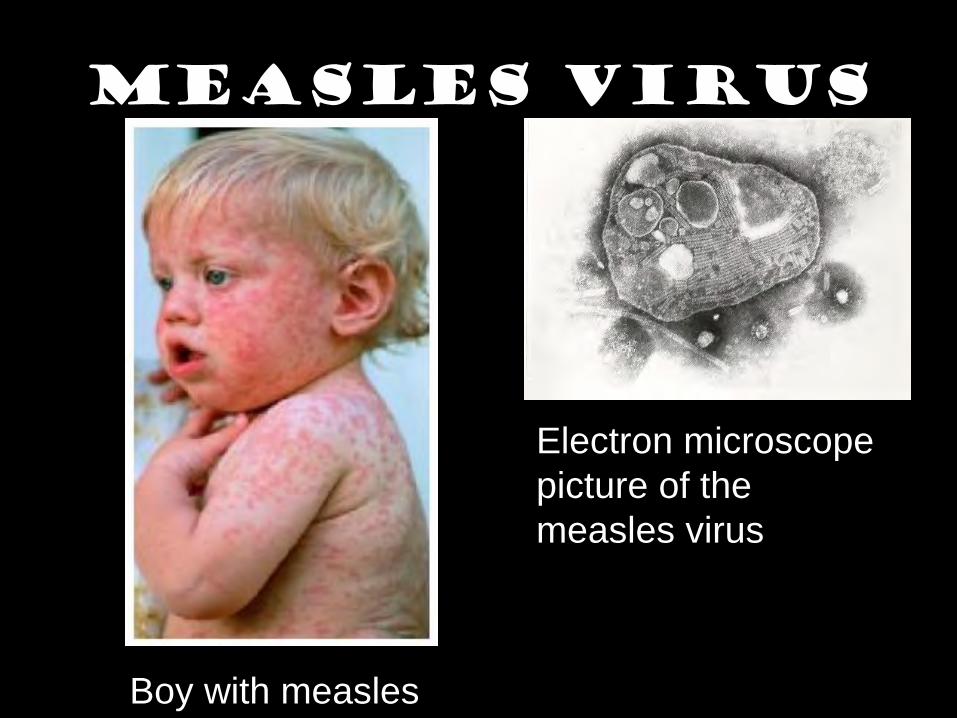
Measles virus
Electron microscope picture of the measles virus
Boy with measles

Viruses cause cold sores, warts and
verucae

Treatment of viral infections
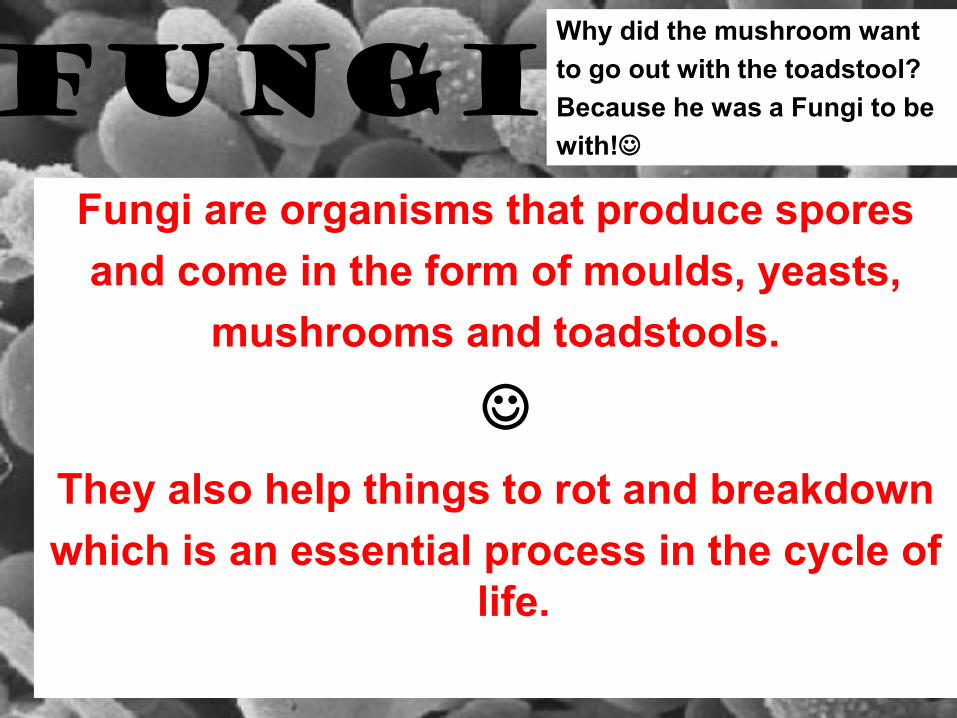
Fungi Fungi are organisms that produce spores and come in the form of moulds, yeasts,
mushrooms and toadstools.
They also help things to rot and breakdown which is an essential process in the cycle of
life.
Why did the mushroom want to go out with the toadstool? Because he was a Fungi to be with!

Examples of fungi
Mould growing a bread bun
Yeast cells budding
There can be good forms of fungus (used to make bread/beer) and bad forms (Mould, Athletes foot and
thrush).
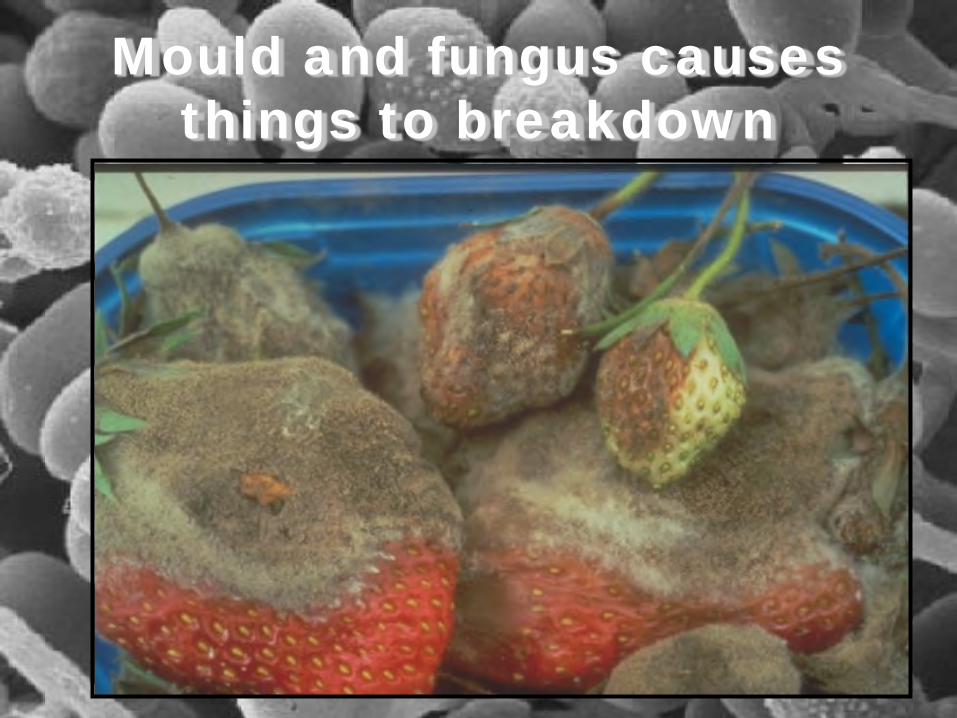
Mould and fungus causes things to breakdown

Fungus taking over

Athletes foot

Oral thrush
Thrush yeast cells

(So a pathogen is the scientific name for a germ!)
A Pathogen is something that causes disease
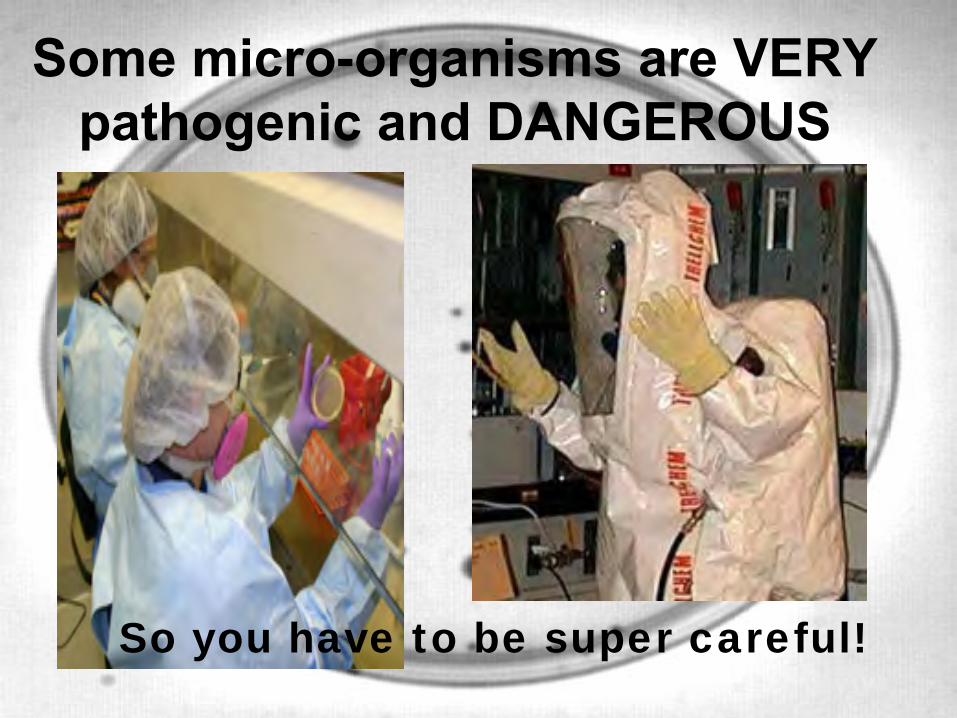
Some micro-organisms are VERY pathogenic and DANGEROUS
So you have to be super careful!

How well do you wash your
hands?

WEEK 3: Water Treatment Options
MODULE 1:WATER TREATMENT
MO
DU
LE 1W
EEK 3

CURRICULUM LINKS
© Busselton Water Schools Education Programme
MODULE 1: WATER TREATMENT WEEK3 Water treatment options
LESSON 1 Students research and identify the different types of water treatment available in Australia.
CURRICULUM LINKS
YEAR 2 | SCIENCE Earth’s resources, including water, are used in a variety of ways (ACSSU032) YEAR 4 | GEOGRAPHY The sustainable management of waste from production and consumption (ACHGK025) YEAR 7 | SCIENCE Science understanding influences the development of practices in areas of human activity such as industry, agriculture and marine and terrestrial resource management (ACSHE121) Water is an important resource that cycles through the environment (ACSSU222)
CROSS CURRICULUM PRIORITIES Sustainability
GENERAL CAPABILITIES Ethical Understanding

CURRICULUM LINKS
© Busselton Water Schools Education Programme
MODULE 1: WATER TREATMENT WEEK3 Water treatment options
LESSON 2 Students make their own mini water filter.
CURRICULUM LINKS
YEAR 2 |SCIENCE Earth’s resources, including water, are used in a variety of ways (ACSSU032) YEAR 4 |GEOGRAPHY The sustainable management of waste from production and consumption (ACHGK025) YEAR 7 | SCIENCE Science understanding influences the development of practices in areas of human activity such as industry, agriculture and marine and terrestrial resource management (ACSHE121) Mixtures, including solutions, contain a combination of pure substances that can be separated using a range of techniques (ACSSU113)
CROSS CURRICULUM PRIORITIES
Sustainability
GENERAL CAPABILITIES Ethical Understanding
© Busselton Water Schools Education Programme 13
TEACHER’S NOTES
Water Treatment Options
Review documents as follows:• Busselton Water’s treatment process• Busselton Water plant location map • Making a mini filter worksheet
Students brainstorm the various treatment processes they have discovered over the past two weeks including:• Chlorination• UV treatment• Reverse Osmosis• Ozonation
Students break into groups and choose one of the treatment options. Students create a flow chart to show how the treatment process works. Students develop a list of positive/negatives for their chosen treatment and present to their class.
LESSON ONE
Students create their own mini water filters and complete accompanying activity sheet.
LESSON TWO
Illus
trat
ion:
© W
ater
Cor
por
atio
n
MODULE 1: WATER TREATMENTWEEK 3
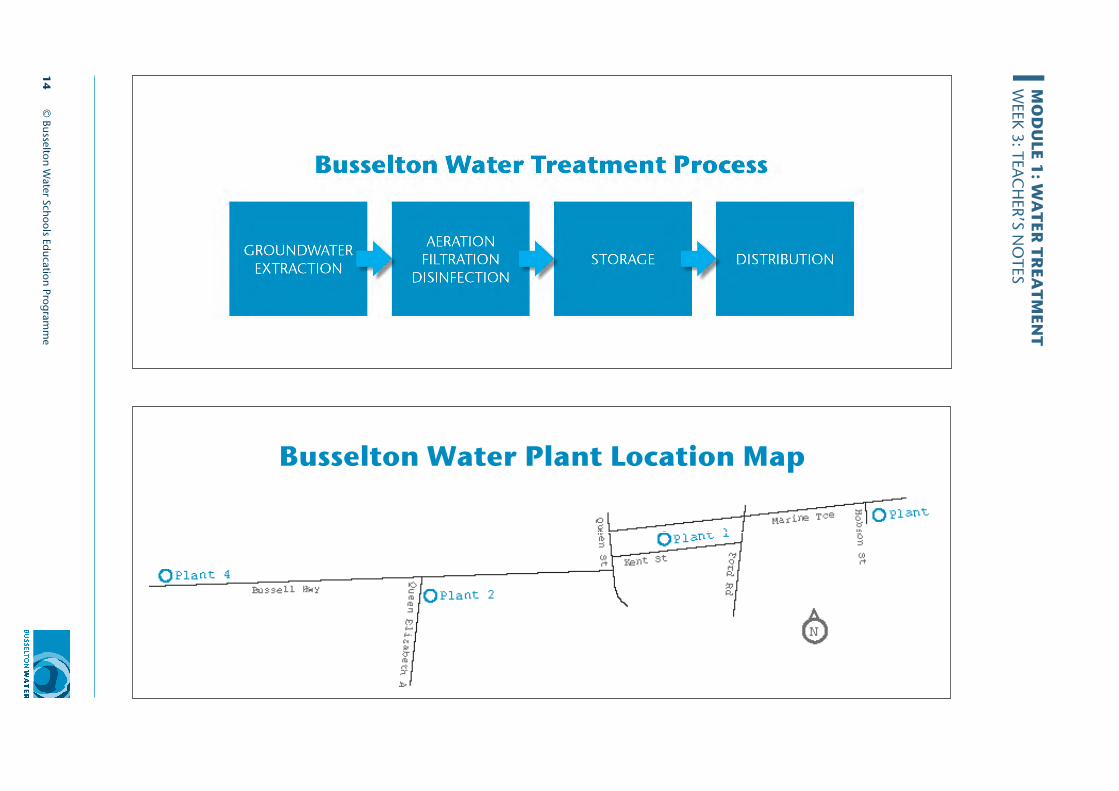
14
© Busselton W
ater Schools Education Programm
e
MO
DU
LE 1: W
ATER
TREA
TMEN
TW
EEK 3: TEAC
HER’S N
OTES
Busselton Water Plant Location Map
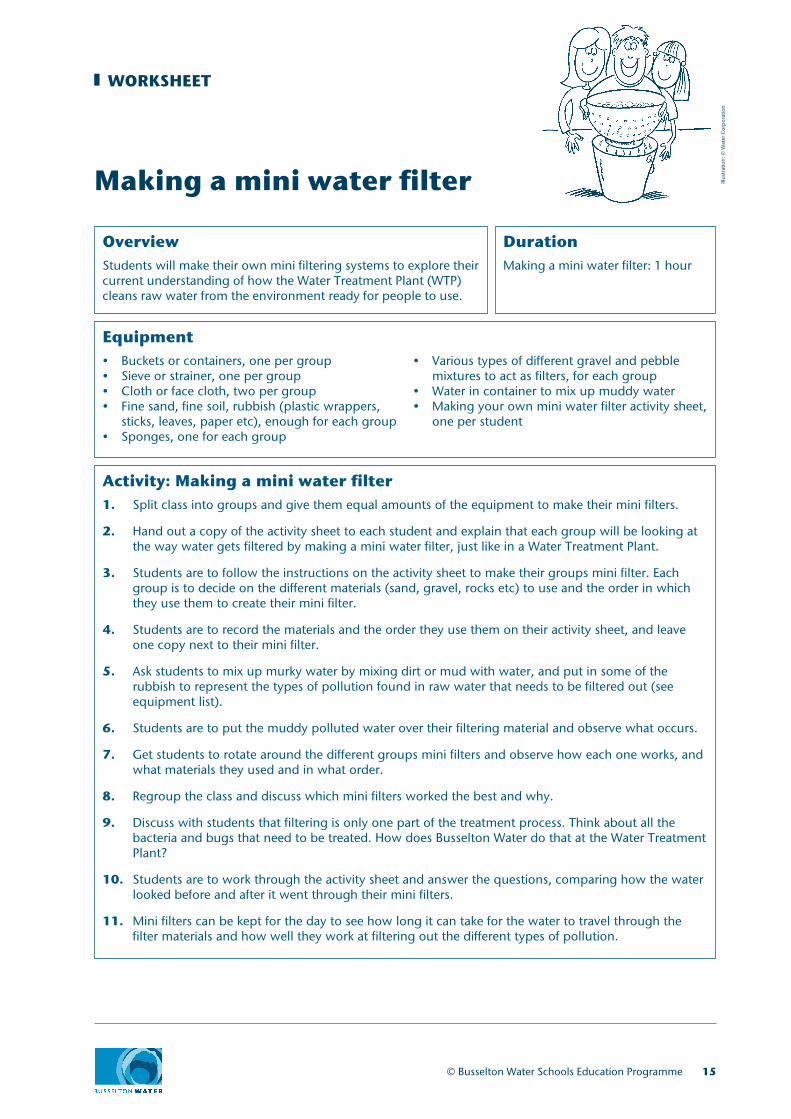
Making a mini water filter
WORKSHEET
OverviewStudents will make their own mini filtering systems to explore their current understanding of how the Water Treatment Plant (WTP) cleans raw water from the environment ready for people to use.
DurationMaking a mini water filter: 1 hour
Equipment• Buckets or containers, one per group• Sieve or strainer, one per group• Cloth or face cloth, two per group• Fine sand, fine soil, rubbish (plastic wrappers,
sticks, leaves, paper etc), enough for each group• Sponges, one for each group
Equipment• Various types of different gravel and pebble
mixtures to act as filters, for each group• Water in container to mix up muddy water• Making your own mini water filter activity sheet,
one per student
Activity: Making a mini water filter1. Split class into groups and give them equal amounts of the equipment to make their mini filters.
2. Hand out a copy of the activity sheet to each student and explain that each group will be looking at the way water gets filtered by making a mini water filter, just like in a Water Treatment Plant.
3. Students are to follow the instructions on the activity sheet to make their groups mini filter. Each group is to decide on the different materials (sand, gravel, rocks etc) to use and the order in which they use them to create their mini filter.
4. Students are to record the materials and the order they use them on their activity sheet, and leave one copy next to their mini filter.
5. Ask students to mix up murky water by mixing dirt or mud with water, and put in some of the rubbish to represent the types of pollution found in raw water that needs to be filtered out (see equipment list).
6. Students are to put the muddy polluted water over their filtering material and observe what occurs.
7. Get students to rotate around the different groups mini filters and observe how each one works, and what materials they used and in what order.
8. Regroup the class and discuss which mini filters worked the best and why.
9. Discuss with students that filtering is only one part of the treatment process. Think about all the bacteria and bugs that need to be treated. How does Busselton Water do that at the Water Treatment Plant?
10. Students are to work through the activity sheet and answer the questions, comparing how the water looked before and after it went through their mini filters.
11. Mini filters can be kept for the day to see how long it can take for the water to travel through the filter materials and how well they work at filtering out the different types of pollution.
© Busselton Water Schools Education Programme 15
Illus
trat
ion:
© W
ater
Cor
por
atio
n
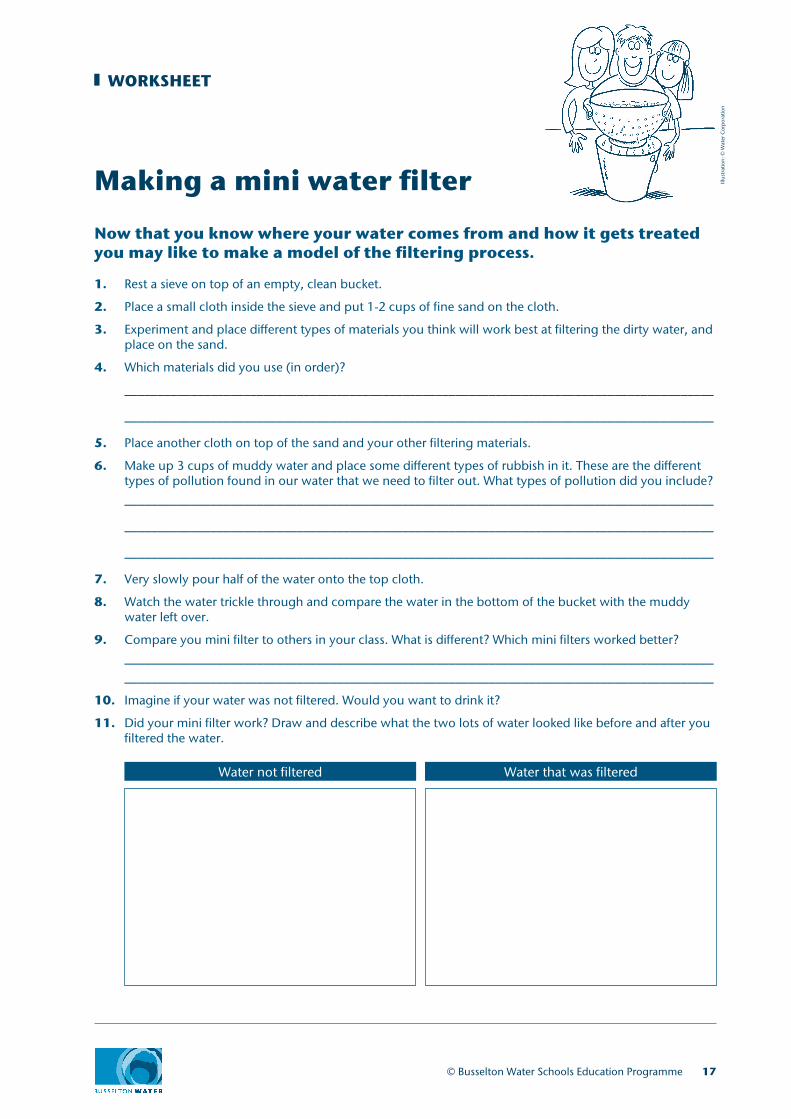
Making a mini water filter
WORKSHEET
Now that you know where your water comes from and how it gets treated you may like to make a model of the filtering process.
1. Rest a sieve on top of an empty, clean bucket.
2. Place a small cloth inside the sieve and put 1-2 cups of fine sand on the cloth.
3. Experiment and place different types of materials you think will work best at filtering the dirty water, and place on the sand.
4. Which materials did you use (in order)?
_________________________________________________________________________________________
_________________________________________________________________________________________
5. Place another cloth on top of the sand and your other filtering materials.
6. Make up 3 cups of muddy water and place some different types of rubbish in it. These are the different types of pollution found in our water that we need to filter out. What types of pollution did you include?
_________________________________________________________________________________________
_________________________________________________________________________________________
_________________________________________________________________________________________
7. Very slowly pour half of the water onto the top cloth.
8. Watch the water trickle through and compare the water in the bottom of the bucket with the muddy water left over.
9. Compare you mini filter to others in your class. What is different? Which mini filters worked better? _________________________________________________________________________________________ _________________________________________________________________________________________
10. Imagine if your water was not filtered. Would you want to drink it?
11. Did your mini filter work? Draw and describe what the two lots of water looked like before and after you filtered the water.
Water not filtered Water that was filtered
© Busselton Water Schools Education Programme 17
Illus
trat
ion:
© W
ater
Cor
por
atio
n
WEEK 4: Busselton Water Operations
MODULE 1:WATER TREATMENT
MO
DU
LE 1W
EEK 4
CURRICULUM LINKS
© Busselton Water Schools Education Programme
MODULE 1: WATER TREATMENT WEEK 4 Busselton Water Operations
LESSON 1 Visit the Busselton Water treatment plant.
CURRICULUM LINKS
YEAR 2 | SCIENCE Earth’s resources, including water, are used in a variety of ways(ACSSU032)
YEAR 4 | GEOGRAPHY The natural resources provided by the environment, and different views on how they could be used sustainably (ACHGK024)
The sustainable management of waste from production and consumption (ACHGK025)
Year 7 | SCIENCE Water is an important resource that cycles through the environment (ACSSU222)
YEAR 7 | GEOGRAPHY The classification of environmental resources and the forms that water takes as a resource (ACHGK037)
The ways that flows of water connect places as it moves through the environment and the way this affects places (ACHGK038)
The quantity and variability of Australia’s water resources compared with those in other continents (ACHGK039)
The nature of water scarcity and ways of overcoming it, including studies drawn from Australia and West Asia and/or North Africa (ACHGK040)
The economic, cultural, spiritual and aesthetic value of water for people, including Aboriginal and Torres Strait Islander Peoples and peoples of the Asia region (ACHGK041)
The factors that influence the decisions people make about where to live and their perceptions of the liveability of places (ACHGK043)
The influence of accessibility to services and facilities on the liveability of places (ACHGK044)
The influence of environmental quality on the liveability of places (ACHGK045)
The strategies used to enhance the liveability of places, especially for young people, including examples from Australia and Europe (ACHGK047)
CROSS CURRICULUM PRIORITIES Sustainability
GENERAL CAPABILITIES Ethical Understanding
CURRICULUM LINKS
© Busselton Water Schools Education Programme
MODULE 1: WATER TREATMENT WEEK 4 Busselton Water Operations
LESSON 2 Students map the existing Busselton Water treatment plants within Busselton.
CURRICULUM LINKS
YEAR 2 | SCIENCE Earth’s resources, including water, are used in a variety of ways(ACSSU032)
YEAR 4 | GEOGRAPHY The natural resources provided by the environment, and different views on how they could be used sustainably (ACHGK024)
The sustainable management of waste from production and consumption (ACHGK025)
Year 7 | SCIENCE Water is an important resource that cycles through the environment (ACSSU222)
YEAR 7 | GEOGRAPHY The classification of environmental resources and the forms that water takes as a resource (ACHGK037)
The ways that flows of water connect places as it moves through the environment and the way this affects places (ACHGK038)
The quantity and variability of Australia’s water resources compared with those in other continents (ACHGK039)
The nature of water scarcity and ways of overcoming it, including studies drawn from Australia and West Asia and/or North Africa (ACHGK040)
The economic, cultural, spiritual and aesthetic value of water for people, including Aboriginal and Torres Strait Islander Peoples and peoples of the Asia region (ACHGK041)
The factors that influence the decisions people make about where to live and their perceptions of the liveability of places (ACHGK043)
The influence of accessibility to services and facilities on the liveability of places (ACHGK044)
The influence of environmental quality on the liveability of places (ACHGK045)
The strategies used to enhance the liveability of places, especially for young people, including examples from Australia and Europe (ACHGK047)
CROSS CURRICULUM PRIORITIES Sustainability
GENERAL CAPABILITIES Ethical Understanding

© Busselton Water Schools Education Programme 19
TEACHER’S NOTES
Busselton Water Operations
Review documents as follows:
• Busselton Water Plant Location map• "Where does our drinking water come from?" activity sheet
Visit the Busselton Water Treatment Plant. To book a tour contact Busselton Water on 9781 0500.
LESSON ONE
Students review with the teacher the visit to the treatment plant and key highlights. Students complete activity sheet “Where does our drinking water come from?” activity sheet.
Students are then provided with a list of the 4 plants in Busselton and working in pairs mark the plants on the Busselton map (use Google Maps as a tool).
Students identify if their houses, schools etc are near the treatment plants.
Discuss if there were any odours, noise etc which could impact on residents.
LESSON TWO
Additional creative ideas:Students prepare a letter of thanks to Busselton Water outlining their favourite part of the tour.
MODULE 1: WATER TREATMENTWEEK 4
SPRAY NOZZLE AERATOR
UNDERGROUND WATER SUPPLY - YARRAGADEE / LEEDERVILLE AQUIFIER
DIS
INFE
CTI
ON
CLE
AR
WE
LL T
AN
K
STO
RA
GE
TA
NK
SAND
SCREEN
FILTER FLOORS
PUMP
BORE
WATER TREATMENT AND SUPPLY PROCESS
DISTRIBUTION

Where does our drinking water come from?
ACTIVITY SHEET: Water Treatment Plant Excursion
When you turn on the tap at home, do you know how that water got there and how it is cleaned?
You can find out the answers to these questions on the field trip to your water treatment plant.
Name: _________________________________________________________________ Date: _________________
Which Busselton Water Treatment Plant (WTP) did you visit: ____________________________________________
1. Where does the water you drink at school come from? ___________________________________________
2. What is an aquifer? _________________________________________________________________________
3. What is the name of the aquifer that is closest to the earths surface? _________________________________
4. Name 2 minerals that are found in the water before it is treated?
1. _________________________________________ 2. _______________________________________
5. What is the approximate temperature of the water when it is extracted? ______________________________
6. What is the name of the disinfection process Busselton Water uses? ________________________________
7. Why is your water disinfected? ________________________________________________________________
8. What substance is used in the filter tanks to FILTER the water? _____________________________________
9. Why is your water filtered? ___________________________________________________________________
10. How does the water get from the WTP to your tap? ______________________________________________
11. What is the big grey tank behind the chlorination facility called? ___________________________________
12. How many litres are in a gigalitre? ____________________________________________________________
13. How many litres are in a kilolitre? _____________________________________________________________
© Busselton Water Schools Education Programme 21
Illus
trat
ion:
© W
ater
Cor
por
atio
n
22 © Busselton Water Schools Education Programme
WORKSHEET: Water Treatment Plant Excursion
14. How can we help save water in our homes and schools?
_________________________________________________________________________________________
_________________________________________________________________________________________
_________________________________________________________________________________________
_________________________________________________________________________________________
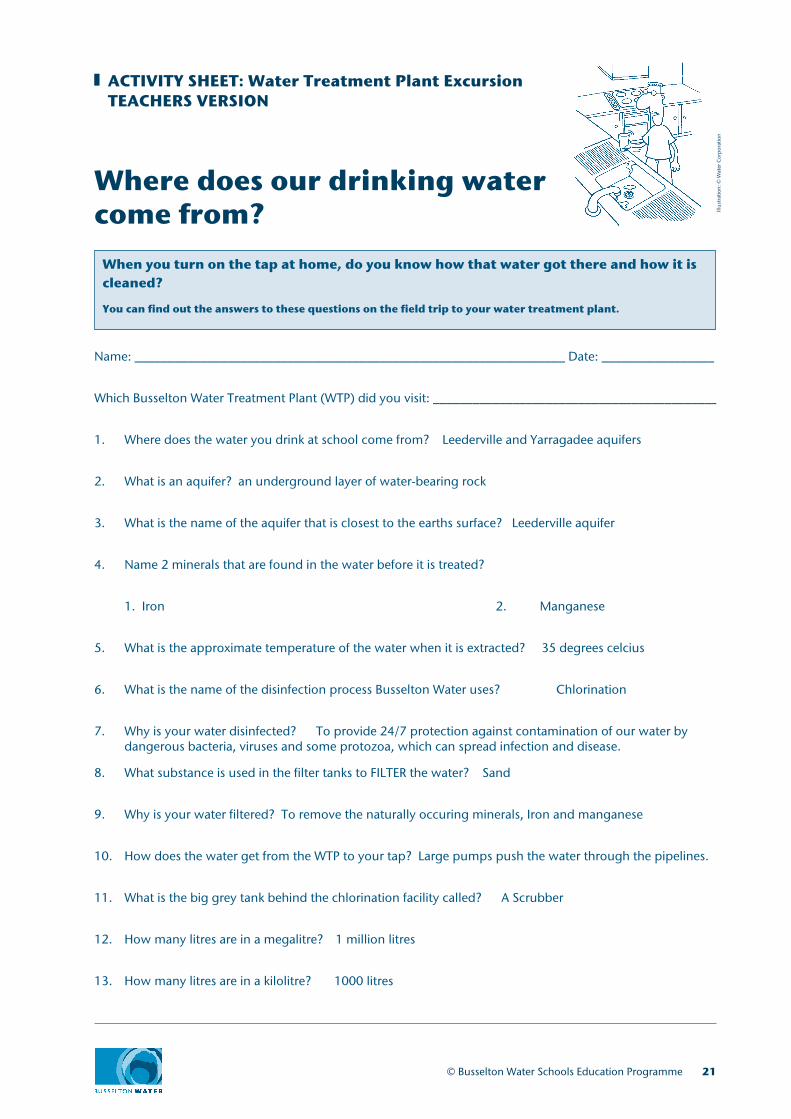
Where does our drinking water come from?
ACTIVITY SHEET: Water Treatment Plant ExcursionTEACHERS VERSION
When you turn on the tap at home, do you know how that water got there and how it is cleaned?
You can find out the answers to these questions on the field trip to your water treatment plant.
Name: _________________________________________________________________ Date: _________________
Which Busselton Water Treatment Plant (WTP) did you visit: ____________________________________________
1. Where does the water you drink at school come from? Leederville and Yarragadee aquifers
2. What is an aquifer? an underground layer of water-bearing rock
3. What is the name of the aquifer that is closest to the earths surface? Leederville aquifer
4. Name 2 minerals that are found in the water before it is treated?
1. Iron 2. Manganese
5. What is the approximate temperature of the water when it is extracted? 35 degrees celcius
6. What is the name of the disinfection process Busselton Water uses? Chlorination
7. Why is your water disinfected? To provide 24/7 protection against contamination of our water by dangerous bacteria, viruses and some protozoa, which can spread infection and disease.
8. What substance is used in the filter tanks to FILTER the water? Sand
9. Why is your water filtered? To remove the naturally occuring minerals, Iron and manganese
10. How does the water get from the WTP to your tap? Large pumps push the water through the pipelines.
11. What is the big grey tank behind the chlorination facility called? A Scrubber
12. How many litres are in a megalitre? 1 million litres
13. How many litres are in a kilolitre? 1000 litres
© Busselton Water Schools Education Programme 21
Illus
trat
ion:
© W
ater
Cor
por
atio
n
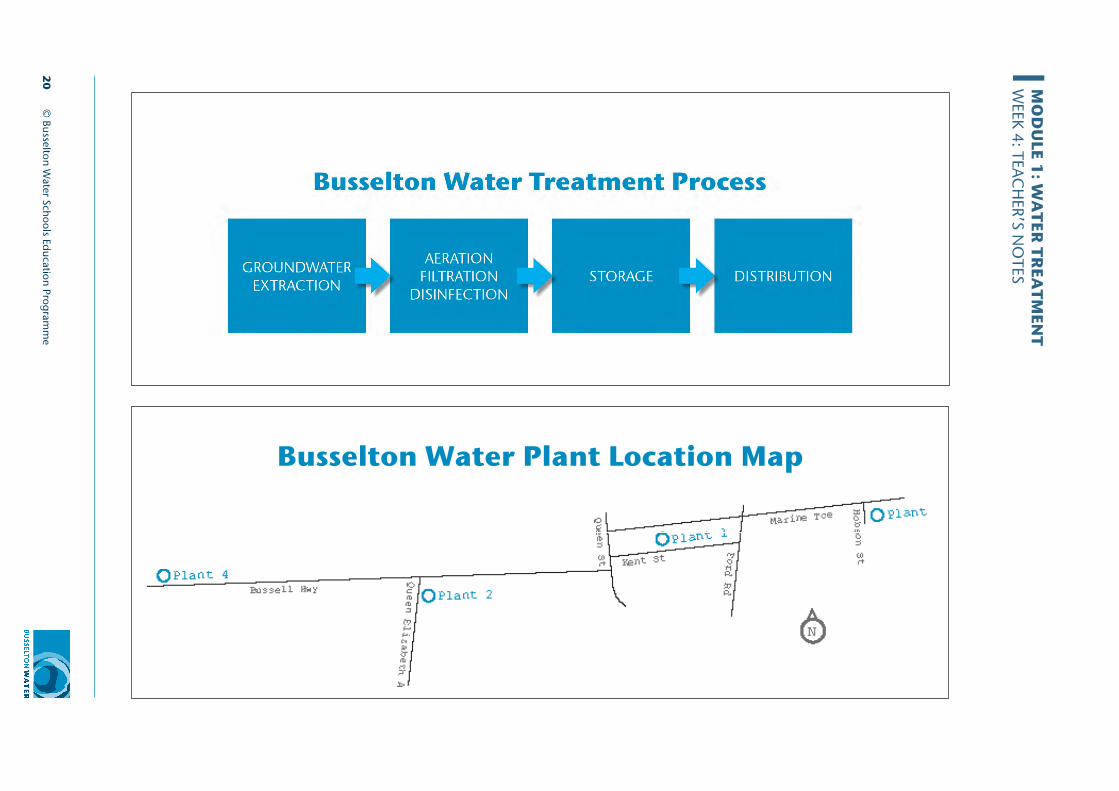
20
© Busselton W
ater Schools Education Programm
e
MO
DU
LE 1: W
ATER
TREA
TMEN
TW
EEK 4: TEAC
HER’S N
OTES
Busselton Water Plant Location Map
WEEK 5: Water Treatment Now
MODULE 1:WATER TREATMENT
MO
DU
LE 1W
EEK 5

CURRICULUM LINKS
© Busselton Water Schools Education Programme
MODULE 1: WATER TREATMENT WEEK5 Water treatment now
LESSON 1 Students research and present the reasons for Busselton Water changing to chlorination treatment.
CURRICULUM LINKS
YEAR 4 | GEOGRAPHY The sustainable management of waste from production and consumption (ACHGK025) YEAR 7 | SCIENCE Science understanding influences the development of practices in areas of human activity such as industry, agriculture and marine and terrestrial resource management (ACSHE121)
CROSS CURRICULUM PRIORITIES Sustainability
GENERAL CAPABILITIES Ethical Understanding

CURRICULUM LINKS
© Busselton Water Schools Education Programme
MODULE 1: WATER TREATMENT WEEK5 Water treatment now
LESSON 2 Students conduct a taste/smell test with chlorine/non chlorine water and record their findings.
CURRICULUM LINKS
SCIENCE ENQUIRY – ACROSS ALL YEAR LEVELS Science Enquiry involves identifying and posing questions; planning, conducting and reflecting on investigations; processing, analysing and interpreting evidence; and communicating findings. This strand is concerned with evaluating claims, investigating ideas, solving problems, drawing valid conclusions and developing evidence-based arguments. Specific curriculum links to the following year levels; YEAR 2 | SCIENCE Earth’s resources, including water, are used in a variety of ways (ACSSU032) YEAR 4 | GEOGRAPHY The sustainable management of waste from production and consumption (ACHGK025) YEAR 7 | GEOGRAPHY The influence of environmental quality on the liveability of places (ACHGK045)
CROSS CURRICULUM PRIORITIES
Sustainability
GENERAL CAPABILITIES Ethical Understanding
© Busselton Water Schools Education Programme 23
TEACHER’S NOTES
Water Treatment Now
Review documents as follows:• “Chlorine FAQ’s” information brochure• “Can you tell the difference?” worksheet
Students recap their visit to the Busselton Water Treatment Plant and discuss how the flow chart created for the treatment process (week 3) reflected what they experienced during the excursion.
Students discuss the reasons why Busselton Water introduced chlorination within the treatment of the drinking water:• Extension of network to accommodate growth • Presence of non-harmful amoeba which indicates that there is likelihood for harmful pathogens to
develop• Chlorination leaves behind a residual disinfectant • It is important for public health
Students discuss the reasons why there has been community concern about the introduction of chlorination-
Some people in the community have said:• Chlorine is a poison• The water has been fine with UV treatment up until now• There are other treatment options that Busselton Water could introduce other than chlorination• Busselton water tastes too good and should not be affected with chlorine treatment
Students prepare a letter to the Busselton Water Board explaining their views about the decision to treat the drinking water with chlorination.
LESSON ONE
MODULE 1: WATER TREATMENTWEEK 5
Students are broken into groups and provided with one container of bottled water/tank water (labeled A) and one container of water treated with chlorination (Bunbury or Dunsborough water – labeled B).
Students undertake the following experiments to determine if there is any difference between the two containers and then record their answers on the worksheet “Can you tell the difference?”
1. Smell both containers of water2. Look at the clarity of the water 3. Take a teaspoon of water and taste
At the end of the experiment students share their findings with the remainder of the class.
LESSON TWO
Additional creative ideas:
Students research on the internet what options can be installed in the home to filter chlorinated water. Students choose their preferred option and create a promotional poster.Students develop a debate for and against the treatment of water with chlorination and present to the class.
24 © Busselton Water Schools Education Programme
MODULE 1: WATER TREATMENTWEEK 5: TEACHER’S NOTES

Can you tell the difference?
WORKSHEET
1. Have a smell of both containers
What does container A smell of? __________________________________________________________________
What does container B smell of? __________________________________________________________________
Is there any difference between the two containers? _________________________________________________
2. Look at the water and the clarity
What does container A look like in terms of clarity? ___________________________________________________
What does container B look like in terms of clarity? ___________________________________________________
Is there any difference between the two containers? _____________________________________________
3. Take a teaspoon of the water for each container and have a taste
What does container A taste like? _____________________________________________________________
What does container B taste like? _____________________________________________________________
Is there any difference between the two containers? _____________________________________________
Write down your observations for the containers as follows:
Container A ______________________________________________________________________________
_________________________________________________________________________________________
Container B _______________________________________________________________________________
_________________________________________________________________________________________
Which one do you think has been treated with chlorination?
_________________________________________________________________________________________
_________________________________________________________________________________________
With the two containers labeled A and B, do the following and record your observations:
© Busselton Water Schools Education Programme 25
Illus
trat
ion:
© W
ater
Cor
por
atio
n
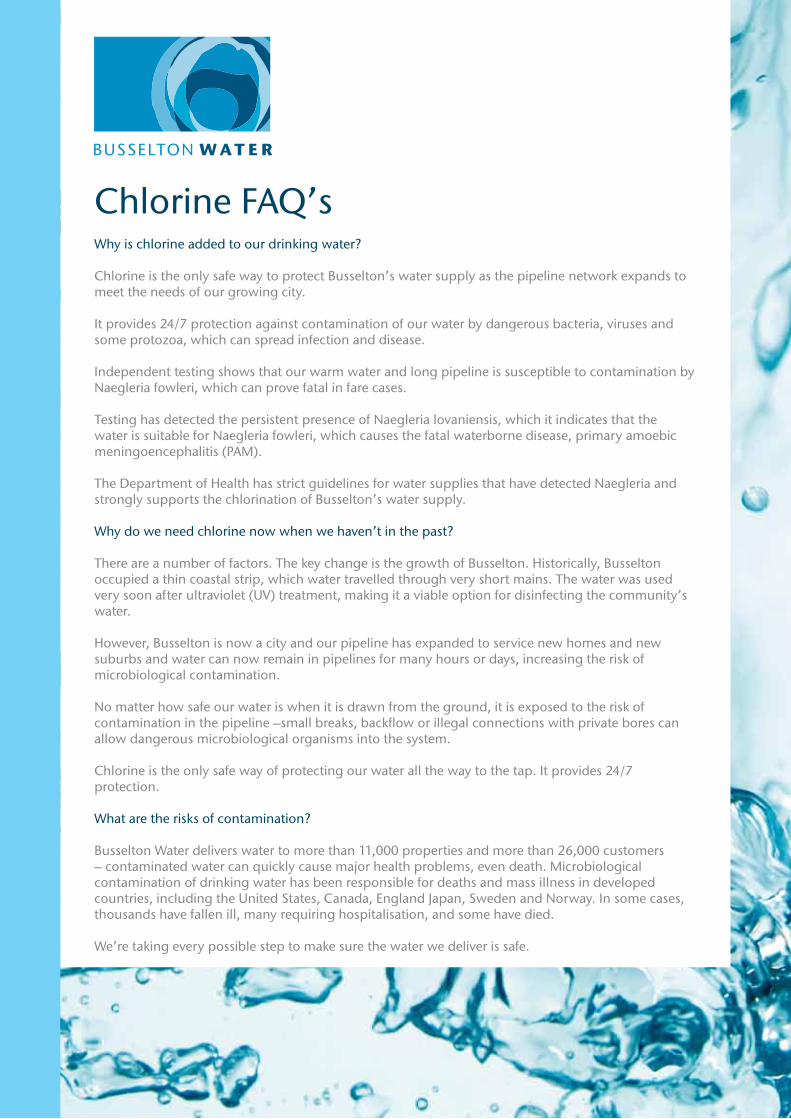
Chlorine FAQ’sWhy is chlorine added to our drinking water?
Chlorine is the only safe way to protect Busselton’s water supply as the pipeline network expands to meet the needs of our growing city.
It provides 24/7 protection against contamination of our water by dangerous bacteria, viruses and some protozoa, which can spread infection and disease.
Independent testing shows that our warm water and long pipeline is susceptible to contamination by Naegleria fowleri, which can prove fatal in fare cases.
Testing has detected the persistent presence of Naegleria lovaniensis, which it indicates that the water is suitable for Naegleria fowleri, which causes the fatal waterborne disease, primary amoebic meningoencephalitis (PAM).
The Department of Health has strict guidelines for water supplies that have detected Naegleria and strongly supports the chlorination of Busselton’s water supply.
Why do we need chlorine now when we haven’t in the past?
There are a number of factors. The key change is the growth of Busselton. Historically, Busselton occupied a thin coastal strip, which water travelled through very short mains. The water was used very soon after ultraviolet (UV) treatment, making it a viable option for disinfecting the community’s water.
However, Busselton is now a city and our pipeline has expanded to service new homes and new suburbs and water can now remain in pipelines for many hours or days, increasing the risk of microbiological contamination.
No matter how safe our water is when it is drawn from the ground, it is exposed to the risk of contamination in the pipeline –small breaks, backflow or illegal connections with private bores can allow dangerous microbiological organisms into the system.
Chlorine is the only safe way of protecting our water all the way to the tap. It provides 24/7 protection.
What are the risks of contamination?
Busselton Water delivers water to more than 11,000 properties and more than 26,000 customers – contaminated water can quickly cause major health problems, even death. Microbiological contamination of drinking water has been responsible for deaths and mass illness in developed countries, including the United States, Canada, England Japan, Sweden and Norway. In some cases, thousands have fallen ill, many requiring hospitalisation, and some have died.
We’re taking every possible step to make sure the water we deliver is safe.
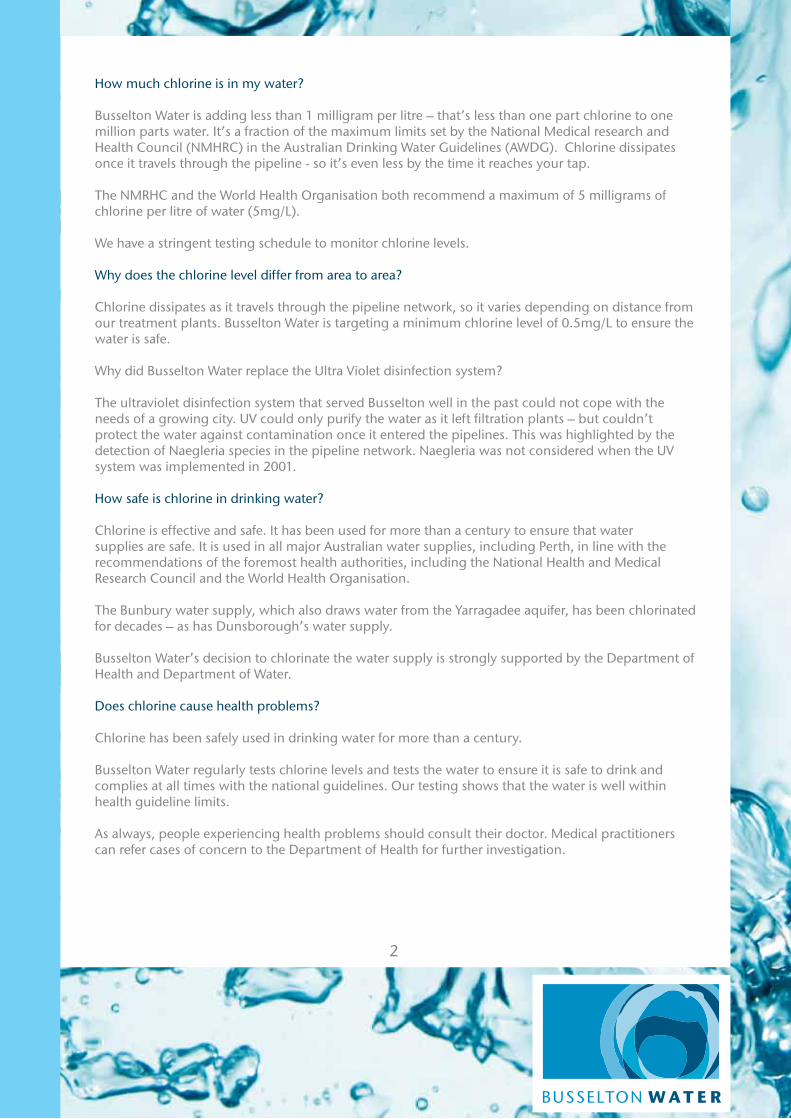
How much chlorine is in my water?
Busselton Water is adding less than 1 milligram per litre – that’s less than one part chlorine to one million parts water. It’s a fraction of the maximum limits set by the National Medical research and Health Council (NMHRC) in the Australian Drinking Water Guidelines (AWDG). Chlorine dissipates once it travels through the pipeline - so it’s even less by the time it reaches your tap.
The NMRHC and the World Health Organisation both recommend a maximum of 5 milligrams of chlorine per litre of water (5mg/L).
We have a stringent testing schedule to monitor chlorine levels.
Why does the chlorine level differ from area to area?
Chlorine dissipates as it travels through the pipeline network, so it varies depending on distance from our treatment plants. Busselton Water is targeting a minimum chlorine level of 0.5mg/L to ensure the water is safe.
Why did Busselton Water replace the Ultra Violet disinfection system?
The ultraviolet disinfection system that served Busselton well in the past could not cope with the needs of a growing city. UV could only purify the water as it left filtration plants – but couldn’t protect the water against contamination once it entered the pipelines. This was highlighted by the detection of Naegleria species in the pipeline network. Naegleria was not considered when the UV system was implemented in 2001.
How safe is chlorine in drinking water?
Chlorine is effective and safe. It has been used for more than a century to ensure that water supplies are safe. It is used in all major Australian water supplies, including Perth, in line with the recommendations of the foremost health authorities, including the National Health and Medical Research Council and the World Health Organisation.
The Bunbury water supply, which also draws water from the Yarragadee aquifer, has been chlorinated for decades – as has Dunsborough’s water supply.
Busselton Water’s decision to chlorinate the water supply is strongly supported by the Department of Health and Department of Water.
Does chlorine cause health problems?
Chlorine has been safely used in drinking water for more than a century.
Busselton Water regularly tests chlorine levels and tests the water to ensure it is safe to drink and complies at all times with the national guidelines. Our testing shows that the water is well within health guideline limits.
As always, people experiencing health problems should consult their doctor. Medical practitioners can refer cases of concern to the Department of Health for further investigation.
2
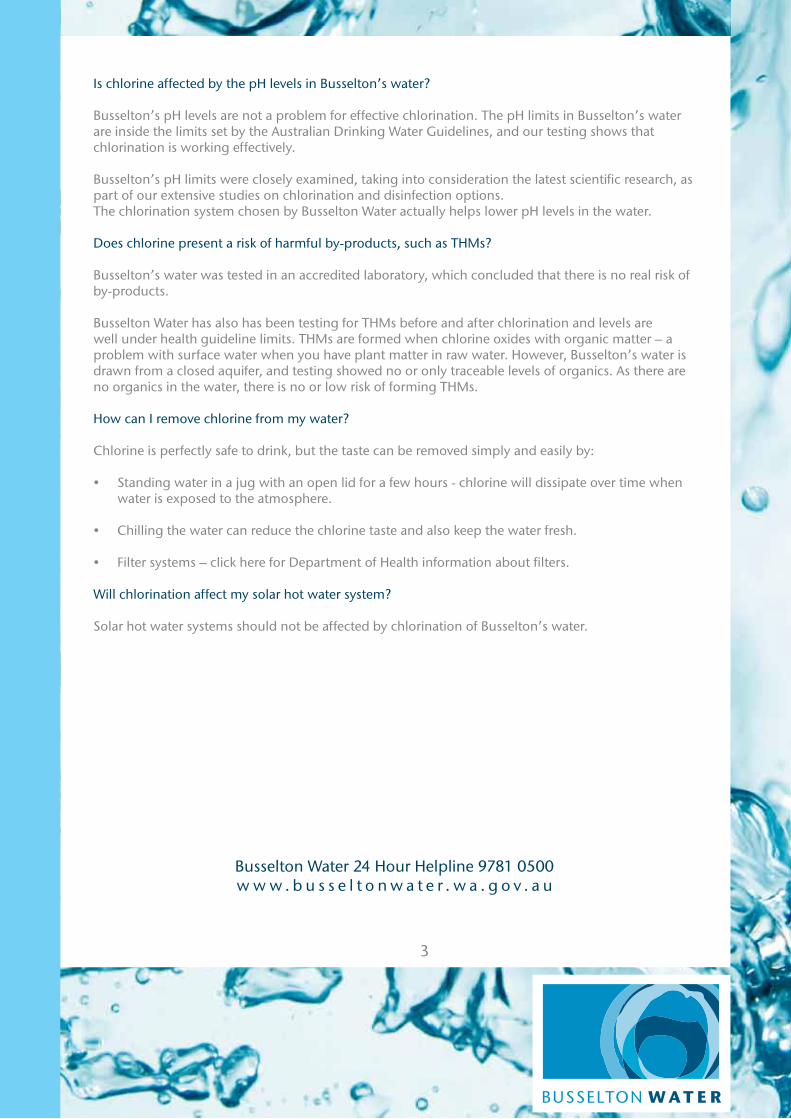
Is chlorine affected by the pH levels in Busselton’s water?
Busselton’s pH levels are not a problem for effective chlorination. The pH limits in Busselton’s water are inside the limits set by the Australian Drinking Water Guidelines, and our testing shows that chlorination is working effectively.
Busselton’s pH limits were closely examined, taking into consideration the latest scientific research, as part of our extensive studies on chlorination and disinfection options.The chlorination system chosen by Busselton Water actually helps lower pH levels in the water.
Does chlorine present a risk of harmful by-products, such as THMs?
Busselton’s water was tested in an accredited laboratory, which concluded that there is no real risk of by-products.
Busselton Water has also has been testing for THMs before and after chlorination and levels are well under health guideline limits. THMs are formed when chlorine oxides with organic matter – a problem with surface water when you have plant matter in raw water. However, Busselton’s water is drawn from a closed aquifer, and testing showed no or only traceable levels of organics. As there are no organics in the water, there is no or low risk of forming THMs.
How can I remove chlorine from my water?
Chlorine is perfectly safe to drink, but the taste can be removed simply and easily by:
• Standing water in a jug with an open lid for a few hours - chlorine will dissipate over time when water is exposed to the atmosphere.
• Chilling the water can reduce the chlorine taste and also keep the water fresh.
• Filter systems – click here for Department of Health information about filters.
Will chlorination affect my solar hot water system?
Solar hot water systems should not be affected by chlorination of Busselton’s water.
Busselton Water 24 Hour Helpline 9781 0500 w w w . b u s s e l t o n w a t e r . w a . g o v . a u
3
WEEK 6: Water Treatment
MODULE 1:WATER TREATMENT
MO
DU
LE 1W
EEK 6

CURRICULUM LINKS
© Busselton Water Schools Education Programme
MODULE 1: WATER TREATMENT WEEK 6 Water Treatment
LESSON 1 Students draw their school and all areas where water is used. Students then indicate how water enters/exits their school premises.
CURRICULUM LINKS
YEAR 2 | SCIENCE Earth’s resources, including water, are used in a variety of ways (ACSSU032) YEAR 4 | GEOGRAPHY The natural resources provided by the environment, and different views on how they could be used sustainably (ACHGK024) YEAR 7 | GEOGRAPHY The classification of environmental resources and the forms that water takes as a resource (ACHGK037)
CROSS CURRICULUM PRIORITIES Sustainability
GENERAL CAPABILITIES Ethical Understanding
CURRICULUM LINKS
© Busselton Water Schools Education Programme
MODULE 1: WATER TREATMENT WEEK 6 Water Treatment
LESSON 1 Students complete similar exercise for their home and share their experiences with the class.
CURRICULUM LINKS
YEAR 2 | SCIENCE Earth’s resources, including water, are used in a variety of ways (ACSSU032) YEAR 4 | GEOGRAPHY The natural resources provided by the environment, and different views on how they could be used sustainably (ACHGK024) YEAR 7 | GEOGRAPHY The classification of environmental resources and the forms that water takes as a resource (ACHGK037)
CROSS CURRICULUM PRIORITIES
Sustainability
GENERAL CAPABILITIES Ethical Understanding
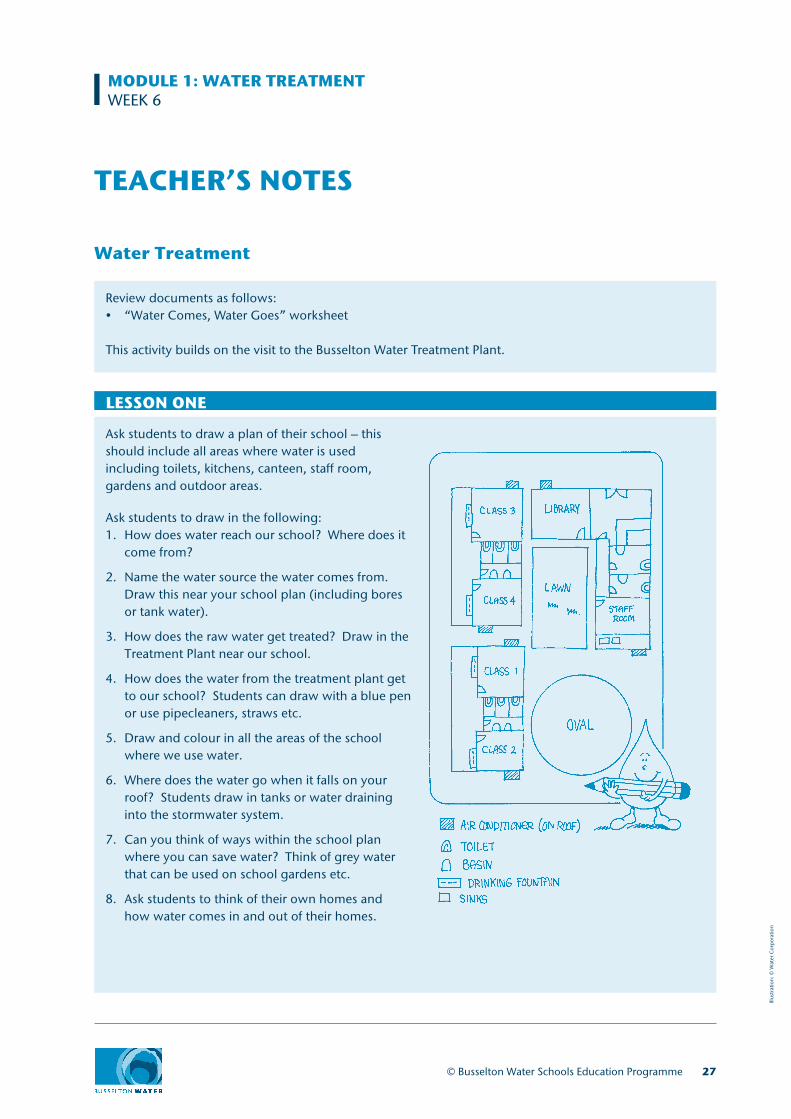
TEACHER’S NOTES
Water Treatment
Review documents as follows:• “Water Comes, Water Goes” worksheet
This activity builds on the visit to the Busselton Water Treatment Plant.
Ask students to draw a plan of their school – this should include all areas where water is usedincluding toilets, kitchens, canteen, staff room, gardens and outdoor areas.
Ask students to draw in the following:1. How does water reach our school? Where does it come from?
2. Name the water source the water comes from. Draw this near your school plan (including bores or tank water).
3. How does the raw water get treated? Draw in the Treatment Plant near our school.
4. How does the water from the treatment plant get to our school? Students can draw with a blue pen or use pipecleaners, straws etc.
5. Draw and colour in all the areas of the school where we use water.
6. Where does the water go when it falls on your roof? Students draw in tanks or water draining into the stormwater system.
7. Can you think of ways within the school plan where you can save water? Think of grey water that can be used on school gardens etc.
8. Ask students to think of their own homes and how water comes in and out of their homes.
LESSON ONE
© Busselton Water Schools Education Programme 27
Illus
trat
ion:
© W
ater
Cor
por
atio
n
MODULE 1: WATER TREATMENTWEEK 6
Students draw their own home and repeat steps 1-7.1. How does water reach our home? Where does it come from?2. Name the water source the water comes from. Draw this near your home plan (including bores
or tank water)3. How does the raw water get treated? Draw in the Treatment Plant near our home.4. How does the water from the treatment plant get to our home? Students can draw with a blue pen
or use pipecleaners, straws etc.5. Draw and colour in all the areas of the home where we use water.6. Where does the water go when it falls on your roof? Students draw in tanks or water draining into
the stormwater system.7. Can you think of ways within the home where you can save water? Think of grey water that can
be used on gardens etc.
Students then share their findings with their class mates. In particular select students who may live on rural properties and access water from tanks/dams or in Dunsborough who access water through the Water Corporation.
LESSON TWO
Additional creative ideas
Students research and create a water dictionary to learn about the following terms:• Raw water• Reticulated or potable water• Tank water• Stormwater• Sewerage• Septic tank• Grey water
28 © Busselton Water Schools Education Programme
MODULE 1: WATER TREATMENTWEEK 6: TEACHER’S NOTES
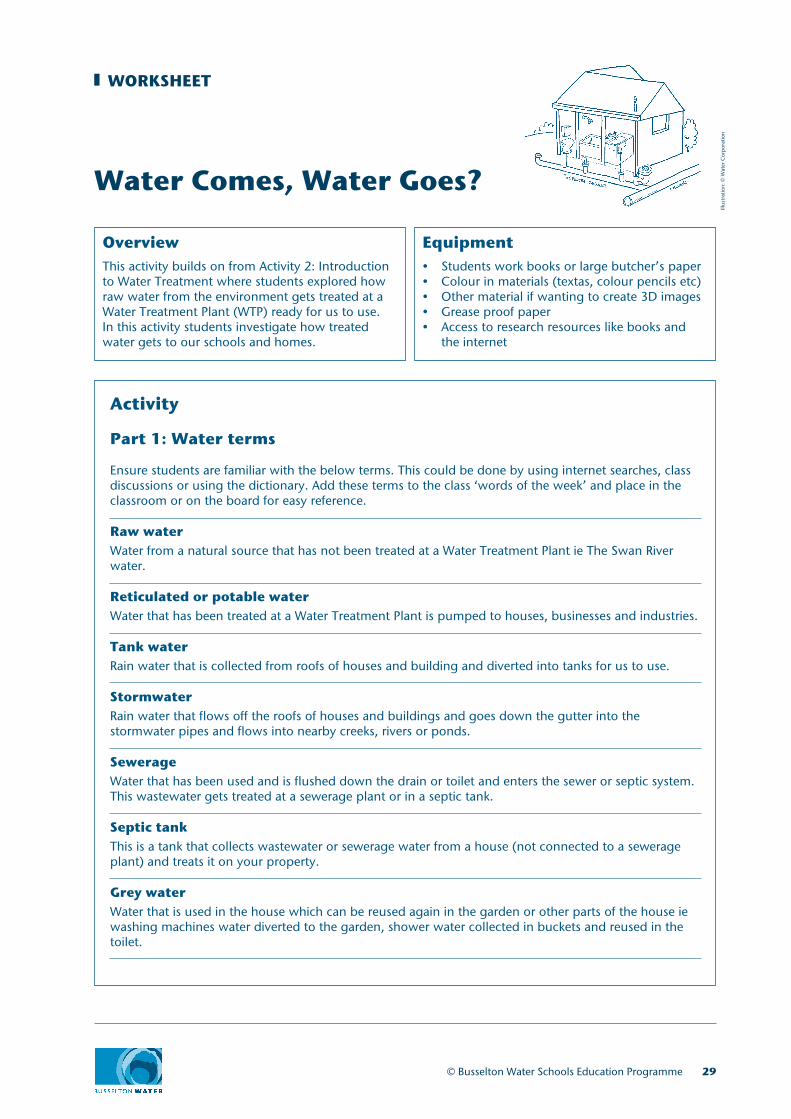
Water Comes, Water Goes?
WORKSHEET
OverviewThis activity builds on from Activity 2: Introduction to Water Treatment where students explored how raw water from the environment gets treated at a Water Treatment Plant (WTP) ready for us to use. In this activity students investigate how treated water gets to our schools and homes.
Equipment• Students work books or large butcher’s paper• Colour in materials (textas, colour pencils etc)• Other material if wanting to create 3D images• Grease proof paper• Access to research resources like books and
the internet
Activity
Part 1: Water terms
Ensure students are familiar with the below terms. This could be done by using internet searches, class discussions or using the dictionary. Add these terms to the class ‘words of the week’ and place in the classroom or on the board for easy reference.
Raw waterWater from a natural source that has not been treated at a Water Treatment Plant ie The Swan River water.
Reticulated or potable waterWater that has been treated at a Water Treatment Plant is pumped to houses, businesses and industries.
Tank waterRain water that is collected from roofs of houses and building and diverted into tanks for us to use.
StormwaterRain water that flows off the roofs of houses and buildings and goes down the gutter into the stormwater pipes and flows into nearby creeks, rivers or ponds.
SewerageWater that has been used and is flushed down the drain or toilet and enters the sewer or septic system. This wastewater gets treated at a sewerage plant or in a septic tank.
Septic tankThis is a tank that collects wastewater or sewerage water from a house (not connected to a sewerage plant) and treats it on your property.
Grey waterWater that is used in the house which can be reused again in the garden or other parts of the house ie washing machines water diverted to the garden, shower water collected in buckets and reused in the toilet.
© Busselton Water Schools Education Programme 29
Illus
trat
ion:
© W
ater
Cor
por
atio
n
WORKSHEET
Part 2: Water Comes, Water Goes? Distribution
1. Ask students to draw a plan of their school. The plan should include all areas where water is used including: toilets and bathroom, kitchen, canteen and staff room, laundry, garden and outdoor areas. Ensure students leave enough room on the page to add other places outside their school plan.
2. Ask students to think of all the ways water moves in and around the school.
3. Ask students to draw in the following items (separate clear or grease proof paper layers can be used over the school plan for each system ie freshwater, tank water, stormwater etc):a. How does the water reach your school? Where does it come from?b. Name the water source (river or other source) where your water comes from? Draw this near
your school plan. Or does the school use bore (ground) or tank water?c. How does the raw water get treated? Draw in the Water Treatment Plant (WTP) near your
school.d. How does the water from the WTP get to your school? Using a colour pencil (blue for clean
water) draw in pipes from the WTP to your school. Students can use pipe cleaners, straws or other materials instead of drawing the pipes to create 3D images.
e. Draw and colour in all the areas of your school where you use water. Toilet, sink, bath, shower, washing machine, taps, garden hose, swimming pool, canteen, bathroom basin etc.
f. Where does the water go once it falls on your roof? Does the school have a tank? In a different colour draw in pipes from the roof into the tank and to the areas of your school and garden where the tank water is used. If you don’t have a tank draw the pipes from the roof to the stormwater system (this could be a pipe connected to a drain on the road).
g. Can you think of ways in your school plan where you can save water? Think of grey water (water used in the school), which can be reused in the garden. Draw in greywater pipes.
4. Regroup the class and discuss the different areas of the school where they used water, where it comes from, if it came from the WTP or tank and if they used greywater or tank water in the garden.
5. Ask students where they think their water in their own houses comes from? Does it come from a WTP? Or do they have tank water? Do they reuse their greywater at home?
30 © Busselton Water Schools Education Programme
WEEK 7: Wastewater Treatment
MODULE 1:WATER TREATMENT
MO
DU
LE 1W
EEK 7

CURRICULUM LINKS
© Busselton Water Schools Education Programme
MODULE 1: WATER TREATMENT WEEK 7 Wastewater Treatment
LESSON 1 Students visit wastewater treatment plant.
CURRICULUM LINKS
YEAR 4 | GEOGRAPHY The sustainable management of waste from production and consumption (ACHGK025) YEAR 7 | GEOGRAPHY The classification of environmental resources and the forms that water takes as a resource (ACHGK037) The nature of water scarcity and ways of overcoming it, including studies drawn from Australia and West Asia and/or North Africa (ACHGK040 The influence of environmental quality on the liveability of places (ACHGK045)
CROSS CURRICULUM PRIORITIES Sustainability
GENERAL CAPABILITIES Ethical Understanding
CURRICULUM LINKS
© Busselton Water Schools Education Programme
MODULE 1: WATER TREATMENT WEEK 7 Wastewater Treatment
LESSON 2 Students explore the impact on society if we didn’t treat sewerage.
CURRICULUM LINKS
YEAR 4 | GEOGRAPHY The sustainable management of waste from production and consumption (ACHGK025) YEAR 7| GEOGRAPHY The classification of environmental resources and the forms that water takes as a resource (ACHGK037)
The ways that flows of water connect places as it moves through the environment and the way this affects places (ACHGK038)
The quantity and variability of Australia’s water resources compared with those in other continents (ACHGK039)
The nature of water scarcity and ways of overcoming it, including studies drawn from Australia and West Asia and/or North Africa (ACHGK040)
The economic, cultural, spiritual and aesthetic value of water for people, including Aboriginal and Torres Strait Islander Peoples and peoples of the Asia region (ACHGK041)
The factors that influence the decisions people make about where to live and their perceptions of the liveability of places (ACHGK043)
The influence of accessibility to services and facilities on the liveability of places (ACHGK044)
The influence of environmental quality on the liveability of places (ACHGK045)
The strategies used to enhance the liveability of places, especially for young people, including examples from Australia and Europe (ACHGK047)
CROSS CURRICULUM PRIORITIES Sustainability
GENERAL CAPABILITIES Ethical Understanding
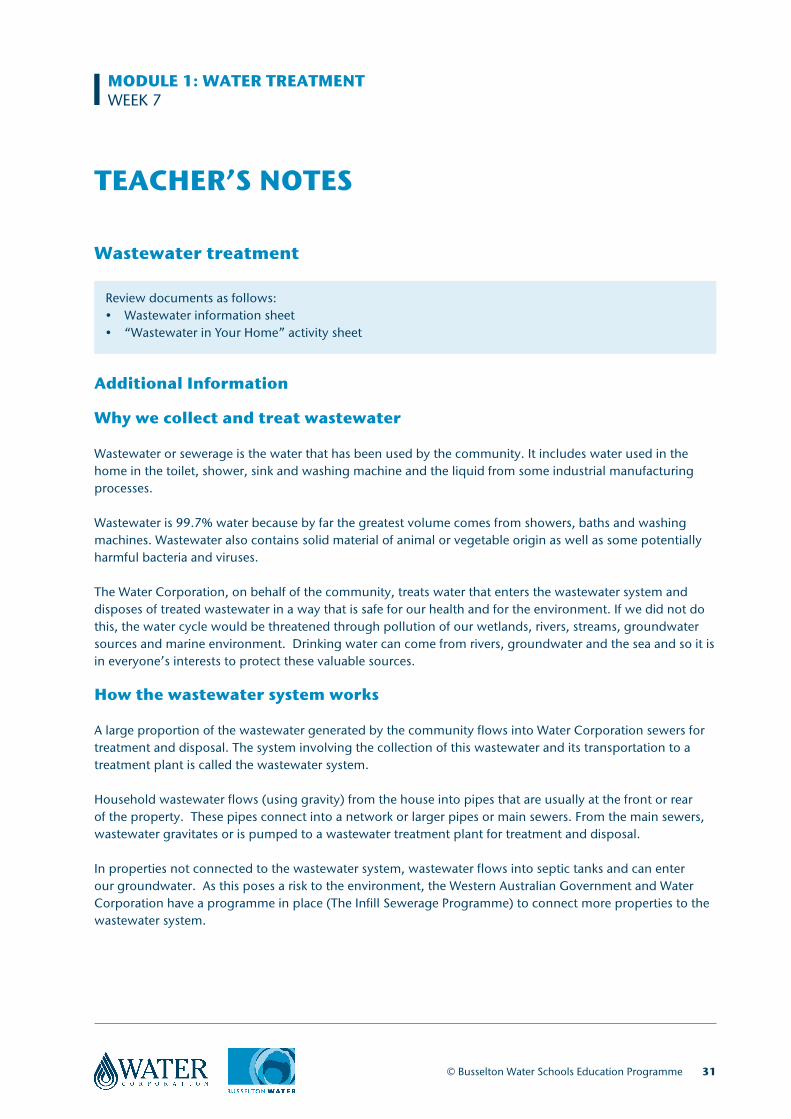
TEACHER’S NOTES
Wastewater treatment
Review documents as follows:• Wastewater information sheet• “Wastewater in Your Home” activity sheet
Additional Information
Why we collect and treat wastewater
Wastewater or sewerage is the water that has been used by the community. It includes water used in the home in the toilet, shower, sink and washing machine and the liquid from some industrial manufacturing processes.
Wastewater is 99.7% water because by far the greatest volume comes from showers, baths and washing machines. Wastewater also contains solid material of animal or vegetable origin as well as some potentially harmful bacteria and viruses.
The Water Corporation, on behalf of the community, treats water that enters the wastewater system and disposes of treated wastewater in a way that is safe for our health and for the environment. If we did not do this, the water cycle would be threatened through pollution of our wetlands, rivers, streams, groundwater sources and marine environment. Drinking water can come from rivers, groundwater and the sea and so it is in everyone’s interests to protect these valuable sources.
How the wastewater system works
A large proportion of the wastewater generated by the community flows into Water Corporation sewers for treatment and disposal. The system involving the collection of this wastewater and its transportation to a treatment plant is called the wastewater system.
Household wastewater flows (using gravity) from the house into pipes that are usually at the front or rear of the property. These pipes connect into a network or larger pipes or main sewers. From the main sewers, wastewater gravitates or is pumped to a wastewater treatment plant for treatment and disposal.
In properties not connected to the wastewater system, wastewater flows into septic tanks and can enter our groundwater. As this poses a risk to the environment, the Western Australian Government and Water Corporation have a programme in place (The Infill Sewerage Programme) to connect more properties to the wastewater system.
© Busselton Water Schools Education Programme 31
MODULE 1: WATER TREATMENTWEEK 7
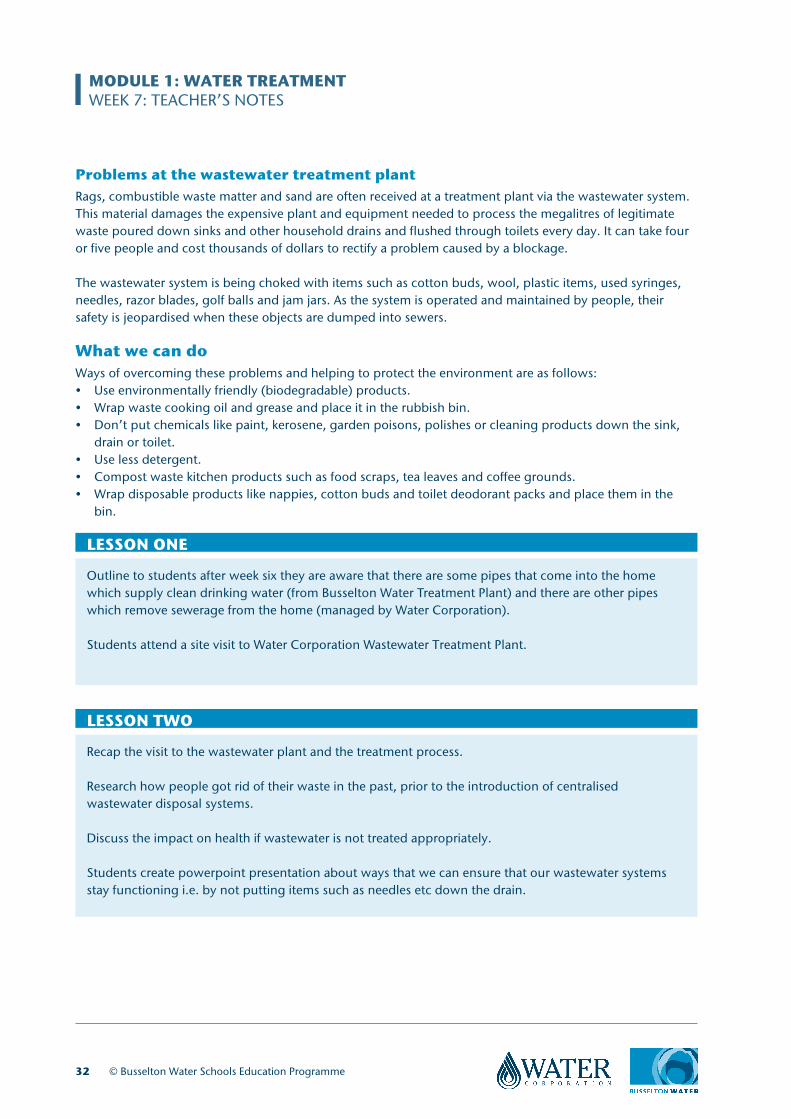
32 © Busselton Water Schools Education Programme
Problems at the wastewater treatment plantRags, combustible waste matter and sand are often received at a treatment plant via the wastewater system. This material damages the expensive plant and equipment needed to process the megalitres of legitimate waste poured down sinks and other household drains and flushed through toilets every day. It can take four or five people and cost thousands of dollars to rectify a problem caused by a blockage.
The wastewater system is being choked with items such as cotton buds, wool, plastic items, used syringes, needles, razor blades, golf balls and jam jars. As the system is operated and maintained by people, their safety is jeopardised when these objects are dumped into sewers.
What we can doWays of overcoming these problems and helping to protect the environment are as follows:• Use environmentally friendly (biodegradable) products.• Wrap waste cooking oil and grease and place it in the rubbish bin.• Don’t put chemicals like paint, kerosene, garden poisons, polishes or cleaning products down the sink,
drain or toilet.• Use less detergent.• Compost waste kitchen products such as food scraps, tea leaves and coffee grounds.• Wrap disposable products like nappies, cotton buds and toilet deodorant packs and place them in the
bin.
Outline to students after week six they are aware that there are some pipes that come into the home which supply clean drinking water (from Busselton Water Treatment Plant) and there are other pipes which remove sewerage from the home (managed by Water Corporation).
Students attend a site visit to Water Corporation Wastewater Treatment Plant.
LESSON ONE
Recap the visit to the wastewater plant and the treatment process.
Research how people got rid of their waste in the past, prior to the introduction of centralised wastewater disposal systems.
Discuss the impact on health if wastewater is not treated appropriately.
Students create powerpoint presentation about ways that we can ensure that our wastewater systems stay functioning i.e. by not putting items such as needles etc down the drain.
LESSON TWO
MODULE 1: WATER TREATMENTWEEK 7: TEACHER’S NOTES
Additional creative ideas
Students write a thank you letter to the Water Corporation for their site visit and explain their favourite part of the excursion.
Undertake an audit at home to see what each student’s household places down their sinks. Report back to the class and devise alternative waste treatment methods for items such as oil etc. Complete the activity sheet “Wastewater in your home”.
Simulate kitchen wastewater by placing food scraps, coffee grinds, tea leaves, oil etc into an ice cream container of water. Devise ways of cleaning this water eg filters, settling etc.
Create a poster indicating what should/should not go down sinks, toilets etc
© Busselton Water Schools Education Programme 33
MODULE 1: WATER TREATMENTWEEK 7: TEACHER’S NOTES

Information SheetAs Busselton continues to grow, the Water Corporation is working to ensure that wastewater from local homes and businesses can be sustainably managed into the future. To achieve this we will soon begin an exciting project that will improve the level of treatment achieved by the Busselton wastewater treatment plant, and cater for community growth. What is wastewater? Untreated or ‘raw’ wastewater is the ‘used water’ from your home or business. In homes, wastewater is mainly generated from the bathroom, toilet, kitchen and laundry. Raw wastewater is more than 99.97 per cent water, but contains micro-organisms, nutrients such as nitrogen and phosphorus, and a very small quantity of suspended solid material from sources such as human waste and food scraps. To ensure human and environmental health is protected, the Water Corporation collects and treats your wastewater to remove pollutants before it is returned to the environment. What happens to Busselton’s wastewater? Raw wastewater from approximately 8,900 homes and businesses in Busselton is captured every day by the Water Corporation’s wastewater treatment system. This wastewater is delivered to the Busselton Wastewater Treatment Plant (WWTP) on Queen Elizabeth Drive through a network of pipes and pump stations. The treatment plant reduces pollutants and nutrients, producing a high quality product suitable for re-use or return to the environment. Some of the treated wastewater is reused at the Busselton Golf Club during summer. The excess treated wastewater flows via a man-made wetland into the Vasse drainage network and out to Geographe Bay.
What will the upgrade involve? The plant’s capacity will be increased from 4.5 million-litres-a-day, to 6.75 million-litres-a-day, with design capacity to treat additional flows when needed. More importantly, new ‘oxidation ditch’ technology will reduce the nutrient concentration of treated wastewater by half, compared to the current facility. In other words, there will be no net increase in nutrients entering the
Information Sheet
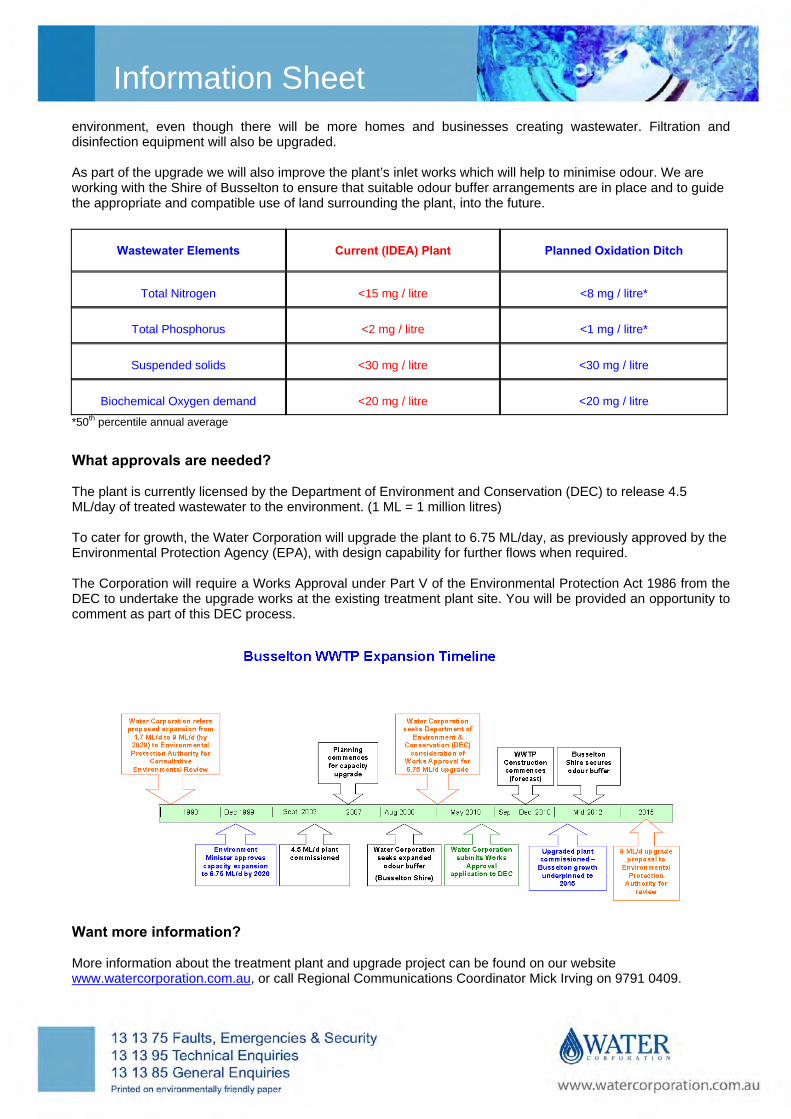
Information Sheetenvironment, even though there will be more homes and businesses creating wastewater. Filtration and disinfection equipment will also be upgraded. As part of the upgrade we will also improve the plant’s inlet works which will help to minimise odour. We are working with the Shire of Busselton to ensure that suitable odour buffer arrangements are in place and to guide the appropriate and compatible use of land surrounding the plant, into the future.
Wastewater Elements
Current (IDEA) Plant
Planned Oxidation Ditch
Total Nitrogen
<15 mg / litre
<8 mg / litre*
Total Phosphorus
<2 mg / litre
<1 mg / litre*
Suspended solids
<30 mg / litre
<30 mg / litre
Biochemical Oxygen demand
<20 mg / litre
<20 mg / litre
*50th percentile annual average
What approvals are needed? The plant is currently licensed by the Department of Environment and Conservation (DEC) to release 4.5 ML/day of treated wastewater to the environment. (1 ML = 1 million litres) To cater for growth, the Water Corporation will upgrade the plant to 6.75 ML/day, as previously approved by the Environmental Protection Agency (EPA), with design capability for further flows when required. The Corporation will require a Works Approval under Part V of the Environmental Protection Act 1986 from the DEC to undertake the upgrade works at the existing treatment plant site. You will be provided an opportunity to comment as part of this DEC process.
Want more information?
More information about the treatment plant and upgrade project can be found on our website HUwww.watercorporation.com.au UH, or call Regional Communications Coordinator Mick Irving on 9791 0409.
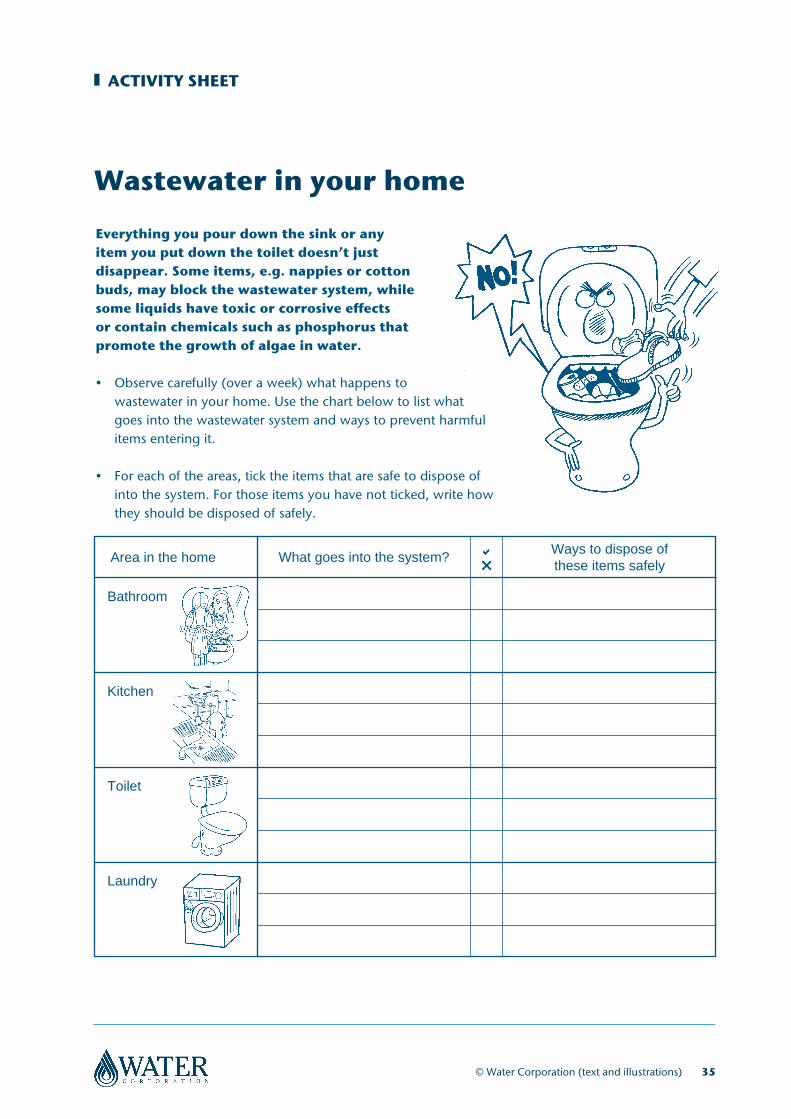
Wastewater in your home
ACTIVITY SHEET
Everything you pour down the sink or any item you put down the toilet doesn’t just disappear. Some items, e.g. nappies or cotton buds, may block the wastewater system, while some liquids have toxic or corrosive effects or contain chemicals such as phosphorus that promote the growth of algae in water.
• Observe carefully (over a week) what happens to wastewater in your home. Use the chart below to list what goes into the wastewater system and ways to prevent harmful items entering it.
• For each of the areas, tick the items that are safe to dispose of into the system. For those items you have not ticked, write how
they should be disposed of safely.
Laundry
Toilet
Kitchen
Bathroom
Area in the home What goes into the system? ar
Ways to dispose of these items safely
© Water Corporation (text and illustrations) 35
WEEK 8: Alternative Technologies – greywater
MODULE 1:WATER TREATMENT
MO
DU
LE 1W
EEK 8
CURRICULUM LINKS
© Busselton Water Schools Education Programme
MODULE 1: WATER TREATMENT WEEK 8 Alternative technologies – grey water
LESSON 1 Students identify where in the home and school could water be captured and recycled.
CURRICULUM LINKS
YEAR 4 | GEOGRAPHY The sustainable management of waste from production and consumption (ACHGK025) YR 7 | GEOGRAPHY The classification of environmental resources and the forms that water takes as a resource (ACHGK037) The nature of water scarcity and ways of overcoming it, including studies drawn from Australia and West Asia and/or North Africa (ACHGK040) The quantity and variability of Australia’s water resources compared with those in other continents (ACHGK039)
CROSS CURRICULUM PRIORITIES Sustainability
GENERAL CAPABILITIES Ethical Understanding

CURRICULUM LINKS
© Busselton Water Schools Education Programme
MODULE 1: WATER TREATMENT WEEK 8 Alternative technologies – grey water
LESSON 2 Students identify new technologies that are available around the world.
CURRICULUM LINKS
YEAR 7 | SCIENCE Science and technology contribute to finding solutions to a range of contemporary issues; these solutions may impact on other areas of society and involve ethical considerations (ACSHE120) Science understanding influences the development of practices in areas of human activity such as industry, agriculture and marine and terrestrial resource management (ACSHE121) YEAR 7| GEOGRAPHY The classification of environmental resources and the forms that water takes as a resource (ACHGK037) The ways that flows of water connect places as it moves through the environment and the way this affects places (ACHGK038) The quantity and variability of Australia’s water resources compared with those in other continents (ACHGK039) The nature of water scarcity and ways of overcoming it, including studies drawn from Australia and West Asia and/or North Africa (ACHGK040)
CROSS CURRICULUM PRIORITIES Sustainability
GENERAL CAPABILITIES Ethical Understanding
TEACHER’S NOTES
Alternative technologies – Greywater
Review documents as follows:• Greywater reuse and recycling (Water Corporation) website information sheet
Advise the students that greywater is wastewater that comes from the bath, spa, shower, bathroom wash basins, clothes washing machine, laundry trough, dishwasher and kitchen sink.
However, greywater from the kitchen sink is generally not recycled due to the contaminants it contains.
Reusing greywater does not involve any treatment other than coarse filtration (usually to avoid clogging irrigation systems) whereas recycling greywater involves further treatment.
Discuss with students what methods could be used to capture this water before it enters the waste water treatment system eg buckets in the shower, diverting laundry water to the garden etc.
Students go online and research what technologies are available to be installed in the home to capture and divert grey water. Students provide an overview of one of their most preferred technologies.
LESSON ONE
Work with the students to undertake research and report on recycled water usage under the following headings:• Where in Australia and around the world are some recycling projects happening?• What is recycled water used for in these places?• How long have they been using recycled water?• What are some of the major concerns of using recycled water?
LESSON TWO
Additional creative ideas
As a group create a catchy slogan promoting water recycling. Design some advertising material using this slogan e.g. posters, billboard.
© Busselton Water Schools Education Programme 37
MODULE 1: WATER TREATMENTWEEK 8
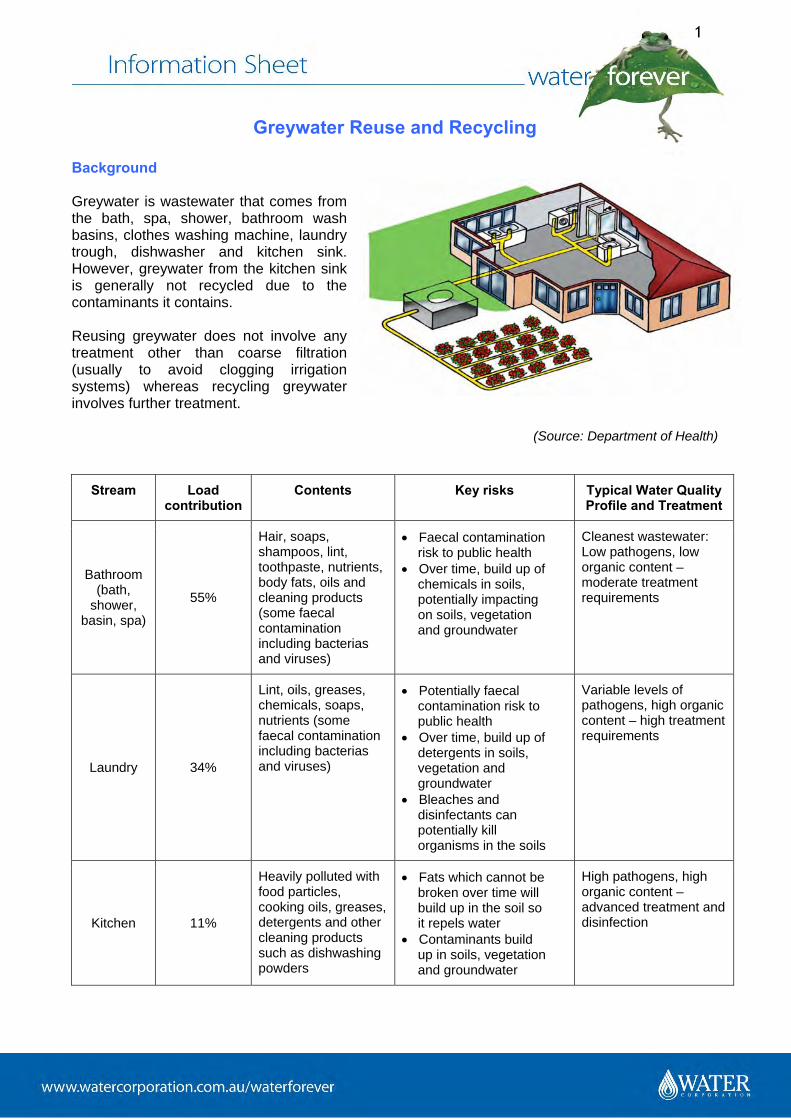
1
Greywater Reuse and Recycling
Background Greywater is wastewater that comes from the bath, spa, shower, bathroom wash basins, clothes washing machine, laundry trough, dishwasher and kitchen sink. However, greywater from the kitchen sink is generally not recycled due to the contaminants it contains. Reusing greywater does not involve any treatment other than coarse filtration (usually to avoid clogging irrigation systems) whereas recycling greywater involves further treatment.
(Source: Department of Health)
Stream Load contribution
Contents Key risks Typical Water Quality Profile and Treatment
Bathroom (bath,
shower, basin, spa)
55%
Hair, soaps, shampoos, lint, toothpaste, nutrients, body fats, oils and cleaning products (some faecal contamination including bacterias and viruses)
• Faecal contamination risk to public health • Over time, build up of chemicals in soils, potentially impacting on soils, vegetation and groundwater
Cleanest wastewater: Low pathogens, low organic content – moderate treatment requirements
Laundry 34%
Lint, oils, greases, chemicals, soaps, nutrients (some faecal contamination including bacterias and viruses)
• Potentially faecal contamination risk to public health • Over time, build up of detergents in soils, vegetation and groundwater • Bleaches and disinfectants can potentially kill organisms in the soils
Variable levels of pathogens, high organic content – high treatment requirements
Kitchen 11%
Heavily polluted with food particles, cooking oils, greases, detergents and other cleaning products such as dishwashing powders
• Fats which cannot be broken over time will build up in the soil so it repels water • Contaminants build up in soils, vegetation and groundwater
High pathogens, high organic content – advanced treatment and disinfection
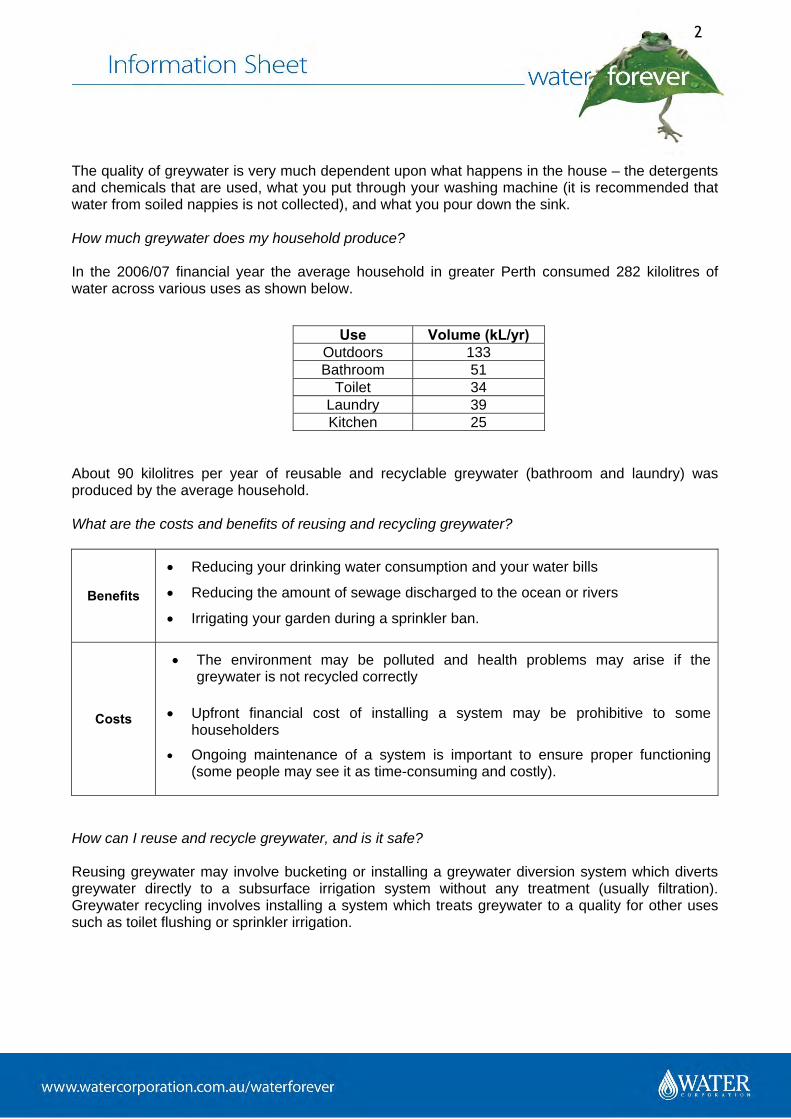
2
The quality of greywater is very much dependent upon what happens in the house – the detergents and chemicals that are used, what you put through your washing machine (it is recommended that water from soiled nappies is not collected), and what you pour down the sink. How much greywater does my household produce? In the 2006/07 financial year the average household in greater Perth consumed 282 kilolitres of water across various uses as shown below.
About 90 kilolitres per year of reusable and recyclable greywater (bathroom and laundry) was produced by the average household. What are the costs and benefits of reusing and recycling greywater?
Benefits
• Reducing your drinking water consumption and your water bills
• Reducing the amount of sewage discharged to the ocean or rivers
• Irrigating your garden during a sprinkler ban.
Costs
• The environment may be polluted and health problems may arise if the greywater is not recycled correctly
• Upfront financial cost of installing a system may be prohibitive to some householders
• Ongoing maintenance of a system is important to ensure proper functioning (some people may see it as time-consuming and costly).
How can I reuse and recycle greywater, and is it safe? Reusing greywater may involve bucketing or installing a greywater diversion system which diverts greywater directly to a subsurface irrigation system without any treatment (usually filtration). Greywater recycling involves installing a system which treats greywater to a quality for other uses such as toilet flushing or sprinkler irrigation.
Use Volume (kL/yr) Outdoors 133 Bathroom 51
Toilet 34 Laundry 39 Kitchen 25
3
There are simple strategies to manage the health and environmental risks associated with greywater:
• only harvest the lowest risk greywater do not harvest kitchen greywater;
• ensure that the treatment system is ‘fail-safe’, that is greywater will automatically be diverted to the sewer if the greywater system blocks or malfunctions;
• if using on gardens, do not over irrigate, do not use on food crops that are eaten raw and wash your hands after gardening;
• never store greywater for more than 24 hours;
• never drink or allow pets or animals to drink it or have access to it; and
• use low phosphorus detergents.
Both diversion and treatment systems need to be approved by the Department of Health. It has published a Code of Practice on the reuse and recycling of greywater which includes details on how to safely bucket greywater and how to go about safely installing and maintaining an approved greywater system. The department also publishes a list of all greywater systems approved for use in Western Australia. Advice on choosing the most appropriate system for your household can be obtained from your Local Government office or the Wastewater Management Branch of the Department of Health.
When is greywater reuse or recycling not permitted?
• The greywater system (or system design) is not approved
• The property is connected to a sewage system and the Water Corporation does not approve the diversion of greywater due to operating constraints
• The property is in an environmentally sensitive area (refer Code of Practice)
• Inappropriate site conditions exist such as unsuitable soils or elevated ground water levels
• Insufficient property area is available to achieve the necessary setbacks and area required for irrigation.
Who needs to approve the installation of greywater systems? Local Government approves systems that harvest greywater from dwellings for up to 10 people. They may consult with the Water Corporation, the Department of Health or the Department of Environment and Conservation to ensure that there are no risks to public health, no adverse impacts on the existing sewer infrastructure and no adverse impacts on the local environment. For systems that are designed to harvest greywater from dwellings with more than 10 people, approval is required from the Department of Health. In addition to examining the design, the department will want to ensure that the appropriate operating and maintenance regimes and expertise are in place to manage the system.
4
There are two types of approvals required – approval to construct and an approval to use. Approval to use will be granted once the greywater system has been inspected to ensure that it has been properly installed. In all cases, connection into the system or modifications to domestic plumbing must be carried out by a licensed plumber.
Current Situation Greywater system rebates Waterwise Rebates for greywater systems were introduced in February 2003 as part of the Waterwise Rebate Program. They currently attract a Government rebate of up to $500. By January 2008 only 144 households had applied for a rebate compared with over 21,000 rebates for garden bores and over 13,000 for rainwater tanks. Greywater systems as part of new developments Bridgewater is a residential village development near Mandurah on 14 hectares with a planned total of 389 houses. Each house is equipped with an on site greywater recycling system for private groundwater irrigation through a subsurface drip system. Groundwater is used as a backup supply to maintain irrigation flows whenever a house is vacant. Residents pay a weekly rent including a management fee, part of which is used to fund monitoring and maintenance of the greywater systems. Each resident owns and operates their own system and is expected to meet repair costs. Australian Guidelines for Water Recycling In November 2006 the Commonwealth Government released the Australian Guidelines for Water Recycling: Managing Health and Environmental Risks (Phase 1). These guidelines focus on large scale recycling of treated sewage and greywater for household use, irrigating public open space and crops, fire fighting and industrial uses. In particular the recycling of greywater on site (including in office and apartment blocks) for various uses is also addressed. The Department of Health is currently developing State-based guidelines to support these national guidelines. ‘How to’ guide for alternative water supplies The Water Corporation is committed to working with the development industry, key regulatory agencies and the community to further examine the potential of alternative supplies as an effective and reliable means to meet residential demand. A ‘how to’ guide (H2Options) has been produced to provide an overview of what kinds of alternative water supplies (including greywater) are available to meet residential non drinking water demand and key steps that are required to deliver this water (including the required regulatory approvals). The Future Five Star Plus Stage 2 In May 2007 the WA Government announced new building standards for all new homes to have water and energy saving devices. The first stage introduced in September 2007 included the need for water efficient taps, showerheads and toilets for new buildings (residential and commercial).
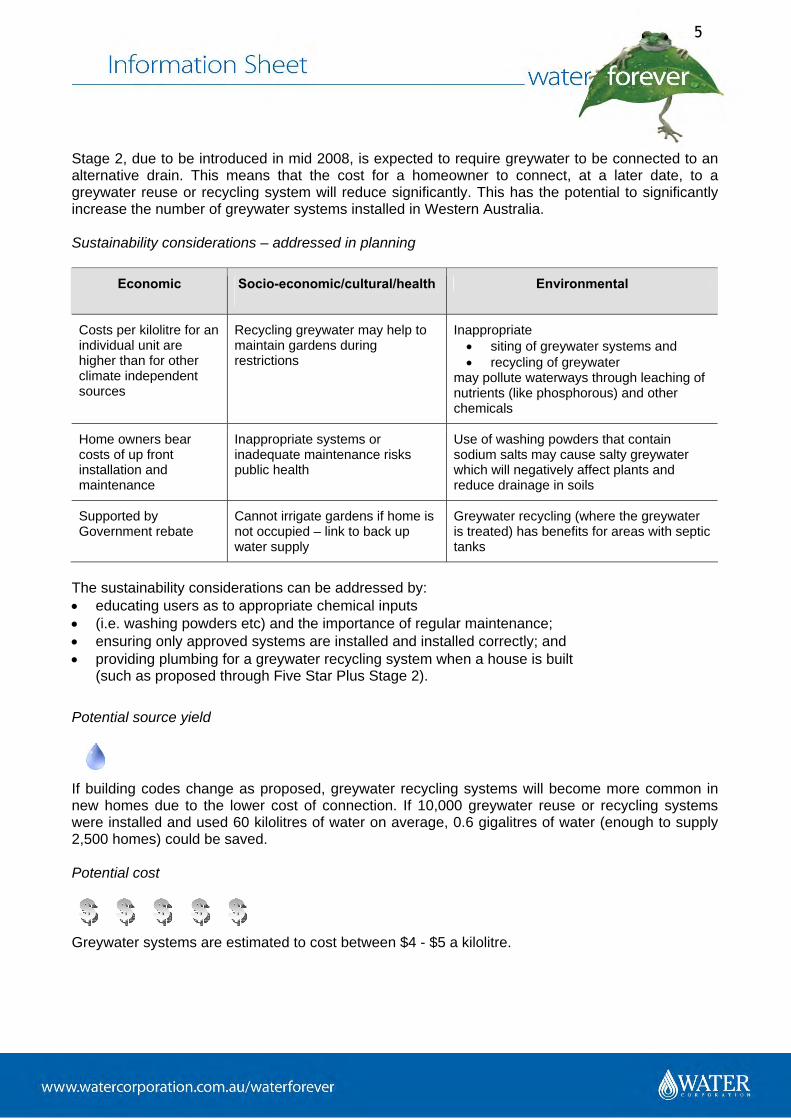
5
Stage 2, due to be introduced in mid 2008, is expected to require greywater to be connected to an alternative drain. This means that the cost for a homeowner to connect, at a later date, to a greywater reuse or recycling system will reduce significantly. This has the potential to significantly increase the number of greywater systems installed in Western Australia. Sustainability considerations – addressed in planning
Economic Socio-economic/cultural/health
Environmental
Costs per kilolitre for an individual unit are higher than for other climate independent sources
Recycling greywater may help to maintain gardens during restrictions
Inappropriate • siting of greywater systems and • recycling of greywater
may pollute waterways through leaching of nutrients (like phosphorous) and other chemicals
Home owners bear costs of up front installation and maintenance
Inappropriate systems or inadequate maintenance risks public health
Use of washing powders that contain sodium salts may cause salty greywater which will negatively affect plants and reduce drainage in soils
Supported by Government rebate
Cannot irrigate gardens if home is not occupied – link to back up water supply
Greywater recycling (where the greywater is treated) has benefits for areas with septic tanks
The sustainability considerations can be addressed by: • educating users as to appropriate chemical inputs • (i.e. washing powders etc) and the importance of regular maintenance; • ensuring only approved systems are installed and installed correctly; and • providing plumbing for a greywater recycling system when a house is built
(such as proposed through Five Star Plus Stage 2).
Potential source yield
If building codes change as proposed, greywater recycling systems will become more common in new homes due to the lower cost of connection. If 10,000 greywater reuse or recycling systems were installed and used 60 kilolitres of water on average, 0.6 gigalitres of water (enough to supply 2,500 homes) could be saved. Potential cost
Greywater systems are estimated to cost between $4 - $5 a kilolitre.

WEEK 9: Alternative Technologies – desalination plants
MODULE 1:WATER TREATMENT
MO
DU
LE 1W
EEK 9

CURRICULUM LINKS
© Busselton Water Schools Education Programme
MODULE 1: WATER TREATMENT WEEK 9 Alternative technologies – desalination plants
LESSON 1 View how a desalination plant operates.
CURRICULUM LINKS
YEAR 7 | GEOGRAPHY The nature of water scarcity and ways of overcoming it, including studies drawn from Australia and West Asia and/or North Africa (ACHGK040)
CROSS CURRICULUM PRIORITIES
Sustainability
GENERAL CAPABILITIES Ethical Understanding

CURRICULUM LINKS
© Busselton Water Schools Education Programme
MODULE 1: WATER TREATMENT WEEK 9 Alternative technologies – desalination plants
LESSON 2 Students make their own solar desalination plant.
CURRICULUM LINKS
YEAR 7 | GEOGRAPHY The nature of water scarcity and ways of overcoming it, including studies drawn from Australia and West Asia and/or North Africa (ACHGK040)
CROSS CURRICULUM PRIORITIES
Sustainability
GENERAL CAPABILITIES Ethical Understanding
TEACHER’S NOTES
Alternative technologies – desalination plants
Review documents as follows:• Desalination in Western Australia (Water Corporation) information sheet• The Perth Water Desalination Plant (Water Corporation) information sheet• Understanding desalination activity sheet• Making a solar desalination plant activity sheet
Outline with students that there are a number of new desalination plants being developed in WAincluding Kwinana, Binningup and Burrup.
Advise the class that this technology has been used for some time in the East Coast of Australia and alsooverseas. Students go to website <http://goo.gl/28hS5z> There is a short animation which provides an overviewof desalination in WA. Have students watch the animation and then complete the activity sheet “Understanding desalination”.
LESSON ONE
Students make a solar desalination model (refer to activity sheet).
LESSON TWO
© Busselton Water Schools Education Programme 39
MODULE 1: WATER TREATMENTWEEK 9
DESALINATION IN WESTERN AUSTRALIA
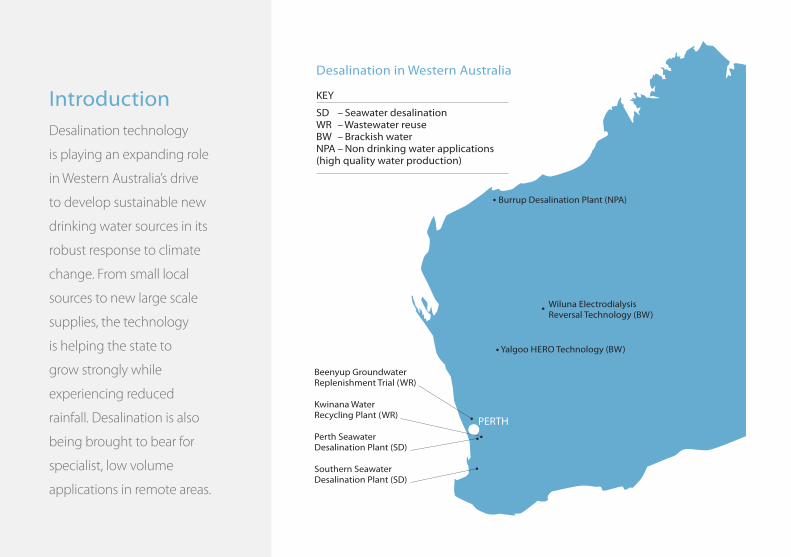
IntroductionDesalination technology
is playing an expanding role
in Western Australia’s drive
to develop sustainable new
drinking water sources in its
robust response to climate
change. From small local
sources to new large scale
supplies, the technology
is helping the state to
grow strongly while
experiencing reduced
rainfall. Desalination is also
being brought to bear for
specialist, low volume
applications in remote areas.
Wiluna ElectrodialysisReversal Technology (BW)
Yalgoo HERO Technology (BW)
PERTH
Beenyup Groundwater Replenishment Trial (WR)
Kwinana Water Recycling Plant (WR)
Perth Seawater Desalination Plant (SD)
Southern Seawater Desalination Plant (SD)
Burrup Desalination Plant (NPA)
KEY
SD – Seawater desalinationWR – Wastewater reuseBW – Brackish waterNPA – Non drinking water applications (high quality water production)
Desalination in Western Australia
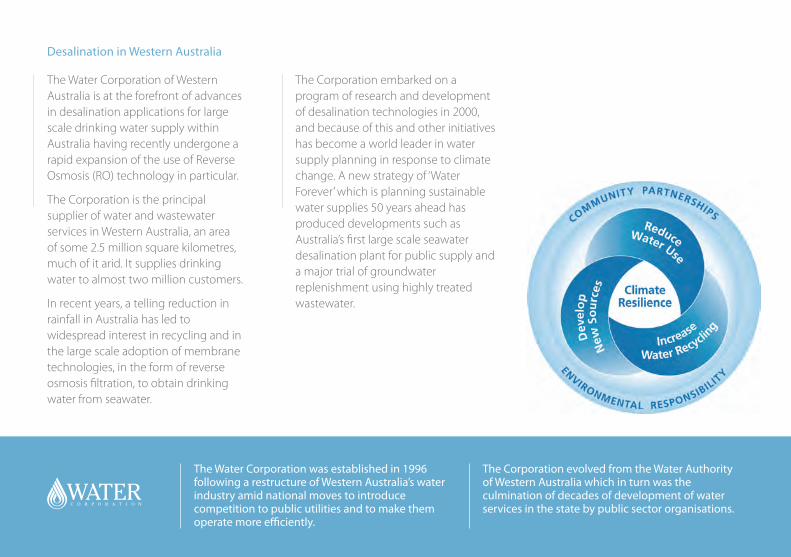
The Corporation embarked on a program of research and development of desalination technologies in 2000, and because of this and other initiatives has become a world leader in water supply planning in response to climate change. A new strategy of ‘Water Forever’ which is planning sustainable water supplies 50 years ahead has produced developments such as Australia’s first large scale seawater desalination plant for public supply and a major trial of groundwater replenishment using highly treated wastewater.
The Water Corporation was established in 1996 following a restructure of Western Australia’s water industry amid national moves to introduce competition to public utilities and to make them operate more efficiently.
The Corporation evolved from the Water Authority of Western Australia which in turn was the culmination of decades of development of water services in the state by public sector organisations.
The Water Corporation of Western Australia is at the forefront of advances in desalination applications for large scale drinking water supply within Australia having recently undergone a rapid expansion of the use of Reverse Osmosis (RO) technology in particular.
The Corporation is the principal supplier of water and wastewater services in Western Australia, an area of some 2.5 million square kilometres, much of it arid. It supplies drinking water to almost two million customers.
In recent years, a telling reduction in rainfall in Australia has led to widespread interest in recycling and in the large scale adoption of membrane technologies, in the form of reverse osmosis filtration, to obtain drinking water from seawater.
Desalination in Western Australia
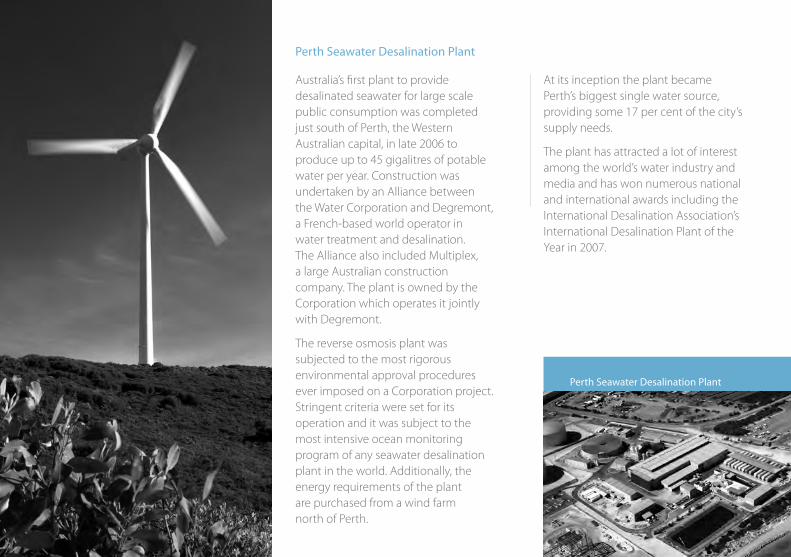
Australia’s first plant to provide desalinated seawater for large scale public consumption was completed just south of Perth, the Western Australian capital, in late 2006 to produce up to 45 gigalitres of potable water per year. Construction was undertaken by an Alliance between the Water Corporation and Degremont, a French-based world operator in water treatment and desalination. The Alliance also included Multiplex, a large Australian construction company. The plant is owned by the Corporation which operates it jointly with Degremont.
The reverse osmosis plant was subjected to the most rigorous environmental approval procedures ever imposed on a Corporation project. Stringent criteria were set for its operation and it was subject to the most intensive ocean monitoring program of any seawater desalination plant in the world. Additionally, the energy requirements of the plant are purchased from a wind farm north of Perth.
Perth Seawater Desalination Plant
At its inception the plant became Perth’s biggest single water source, providing some 17 per cent of the city’s supply needs.
The plant has attracted a lot of interest among the world’s water industry and media and has won numerous national and international awards including the International Desalination Association’s International Desalination Plant of the Year in 2007.
Perth Seawater Desalination Plant
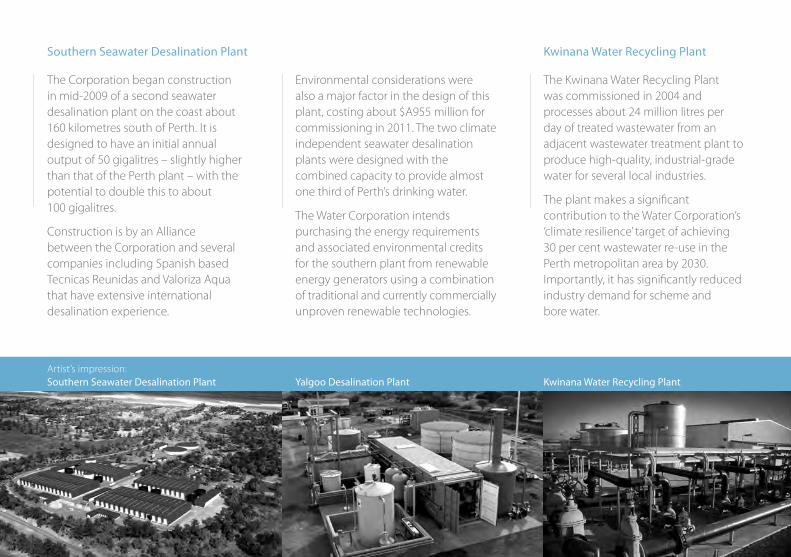
Environmental considerations were also a major factor in the design of this plant, costing about $A955 million for commissioning in 2011. The two climate independent seawater desalination plants were designed with the combined capacity to provide almost one third of Perth’s drinking water.
The Water Corporation intends purchasing the energy requirements and associated environmental credits for the southern plant from renewable energy generators using a combination of traditional and currently commercially unproven renewable technologies.
The Kwinana Water Recycling Plant was commissioned in 2004 and processes about 24 million litres per day of treated wastewater from an adjacent wastewater treatment plant to produce high-quality, industrial-grade water for several local industries.
The plant makes a significant contribution to the Water Corporation’s ‘climate resilience’ target of achieving 30 per cent wastewater re-use in the Perth metropolitan area by 2030. Importantly, it has significantly reduced industry demand for scheme and bore water.
Kwinana Water Recycling Plant
The Corporation began construction in mid-2009 of a second seawater desalination plant on the coast about 160 kilometres south of Perth. It is designed to have an initial annual output of 50 gigalitres – slightly higher than that of the Perth plant – with the potential to double this to about 100 gigalitres.
Construction is by an Alliance between the Corporation and several companies including Spanish based Tecnicas Reunidas and Valoriza Aqua that have extensive international desalination experience.
Southern Seawater Desalination Plant
Artist’s impression: Southern Seawater Desalination Plant Yalgoo Desalination Plant Kwinana Water Recycling PlantPerth Seawater Desalination Plant
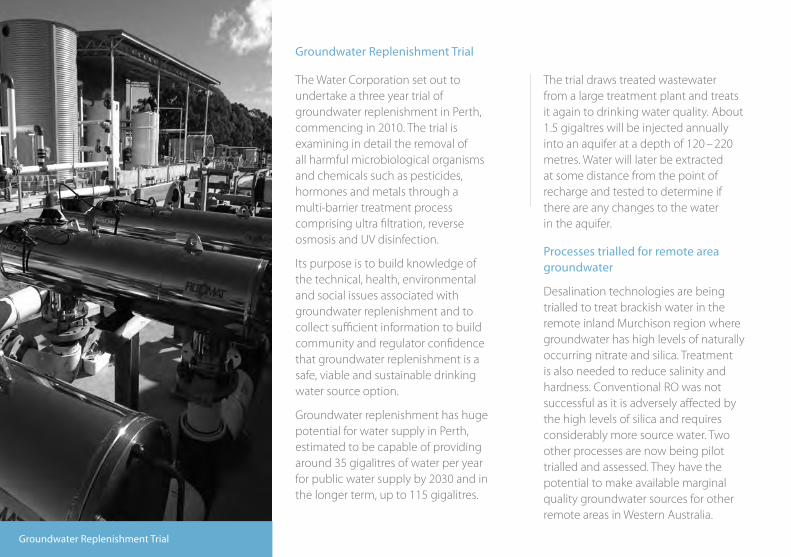
Groundwater Replenishment Trial
The Water Corporation set out to undertake a three year trial of groundwater replenishment in Perth, commencing in 2010. The trial is examining in detail the removal of all harmful microbiological organisms and chemicals such as pesticides, hormones and metals through a multi-barrier treatment process comprising ultra filtration, reverse osmosis and UV disinfection.
Its purpose is to build knowledge of the technical, health, environmental and social issues associated with groundwater replenishment and to collect sufficient information to build community and regulator confidence that groundwater replenishment is a safe, viable and sustainable drinking water source option.
Groundwater replenishment has huge potential for water supply in Perth, estimated to be capable of providing around 35 gigalitres of water per year for public water supply by 2030 and in the longer term, up to 115 gigalitres.
Groundwater Replenishment Trial
The trial draws treated wastewater from a large treatment plant and treats it again to drinking water quality. About 1.5 gigaltres will be injected annually into an aquifer at a depth of 120 – 220 metres. Water will later be extracted at some distance from the point of recharge and tested to determine if there are any changes to the water in the aquifer.
Processes trialled for remote area groundwater
Desalination technologies are being trialled to treat brackish water in the remote inland Murchison region where groundwater has high levels of naturally occurring nitrate and silica. Treatment is also needed to reduce salinity and hardness. Conventional RO was not successful as it is adversely affected by the high levels of silica and requires considerably more source water. Two other processes are now being pilot trialled and assessed. They have the potential to make available marginal quality groundwater sources for other remote areas in Western Australia.
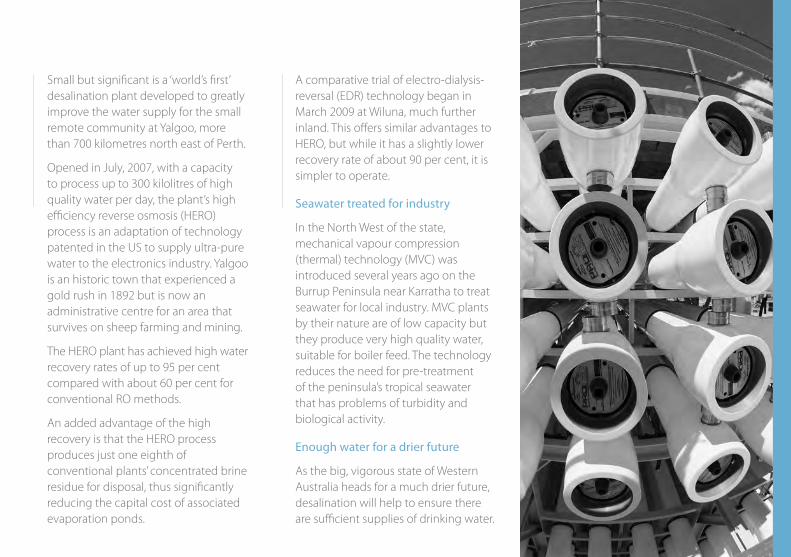
A comparative trial of electro-dialysis-reversal (EDR) technology began in March 2009 at Wiluna, much further inland. This offers similar advantages to HERO, but while it has a slightly lower recovery rate of about 90 per cent, it is simpler to operate.
Seawater treated for industry
In the North West of the state, mechanical vapour compression (thermal) technology (MVC) was introduced several years ago on the Burrup Peninsula near Karratha to treat seawater for local industry. MVC plants by their nature are of low capacity but they produce very high quality water, suitable for boiler feed. The technology reduces the need for pre-treatment of the peninsula’s tropical seawater that has problems of turbidity and biological activity.
Enough water for a drier future
As the big, vigorous state of Western Australia heads for a much drier future, desalination will help to ensure there are sufficient supplies of drinking water.
Small but significant is a ‘world’s first’ desalination plant developed to greatly improve the water supply for the small remote community at Yalgoo, more than 700 kilometres north east of Perth.
Opened in July, 2007, with a capacity to process up to 300 kilolitres of high quality water per day, the plant’s high efficiency reverse osmosis (HERO) process is an adaptation of technology patented in the US to supply ultra-pure water to the electronics industry. Yalgoo is an historic town that experienced a gold rush in 1892 but is now an administrative centre for an area that survives on sheep farming and mining.
The HERO plant has achieved high water recovery rates of up to 95 per cent compared with about 60 per cent for conventional RO methods.
An added advantage of the high recovery is that the HERO process produces just one eighth of conventional plants’ concentrated brine residue for disposal, thus significantly reducing the capital cost of associated evaporation ponds.
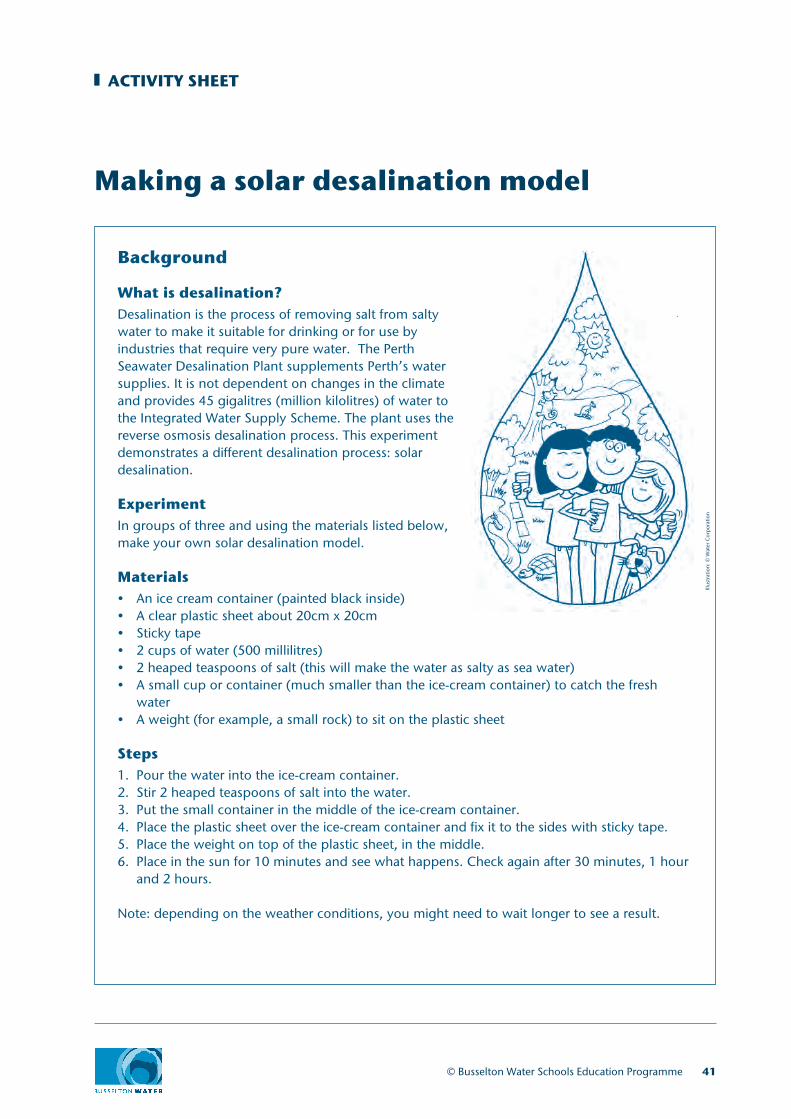
Making a solar desalination model
ACTIVITY SHEET
Background
What is desalination?Desalination is the process of removing salt from salty water to make it suitable for drinking or for use by industries that require very pure water. The Perth Seawater Desalination Plant supplements Perth’s water supplies. It is not dependent on changes in the climate and provides 45 gigalitres (million kilolitres) of water to the Integrated Water Supply Scheme. The plant uses the reverse osmosis desalination process. This experiment demonstrates a different desalination process: solar desalination.
ExperimentIn groups of three and using the materials listed below, make your own solar desalination model.
Materials• An ice cream container (painted black inside)• A clear plastic sheet about 20cm x 20cm• Sticky tape • 2 cups of water (500 millilitres)• 2 heaped teaspoons of salt (this will make the water as salty as sea water)• A small cup or container (much smaller than the ice-cream container) to catch the fresh
water• A weight (for example, a small rock) to sit on the plastic sheet
Steps1. Pour the water into the ice-cream container.2. Stir 2 heaped teaspoons of salt into the water.3. Put the small container in the middle of the ice-cream container.4. Place the plastic sheet over the ice-cream container and fix it to the sides with sticky tape.5. Place the weight on top of the plastic sheet, in the middle.6. Place in the sun for 10 minutes and see what happens. Check again after 30 minutes, 1 hour
and 2 hours.
Note: depending on the weather conditions, you might need to wait longer to see a result.
© Busselton Water Schools Education Programme 41
Illus
trat
ion:
© W
ater
Cor
por
atio
n
42 © Busselton Water Schools Education Programme
Understanding desalination
Questions
1. What is desalination? Write a brief description below.
___________________________________________________________________________________________
___________________________________________________________________________________________
___________________________________________________________________________________________
___________________________________________________________________________________________
2. What is left over after seawater is turned into freshwater?
___________________________________________________________________________________________
___________________________________________________________________________________________
___________________________________________________________________________________________
___________________________________________________________________________________________
3. Name three countries that use desalination.
___________________________________________________________________________________________
___________________________________________________________________________________________
___________________________________________________________________________________________
4. Do we desalinate water in WA?
___________________________________________________________________________________________
WORKSHEET

WEEK 10: Water Treatment in Other Countries
MODULE 1:WATER TREATMENT
MO
DU
LE 1W
EEK 10

CURRICULUM LINKS
© Busselton Water Schools Education Programme
MODULE 1: WATER TREATMENT WEEK 10 Water Treatment in other countries
LESSON 1 View the slide show, “Water around the world.” Students complete the e-card about their experience.
CURRICULUM LINKS
YEAR 7 | GEOGRAPHY The nature of water scarcity and ways of overcoming it, including studies drawn from Australia and West Asia and/or North Africa (ACHGK040) The factors that influence the decisions people make about where to live and their perceptions of the liveability of places (ACHGK043) The influence of environmental quality on the liveability of places (ACHGK045)
CROSS CURRICULUM PRIORITIES Sustainability
GENERAL CAPABILITIES Ethical Understanding
CURRICULUM LINKS
© Busselton Water Schools Education Programme
MODULE 1: WATER TREATMENT WEEK 10 Water Treatment in other countries
LESSON 2 Students prepare a PowerPoint slide comparing their water supply and treatment to those in Uganda.
CURRICULUM LINKS
YEAR 7 | GEOGRAPHY The nature of water scarcity and ways of overcoming it, including studies drawn from Australia and West Asia and/or North Africa (ACHGK040) The factors that influence the decisions people make about where to live and their perceptions of the liveability of places (ACHGK043) The influence of environmental quality on the liveability of places (ACHGK045)
CROSS CURRICULUM PRIORITIES Sustainability
GENERAL CAPABILITIES Ethical Understanding
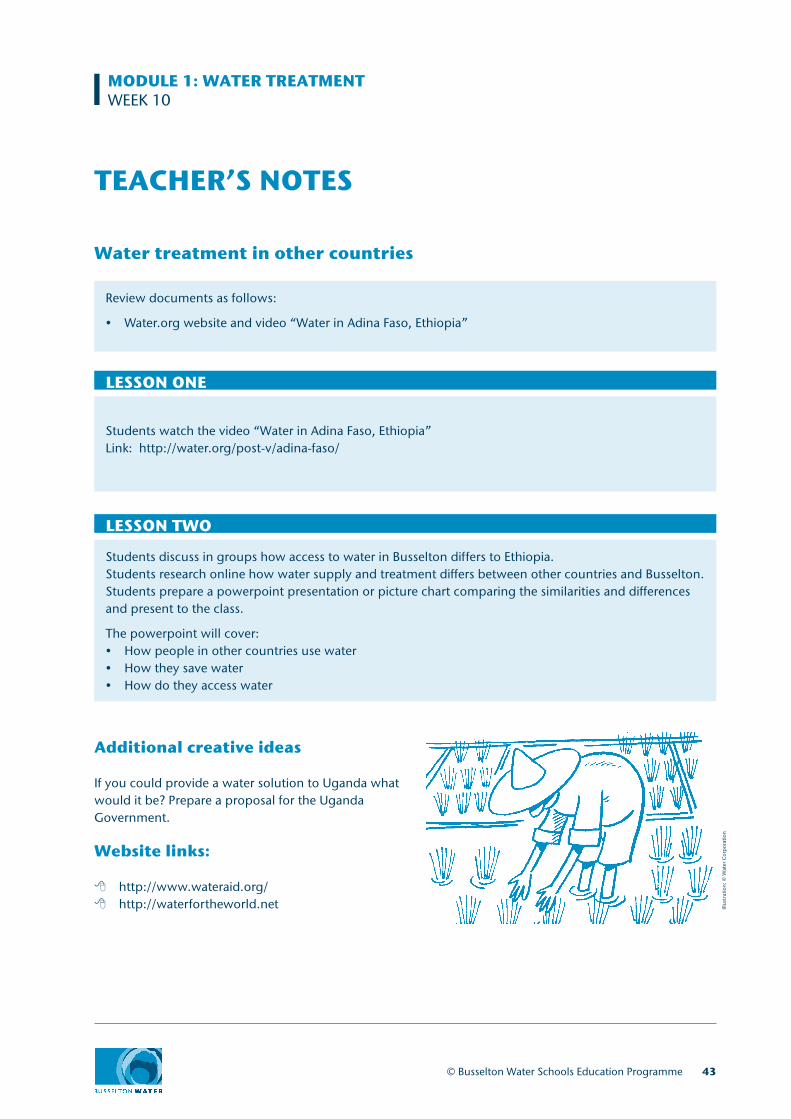
© Busselton Water Schools Education Programme 43
TEACHER’S NOTES
Water treatment in other countries
Review documents as follows:
• Water.org website and video “Water in Adina Faso, Ethiopia”
Students watch the video “Water in Adina Faso, Ethiopia”Link: http://water.org/post-v/adina-faso/
LESSON ONE
Students discuss in groups how access to water in Busselton differs to Ethiopia.Students research online how water supply and treatment differs between other countries and Busselton. Students prepare a powerpoint presentation or picture chart comparing the similarities and differences and present to the class.
The powerpoint will cover:• How people in other countries use water• How they save water• How do they access water
LESSON TWO
Additional creative ideas
If you could provide a water solution to Uganda what would it be? Prepare a proposal for the Uganda Government.
Website links:
8http://www.wateraid.org/8http://waterfortheworld.net Ill
ustr
atio
n: ©
Wat
er C
orp
orat
ion
MODULE 1: WATER TREATMENTWEEK 10
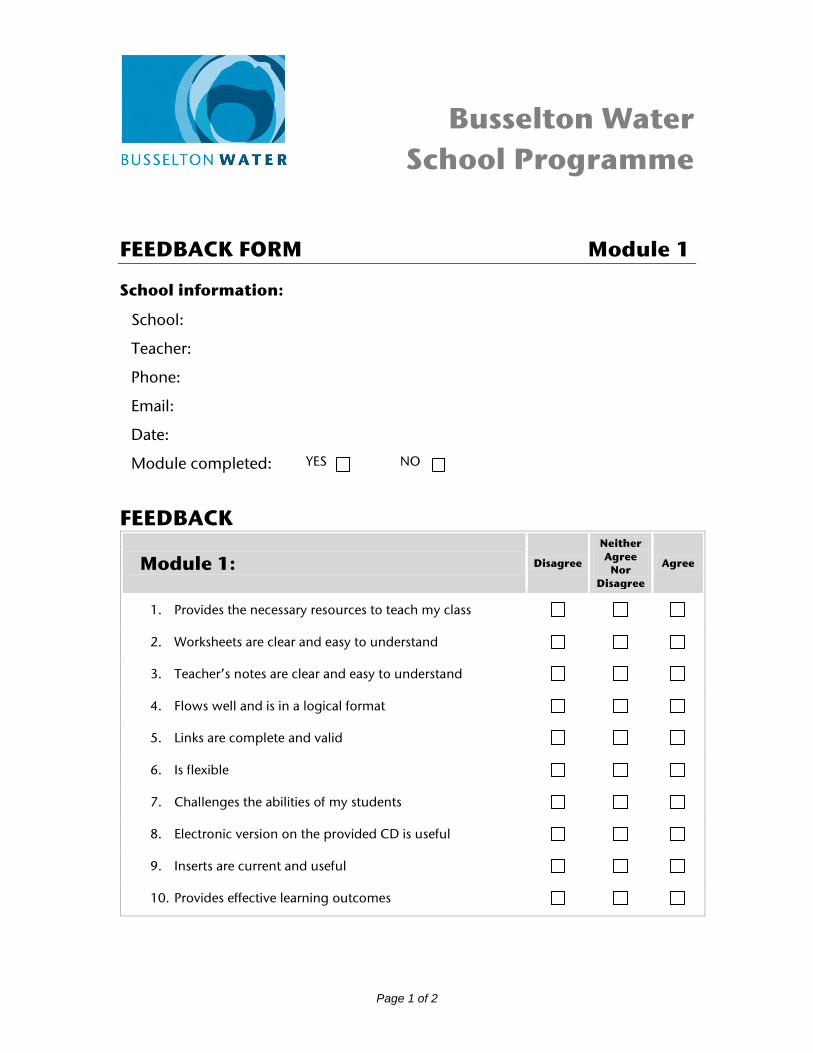
Page 1 of 2
Busselton Water School Programme
FEEDBACK FORM Module 1
School information:
School:
Teacher:
Phone:
Email:
Date:
Module completed: YES NO
FEEDBACK
Module 1: Disagree
Neither Agree
Nor Disagree
Agree
1. Provides the necessary resources to teach my class
2. Worksheets are clear and easy to understand
3. Teacher’s notes are clear and easy to understand
4. Flows well and is in a logical format
5. Links are complete and valid
6. Is flexible
7. Challenges the abilities of my students
8. Electronic version on the provided CD is useful
9. Inserts are current and useful
10. Provides effective learning outcomes
Page 2 of 2
ANY COMMENTS? 1. How would you make the module more effective?
2. Please note any links that may need to be updated:
3. Any other comments?
Please post this form to: Busselton Water
PO Box 57 Busselton WA 6280
Or by email: mailto:[email protected]