Embed Size (px)
Citation preview

South African Journal of Chemical Engineering, vol. 19, 2014, no. 1, pp 1-21 1
Modified coconut fiber used as adsorbent for
the removal of 2-chlorophenol and 2, 4, 6-
trichlorophenol from aqueous solution
Ojha Priyankaa, Rathilal Sudesh
b ,Singh Kunwar
c
a b
Durban University of Technology, Chemical Engineering c Indian Institute of Toxicology Research, Environmental Chemistry
Keywords: chlorophenol, activated carbon, adsoption isotherm, waste water treatment, water pollution
Abstract-The aim of this work was to determine the potential application of adsorbent prepared from
coconut fiber for the removal of organic water pollutants. Removal of 2-chlorophenol (2-CP) and 2,
4, 6-trichlorophenol (TCP) from aqueous solution by coconut fiber activated carbon (FAC) and acid
treated coconut fiber activated carbon (ATFAC) was investigated. Equilibrium and kinetic studies
were performed and the data was fitted to isotherm and kinetic models. Langmuir isotherm model
fitted better than Freundlich to the adsorption data. The monolayer adsorption capacity of ATFAC
(38.29 mg g-1 for 2-CP and 101 mg g-1 for TCP) at 250C was relatively higher as compared to that of
FAC (37.11 mg g-1 for 2-CP and 49.80 mg g-1 for TCP). The adsorption trend was as follows: ATFAC
(TCP) > ATFAC (2-CP) > FAC (TCP) > FAC (2-CP). The pseudo-second-order rate model fitted
better to the adsorption kinetics as compared to the pseudo-first-order rate model in all the cases.
Overall adsorption rate is controlled by film diffusion. The thermodynamic parameters (free energy,
enthalpy, entropy changes) exhibited the feasibility and spontaneous nature of the adsorption process.
The results of the study show that the carbon prepared from acid treated coconut fiber is more
effective than thermally treated fiber in the removal of chloro phenols and can be used as a potential
adsorbent for the removal of water pollutants.
INTRODUCTION
Chlorophenols have found widespread usage in petroleum refining, plastic, rubbers, pharmaceuticals,
disinfectants, wood preserving, steel industries the pulp and paper industry. Due to their toxicity and
recalcitrance, they form an important class of environmental pollutants (Colella et al, 1998). Because of their
high solubility, they not only contaminate wastewaters and groundwater but also migrate within different
aqueous environments (Snoeyink et al, 1997). Previous studies have classified them as one of the most
hazardous water pollutants (Gupta et al, 2006; Srivastava et al, 1995; Fawell et al, 1998; Murialdo et al, 2003;
Fu et al, 2004). Study for the removal of chlorophenols becomes important due to their carcinogenic and
mutagenic nature (Fishbein, 1978) and their high resistance to biodegradation.
Many efforts have been made for the physicochemical and biological treatment of chlorophenol-rich
wastewaters. Several studies have been carried out for the removal of chlorophenols from water/wastewater
including biodegradation (Baker et al, 1980; Hsieh et al, 2000; Tseng et al, 2003), adsorption (Streat et al, 1995;
Okolo et al, 2000; Paprowiez, 1990), ion exchange (Maslowska et al, 1984), ozonation (Stockinger et al, 1995;
Adams et al, 1997; Shang et al, 2002) and electrochemical oxidation (Tahar et al, 1999; Korbahti et al, 2002;
Yavuz et al, 2006). Many materials like coir pith (Namasivayam et al, 2003), dried activated sludge, fly ash
(Aksu et al, 2001) palm seed coat (Rengaraj et al, 2002), bituminous coal (Podkoscielny et al, 2003) and redmud
(Namasivayam et al, 1998) have been reported for the removal of chlorophenols. Adsorption utilizing activated
carbons prepared from agricultural materials have generated much interest amongst researchers and practitioners
of environmental engineering and science, attributed to its vast surface area and great affinity for organics.
However at the present time, little information is available concerning the adsorption of chlorophenols onto
activated carbons prepared from fibers (Wang et al, 2007; Mohan et al, 2005; Singh et al, 2008).
South African Journal of Chemical Engineering, vol. 19, 2014, no. 1, pp 1-21 2
This work builds upon earlier publications in which removal study of pyridine derivatives and chromium metal
were done by adsorbents prepared from coconut fiber (Mohan et al, 2005; Mohan et al, 2006). Continuing our
research in this direction, we have used activated carbons prepared from coconut fibers for the adsorption and
kinetic studies of 2-chlorophenol (2-CP) and 2, 4, 6-trichlorophenol (TCP) from aqueous solutions.
MATERIALS AND METHODS
Adsorbent development
Activated carbon from coconut fiber was prepared following the procedure reported elsewhere (Mohan et al,
2005; Mohan et al, 2006). In brief, two different types of activated carbons were developed. The acid treated
fiber activated carbon (ATFAC) was prepared by treating one part of coconut fibers with two parts (by weight)
of commercially available concentrated sulfuric acid (36N) and kept in an oven maintained at 150–165°C for a
period of 24 h. The carbonized material was washed well with double distilled water to remove the free acid and
dried at 105–110°C for 24 h. Dried coconut fibers were subjected to thermal activation at different temperatures
viz., 200, 400, 600 and 800°C for 1 h in an inert atmosphere.
The fiber activated carbon (FAC) was prepared by simply activating the coconut fibers without any chemical
treatment at different temperatures (200, 400, 600 and 800°C) in an inert atmosphere. The temperature and time
were optimized after observing the surface properties of the activated products obtained. In both cases (with and
without chemical treatment) the products obtained at temperatures higher or lower than 600°C exhibited poor
adsorption capacities. The activation was carried out under closely controlled conditions to obtain optimum
properties. The products so obtained were sieved to the desired particle size of 30–200 microns. Finally, the
product was stored in vacuum desiccators until required. The point of zero charge pH(PZC) of FAC and ATFAC
was calculated using the method described by Noh et al (1989). This was done by placing various amounts of
the carbon in 10 ml solution of 0.1 M NaCl. The sealed conical flasks were placed in a constant temperature
(25°C) shaker overnight. The equilibrium pH values of the mixtures were measured. The limiting pH was taken
as pH(PZC). The composition of both the carbons with their pH and pH(PZC) are given in Table 1.
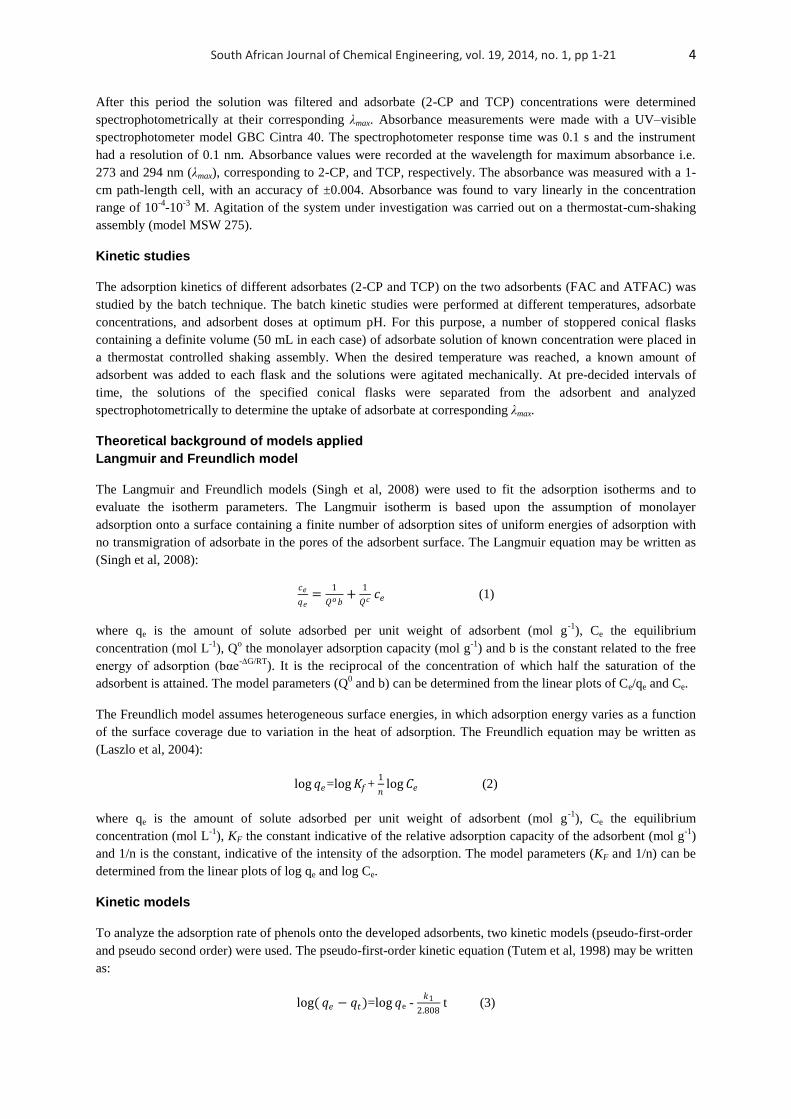
Table 1 : Characteristics of activated carbons derived from coconut fibers
Samples SBET
m2/g
pH pHPZC C
(%)
N
(%)
H
(%)
Ash
(%)
FAC
343 7.80 8.20 71.54 0.32 1.83 7.12
ATFAC 512 5.80 7.50 76.38 0.38 1.95 7.22
Adsorbate preparation
Two chloro-substituted phenols namely 2-chlorophenol (2-CP) and 2, 4, 6-trichlorophenol (TCP) were selected
for the study of adsorption on both the activated carbons (FAC and ATFAC). All the reagents were AR-grade
chemicals. Stock solutions (1x10⁻³
mol L-1
) of 2-CP and TCP were prepared in double distilled water.
Subsequent test solutions of the two chlorophenols were prepared through appropriate dilution of the respective
stock solutions with double distilled water. The pH of the test solutions were adjusted using dilute HCl (0.1 N)
and NaOH (0.1 N). The pH measurements were made using a pH meter (model 744, Metrohm).
Adsorption studies
Adsorption studies were performed by the batch technique to obtain the rate and equilibrium data. In order to
select the optimum pH for experiments, a series of batch experiments with the FAC and ATFAC were

South African Journal of Chemical Engineering, vol. 19, 2014, no. 1, pp 1-21 3
conducted at different pH ranging 2–10. The equilibrium isotherm studies were conducted by contacting a
constant mass of adsorbent with adsorbate solutions of different initial concentrations (10-4
-10-3
mol L-1
) at
optimum pH and agitated intermittently. Blank samples without adsorbent were used under the same conditions.
Adsorption studies were performed at different temperatures (10°C, 25
°C and 40
°C) and at optimum pH to
obtain data on the rate and extent of adsorption. For isotherm studies, a series of 100 mL Erlenmeyer stopper
conical flasks containing 50 mL of adsorbate (2-CP and TCP) solution (optimum pH) of varied concentrations
(10-4
-10-3
mol L-1
) and known amount of adsorbents were mixed together and agitated intermittently for a period
of 30 h. The contact time and other conditions were selected on the basis of preliminary experiments, which
demonstrated that the contact period of 24 h was sufficient to establish the equilibrium (Fig. 1a and 1b). Longer
contact times gave practically the same uptake for both the chloro phenols.
Figure 1a
Figure 1b
Figure 1: Effect of contact time on the uptake of 2-CP and TCP on (a) FAC and (b) ATFAC at different initial
concentrations; pH = 2; adsorbent amount = 1.0 g L-1
; temperature = 25°C
South African Journal of Chemical Engineering, vol. 19, 2014, no. 1, pp 1-21 4
After this period the solution was filtered and adsorbate (2-CP and TCP) concentrations were determined
spectrophotometrically at their corresponding λmax. Absorbance measurements were made with a UV–visible
spectrophotometer model GBC Cintra 40. The spectrophotometer response time was 0.1 s and the instrument
had a resolution of 0.1 nm. Absorbance values were recorded at the wavelength for maximum absorbance i.e.
273 and 294 nm (λmax), corresponding to 2-CP, and TCP, respectively. The absorbance was measured with a 1-
cm path-length cell, with an accuracy of ±0.004. Absorbance was found to vary linearly in the concentration
range of 10-4
-10-3
M. Agitation of the system under investigation was carried out on a thermostat-cum-shaking
assembly (model MSW 275).
Kinetic studies
The adsorption kinetics of different adsorbates (2-CP and TCP) on the two adsorbents (FAC and ATFAC) was
studied by the batch technique. The batch kinetic studies were performed at different temperatures, adsorbate
concentrations, and adsorbent doses at optimum pH. For this purpose, a number of stoppered conical flasks
containing a definite volume (50 mL in each case) of adsorbate solution of known concentration were placed in
a thermostat controlled shaking assembly. When the desired temperature was reached, a known amount of
adsorbent was added to each flask and the solutions were agitated mechanically. At pre-decided intervals of
time, the solutions of the specified conical flasks were separated from the adsorbent and analyzed
spectrophotometrically to determine the uptake of adsorbate at corresponding λmax.
Theoretical background of models applied
Langmuir and Freundlich model
The Langmuir and Freundlich models (Singh et al, 2008) were used to fit the adsorption isotherms and to
evaluate the isotherm parameters. The Langmuir isotherm is based upon the assumption of monolayer
adsorption onto a surface containing a finite number of adsorption sites of uniform energies of adsorption with
no transmigration of adsorbate in the pores of the adsorbent surface. The Langmuir equation may be written as
(Singh et al, 2008):
𝑐𝑒
𝑞𝑒=
1
𝑄𝑜𝑏+
1
𝑄𝑐 𝑐𝑒 (1)
where qe is the amount of solute adsorbed per unit weight of adsorbent (mol g-1
), Ce the equilibrium
concentration (mol L-1
), Qo the monolayer adsorption capacity (mol g
-1) and b is the constant related to the free
energy of adsorption (bαe-∆G/RT
). It is the reciprocal of the concentration of which half the saturation of the
adsorbent is attained. The model parameters (Q0 and b) can be determined from the linear plots of Ce/qe and Ce.
The Freundlich model assumes heterogeneous surface energies, in which adsorption energy varies as a function
of the surface coverage due to variation in the heat of adsorption. The Freundlich equation may be written as
(Laszlo et al, 2004):
log 𝑞𝑒=log 𝐾𝑓+ 1
𝑛log 𝐶𝑒 (2)
where qe is the amount of solute adsorbed per unit weight of adsorbent (mol g-1
), Ce the equilibrium
concentration (mol L-1
), KF the constant indicative of the relative adsorption capacity of the adsorbent (mol g-1
)
and 1/n is the constant, indicative of the intensity of the adsorption. The model parameters (KF and 1/n) can be
determined from the linear plots of log qe and log Ce.
Kinetic models
To analyze the adsorption rate of phenols onto the developed adsorbents, two kinetic models (pseudo-first-order
and pseudo second order) were used. The pseudo-first-order kinetic equation (Tutem et al, 1998) may be written
as:
log( 𝑞𝑒 − 𝑞𝑡)=log 𝑞e - 𝑘1
2.808 t (3)
South African Journal of Chemical Engineering, vol. 19, 2014, no. 1, pp 1-21 5
where qe and qt are the amounts adsorbed at equilibrium and at time t, respectively, and k1 is the first-order rate
constant. The adsorption rate parameter k1 can be calculated by plotting log (qe -qt) versus t. The pseudo-second-
order-equation based on equilibrium adsorption may be expressed as (Reddad et al, 2002):
1
𝑞𝑡=
1
𝑘2𝑞𝑒2 +
1
𝑞𝑒 𝑡 (4)
where qe is the amount adsorbed at equilibrium, and k2 is the pseudo-second-order rate constant. The values of
k2 and qe can be calculated by plotting t/qt versus t.
RESULTS AND DISCUSSION
Characterization of prepared adsorbents
The pH, pHPZC, C, H, N, and ash content (%) of both the carbons are given in Table 1. The BET surface area of
the FAC is 343 m2g
-1and for ATFAC it is found to be 512 m
2g
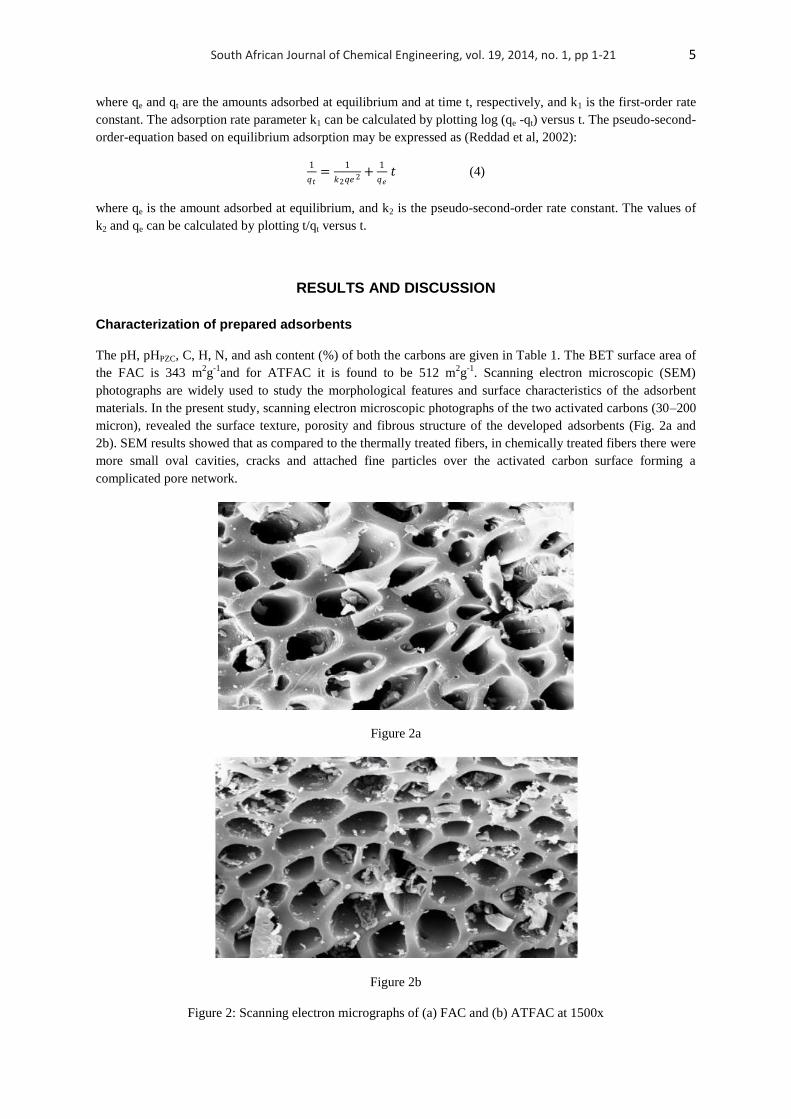
-1. Scanning electron microscopic (SEM)
photographs are widely used to study the morphological features and surface characteristics of the adsorbent
materials. In the present study, scanning electron microscopic photographs of the two activated carbons (30–200
micron), revealed the surface texture, porosity and fibrous structure of the developed adsorbents (Fig. 2a and
2b). SEM results showed that as compared to the thermally treated fibers, in chemically treated fibers there were
more small oval cavities, cracks and attached fine particles over the activated carbon surface forming a
complicated pore network.
Figure 2a
Figure 2b
Figure 2: Scanning electron micrographs of (a) FAC and (b) ATFAC at 1500x

South African Journal of Chemical Engineering, vol. 19, 2014, no. 1, pp 1-21 6
Adsorption studies
The pH of the solution is one of the major factors influencing the adsorption capacity of compounds that can be
ionized. Acid or alkali species may change the surface chemistry of the adsorbent by reacting with surface
groups. These effects may lead to significant alterations in the adsorption equilibrium depending on the pH
(Mohan et al, 2005; Garcia- Araya et al, 2003). At higher pH, phenol dissociate forming phenolate anions,
whereas, surface functional groups may be either neutral or negatively charged. The electrostatic repulsion
lowers the adsorption capacity of both the chlorophenols at high pH. The ionic fraction of phenolate ion, Ψions
can be calculated from the equation (Banat et al, 2000):
Ψions =
1
1+10(𝑝𝐾𝑎 −𝑝𝐻 ) (5)
The Ψions increases as the pH value increased. Thus, phenols being a weak acid will be adsorbed to a lesser
extent at higher pH values due to the repulsive force prevailing at higher pH (Banat et al, 2000; Khalid et al,
2000). 2-chlorophenol and 2, 4, 6-trichlorophenol is associated with the electron withdrawing effect of the
aromatic ring (Laszlo et al, 2004). Adsorption capacity of the activated carbons for the solute in molecular form
depends on the electron density of the solute and the carbon surface because the dispersive interaction between
the aromatic ring of the solute and those of the carbon surface are the main forces involved in the adsorption
process (Nouri et al, 2004). The effect of pH on the removal of different adsorbates (2-CP and TCP) using
adsorbents FAC and ATFAC is presented in Fig. 3.
Figure 3: Effect of pH on the adsorption of 2-CP and TCP on FAC and ATFAC
These studies were carried out at the initial adsorbate concentration of 1×10⁻⁴
mol L-1
. It was observed that the
removal decreases with an increase in the solution pH. The maximum adsorption was observed at the acidic pH
for both the adsorbents, therefore, a pH of 2.0±0.2 was chosen for the adsorption of 2-CP and TCP on the FAC
and ATFAC. At low pH high adsorption of phenols are also reported by some researchers (Gupta et al 2006;
Singh et al, 2008; Garcia-Araya et al, 2003). At lower pH, the functional groups on the carbon surface are in the
protonated form and high electron density on the solute molecules would lead to higher adsorption. The positive
surface of the adsorbent in relation to pH(PZC) is also discussed by Boehm (2002). It was concluded that for
amphoteric carbons having pH < pH(PZC), the surface of the carbon is considered to be positively charged.
The surface chemistry of the activated carbons also depends on their heteroatom content, mainly on their surface
oxygen complex (Radovic et al, 2001). A negative charge will result from the dissociation of surface oxygen

South African Journal of Chemical Engineering, vol. 19, 2014, no. 1, pp 1-21 7
complexes of acid character such as carboxyl and phenolic groups and these surface sites are known to be of the
Bronsted type. The positive surface charge may be due to surface oxygen complexes of basic character like
pyrones or chromenes, or due to the existence of electron-rich regions within the grapheme layers acting as
Lewis basic centers, which accept protons from the aqueous solution (Moreno-Castilla, 2004). The rise in the
equilibrium concentrations results in the molecular interaction of the solute i.e. electrostatic interactions with the
polar surface groups of activated carbons. This effect decreases with increase in the temperature enhancing the
adsorption (Terzyk, 2003). The Langmuir isotherms for the adsorption of 2-CP and TCP on FAC and ATFAC at
different temperatures are shown in Fig. 4a and 4b, respectively.
Figure 4a
Figure 4b
Figure 4: Langmuir adsorption isotherms of 2-CP and TCP on (a) FAC and (b) ATFAC at different
temperatures, pH = 2.
The monolayer adsorption capacity (Qo) was found to be higher for ATFAC as compared to FAC for adsorption
of both 2-CP and TCP as shown in Table 2. This signifies that the large surface area of ATSAC (512 m2/g) is
one of the parameters governing the high adsorption capacity of chloro phenols onto acid treated carbons.

South African Journal of Chemical Engineering, vol. 19, 2014, no. 1, pp 1-21 8
The adsorbent developed and used in the study showed high adsorption capacity in the removal of phenols from
aqueous solution as compared to other adsorbents developed by activation methods like palm seed coat
(Rengaraj et al, 1999), sawdust (Mohanty et al, 2005), tamarind nutshell (Goud et al, 2005) and tendu leaf refuse
(Nagda et al, 2009). Although the adsorption capacity of olive stone activated carbon reported by Mourad et al.
(2006) is much higher than the adsorbent investigated in this study. The difference in the adsorption capacities
of these adsorbents for the uptake of phenols suggests that the nature and composition of the agricultural waste
material used as adsorbent and the activation process under which it was developed plays an important role in
determining its adsorption capacity.
Table 2 : Langmuir isotherm constants for the adsorption of chlorophenols
10 °C 25
°C 40
°C
Adsorbent
Qo
(x104
mol g-1
)
b
(x10-3
mol g-1
)
R2
Qo
(x104
mol g-1
)
b
( x10-3
mol g-1
)
R2
Qo
(x104
mol g-1
)
b
(x10-3
mol g-1
)
R2
2-CP
FAC 1.96 2.49 0.98 2.89 2.63 0.99 3.80 2.68 0.95
ATFAC 2.27 3.16 0.98 2.98 3.11 0.98 4.05 4.65 0.99
TCP
FAC 3.82 2.83 0.98 3.87 3.66 0.97 4.03 3.74 0.99
ATFAC 5.14 3.24 0.99 7.86 4.34 0.98 8.08 4.80 0.97
A donor-acceptor complex mechanism also reported earlier (Mattson et al, 1969) for the adsorption of phenol is
one of the key factors in the explanation of adsorption of 2-CP and TCP on activated carbons. In this
mechanism, the carbonyl oxygen group on the carbon surface acts as the electron donor whereas the aromatic
ring of the phenol acts as the acceptor. The above donor-acceptor complex mechanism is more pronounced in
the case of 2, 4, 6-trichlorophenol as the presence of the three Cl-group is in favor of the formation of a bond
between the surface carbonyl groups and the electron–deficient aromatic ring of the phenol while only one Cl-
group in 2-CP makes the aromatic ring of the phenol less electron deficient and thus weaken the bond formation
between surface carbonyl groups of the adsorbent and aromatic ring of the phenol.
The Langmuir constant b reflects the affinity of the adsorbent for the solute. For the adsorption of 2-CP and
TCP the values of b are relatively higher for ATFAC indicating more stable bond/complex with the carbon
surface. The essential characteristic of the Langmuir isotherm can be expressed in terms of a dimensionless
equilibrium factor RL that is defined as RL = 1/ (1+bCo), where b is the Langmuir constant and C0 the initial
concentration of adsorbate. RL values obtained (data not shown) at different concentrations and temperatures are
between 0 and 1, indicating favorable adsorption of both adsorbates on activated carbons developed from the
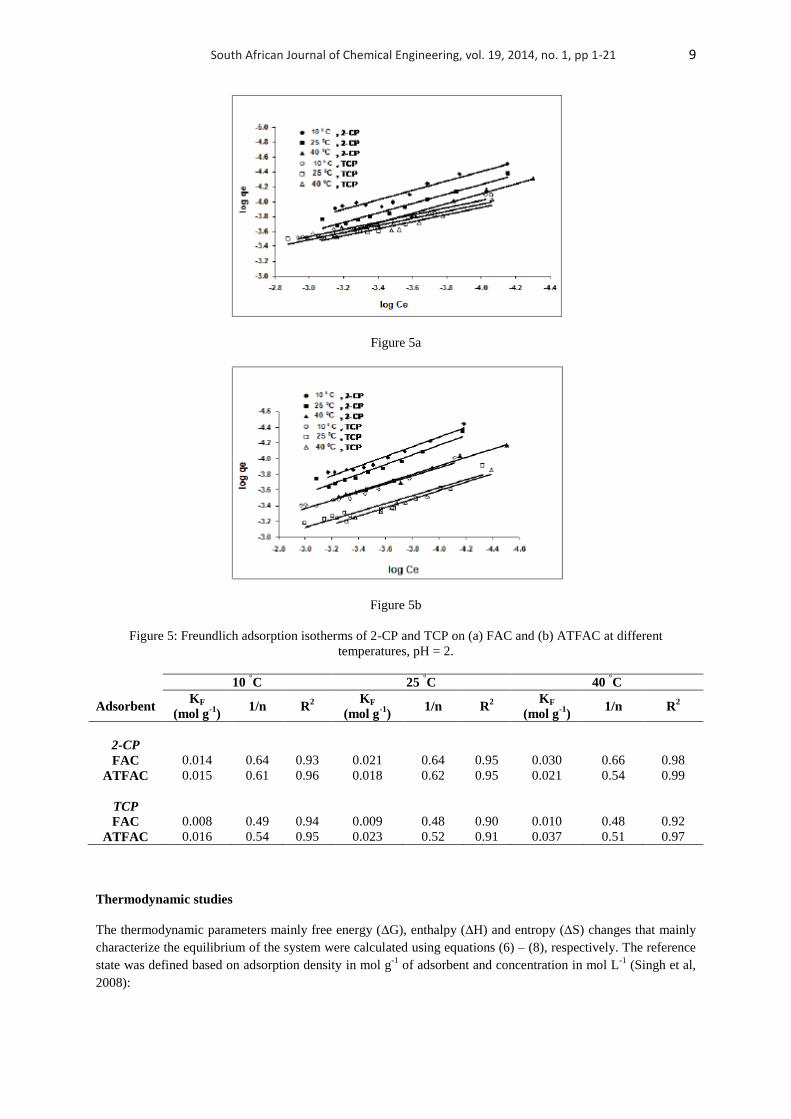
agricultural waste material. The Freundlich isotherms for the adsorption of 2-CP and TCP on FAC and ATFAC
at different temperatures are presented in Fig. 5a and 5b, respectively. The corresponding Freundlich isotherm
parameters along with the correlation coefficients are given in Table 3. The value of 0 < 1/n < 1.0 exhibits the
favorability of adsorption onto activated carbons (McKay et al, 1981). The regression coefficients showed that
the Langmuir model adequately fitted to the adsorption data. The adsorption capacity of ATFAC for TCP is
higher than that for 2-CP i.e. TCP > 2-CP. This could be explained by the electron withdrawing characteristic of
the Cl-group also taken into account by Jain et al (2007); according to the study the greater the number of Cl-
groups present, the more deficient the aromatic ring and this would result in higher adsorption of phenol onto
carbon.
South African Journal of Chemical Engineering, vol. 19, 2014, no. 1, pp 1-21 9
Figure 5a
Figure 5b
Figure 5: Freundlich adsorption isotherms of 2-CP and TCP on (a) FAC and (b) ATFAC at different
temperatures, pH = 2.
10 °C 25
°C 40
°C
Adsorbent KF
(mol g-1
) 1/n R
2
KF
(mol g-1
) 1/n R
2
KF
(mol g-1
) 1/n R
2
2-CP
FAC 0.014 0.64 0.93 0.021 0.64 0.95 0.030 0.66 0.98
ATFAC 0.015 0.61 0.96 0.018 0.62 0.95 0.021 0.54 0.99
TCP
FAC 0.008 0.49 0.94 0.009 0.48 0.90 0.010 0.48 0.92
ATFAC 0.016 0.54 0.95 0.023 0.52 0.91 0.037 0.51 0.97
Thermodynamic studies
The thermodynamic parameters mainly free energy (∆G), enthalpy (∆H) and entropy (∆S) changes that mainly
characterize the equilibrium of the system were calculated using equations (6) – (8), respectively. The reference
state was defined based on adsorption density in mol g-1
of adsorbent and concentration in mol L-1
(Singh et al,
2008):

South African Journal of Chemical Engineering, vol. 19, 2014, no. 1, pp 1-21 10
∆G = -RT lnK (6)
∆H = R( 𝑇1𝑇2
𝑇1−𝑇2 )ln
𝐾2
𝐾1 (7)
∆S = ∆H−∆G
𝑇 (8)
where K, K1 and K2 are the equilibrium constants at the temperatures 10 °C, 25
°C and 40
°C respectively and
obtained from the slopes of adsorption isotherms at different concentrations. The values obtained from the
thermodynamic analysis are given in Table 4.
Table 4: Thermodynamic parameters of the adsorption
-∆Go (kJ mol
-1) ∆H (kJ mol
-1) ∆S
0 (kJ mol
-1)
Adsorbent 10 °C 25
°C 40
°C
2-CP
FAC 18.40 19.51 20.54 1.86 0.07
ATFAC 18.96 19.99 21.98 9.36 0.10
TCP
FAC 18.70 20.33 21.41 6.96 0.09
ATFAC 19.02 20.75 22.06 9.75 0.12
The negative values of ∆G for adsorption of 2-CP and TCP indicate the feasibility and spontaneous nature of the
process. The dipole-dipole interaction between the adsorbent and adsorbate may effectively reduce the hydration
number of the adsorbate and adsorbent, increasing ∆S, as water molecules are released into the aqueous solution
(Vinod et al, 2002). Physical adsorption and chemisorption can be classified, to a certain extent, by the
magnitude of the enthalpy change. It is accepted that bonding strengths of < 84 kJ mol-1
are those of physical
adsorption type bonds. The chemisorption bond strengths range from 84 kJ mol-1
to 420 kJ mol-1
(Terzyk,
2003). Based on this assumption the adsorption of chloro phenols on activated carbons (FAC and ATFAC)
appear to be a physical adsorption process.
Kinetic studies
The extent of adsorption of both the adsorbates on FAC and ATFAC was found to increase with temperature
indicating the endothermic nature of the process resembling the findings of the thermodynamic analysis. The
effect of adsorbent amount and initial adsorbate concentration on the adsorption of chloro phenols for the
different carbons has also been studied. The rate of uptake increased with an increase in adsorbent amount. The
adsorption rate data for the studied adsorbates (2-CP and TCP) attaching onto the developed activated carbons
were analyzed using two kinetic models viz., pseudo-first-order equation and pseudo-second-order equation.
Both the models were studied at different temperatures as well as different initial concentrations of adsorbates to
find out the effect of temperature and concentration on the rate-equation parameters. The results obtained from
both the first and second-order rate equations at different temperatures are given in Tables 5 and 6 for different
adsorbate concentrations; it is summarized in Tables 7 and 8, respectively. The pseudosecond- order rate model
fitted better to the adsorption kinetics as compared to the pseudofirst- order rate model. The qe values obtained
by using the pseudo-second order rate equation are more accurate to the experimental values (Tables 9 and 10)
than that when using the pseudo-first order at all temperatures and concentrations for both the chloro phenols.

South African Journal of Chemical Engineering, vol. 19, 2014, no. 1, pp 1-21 11
Table 5 : First-order rate constants for the adsorption at different temperature
10 °C 25
°C 40
°C
Adsorbent k1 (x103 min
-1) R
2 k1 (x10
3 min
-1) R
2 k1 (x10
3 min
-1) R
2
2-CP
FAC 2.17 0.95 0.97 0.98 2.48 0.96
ATFAC 3.12 0.98 1.97 0.92 2.45 0.89
TCP
FAC 0.22 0.90 2.60 0.77 2.22 0.86
ATFAC 1.90 0.89 1.67 0.82 1.16 0.84
Table 6 : Second-order rate constants for the adsorption at different temperature
10 °C 25
°C 40
°C
Adsorbent k2(g mol-1
min -1
) R2 k2(g mol
-1min
-1) R
2 k2(g mol
-1min
-1) R
2
2-CP
FAC 52.83 0.94 34.83 0.99 21.00 0.99
ATFAC 21.00 0.87 32.50 0.95 27.50 0.96
TCP
FAC 296 0.98 368 0.99 308 0.99
ATFAC 166 0.98 149 0.99 81.67 0.99
Table 7 : First-order rate constants for the adsorption at different initial adsorbate concentrations
1x10⁻⁴
mol L-1
) (5x10⁻⁴
mol L-1
) (1x10⁻³
mol L-1
)
Adsorbent k1 (x103 min
-1) R
2 k1 (x10
3 min
-1) R
2 k1 (x10
3 min
-1) R
2
2-CP
FAC 0.97 0.98 1.82 0.96 2.03 0.99
ATFAC 1.97 0.92 1.97 0.73 1.35 0.88
TCP
FAC 2.60 0.77 2.15 0.91 1.29 0.59
ATFAC 1.67 0.82 1.28 0.87 1.22 0.90
Table 8 : Second- order rate constants for the adsorption at different initial adsorbate concentrations
1x10⁻⁴
mol L-1
) (5x10⁻⁴
mol L-1
) (1x10⁻³
mol L-1
)
Adsorbent k2(g mol-1
min -1
) R2 k2(g mol
-1min
-1) R
2 k2(g mol
-1min
-1) R
2
2-CP
FAC 52.83 0.94 36.83 0.99 25.83 0.98
ATFAC 32.50 0.98 11.42 0.94 15.82 0.94
TCP
FAC 368 0.99 87.67 0.99 39.33 0.98
ATFAC 149 0.99 47.50 0.99 25.17 0.98

South African Journal of Chemical Engineering, vol. 19, 2014, no. 1, pp 1-21 12
Table 9 : Comparative evaluation of qe as calculated experimentally and by using first and second-order rate
equations at different temperatures
qe(exp) (x104 mol g
-1) qe(exp) (x10
4 mol g
-1) qe(exp) (x10
4 mol g
-1)
Adsorbent 10 °C 25
°C 40
°C 10
°C 25
°C 40
°C 10
°C 25
°C 40
°C
2-CP
FAC 0.31 0.45 0.52 0.48 0.74 1.39 0.36 0.42 0.54
ATFAC 0.58 0.95 2.05 0.74 1.24 02.19 0.55 0.98 2.07
TCP
FAC 0.38 0.72 0.72 0.49 0.18 0.19 0.37 0.73 0.73
ATFAC 0.29 0.52 0.64 0.19 0.25 0.08 0.31 0.54 0.64
Table 10 : Comparative evaluation of qe as calculated experimentally and by using first and second-order rate
equations at initial adsorbate concentrations
qe(exp) (x104 mol g
-1) qe(exp) (x10
4 mol g
-1) qe(exp) (x10
4 mol g
-1)
Adsorbent (1x10⁻⁴
mol L-1)
(5x10⁻⁴
mol L-1)
(1x10⁻³
mol L-1)
(1x10⁻⁴
mol L-1)
(5x10⁻⁴
mol L-1)
(1x10⁻³
mol L-1)
(1x10⁻⁴
mol L-1)
(5x10⁻⁴
mol L-1)
(1x10⁻³
mol L-1)
2-CP
FAC 0.45 0.59 1.16 0.36 0.54 0.95 0.48 0.59 1.14
ATFAC 0.58 0.95 2.05 0.65 1.02 1.56 0.59 0.94 2.09
TCP
FAC 0.71 3.19 4.90 0.18 0.75 1.51 0.73 3.21 4.89
ATFAC 0.52 2.17 3.32 0.25 0.97 1.63 0.54 2.15 3.31
Mass transfer studies
The mass-transfer analysis of adsorbates during the process was studied by using the mass transfer diffusion
model (McKay et al, 1981):
ln(𝐶𝑡
𝐶𝑜−
1
1+𝑚𝑘 )= ln(
𝑚𝑘
1+𝑚𝑘 ) − (1+
𝑚𝑘
𝑚𝑘 ) βlSst (9)
where Ct is the concentration of solute at time t (mol L-1
), C0 the initial concentration of the solute (mol L-1
), m
the mass of the adsorbent per unit volume of particle-free solution of solute (g L-1
), k the Langmuir constant
(obtained by multiplying Q0
with b), β l the mass transfer coefficient (cm s-1
) and Ss the outer surface area of the
adsorbent per unit volume of particle-free slurry (cm-1
) and is calculated as:
Ss =
6𝑚
(1−𝜏𝑝 ) dp ρp (10)
where dp is the particle diameter (cm), ρp the density of adsorbent (g cm-1
) and εp is the porosity of adsorbent
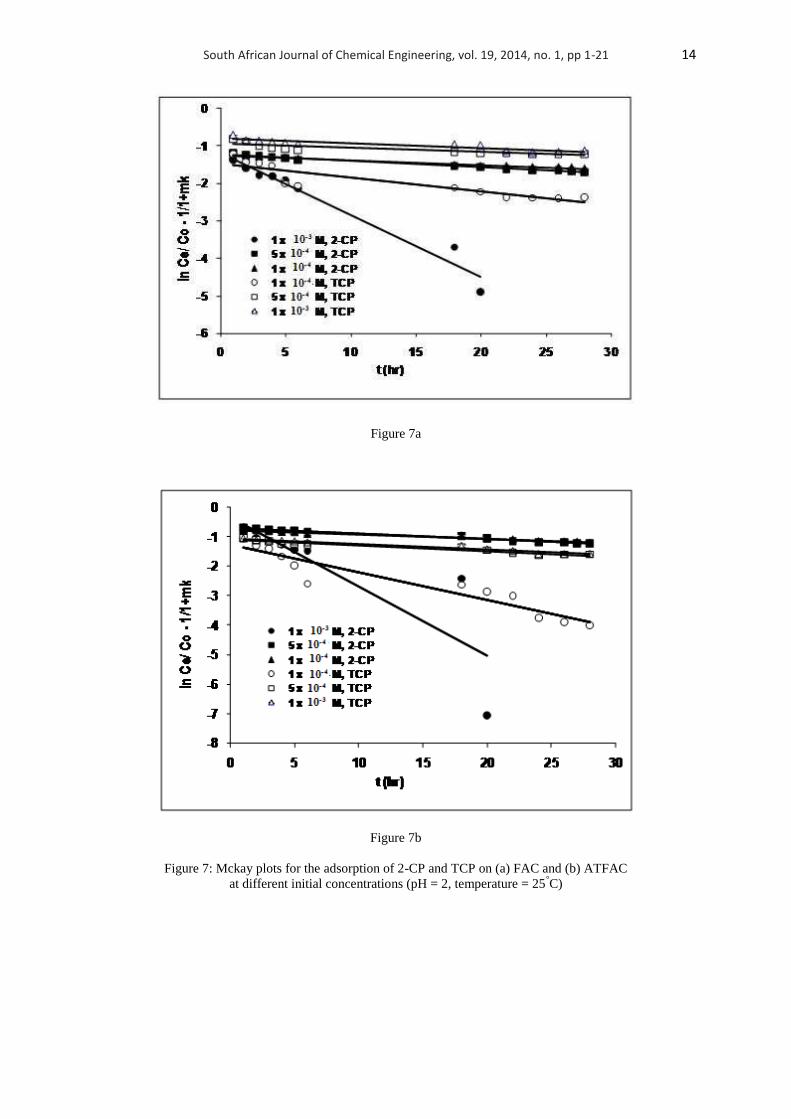
particles. The values of β l were determined from the slope and intercepts of the plots of ln{(Ct/C0)-1/(1+mk)}
versus t, for different temperatures and initial adsorbate concentrations (Fig. 6 and 7 respectively) using the least
squares method. The linearity of the plots confirms the validity of the diffusion model for the studied
adsorbateadsorbent systems. The values of the mass transfer coefficient (β l) of the adsorbates for both the
developed adsorbents (FAC and ATSAC) are presented in Tables 11 and 12. The values of β l increased with an
increase in the temperature, suggesting the endothermic nature of the reaction. Further, it was found that
increasing the initial adsorbate concentration results in a decrease in the external mass transfer coefficient.
These findings are similar to those reported for the adsorption of phenol by coconut-husk based activated carbon
(Reichenberg, 1953).

South African Journal of Chemical Engineering, vol. 19, 2014, no. 1, pp 1-21 13
Figure 6a
Figure 6b
Figure 6: Mckay plots for the adsorption of 2-CP and TCP on (a) FAC and (b) ATFAC at different
temperatures (pH = 2, Co = 1x 10⁻⁴
M)
South African Journal of Chemical Engineering, vol. 19, 2014, no. 1, pp 1-21 14
Figure 7a
Figure 7b
Figure 7: Mckay plots for the adsorption of 2-CP and TCP on (a) FAC and (b) ATFAC
at different initial concentrations (pH = 2, temperature = 25°C)

South African Journal of Chemical Engineering, vol. 19, 2014, no. 1, pp 1-21 15
Table 11 : Mass transfer coefficient (βl) at different temperatures
10 °C 25
°°C 40
°C
Adsorbent βl (x 10-8
cm sec -1
) R2 βl (x 10
-8cm sec
-1) R
2 βl (x 10
-8cm sec
-1) R
2
2-CP
FAC 2.10 0.98 3.75 0.96 10.86 0.94
ATFAC 1.75 0.99 8.56 0.70 15.58 0.91
TCP
FAC 0.10 0.77 2.00 0.80 2.69 0.93
ATFAC 0.66 0.92 3.33 0.90 8.86 0.86
Table 12 : Mass transfer coefficient (βl) at different initial adsorbate concentrations
(1x10⁻⁴
mol L-1
) (5x10⁻⁴
mol L-1
) (1x10⁻³
mol L-1
)
Adsorbent βl (x 10-8
cm sec -1
) R2 βl (x 10
-8cm sec
-1) R
2 βl (x 10
-8cm sec
-1) R
2
2-CP
FAC 3.77 0.96 3.72 0.98 2.86 0.99
ATFAC 8.56 0.80 6.83 0.98 5.44 0.96
TCP
FAC 6.14 0.80 2.00 0.76 0.67 0.83
ATFAC 3.33 0.90 3.69 0.93 6.83 0.80
Rate limiting step in the process of uptake of chlorophenols
To interpret the experimental data, it is necessary to identify the rate-determining step controlling the removal
rate in the adsorption process. The three consecutive steps involved in the adsorption of an organic/inorganic
species by a porous adsorbent are:
(1) transport of the adsorbate to the external surface of the adsorbent (film-diffusion);
(2) transport of the adsorbate within the pores of the adsorbent except for a small amount of adsorption that
occurs on the external surface (particle diffusion);
(3) adsorption of the adsorbate on the external surface of the adsorbent.
It is generally accepted that process (3) is very rapid and does not represent the ratedetermining step in the
uptake of organic/inorganic species. Therefore, either steps (1) or (2) could be the rate controlling step and to
determine the actual rate controlling step involved in the adsorption of chloro phenols, the quantitative analysis
of the kinetic data was done with the help of the following equations also studied by Hasany et al (2000):
F = 1- 6
𝛱2
1
𝑛2 exp[ − 𝐷𝑖𝑛
2𝑛2
𝑟𝑜2 ] (11)
or
F = 1- 6
𝛱2
1
𝑛2 exp[ − 𝑛2 𝐵𝑡 ] (12)
where F is the fractional attainment of equilibrium at time t and is obtained by the expression:
F = 𝑄𝑡
𝑄0 (13)

South African Journal of Chemical Engineering, vol. 19, 2014, no. 1, pp 1-21 16
Qt is the amount of adsorbate taken up at time t and Q0 is the maximum equilibrium uptake
and;
Bt values were obtained for each observed value of F and using the following equation:
Bt = 2Π - Π2 𝐹(𝑡)
8 -2Π [1-(Π
8)𝐹 𝑡 ]1/2
(14)
The results are plotted in Fig. 8 (a and b) and Fig. 9 (a and b).
Figure 8a
Figure 8b
Figure 8: Bt vs. t plots for the adsorption of (a) 2-CP and (b) TCP on FAC at different
temperatures (pH = 2; Co = 1x 10⁻⁴
mol L-1
)

South African Journal of Chemical Engineering, vol. 19, 2014, no. 1, pp 1-21 17
Figure 9a
Figure 9b
Figure 9: Bt vs. t plots for the adsorption of (a) 2-CP and (b) TCP on ATFAC at
different temperatures (pH = 2; Co = 1x 10⁻⁴
mol L-1
)
The linearity test of Bt versus t plots was employed to distinguish between the film diffusion and particle
diffusion controlled adsorption. If the plots of Bt versus t is a straight line passing through the origin, then the
adsorption rate is governed by particle diffusion, otherwise it is governed by film diffusion. In case of FAC and
ATFAC the Bt versus t plot for adsorption of 2-CP and TCP, at all temperatures at initial concentration (1×10⁻⁴
mol L-1
) do not pass through the origin, suggesting that the rate controlling process may be the film diffusion
(Singh et al, 2008). In all the cases the Bt versus t plots (curved at later stage) can be resolved into two plots
with different slopes, indicating change in the adsorption mechanism with time. It has also been suggested that

South African Journal of Chemical Engineering, vol. 19, 2014, no. 1, pp 1-21 18
the change in the slope indicates the existence of different sizes of pores (Al-Asheh et al, 2003). Similar types of
observations have been reported for adsorption of phenol (Vinod et al, 2002) and metals (Gupta et al, 2002).
CONCLUSIONS
Activated carbons developed from the coconut fibers were studied for the adsorption of 2-CP and TCP from
aqueous solutions under different conditions. Langmuir isotherm model adequately fitted to the adsorption data.
The monolayer adsorption capacity of ATFAC was high as compared to FAC. The pseudo-second-order rate
model fitted better to the adsorption kinetics as compared to the pseudo-first-order rate model. Kinetic studies
revealed that the adsorption occurs through film diffusion at different temperatures in both thermally activated
(FAC) as well as chemically activated carbon (ATFAC). The computed values of Gibbs free energy, enthalpy
change and entropy change showed an endothermic nature and spontaneity of the process. The study showed
that the adsorbent prepared from acid treatment of the coconut fiber is more efficient in removing chloro
phenols from aqueous solutions as compared to thermally activated fiber and can be exploited for commercial
purposes. A novel method for maximum regeneration of adsorbents is a part of this work and shall be included
in further studies.
ACKNOWLEDGEMENTS
The authors would like to thank the director, Indian Institute of Toxicology Research, Lucknow (India) for his
keen interest in the work. Financial assistance from DUT, Durban (South Africa) to the author (PO) is
thankfully acknowledged.
NOMENCLATURE
ATFAC acid treated coconut fiber activated carbon
Ce equilibrium concentration (mol L-1
)
C0 initial concentration of adsorbate (mol L-1
)
Ct concentration of solute at time t (mol L-1
)
2-CP 2-chlorophenol
F fractional attainment of equilibrium at time t
FAC coconut fiber activated carbon
∆G Gibbs free energy
∆H Enthalpy
KF constant indicative of the relative adsorption capacity of the adsorbent (mol g-1
)
Qo monolayer adsorption capacity (mol g-1
)
R Universal gas constant
RL dimensionless equilibrium factor
SEM Scanning electron micrograph
Ss outer surface of the adsorbent per unit volume of particle-free slurry (cm-1
)
T Temperature (oC)
TCP 2,4,6-trichlorophenol
b Langmuir constant
dp particle diameter (cm)
m mass of the adsorbent per unit volume of particle-free solution of solute (g L-1
)
k1 first-order rate constant
k2 pseudo-second-order rate constant
pH(PZC) point of zero charge
qe solute adsorbed per unit weight of adsorbent at equilibrium (mol g-1
)
qe solute absorbed per unit weight of absorbent at time t (mol g-1
)
1/n constant, indicative of the intensity of the adsorption
Ψions ionic fraction of phenolate
βl mass transfer coefficient (cm s-1
)
ρp density of adsorbent (g cm-1
)
εp porosity of adsorbent particles
λmax wavelength for maximum absorbance (nm)

South African Journal of Chemical Engineering, vol. 19, 2014, no. 1, pp 1-21 19
REFERENCES
1. Adams, C. D., Cozzens, R. A., Kim, B. J., Effects of ozonation on the biodegradability of substituted
phenols, Water Res. 31(1997) 2655–2663.
2. Aksu, Z., Yener, J., A comparative adsorption/biosorption study of monochlorinated phenols onto
various sorbents, Waste Manage. 21 (2001) 695–702.
3. Al-Asheh, S., Banat, F., Masad, A., Physical and chemical activation of pyrolyzed oil shale residue for
the adsorption of phenol from aqueous solutions, Environ. Geol. 44 (2003) 333-342.
4. Baker, M. D., Mayfield, C. I., Inniss, W. E., Degradation of chlorophenols in soil, sediment and water
at low temperature, Water Research 14 (1980) 1765-1771.
5. Banat, F. A., Al-Bashir, B., Al-Asheh, S., Hayajneh, O., Adsorption of phenol by bentonite, Environ.
Pollut. 107 (2000) 391–398.
6. Boehm, H. P., Surface oxides on carbon and there analysis: a critical assessment, Carbon 40 (2002)
145-149.
7. Colella, L. S., Armenante, P. M., Adsorption isotherms for chlorinated phenols on activated carbon, J.
Chem. Eng. Data 43 (1998) 573-579.
8. Fawell, K., Hunt, S., Environmental Toxicology: Organic Pollutants, 1st ed., Ellis Horwood, England
(1998).
9. Fishbein, L., Overview of potential mutagenic problems posed by some pesticides and their trace
impurities, Environ. Health Perspect. 27 (1978) 125-131.
10. Fu, Y., Diwekar, U.M., Cost effective environmental control technology for utilities, Adv. Environ.
Res. 8 (2004) 173-196.
11. Garcia-Araya, J. F., Beltran, F. J., Alvarez, P., Masa, F. J., Activated carbon adsorption of some
phenolic compound present in agro-industrial wastewater, Adsorption 9 (2003) 107–115.
12. Goud, V. V., Mohanty, K., Rao, M. S., Jayakumar, N. S., Phenol removal from aqueous solutions using
tamarind nutshell activated carbon: batch and column study, Chem. Eng. Technol. 28 (2005) 814-821.
13. Gupta, V. K., Ali, I., Removal of 2, 4-dinitrophenol from wastewater by adsorption technology: a batch
and column study, Int. J. Environ. Pollut. 27 (2006) 104-120.
14. Gupta, V. K., Sharma, S., Removal of cadmium and zinc from aqueous solutions using red mud,
Environ. Sci. Technol. 36 (2002) 3612–3617.
15. Gupta, V. K., Suhas, Mohan, D., Singh, K. P., Removal of 2-aminophenol from wastewater using novel
adsorbents, Ind. Eng. Chem. Res. 45 (2006) 1113-1122.
16. Hasany, S. M., Saeed, M. M., Ahmad, M., Adsorption isotherms and thermodynamic profile of Co (II)
SCN complex uptake on polyurethane foam, Separ. Sci. Technol. 35 (2000) 379–394.
17. Hsieh, C. T., Teng, H., Liquid-phase adsorption of phenol onto activated carbons prepared with
different activation levels, J. Colloid Interf. Sci. 230 (2000) 171-175.
18. Jain, S., Jayram, R. V., Adsorption of phenol and substituted chlorophenols from aqueous solution by
activated carbon prepared from jackfruit (artocarpus heterophyllus) Peel-Kinetics and Equilibrium
Studies, Separ. Sci. Technol. 42 (2007) 2019-2032.
19. Khalid, N., Ahmad, S., Toheed, A., Ahmad, J., Potential of rice husk for antimony removal, Appl.
Radiat. Isot. 52 (2000) 30–38.
20. Korbahti, B. K., Salih, B., Tanyolac, A., Electrochemical conversion of phenolic wastewater on carbon
electrodes in the presence of NaCl, J. Chem. Technol. Biotechnol. 77 (2002) 70–76.
21. Laszlo, K., Tombacz, E., Kerepesi, P., Surface chemistry of nanoporous carbon and the effect of pH on
adsorption from aqueous phenol and 2, 3, 4-trichlorophenol solutions, Colloids Surf. A
22. Physicochem. Eng. Asp. 13 (2004) 230–238. Maslowska, J., Tek, W. P., Separation of chlorophenols
on a cation-exchanger in Ce (III) form, Chromatographia 18 (1984) 704-706.
23. Mattson, J. S., Mark, H. B., Malbin, M. D., Weber, W. R. Jr, Crittenden, J. C., Surface chemistry of
active carbon: specific adsorption, J. Colloid Interf. Sci. 31 (1969) 116-130.
24. McKay, G., Otterburn, M. S., Sweeney, A. G., Surface mass transfer process during colour removal
from effluent using silica, Water Res. 15 (1981) 327–331.

South African Journal of Chemical Engineering, vol. 19, 2014, no. 1, pp 1-21 20
25. Mohan, D., Singh, K. P., Ghosh, D., Removal of α-picoline, β-picoline and γ-picoline from synthetic
wastewater using low cost activated carbons derived from coconut shell fibers, Environ. Sci. Technol.
39 (2005) 5076-5086.
26. Mohan, D., Singh, K. P., Singh, V. K., Trivalent chromium removal from wastewater using low cost
activated carbon derived from agricultural waste material and activated carbon fabric cloth, J. Hazard.
Mater. B135 (2006) 280-295.
27. Mohanty, K., Das, D., Biswas, M. N., Adsorption of phenol from aqueous solutions using activated
carbons prepared from tectona grandis sawdust by ZnCl2, Chem. Eng. 115 (2005) 121- 131
28. Moreno-Castilla, C., Adsorption of organic molecules from aqueous solutions on carbon materials,
Carbon 42 (2004) 83–94.
29. Mourad, T., Benaouda, B., Nooredine, B., Mostefa, B., Emmanuel, N., Removal of phenol and 4-
chlorophenol from aqueous solutions by olive stone based activated, Adsorpt. Sci. Technol. 24 (2006)
375-387.
30. Murialdo, S. E., Fenoglio, R., Haure, P. M., Gonzalez, J. F., Degradation of phenol and chlorophenols
by mixed and pure cultures, Water SA 29 (2003) 457-463.
31. Nagda, G. K., Diwan, A. M., Ghole, V. S., Potential of tendu leaf refuse for phenol in aqueous systems,
Appl. Ecol. Env. Res. 5 (2009) 1-9.
32. Namasivayam, C., Kavitha, D., Adsorptive removal of 2-chlorophenol by low-cost coir pith carbon, J.
Hazard. Mater. B98 (2003) 257–274.
33. Namasivayam, C., Thamaraiselvi, K., Adsorption of 2-chlorophenol by waste red mud, Fresen.
Environ. Bull. 7 (1998) 314–319.
34. Noh, J. S., Schwarz, J. A., Estimation of the point zero charge of simple oxides by mass titration, J.
Colloid Interf. Sci. 130 (1989) 157-164.
35. Nouri, S., Haghseresht, F., Adsorption of p-nitrophenol in untreated and treated activated carbon,
Adsorption 10 (2004) 79–86.
36. Okolo, B., Park, B. C., Keane, M. A., Interaction of phenol and chlorophenols with activated carbon
and synthetic zeolites in aqueous media, J. Colloid Interf. Sci. 226 (2000) 308-317.
37. Paprowiez, J. T., Activated carbons for phenols removal from wastewaters, Environ. Technol. 11(1990)
71-82.
38. Podkoscielny, P., Dabrowski, A., Marijuk, O. V., Heterogeneity of active carbons in adsorption of
phenol aqueous solutions, Appl. Surf. Sci. 205 (2003) 297–303.
39. Radovic, L. R., Moreno-Castilla, C., Rivera-Utrilla, J., Carbon Materials as adsorbents in aqueous
solutions. in: L.R. Radovic (Ed.), Vol. 27, Chem. Phys. Carbon, Marcel Dekker, NewYork (2001) 227-
405.
40. Reddad, Z., Gerente, C., Andres, Y., Cloirec, P. L., Adsorption of several metal ions onto a low-cost
biosorbent: kinetic and equilibrium studies, Environ. Sci. Technol. 36 (2002) 2067- 2073.
41. Reichenberg, D., Properties of ion-exchange resin in relation to their structure III. Kinetics of
exchange, J. Am. Chem. Soc. 75 (1953) 589–597.
42. Rengaraj, S., Arabindoo, B., Murugesan, V., Sorption characteristics of parachlorophenol on activated
palm seed coat carbon, Indian J. Environ. Health 41, (1999) 16-23.
43. Rengaraj, S., Seug-Hyeon, M., Sivabalan, R., Arabindoo, B., Murugesan, V., Agricultural solid waste
for the removal of organics: adsorption of phenol from water and wastewater by palm seed coat
activated carbon, Waste Manage. 22 (2002) 543–548.
44. Shang, N. C., Yu, Y. H., Ma, H. W., Variation of toxicity during the ozonation of monochlorohenolic
solutions, J. Environ. Sci. Health A37 (2002) 261-271.
45. Singh, K. P., Malik, A., Sinha, S., Ojha, P., Liquid-phase adsorption of phenols using activated carbons
derived from agricultural waste material, J. Hazard. Mater. 150 (2008) 626-641.
46. Snoeyink, V. L., McCreary, J. J., Murin, C. J., Carbon adsorption of traces organic compounds,
Municipal Research Laboratory, USPEA, Cincinnati, Ohio, (1997).
47. Srivastava, S. K., Gupta, V. K., Johari, N., Mohan, D., Removal of 2, 4. 6-trinitrophenol using Bagasse
fly ash-a sugar industry waste material, Indian J. Chem. Techn. 2(1995) 333-336.

South African Journal of Chemical Engineering, vol. 19, 2014, no. 1, pp 1-21 21
48. Stockinger, H., Heinzle, E., Kut, O. M., Wastewater pollutants by ozonation and biotreatment, Environ.
Sci. Technol. 29 (1995) 2016–2022.
49. Streat, M., Patrick, J. W., Perez, M. J. C., Sorption of phenol and parachlorophenol from water using
conventional and novel activated carbons, Water Res. 29 (1995) 467-472.
50. Tahar, N. B., Savall, A., Electrochemical degradation of phenol in aqueous solution on bismuth doped
lead dioxide: A comparison of the activities of various electrode formulations, J. Appl. Electrochem. 29
(1999) 277–283.
51. Terzyk, P., Further insights into the role of carbon surface functionalities in the mechanism of phenol
adsorption, J. Colloid Interf. Sci. 268 (2003) 301–329.
52. Tseng, R. L., Wu, F. C., Juang, R. S., Liquid-phase adsorption of dyes and phenols using pinewood-
based activated carbons, Carbon 41 (2003) 487-495.
53. Tutem, E., Apak, R., Unal, G. F., Adsorptive removal of chlorophenols from water by bituminous
shale, Water Res. 32 (1998) 2315–2324.
54. Vinod, V. P., Anirudhan, T. S., Effect of experimental variables on phenol adsorption on activated
carbon prepared from coconut husk by single-step steam pyrolysis: Mass transfer process and
equilibrium studies, J. Sci. Ind. Res. 61 (2002) 128–138.
55. Wang, J. P., Feng, H. M., Qing-Yu, H., Analysis of adsorption characteristics of 2, 4- dichlorophenol
from aqueous solutions by activated carbon fiber, J. Hazard. Mater. 144 (2007) 200-207