Embed Size (px)
Citation preview
Munich Personal RePEc Archive
Modification of the LCOE model to
estimate a cost of heat and power
generation for Russia
Bratanova, Alexandra and Robinson, Jacqueline and
Wagner, Liam
School of Economics, University of Queensland, School of
Economics, University of Queensland, Economics, Griffith Business
School, Griffith University
1 August 2015
Online at https://mpra.ub.uni-muenchen.de/65925/
MPRA Paper No. 65925, posted 05 Aug 2015 17:22 UTC

1
Modification of the LCOE model to estimate a cost of heat and power generation for Russia
Alexandra Bratanova a,c
, Jacqueline Robinson a and Liam Wagner
b
a School of Economics, University of Queensland, St Lucia, Queensland, 4067, Australia
b Economics, Griffith Business School, Griffith University, 170 Kessels Road, Nathan, Queensland, 4111, Australia
c Corresponding author: email – [email protected]
July 2015
Abstract
The Russian heat sector faces crucial problems including underinvestment, below cost
pricing, generation capacity and infrastructure depletion. While the Russian electricity
sector has gradually progressed through liberalization, the heat sector is still waiting for
similar reforms to occur. The modernisation of the sector requires analysis of energy
generation costs to suggest feasible technological solutions and secure an increase of
investment in the industry. This study presents a modification of a levelised cost of
energy (LCOE) model with cost separation coefficients based on Ginter triangles. The
modified LCOE model is applied to a regional case study (Moscow, Russia) providing a
comparison of generation technology according to cost estimates for electricity and heat
under regionally specific economic and technological conditions. We consider five
combined heat and power (CHP) generation technology types for two natural gas price
scenarios. The modelling outcomes demonstrate cost competitiveness of gas based CHP
technology and provide valuable information to assist decision making for the
management of the energy sector in Russia.
Keywords: cogeneration, levelised cost, heat generation, Ginter triangle, Russia, Moscow
JEL Classification Codes: Q47; Q41; C52
1. Introduction
The modernization of the energy sector is one of the key factors for Russian sustainable economic growth
and national wellbeing (IEA 2014). Considerable achievements have been made in the attrition of investment
to the oil and gas industry and introduction of market mechanisms in the electricity sector (IEA 2014,
Chernenko 2015). However, heat generation systems are a crucial part of the energy system in Russia and it
remains unreformed and deteriorating (WB and IFC 2008). The reform of the national heating sector with the
introduction of a competitive market for heat is still in the proposal stage (GRF 2014). Lack of investment,
insufficient maintenance, pricing below cost and lack of government strategy in the heating sector over
previous decades has led a decrease in the reliability of the Russian heat supply system (2010).
Approximately 60% of the national heat and steam network needs replacement or major repair, including 25-
30% crucially; more than half of the pipelines have exceeded their life expectancy. Furthermore, the World
Bank has stressed that the Russian heat supply system is crucially in need of reshaping of its tariff
2
methodology, improvement of statistical data collection and sectoral coordination, provision of heat
consumption metrology, and transformation of mostly state owned producers to private entities (WB and IFC
2008). The existing tariffs are referred to as low, not covering the costs and discouraging improvements in
energy efficiency (Trubaev, Gorodecskayu et al. 2014).
At the same time, an important feature of the currently operating energy system is the application of combined
heat and power (CHP) or cogeneration technology in Russia which offers substantial potential for energy
efficiency improvement in the country (IEA and OECD 2008, IEA 2010, Bashmakov 2011).
Russia is one of the leading countries in the use of CHP generation technologies where CHP’s share of
Russian power production is above 30%, which is provided by the World’s second largest CHP installed
capacity (IEA and OECD 2008).
Generally, CHP is characterised as reliable, cost-effective technology which can make an important
contribution towards GHG reduction (IEA and OECD 2008). It is widely accepted that modern CHP plants
can reach thermal efficiency of up to 90% when thermal load is sufficient (Schröder, Kunz et al. 2013) since
reject heat is used in further generation processes (US DOE 2000, Rosen, Le et al. 2005) and that reduction
of emissions can be as high as 50% (Worley Parsons 2013). CHP is currently experiencing increasing world
wide deployment. The EU generates around 11% of electricity by means of CHP with Denmark, Finland and
the Netherlands leading countries (IEA 2011). The EU acknowledges that cogeneration is an untapped
reserve for saving primary energy in Europe (EU 2012). Although Eastern European countries, including
Russia, are characterised by higher levels of CHP penetration, the efficiency of CHP generation in this
region is a matter for discussion. Existing cogeneration plants are often referred to as redundant and low-
efficiency plants (Schröder, Kunz et al. 2013). At the same time, according to IEA, a lack of reliable
information exists on the efficiency of existing CHP plants in Russia (IEA 2010). Furthermore, Russia still
has potential for CHP expansion in light of energy demand growth (IEA and OECD 2008).
Given the importance of heat sector modernisation, energy efficiency improvement potential provided by
cogeneration and the lack of economic analysis of existing and new CHP energy generation in Russia, this
study specifically considers CHP as a generation technology for heat and electricity. The paper determines
the generation costs for heat and electricity in the CHP cycle by modifying a levelised cost of energy
(LCOE) model with cost separation coefficients. Although the LCOE is a well-established, robust and widely
applied method for electricity generation cost modelling, it is rarely used for the analysis of heat generation
within CHP. This study seeks to contribute to the discussion of the cost of heat generation in a combined cycle
and present a novel solution to this problem.
This paper also provides an application of the suggested approach to a regional case study to consider the
cost competitiveness of five different technology types. Specifically, we consider the Moscow region as a
case study. Together, Moscow and the Moscow Region account for 11.7% of national energy use of which
35% is consumed as electricity and 65% as heat (FSSS 2011). Heat supply in Moscow is met by CHP
generation (77%), and district and local heat plants (22%).

3
The remainder of this paper is presented as follows: the next section introduces our research methodology
with a modification of the LCOE. Section 3 specifies assumptions for the case study. The results of the study
and their discussion are provided in Section 4. Section 5 concludes the study.
2. Research methods
LCOE is one of various tools for economic analysis applied widely in the energy sector research. LCOE had
a demonstrated reliability and is applied as a decision support tool for international, national (Electric Power
Research Institute 2010, EIA 2011, BREE 2012, Natural Resources Canada 2013, Schröder, Kunz et al.
2013, US DOE and NREL 2013) regional and local studies (CEC 2007, CEC 2009, Klein 2009, Branker,
Pathak et al. 2011, CEC 2011). The transparency and robustness of the LCOE approach has determined its
popularity for the analysis of cost performance of energy generation options.
However, LCOE is rarely used for Russian energy sector analysis. Furthermore, although CHP shows great
potential to meet future energy needs at low cost, it is not always considered in LCOE applications (for
instance, LCOE models developed and published by the Australian Bureau of Resources and Energy
Economics (BREE 2012), the California Energy Commission (CEC) (Cost of Generation model (CEC
2009)), and the US DOE (NREL) omit cogeneration).
Limited LCOE applications for CHP analysis can be explained by a number of factors. Firstly, the
cogeneration production cycle is complex and faces lack of data availability. Secondly, LCOE models are
mostly developed to analyse the electricity generation sector focusing on determination of electricity
generation costs only. Thus, heat is frequently treated as a by-product or a source of revenue decreasing per
unit costs of electricity generation (IEA and NEA 2010, DECC 2011, DECC 2013). However, modelling of
cogeneration technology costs in comparison with other existing energy generation technology is important
for the exploration of energy generation options for Russia.
2.1 Cost of energy generation: standard approaches
The methodological basis of this study is the LCOE function adopted from Wagner and Foster (2011):
n
tt
j
n
tt
jj
j
WACC
WACC
tCapextTOC
LCOE
`1
1
)1(
SOR(t)
)1(
)()(
1.
It defines the cost of energy generation ( jLCOE ) for a technology (j) over the lifetime (n), taking into
account discounted capital costs (Capex(t)j) and operating costs (TOC(t)j) per unit of energy output (SOR(t)j).
Weighted average cost of capital is considered as a discount factor (WACC).
Due to the dual nature of the energy outputs from cogenerating plants, specific economic and accounting
approaches need to be adopted to separate the costs between the two products – heat and power. Failure to
separate costs can lead to the conclusion that CHP technologies are inefficient due to high costs. Recent
discussion in the literature regarding CHP in Russia provides a good example of the importance of the cost

4
separation (Nagornaya 2007, Bashmakov, Borisov et al. 2008, Nigmatulin 2011), suggesting that more
detailed consideration of different practices of cost accounting for CHP is necessary.
2.1.1 Physical (balance) method and heat credit
The physical or balance method of cost separation is used by the Ministry of Energy of the Russian
Federation (Nagornaya 2007) and therefore by the Russian generating companies (Mosenergo 2011).
According to this method, costs for heat production are calculated as if the heat was generated separately (for
example, by a boiler) rather than in the cogeneration cycle (Zharkov 2007).
The supporters of this method advocate that it provides transparent and accountable results, doesn’t suffer
from unnecessary assumptions, and allows for seasonal fluctuations in output levels (Rogalev 2005, KES
2014). The major disadvantage of this method is that any cost decrease due to CHP generation is accounted
for in electricity production only. The cost of heat production increases but electricity production costs
decline at CHP plants in comparison to solely electricity plants (Pokrovsky, Taraday et al. 2000, Nagornaya
2007). An example by Nagornaya (2007) shows that the average heat rate generated at thermal power plants
(CHP plants), when calculated according to the physical method, becomes equal 0.18-0.25 kgce1/kWh in
comparison to 0.32 kgce /kWh at large scale power plants, which is interpreted as an underestimation of the
electricity generation costs for CHP producers.
Moreover, the application of the physical method requires a determination of the cost of heat generation by
boilers. Review of energy generating company reports shows that no consistent data is publically available to
source the generating costs for heat generation only. This limits the applicability of the physical method of
cost separation for research and decision making.
Another approach of the same basis is the application of “heat credits”. The heat credit, also referred to as
revenue from heat generation, is defined as the value of heat sent out by the CHP plant calculated per unit of
electricity generated by the plant over its lifetime. This approach has become conventional in LCOE
applications when CHP technology is considered (IEA and NEA 2010, Mott MacDonald 2010, Schröder,
Kunz et al. 2013).
Mott MacDonald (2010) applies a similar approach when defining thermal efficiency for electricity
generation by CHP plants, targeting separation of fuel costs. This method is also referred to as “avoided gas
boiler methodology” (DECC 2011, PB 2012, DECC 2013, PB 2013). These studies suggest the concept of
incremental fuel costs to determine CHP thermal efficiency. In this case electricity is assumed to be the main
and most valuable product where incremental fuel use is defined as total fuel use by the plant less the fuel
which would be required if heat was produced separately.
Heat credits and the physical method of cost separation are transparent and widely used approaches.
However, by targeting electricity generation costs, they don’t allow for the estimation of the real cost of heat
production by CHP plants. Furthermore, an important limitation of the heat credit approach is, that the heat
credit rate is utilised as a single value for any generating plant operating in the CHP mode without
1 Kgce - kilograms of coal equivalent.
5
considering technology specific features of the generation. The objective of this study is to develop a
technique which would allow for the determination of the costs for each of the energy products. We now
explore other approaches in the literature and compare and contrast their findings with the methodology we
propose.
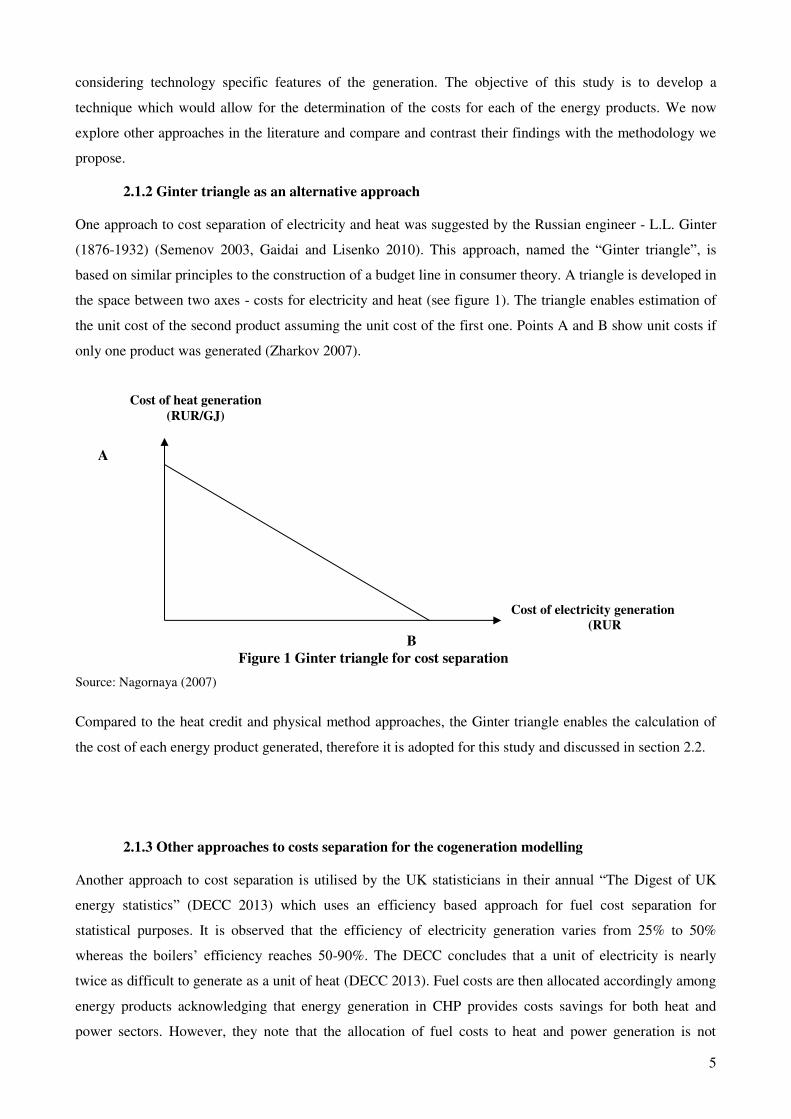
2.1.2 Ginter triangle as an alternative approach
One approach to cost separation of electricity and heat was suggested by the Russian engineer - L.L. Ginter
(1876-1932) (Semenov 2003, Gaidai and Lisenko 2010). This approach, named the “Ginter triangle”, is
based on similar principles to the construction of a budget line in consumer theory. A triangle is developed in
the space between two axes - costs for electricity and heat (see figure 1). The triangle enables estimation of
the unit cost of the second product assuming the unit cost of the first one. Points A and B show unit costs if
only one product was generated (Zharkov 2007).
Source: Nagornaya (2007)
Compared to the heat credit and physical method approaches, the Ginter triangle enables the calculation of
the cost of each energy product generated, therefore it is adopted for this study and discussed in section 2.2.
2.1.3 Other approaches to costs separation for the cogeneration modelling
Another approach to cost separation is utilised by the UK statisticians in their annual “The Digest of UK
energy statistics” (DECC 2013) which uses an efficiency based approach for fuel cost separation for
statistical purposes. It is observed that the efficiency of electricity generation varies from 25% to 50%
whereas the boilers’ efficiency reaches 50-90%. The DECC concludes that a unit of electricity is nearly
twice as difficult to generate as a unit of heat (DECC 2013). Fuel costs are then allocated accordingly among
energy products acknowledging that energy generation in CHP provides costs savings for both heat and
power sectors. However, they note that the allocation of fuel costs to heat and power generation is not
Figure 1 Ginter triangle for cost separation
A
B
Cost of heat generation
(RUR/GJ)
Cost of electricity generation
(RUR

6
determinate, but notional (DECC 2013). The same approach is recommended by some national and
international agreements and government manuals (DEFRA and DECC 2012).
Generally, it is acknowledged that cost separation using coefficients or alternative methods for splitting the
generation costs is likely to attract significant criticism. The IEA study for the projection of electricity
generation costs via the LCOE method since 1983 claimed that the cost share separation is “highly
impractical” since heat and power are genuine joint products (IEA and NEA 2010, p.40). This claim is
referred to in a number of studies to justify not attempting to separate these costs (Schröder, Kunz et al.
2013). Other approaches to cost separation are also widely discussed in the literature including a method
based on norms, exergy calculation and a proportional method (Pokrovsky, Taraday et al. 2000, Rogalev
2005). Some researchers suggest not separating costs at all as there is no agreement on the basis for the
separation, and consider the single energy product of cogeneration (Sterman, Tishin et al. 1996, Gaidai and
Lisenko 2010). Others emphasize that since there is no reliable and theoretically established approach to cost
separation based on the properties of energy output, the current separation practise is neither better nor worse
than any other, but provides at least some estimates of production costs for each generated product (Haraim
2003).
Having outlined several basic approaches to the costs allocation among energy products in CHP generation,
this study proposes the Ginter method as a useful approach for cost separation and as offering a suitable
modification to the standard LCOE model. At the same time we apply the conventional heat credit approach
to comment on the differences in the estimated modelling outcomes.
2.2 Modified LCOE: application of separation coefficients
The application of the Ginter method of costs separation requires the use of separation coefficients to allow
for separation of costs associated with combined generation. The LCOE function is transformed to calculate
the LCOE for a unit of electricity ( E
jLCOE , equation 2) and a unit of heat ( H
jLCOE equation 3).
n
tt
E
j
n
tt
E
j
E
j
E
j
WACC
WACC
tCapextTOC
LCOE
`1
1
)1(
SOR(t)
)1(
)()(
2.
n
tt
H
j
n
tt
H
j
H
j
H
j
WACC
WACC
tCapextTOC
LCOE
1
1
)1(
SOR(t)
)1(
)()(
3.
Table 1 provides detailed parameters for the constructed model. Two sets of separation coefficients are used:
H
j
E
j cc , - separation coefficients for capital costs;
H
j
E
j kk , - separation coefficient for other generating costs.

7
For the cogeneration plants the model required initial entry of single values for most cost parameters with
subsequent separation into heat and electricity generation cost components as demonstrated in table 1. Other
variables describing generating plants need to be entered separately for heat and power generating blocks of
CHP plants (e.g. plant size, capacity factor, and auxiliary energy use). The assumptions for these
parameters and the list of generation technologies are discussed in detail section 3.
This model assumes the application of growth parameters separately for revenue flow ( R(t)I ) and cost flow
( С(t)I ). The original LCOE model (Wagner and Foster 2011) applies CPI with cost and revenue pass
through rates to reflect the growth parameter and ensure that the developed model acknowledges the fact that
revenue and costs for generating companies are anticipated to increase at different rates. This research
follows this approach and introduces R(t)I and С(t)I parameters.
The determination of the separation coefficients for the cost components is complex due to the physical
properties of simultaneous production. We apply risk analysis using a Monte Carlo simulation to determine
cost ranges for energy products as further discussed in section 3.3. The next section details the heat credit
approach to be used in the LCOE model for comparative purposes.

8
Table 1 Modified LCOE model components
Parameter Electricity generation Heat generation
Costs
Fixed operating and maintenance
E
jj
E
j ktFOMtFOM )()(
C
E
j
E
j tItFOMtFOM )()()1(
H
jj
H
j ktFOMtFOM )()(
C
H
j
H
j tItFOMtFOM )()()1(
Variable operating and
maintenance
E
jj
E
j ktVOCtVOC )()(
C
E
j
E
j
E
j tItSOtVOCtVOM )()()()1(
H
jj
H
j ktVOCtVOC )()(
C
H
j
H
j
H
j tItSOtVOCtVOM )()()()1(
Fuel C
E
j
j
E
j
E
jjE
j tItSOtFCCFkHR
tFuel )()(1000
)(**)*()(
C
H
j
j
H
j
H
jjH
j tItSOtFCCFkHR
tFuel )()(1000
)(**)*()(
Total
E
j
E
j
E
j
E
j
E
j (t)CM(t)VOM(t)FOM(t)FuelTOC(t) E
j
E
j
E
j
E
j
E
j tCMtVOMtFOMtFueltTOC )()()()()(
Capital j
E
j
E
j tCapexctCapex )(*)( j
H
j
H
j tCapexctCapex )(*)(
Technology depletion j
C
E
j
E
jE
jlife
tItCapexCFtCM
)()()(
j
C
H
j
H
jH
jlife
tItCapexCFtCM
)()()(
Output and revenue
Energy produced (per annum)
Auxilary energy use 1000
)Aux(18670CFsizeSO(t)
E
j
E
j
E
jE
j
E
jAux
1000
)Aux(18670CFsizeSO(t)
H
j
H
j
H
jH
j
H
jAux
Revenue flow from energy
production R
E
j
E
j I(t)SO(t)SOR(t) R
H
j
H
j I(t)SO(t)SOR(t)
Capacity factor E
jCF
H
jCF
9
2.3 Heat credit approach: incorporation into the LCOE model
To apply the heat credit approach in the LCOE model, the heat credit in functional form is defined as
follows:
E
j
H
j
j
HCRtHC
SO(t)
SO(t)*)( , where 4.
jtHC )( - heat credit for technology j in year t (per MWh of electricity generated);
HCR - heat credit rate;
H
jSO(t) - sent out heat (MWh) by the plant of technology j in year t;
E
jSO(t) - sent out electricity (MWh) by the plant of technology j in year t
Heat credits are therefore expected to reflect the value of heat generated in the CHP cycle. The
electricity generating cost is therefore defined as the difference between total energy production costs
and the value of heat produced:
H
jjj
E
j tHCtTOCtTOC SO(t)*)()()( , where 5.
E
jtTOC )( - total cost of electricity generation in period t by technology j;
jtTOC )( - total generation costs of generation by the technology j in period t.
Following the standard LCOE approach described in section 2.1, the heat credit can be “levelised”:
n
tt
E
j
n
tt
H
j
j
WACC
WACC
tSOHCR
LHC
`1
1
)1(
SOR(t)
)1(
)(*
, where 6.
E
j
H
j SOR(t),SOR(t) - sent out heat and electricity respectively.
The function (equation 6) provides an estimate of a levelised heat credit (jLHC ) as the value of heat
credit per unit of electricity produced over the plant life expressed in RUR per MWh.
The described heat credit approach provides a transparent way of cost separation for cogeneration.
However, it raises the question of how to calculate the value of the heat credit rate (HCR). Values
assumed for heat credits vary in the economic literature. For example, DIW Berlin provides a review
of studies showing that values of 33-37 EUR per MWh of thermal energy (heat) generated are often
used (Schröder, Kunz et al. 2013). They also specify values for coal based technologies (42-51

10
EUR/MWh of heat); natural gas based technologies (9-32 EUR/MWh of heat) and biogas
technologies (13.5 EUR/MWh of heat) (Schröder, Kunz et al. 2013).
The IEA suggests an estimate of 45 USD/MWh of heat credit for OECD countries (2010) and 25.8
USD per MWh of heat for generating plants in Russia. This value is estimated as a forecasted heat
tariff for Russia for the period after 2015. It results in approximately 859.1 RUR/MWh of heat. This
value is applied in this study for the Russian regional case study. The next section outlines
technological and financial assumptions for the modified LCOE model for the case study.
3. Technological and financial parameters of the model
3.1 Technological assumptions
The CHP technology types considered in this case study are selected given the data available at the
time of research. Specifically CHP generation is modelled for pulverized black coal combustion
(PCC); large and small natural gas combined cycle gas turbine (CCGT) and large and small
conventional gas turbine plants.
Technological assumptions are summarised in the table 2 and discussed below.
Table 2 Technological and costs assumptions for the LCOE model
Technology
Installed capacity,
MW Capital costs
Thermal
efficiency Capacity factor,%
Electricity Heat RUR/kW % Electricity Heat
Black Coal PCC 103 229 93,020 56.7 63 44
Gas CCGT Large 415 437 48,060 77 63 44
Gas CCGT Small 44 46 64,957 77 63 44
Gas Turbine Large 101 184 42,827 71 63 44
Gas Turbine Small 24 44 53,825 71 63 44
Technology Construction profile Lifetime of
plants, years
O&M
costs
Capex
main.rate Auxiliary use, %
% Electricity Heat
Black Coal PCC Years 1 to 4 - 25% each 40 431.6 0.16 92 100
Gas CCGT Large
Year 1 – 50%; Year 2 –
50%
30 293.3 0.21 97 100
Gas CCGT Small 30 396.6 0.21 97 100
Gas Turbine Large 30 261.6 0.21 97 100
Gas Turbine Small 30 328.6 0.21 97 100
Source: (Klein 2009, CEC 2010, IEA and NEA 2010, Wagner and Foster 2011, BREE 2012)
The majority of assumptions have been adopted from the IEA/NEA study in their estimates for the
Russian energy system (IEA and NEA 2010), which are based on submissions from the regional
generating companies. The values are adjusted for this study via conversion to 2010 RUR using the
IEA exchange rate of 24.85 RUR/USD with an inflation rate of 1.34 sourced from national statistics
(FSSS 2011). The construction profile assumptions are sourced from international studies (Klein
2009, CEC 2010, IEA and NEA 2010, BREE 2012), capex maintenance rates are sourced from the
study by Wagner and Foster (2011).
11
Separate installed capacity values for each energy product are assumed as required by the model
(table 1). The proportion of installed capacity for electricity and heat generation within existing
regional CHP plants varies substantially depending on the technology used, period of plant
construction and plant technological features (Mosenergo 2000).
Current European legislation recommends ratios of heat and power generation for modern CHP plants
referred to as “quality CHP” (EU 2004). The standard power-to-heat ratio for CHP generation is
defined as a ratio of electricity from cogeneration to useful heat when operating in full cogeneration
mode. The EU power to heat ratios are applied in this research as the indicative basis for
determination of the installed heat capacity (table 2). It is acknowledged, however, that the EU
directives apply the ratio to the energy output rather than capacity.
CHP technology is well established and has been in use for over 100 years (Rosen, Le et al. 2005),
therefore no capital cost depletion due to technology learning was allowed for in the model.
Given that the data source (IEA and NEA 2010) doesn’t provide separate estimates for fixed (FOM)
and variable (VOM) operating and maintenance costs, the former is included in the latter and
presented in the model as a single parameter (O&M costs).
3.2 Financial assumptions
We have applied a weighted average cost of capital (WACC) to account for the opportunity cost of
capital and to allow for discounting in the model. An estimate of 13.92% for the post tax nominal rate
for WACC has been applied in this study as developed for the current regional and national financial
parameters (Bratanova, Robinson et al. 2012c). This corresponds to the discount factor of 14%
recommended by the electricity market operator to be used for capacity trading contracts (NP Market
Council 2011).
Fuel cost is one of the major components of unit generation cost for CHP generators. Natural gas
prices remain regulated in Russia and are reported to be substantially lower for domestic consumers as
compared to export prices (Orlov 2015). As demonstrated by Paltsev (2014), in 2009-2013 domestic
consumers paid approximately 30% of the price charged to European consumers for natural gas.
However, international studies for Russia project that the domestic prices will reach parity with
Russian export prices for the netback EU (IEA and NEA 2010). The latter can be treated as a shadow
price of natural gas given Russia’s high involvement in the international trade of natural gas.
Consequently, this study considers two gas price scenarios:
- Scenario 1: domestic price of natural gas of 85 RUR/GJ;
- Scenario 2: a price of 195 RUR/GJ reflecting the price for neighbouring countries.
For coal based generators a price of 81.2 RUR/GJ (in 2010 values) is assumed as sourced from the
national statistics (FSSS 2011).
12
3.3 Simulation approach to the determination of separation coefficients
Application of Monte Carlo simulation allows us to derive possible combinations of separation
coefficients for capex and O&M costs and to build probability distribution functions for LCOE
estimates. ExcelSim, an add-in for MS Excel, is utilized for the separation coefficient determination in
the risk analysis framework. This approach is based on the assumption that there are multiple bases
for cost separation in the CHP cycle of energy generation (as discussed in section 2.1). However, it
can also be assumed that the separation coefficients for capex and O&M costs vary within a 10% -
90% range of the total generation costs. This assumption is based on the expectation that a CHP plant
always bears costs associated with the generation of both energy products. For instance, even when a
plant operates in the electricity generation only mode, it is required to maintain and service heat
generating facilities and equipment which results in associated O&M costs. A triangular distribution
for the estimation of the separation coefficients is used to undertake the simulation and construct
probability distributions for heat and electricity LCOE estimates.
Having outlined the assumptions of the study, the next section presents the results of the modeling for
each of the two scenarios and for electricity and heat.
4. Results and discussion. Limitations
4.1 LCOE estimation for Scenario 1
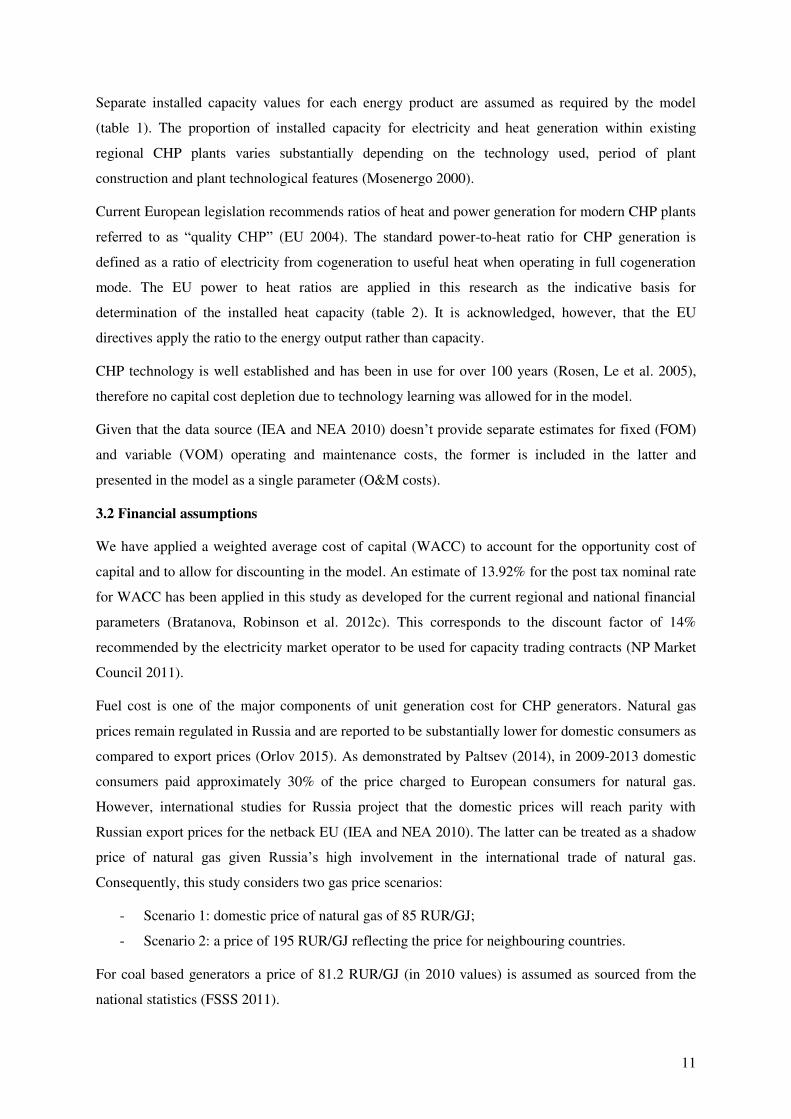
4.1.1 Electricity generation
The Monte Carlo simulation2 enables us to determine ranges for the unit electricity generation costs
for each technology under consideration. The estimated values for approximately 50%, 90% and 95%
percentile points for the obtained probability distributions of electricity generation costs are
summarized in table 3.
Table 3 Electricity generation cost estimates for CHP (Scenario 1)
Probability
level
LCOE, RUR/MWh
Black Coal
PCC CCGT Large CCGT Small
Gas Turbine
Large
Gas Turbine
Small
50% 1492 893 1121 856 1004
90% 1980 1194 1476 1116 1304
95% 2103 1247 1564 1181 1383
Source: LCOE results
2 The simulation is run with the following parameters: triangular distribution, with 0.1 and 0.9 as left and right
thresholds, 0.5 as a mode; number of iterations, 5000.

13
Analysis reveals that the unit electricity generation cost for black coal PCC plants has a 95%
probability of falling below 2103 RUR/MWh. At the same time, the LCOE for electricity generation
by the CCGT plant of a large size is estimated to be 1247 RUR/MWh, which is approximately 25%
lower than the value obtained for the small generator with the same technology (1564 RUR/MWh).
The large sized gas turbine generation provides the best estimate for the unit electricity generation
costs, 1181 RUR/MWh (with a 95% probability).
4.1.2 Heat generation
Heat generation costs obtained from the modified LCOE model are summarized in table 4. Large gas
turbine plants show the best performance of unit generation cost estimates for heat. Specifically, there
is a 95% probability that the unit generation cost for a large gas turbine is 1376 RUR/MWh of heat,
which is ~19% lower than for the small gas turbine (1641 RUR/MWh of heat). CCGT shows unit
generation costs of 1874 RUR/MWh of heat and 1448 RUR/MWh of heat for small and large plants
respectively.
The modelling demonstrates that there is a 95% probability that unit heat generation costs are under
2337 RUR/MWh for black coal based generators.
Table 4 Heat generation costs estimates for CHP (Scenario 1)
Probability
level
LCOE, RUR/MWh
Black Coal PCC CCGT Large CCGT Small Gas Turbine
Large
Gas Turbine
Small
50% 1685 1068 1333 993 1165
90% 2207 1368 1766 1275 1540
95% 2337 1448 1874 1376 1641
Source: LCOE results
4.2 Estimation for Scenario 2
4.2.1 Electricity generation
The cost estimates for electricity generation in Scenario 2 are presented in table 5. Given the higher
price for natural gas, electricity generation costs for the gas-based technology show an expected
increase in the second Scenario when compared to Scenario one. The opportunity cost of natural gas
and the associated increase in price by approximately 129% resulted in the electricity generation cost
increasing by 31% (CCGT small) to 44% (gas turbine large) for the natural gas based technology
types for CHP (see figure 2). However, the unit generation costs of electricity for all gas based
technology types remain lower than cost estimates for black coal PCC (table 5). This observation is
interesting as it demonstrates that the gas fueled CHP is substantially outperforming coal fueled CHP,

14
such that even a gas price increase doesn’t affect their relative ranking on the unit generation cost
scale.
Table 5 Electricity generation costs estimates for CHP (Scenario 2)
Probability
level
LCOE, RUR/MWh
CCGT Large CCGT Small Gas Turbine Large Gas Turbine Small
50% 1247 1475 1225 1377
90% 1634 1929 1603 1809
95% 1738 2043 1697 1917
Source: LCOE results
Figure 2 Electricity generation cost for CHP technology: scenarios comparison
Source: LCOE results
4.2.2 Heat generation
The LCOE estimates for heat in Scenario 2 are provided in table 6. Analysis shows that the best
performance is demonstrated by large gas turbine technology (1886 RUR/MWh of heat at 95%
probability), followed by large CCGT (1927 RUR/MWh of heat). The highest cost estimate for
natural gas based plants is obtained for small CCGT. However, all natural gas based technologies
show better cost parameters than the black coal PCC (2364 RUR/MWh of heat).
Table 6 Heat generation costs estimates for CHP (Scenario 2)
Probability
level
LCOE, RUR/MWh
CCGT Large CCGT Small Gas Turbine Large Gas Turbine Small
50% 1389 1657 1365 1522
90% 1814 2151 1756 2016

15
95% 1927 2282 1886 2139
Source: LCOE results
The LCOE for heat in the second Scenario exceeds the values in the first Scenario by 22% (CCGT
small) to 37% (small gas turbine), as illustrated in figure 3. This difference between the scenarios is
lower than the same parameter observed for electricity generation (31-44%, figure 2). Based on a
129% increase in the fuel price between the scenarios, this difference in heat generation LCOE is
moderate. Therefore heat generation costs are shown to be less sensitive to the fuel price.
Figure 3 Heat generation costs for CHP: scenarios comparison
Source: LCOE modelling results
Having outlined and discussed the results of the application of the modified LCOE, it is necessary to
compare these results to those from the widely used heat credit approach. This is undertaken in the
next section.
4.3 Heat credit approach
The heat credit values, based on the assumed plants’ technological parameters and the heat credit rate
for the Moscow regional case study, are provided in table 7. The total LCOE is calculated when all
generation costs are accounted for. The parameter “LCOE for electricity” is therefore determined as
the difference between total LCOE and the heat credit for each technology.
The obtained heat credit values are observed to be lower than the LCOE estimates for heat, obtained
earlier using the separation coefficients facilitated by a Monte Carlo simulation. This observation
holds for all the considered technology types and for 50%, 90% and 95% probability levels. This
raises a discussion about the feasibility and reliability of the obtained modified LCOE estimates when

16
compared to the heat credit value used in international studies. This discussion can be facilitated with
Ginter triangles.
Table 7 Heat credit estimates for CHP
Technology
Heat credit,
RUR/MWh
Scenario 1 Scenario 2
LCOE total LCOE of
electricity LCOE total
LCOE of
electricity
Black Coal PCC 1451 2982 1531 2982 1531
Gas CCGT Large 653 1793 1140 2468 1815
Gas CCGT Small 653 2240 1587 2915 2262
Gas Turbine Large 1127 1699 572 2431 1304
Gas Turbine Small 1127 1990 863 2722 1594
Source: LCOE results
4.4 Ginter triangles: comparison of the outcomes
Ginter triangles are constructed for both electricity and heat (figures 4–8) with the estimates
demonstrated in table 8, (the key points’ description is summarized in table 9).
Table 8 LCOE parameters for construction of Ginter triangles
Technology type
Scenario 1 Scenario 2
Electricity axis Heat axis Electricity axis Heat axis
Black Coal PCC 2982 3343 2982 3343
Gas CCGT Large 1793 2098 2468 2752
Gas CCGT Small 2240 2657 2915 3312
Gas Turbine Large 1699 1967 2431 2677
Gas Turbine Small 1990 2331 2722 3041
Source: LCOE results
Different slopes or substitution rates are observed for different technology types as determined by the
specific characteristics of the CHP technology. To avoid double counting, as both electricity and heat
unit generation cost estimates are mapped simultaneously, 50% probability levels were applied for the
construction of points E and F.
Table 9 Key points for the constructed Ginter triangles
Point Interpretation
C estimates with application of heat credit approach Scenario 1
D Scenario 2
E estimates utilizing modified LCOE Scenario 1
F Scenario 2
Source: LCOE modelling results

17
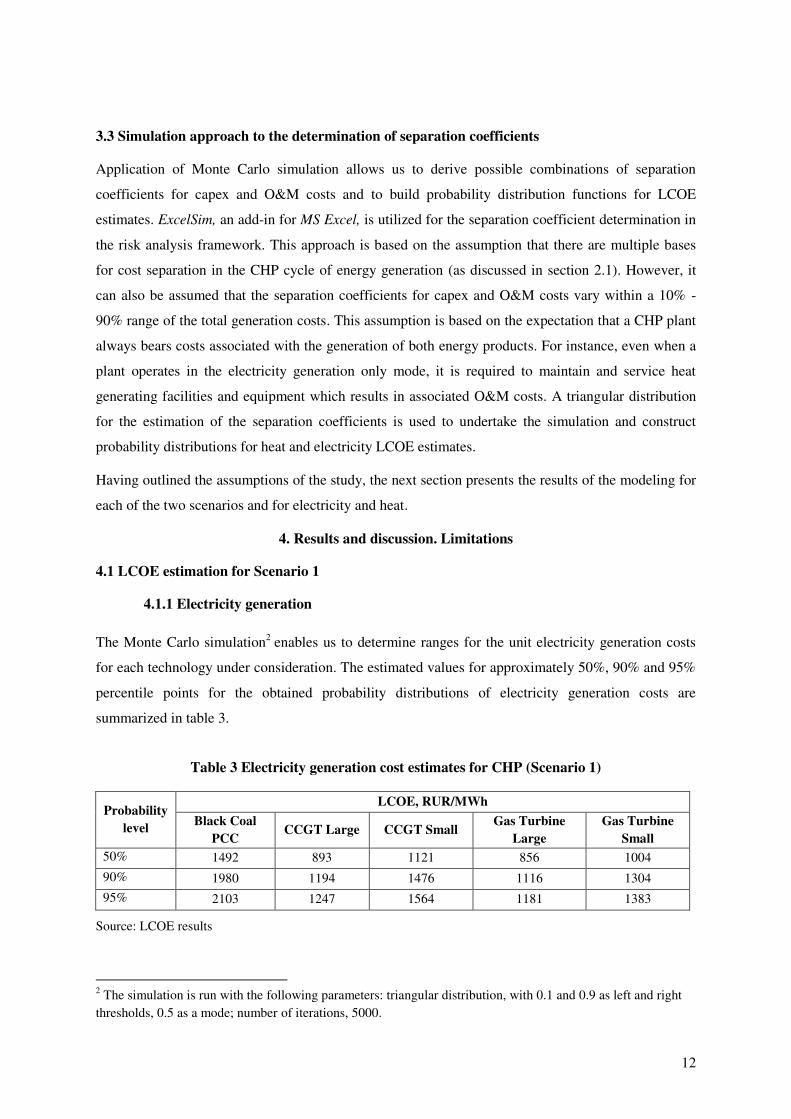
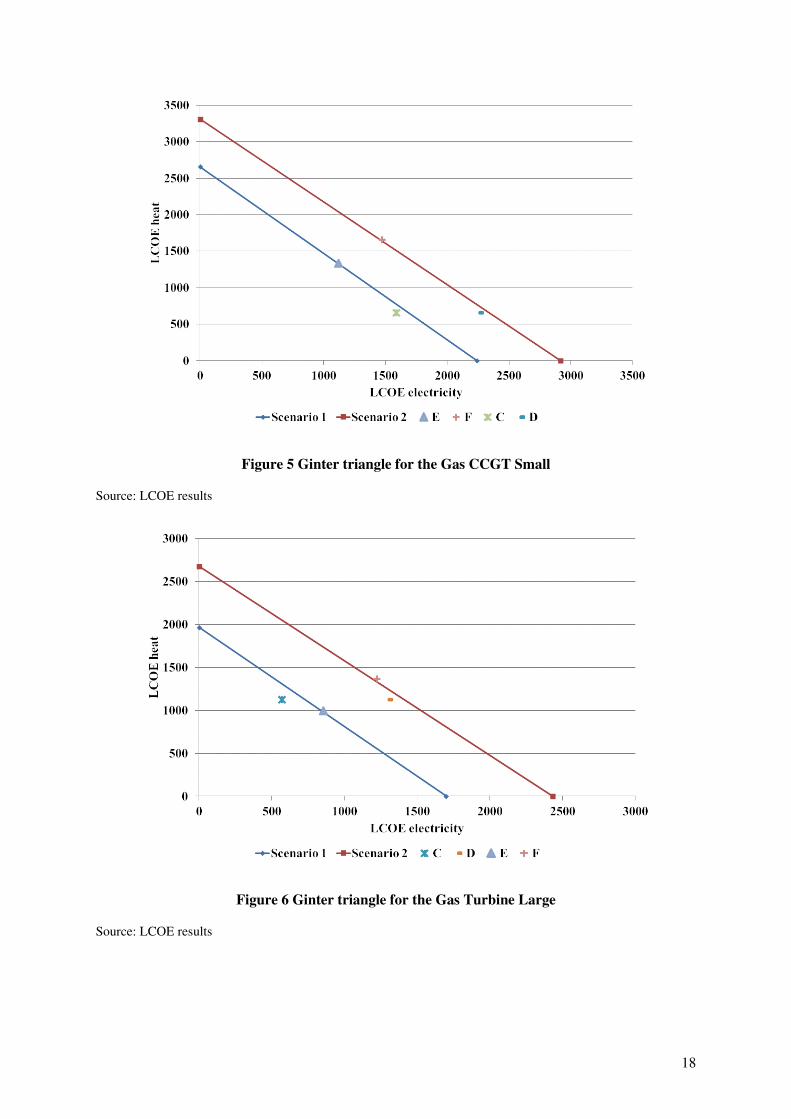
Ginter triangles for CCGT of large and small sizes (figures 4, 5) demonstrate that heat credit based
LCOE estimates (points C, D) lean toward electricity generation resulting in substantially higher
electricity unit generation costs as compared to heat. The same results, but with a smaller magnitude,
are demonstrated for gas turbine-based technology for Scenario 2 (figures 6, 7).
Figure 4 Ginter triangle for the Gas CCGT Large
Source: LCOE results
18
Figure 5 Ginter triangle for the Gas CCGT Small
Source: LCOE results
Figure 6 Ginter triangle for the Gas Turbine Large
Source: LCOE results
19
Figure 7 Ginter triangle for the Gas Turbine Small
Source: LCOE results
Figure 8 provides Ginter triangles for a black coal PCC generator. The two triangles coincide as the
change in natural gas price for each scenario does not affect cost estimates for black coal fired
generators. Importantly, the heat credit approach provides cost estimates (points C,D) close in value to
the separation coefficients approach (points E, F).
It can be observed that LCOE estimates from the heat credit approach lie under the edge of the Ginter
triangles. This can be interpreted as resulting from one of the following:
- application of heat credit values based on the assumed heat credit rate results in
underestimation of total energy generation costs;
- application of 50% probability level for the LCOE estimation with Monte Carlo simulation
results in overestimation of total generation costs.

20
Figure 8 Ginter triangle for Black Coal PCC
Source: LCOE modelling results
The analysis of Ginter triangles with mapped LCOE estimates, obtained using different approaches,
demonstrates the difference between estimates for some technology types and closeness for others.
Although it cannot be concluded with certainty that one approach provides better estimates than the
other, two principal advantages of the developed separation coefficient approach, developed in this
study, have been demonstrated by the case study application.
- Although heat credit is a transparent approach for the electricity generation cost determination
for CHP technologies, it doesn’t allow us to draw conclusions on the generating costs for heat as a
separate energy product. The heat credit rate value is also questionable. In contrast, the modified
LCOE with the separation coefficients provides estimates based on generation costs for heat (rather
than potential revenue from heat generation). As a result, obtained values can be considered as
estimates of the LCOE for heat.
- The separation coefficients approach provides an adjustable tool for LCOE estimation and
associated decision making. As compared to the heat credit approach, it allows us to reflect
technology specific features in the cost estimates. Various sets of separation coefficients can be
developed and applied. The set of separation coefficients adopted in this study is only one example
utilizing this property of the modified LCOE model.
To further analyse the obtained results they need to be discussed in comparison with the findings of
previous studies. This is provided in the next section.

21
4.5 Cost modelling outcomes in comparison with previous studies
A comparison of the obtained results with estimates sourced from a previous study (Bratanova, 2014)
demonstrates that the LCOE for electricity for CHP generators is below estimates for the power only
generators obtained previously across the technology types for Moscow regional conditions. CHP
LCOE cost estimates for electricity substantially outperform generating costs for existing
conventional generators in Scenario 1. More specifically, electricity generation cost estimates are two
fold less for both small and large gas turbine CHP (1383 RUR/MWh and 1181 RUR/MWh) when
compared to conventional gas fueled generators of small and large sizes (2791 RUR/MWh and 2473
RUR/MWh).
For Scenario 2 the CHP large gas turbine and large CCGT technology provide better cost performance
than any other electricity generators including biomass which was shown to be a leader in the
technology ranking in the Bratanova (2014) study (1918 RUR/MWh).
Overall, the applied separation coefficient approach within the modified LCOE model allows us to
obtain comparable parameters for electricity generation costs for different technology types.
Generally, CHP generators provide better LCOE estimates than electricity only generators. This
suggests that CHP generators are cost-effective.
The obtained results from the modified LCOE model also need to be compared with international
studies before recommendations can be made on the applicability and potential usefulness of the
modified LCOE model for decision making in Russia. For this purpose the IEA study is considered
(IEA and NEA 2010) with the estimates provided for power generation technologies in Russia
(table 10).
Table 10 Comparison of the results with estimates from the international studies
Technology type IEA study estimates (10%
discount rate), RUR/MWh
Modified LCOE results (50%
probability level), RUR/MWh
Black Coal PCC 1128 1515
Gas CCGT Large 1416 1247
Gas CCGT Small 1807 1475
Gas Turbine Large 1271 1225
Gas Turbine Small 1573 1377
Source: LCOE results, IEA study (2010)
The obtained LCOE estimates for CHP technology appear close to the estimates from the IEA study.
The difference vary across the technology types from 4% (large gas turbine) to 26% (black coal PCC).
The nature of this difference can be attributed to the different cost separation approaches applied as
well as to the different financial assumptions used. However, the closeness of the estimates provides

22
an argument to conclude that the LCOE modelling results obtained in this research are credible, and
so too are the developed modifications to the standard LCOE model.
Having discussed the results of the LCOE modelling, it is important to acknowledge the limitations of
the model construction, datasets and, consequently, research findings. The limitations of this study are
associated with the limited data availability and uncertainty of the assumed parameters. Some cost
variables were not available at the time of this research, including energy transportation costs (fuel
transportation and transmission) and social and environmental costs. Improvement in the consistency
and completeness of the data for the energy sector would imply more reliable, applicable and
transparent results. Incorporation of environmental costs would improve the modelling results in the
future research (Orlov, Grethe et al. 2013)
Heat consumption and associated generation is seasonal with no generation outside non-heating
periods as compared to continuous electricity generation. The developed model doesn’t allow for the
incorporation of seasonality into the analysis. This limits the analysis, but could be overcome in future
development of the modelling tool.
The selected technology types are defined only in general terms due to data limitations. Determination
of specific parameters for the generating plants is therefore subject to the priorities and policies of the
decision maker.
The method adopted in this paper for generating cost separation has an important limitation: it doesn’t
account for different values for the energy output (Mott MacDonald 2010). Specifically, it doesn’t
take into consideration that electricity is the most valuable energy output, it also ignores the fact that
heat of different quality is characterised by different output temperature and pressure and has as a
consequence has different values.
It is important to acknowledge, that interpretation of the obtained numerical estimates should be made
with caution and with reference to the specific assumptions. This is applicable to the modified LCOE
model as much as to any economic model which simplifies market and industry details and
mechanisms (Paltsev 2014). Given the limitations of this study, interpretation of the results should be
undertaken with care.
5. Conclusions and policy implications
This study suggests a modification to the LCOE model using separation coefficients and Monte Carlo
simulation to determine cost of heat and electricity generation in the cycle of CHP generation.
Overall, the developed LCOE model for the Moscow region in this context has demonstrated its
capability to provide estimates and to provide a foundation for the selection of best performing
generation technology types on the basis of generation cost.

23
The analysis of CHP generation for the Russian regional case study with the modified LCOE model
leads to a number of important conclusions.
- Natural gas based CHP generators demonstrate better cost performance then black coal based
technology across the considered scenarios and for electricity as well as heat generation. It
implies that natural gas based CHP plants, and specifically those utilising gas turbines,
provide robust low cost generation and could attract investment in the industry.
- A comparison of LCOE estimates for CHP electricity generation with estimates obtained for
electricity-only generators in previous studies demonstrates better cost performance of CHP
generation across the generation technology types. It suggests cost effectiveness of the CHP
generation for Russian regions.
The obtained results form the basis of a recommendation to the regional government for further
development of CHP as an energy alternative providing the most cost effective technology for energy
generation among the considered technologies. This conclusion is supported by the scenario analysis
outcomes. Even with nearly double natural gas prices (the second scenario), CHP gas-based plants
maintained the leading position in the technology ranking for electricity generation.
Importantly, the suggested modified LCOE approach is capable of estimating not only generation cost
parameters, but might be useful also to produce forecasts for the wholesale market. For the Moscow
case study, this is especially important. A movement toward market based pricing in the wholesale
electricity market hasn’t resolved the issues with tariff determination, heat tariff system is also
awaiting the proposed reforms. The modified LCOE, therefore, can provide a solution for the
determination of tariffs based on economic efficiency, as well as for the strategic planning of energy
sector development at regional and national levels.
At the same time the study demonstrates reliability and transparency of the methodological solution
which ensures applicability of the modified LCOE to a wider range of cases including energy related
projects in regions across Russia and for different technology and timeframes. Although regional
specification of the assumed variables in the model implies that the obtained numerical estimates are
only valid for the described regionally and technologically specific circumstances, the presented
Moscow case study provides useful guidance for the implementation of decision support tools in other
regions.
Generally, the application of different approaches to the separation of the heat and power generating
costs within CHP plants remains a question for discussion. Several major approaches tested in the
LCOE application identified important differences in the obtained estimates. Although neither
approach can claim to be unambiguously preferred, the study has demonstrated the applicability of the
developed separation coefficients approach based on Ginter triangles for the analysis of CHP
generation costs. The modified LCOE model appeared more flexible for incorporation of technology

24
specific features as compared to the widely used heat credit approach. However, determination of the
basis for separation coefficients or a point along the Ginter triangle hypotenuse is a subject for future
research.
Overall, the security of supply, infrastructure development, competitiveness and energy efficiency
improvement in Russia requires public and private investment in all sectors of the energy system as
well as well-developed public management and regulatory systems. The modified LCOE provides one
of a range of possible methodological solutions to support decision making for energy sector
management in Russia, which considers heat as a separate and valuable product of cogeneration.
Reforming the heating sector in Russia will require price liberalisation and a gradual shift to market
based pricing. The cost competitiveness of the generators will then play a crucial role in the
determination of the market structure and investment decisions of market participants. However, a
comprehensive policy will also be required to insure attrition of investment in the industry, the
integration with energy efficiency policy and effective transformation of the national and regional
energy systems.
References
Bashmakov, I. (2011). Russia on the Energy Efficiency Trajectory. Moscow, Centre for Energy
Efficiency (CENEf).
Bashmakov, I., K. Borisov, M. Dzedzichek, I. Gritsevich and A. Lunin (2008). Resource of Energy
Efficiency in Russia: Scale, Costs and Benefits. Moscow, Center for Energy Efficiency (CENEf): 102.
Branker, K., M. J. M. Pathak and J. M. Pearce (2011). "A Review of Solar Photovoltaic Levelized Cost
of Electricity." Renewable & Sustainable Energy Reviews 15: 4470-4482.
Bratanova, A., J. Robinson and L. Wagner (2012c). Energy Cost Modelling of New Technology
Adoption for Russian Regional Power and Heat Generation. 31st USAEE/IAEE North American
Conference, Austin, Texas, USA.
BREE (2012). Australian Energy Technology Assessment. Canberra, Bureau of Resources and Energy
Economics (BREE).
CEC (2007). 2007 Integrated Energy Policy Report, CEC-100-2007-008-CMF. California, California
Energy Commission (CEC).
CEC (2009). 2009 Integrated Energy Policy Report, Final Commission Report, December 2009, CEC -
100-2009-003-CMF. California, California Energy Commission.
CEC (2010). Comparative Costs of California Central Station Electricity Generation. Final Staff Report
CEC-200-2009-07SF. California, California Energy Commission.
CEC (2011). 2011 Integrated Energy Policy Report, CEC-100-2011-001-CMF. California, California
Energy Commission.
Chernenko, N. (2015). "Market power issues in the reformed Russian electricity supply industry."
Energy Economics 50: 315-323.
DECC (2011). Review of the generation costs and deployment potential of renewable electricity
technologies in the UK. London, UK Department of Energy and Climate Change (DECC).
DECC (2013). Digest of UK Energy Statistics (DUKES). London, UK Department of Energy and Climate
Change.
DECC (2013). Electricity Generation Costs. London, UK Department of Energy and Climate Change.
DEFRA and DECC (2012). Guidelines to DEFRA / DECC’s GHG Conversion Factors for Company Reporting: Methodology Paper for Emission Factors. London, Department for Environment, Food
and Rural Affairs (DEFRA); Department of Energy and Climate Change.

25
EIA (2011). International Energy Outlook 2011. Washington, DC, US Energy Information
Administration.
Electric Power Research Institute (2010). Australian Electricity Generation Technology Costs –
Reference Case 2010. Canberra, Electric Power Research Institute, Australian Government
Department of Resources, Energy and Tourism.
EU (2004). Directive 2004/8/EC of the European Parliament and of the Council of 11 February 2004
on the promotion of cogeneration based on a useful heat demand in the internal energy market and
amending Directive 92/42/EEC.
EU (2012). Directive 2012/27/EU of the European Parliament and of the Council of 25 October 2012
on energy efficiency amending Directives 2009/125/EC and 2010/30/EU and repealing Directives
2004/8/EC and 2006/32/EC, European Parliament.
FSSS. (2011). "Central Statistical Data Base." Retrieved 14.02.2013, from
http://www.gks.ru/wps/wcm/connect/rosstat/rosstatsite/main/database/cbsd/.
Gaidai, O. A. and L. I. Lisenko (2010). "Analiz Metodov Raspredeleniya Kompleksnykh Zatrat v
Kombinirovannom Tsikle TETS." Vestnik NTU "HPI"(12.02.2012).
GRF (2014). Resolution of the Government of the Russian Federation of 15.04.2014 No 321 "On
approval of the state program of the Russian Federation "Energy efficiency and energy sector
development" (in Russian), Government of the Russian Federation.
Haraim, A. A. (2003). "Kak Rasschitat' Tarify na Elektricheskuyu i Teplovuyu Energiyu,
Proizvedennuyu na TETs, ne Pribegaya k Deleniyu Topliva?" Novosti Teplosnabgenija (Heat Supply
News) 11.
IEA (2010). CHP/DH Country Profile: Russia. Advancing Near-Term Low Carbon Technologies. T. I. C.
D. Collaborative. Paris, International Energy Agency.
IEA (2011). World Energy Model – Methodology and Assumptions 2011. Paris, International Energy
Agency.
IEA (2014). Russia 2014 -- Energy Policies Beyond IEA. Paris, International Energy Agency.
IEA and NEA (2010). Projected Costs of Generating Electricity. Paris, International Energy Agency,
Nuclear Energy Agency (NEA).
IEA and OECD (2008). Combined Heat and Power. Evaluating the benefits of greater global
investment. Paris, International Energy Agency, Organisation for Economic Co-operation and
Development.
KES (2014). Kombinirovannaya Vyrabotka: Fizicheskiy Metod Raspredeleniya Raskhodov Na Toplivo
(Combined Generation: Physical Method of Fuel Cost Division). Moscow, KES Holding.
Klein, J. (2009). Comparative Costs of California Central Station Electricity Generation Technologies,
CEC-200-2009-017-SD. California, California Energy Commission.
Mosenergo (2000). Annual Report Mosenergo 2000. Moscow, OAO "Mosenergo": 57.
Mosenergo (2011). Annual Report Mosenergo 2010. Moscow, OAO "Mosenergo".
Mott MacDonald (2010). UK Electricity Generation Costs Update. Brighton, UK, Mott MacDonald.
Nagornaya, V. N. (2007). Ekonomika Energetiki. Vladivostok, Far East State Technical University.
Natural Resources Canada (2013). Clean energy project analysis: RETScreen Engineering & Cases e-
Textbook. RETScreen International, Natural Resources Canada, Clean Energy Decision Support
Centre.
Nigmatulin, B. I. (2011). Elektroenergetika Rossii. Sostoyaniye i Problemy Razvitiya. Seminar "Actual
problems of energy provision for real sector of economy and electricity sector development"
(29.09.2011), Institute of the Problems of Natural Monopolies.
NP Market Council. (2011). "Avtomatizirovannaya Informatsionnaya Sistema «Rynki Elektroenergii I
Moshchnosti» (Automated Information System "Electricity and Capacity Markets")." Retrieved
13.08.2012, from http://www.ais.np-sr.ru/information/IASE_0V_R11_GENERATION.
Orlov, A. (2015). "An assessment of optimal gas pricing in Russia: A CGE approach." Energy
Economics 49: 492-506.

26
Orlov, A., H. Grethe and S. McDonald (2013). "Carbon taxation in Russia: Prospects for a double
dividend and improved energy efficiency." Energy Economics 37: 128-140.
Paltsev, S. (2014). "Scenarios for Russia's Natural Gas Exports to 2050." Energy Economics 42(0): 262-
270.
PB (2012). Electricity Generation Cost Model - 2012 Update of Non Renewable Technologies.
London, Parsons Brinckerhoff (PB) for Department of Energy and Climate Change.
PB (2013). Electricity generation cost model - 2013 update of nonrenewable technologies. London,
Parsons Brinckerhoff (PB) for Department of Energy and Climate Change.
Pokrovsky, L. L., A. M. Taraday and G. V. Ruslanov (2000). "Raspredeleniye Topliva pri Proizvodstve
Energii na TETs." Novosty Teplosnabgeniya (News of Heating Sector) 2.
Rogalev, N. D. (2005). Ekonomika Energetiki. Moscow, MEI Publisher.
Rosen, M. A., M. N. Le and I. Dincer (2005). "Efficiency Analysis of a Cogeneration and District Energy
System." Applied Thermal Engineering 25(1): 147-159.
Schröder, A., F. Kunz, J. Meiss, R. Mendelevitch and C. von Hirschhausen (2013). Current and
Prospective Costs of Electricity Generation until 2050. Data Documentation. Berlin, Deutsches
Institut für Wirtschaftsforschung (DIW).
Semenov, V. G. (2003). "100 Let Teplofikatsii I Tsentralizovannomu Teplosnabzheniyu V Rossii (100
Years of District Heating in Russia)." Retrieved 18.06.2012, from
http://www.rosteplo.ru/Tech_stat/stat_shablon.php?id=929.
Sterman, L. S., S. G. Tishin and A. A. Haraim (1996). "Sopostavleniye Ekonomichnosti
Teplofikatsionnykh Ustanovok, Rasschitannoy Razlichnymi Metodami " Vestnik MEI (MEI Herald) 2:
77-80.
Trubaev, P., E. Gorodecskayu, P. Tarasyuk and K. Shirrime (2014). "Energy Efficiency Analysis of
Educational Institutions within the Belgorod City (Russia)." World Applied Sciences Journal 30(8):
1024-2027.
US DOE (2000). Combined Heat and Power: a Federal Manager's Resource Guide (Final report).
Federal Energy Management Program. Washington, DC, US Department of Energy (DOE).
US DOE and NREL. (2013). "Transparent Cost Database." Retrieved 05.02.2012, from
http://en.openei.org/apps/TCDB/.
Wagner, L. and J. Foster (2011). Is There an Optimal Entry Time for Carbon Capture and Storage? A
Case Study for Australia's National Electricity Market. Energy Economics and Management Group:
Working Papers, The University of Queensland.
WB and IFC (2008). Report 46936 Energy Efficiency in Russia: Untapped Reserves. Washington, DC,
The World Bank, International Finance Corporation.
Worley Parsons (2013). Gas Turbine. Global Capacity & Experience. Brentford, Worley Parsons.
Zharkov, S. V. (2007). "Raspredeleniye Raskhoda Topliva na Otpuskayemyye ot TETs Elektroenergiyu
i Teplo." Gazoturbinnie Technologii (Gas Turbine Technologies)(11): 34-40.