Embed Size (px)
Citation preview
MODESTO EGE
Student Equity Plan
2014-2017
Modesto Junior College
Student Equity Plan
2014 - 2017
Contents
Section A. Signature Page …………………………………………………………………………… 2
Section B. Executive Summary ……………………………………………………………………… 3
Section C. Campus-Based Research ………………………………………………………………. 4
Section D. Goals and Activities
Overarching Themes and Initiatives ………………………………………………………. 20
Access …………………………………………………………………………………………22
Course Completion …………………………………………………………………………..24
ESL and Basic Skills Completion …………………………………………………………. 26
Degree and Certificate Completion ……………………………………………………….. 29
Transfer ……………………………………………………………………………………… 31
Section E. Budget …………………………………………………………………………………... 32
Section F. Evaluation Schedule and Process
M J C S t u d e n t E q u i t y P l a n 2
Section A. Student Equity Plan Signature Page
College Name: Modesto Junior College
District Name: Yosemite Community College District
Signature of College Student Equity Coordinator _____________________________________
Name: Date: __________________
Signature of College Academic Senate President _____________________________________
Name: Date: __________________
Signature of College Vice President of Student Services _______________________________
Name: Date: __________________
Signature of College Vice President of Instruction ____________________________________
Name: Date: __________________
Signature of College President ___________________________________________________
Name: Date: __________________
Signature of District Chancellor ___________________________________________________
Name: Date: __________________

M J C S t u d e n t E q u i t y P l a n 3
Section B. Executive Summary
Modesto Junior College (MJC), a federally-designated Hispanic-Serving Institution (HSI),
provides educational opportunities for approximately 24,000 students. Multiple programs and
services address the needs of our diverse student population. Faculty, staff and administrator
commitment to student success is the focus of the college mission:
MJC is committed to transforming lives through programs and services
informed by the latest scholarship of teaching and learning. We provide a
dynamic, innovative educational environment for the ever-changing
populations and workforce needs of our regional community. We facilitate
lifelong learning through the development of intellect, creativity, character, and
abilities that shape students into thoughtful, culturally aware, engaged citizens.
The MJC 2014-2017 Student Equity Plan (SEP) analyzes data and outlines initiatives to ensure
students from underrepresented populations at the college have an equal opportunity for access
and success. The plan was developed after thoughtful evaluation of current activities and review
of student outcome indicators. Drafts of the SEP were reviewed by campus constituencies and
approved by the by Academic Senate on December 4, 2014, College Council on December 8,
2014, and the YCCD Board of Trustees on December 10, 2014. The SEP and the progress
toward reaching our goals will be evaluated and refined by the SSEC on an annual basis
through the college process of participatory government.
Student Equity: The college is dedicated to improving student equity which means providing
programs, policies and services that mitigate “disproportionate impact” that occurs when “the
percentage of persons from a particular racial, ethnic, gender, age, or disability group who are
directed to a particular service or placement based on an assessment instrument, method, or
procedure is significantly different from the representation of that group in the population of
persons being assessed, and that discrepancy is not justified by empirical evidence
demonstrating that the assessment instrument, method or procedures is a valid and reliable
predictor of performance in the relevant educational setting” [Title 5 Section 55502(d)]
MJC Student Equity Philosophy: MJC has a long-standing commitment to serving the unique
needs of underrepresented students. Modesto’s location on Highway 99 in California’s Central
Valley has been a stopping place for refugees, immigrants, and migrant farm laborers for many
years. Today, in Stanislaus County, Anglo, Hispanic, Italian and Portuguese cultural traditions
co-exist with Chinese, Basque, Sikh, Swede, Assyrian, Armenian, Russian, African American,
Hmong, Laotian, Miwok and Yokuts indigenous groups, among others.
College faculty, staff and administrators are committed to developing, implementing, and
improving programs and services that 1) do not exclude any student or diminish opportunities to
excel; and 2) increase the likelihood that all students will reach their educational goals In so
doing, the college will ensure that student services and instructional areas, including the Library
and Learning Center, are best leveraged to support student success efforts, to build
comprehensive learning experiences that holistically address student needs, and to close
achievement gaps among student populations.
M J C S t u d e n t E q u i t y P l a n 4
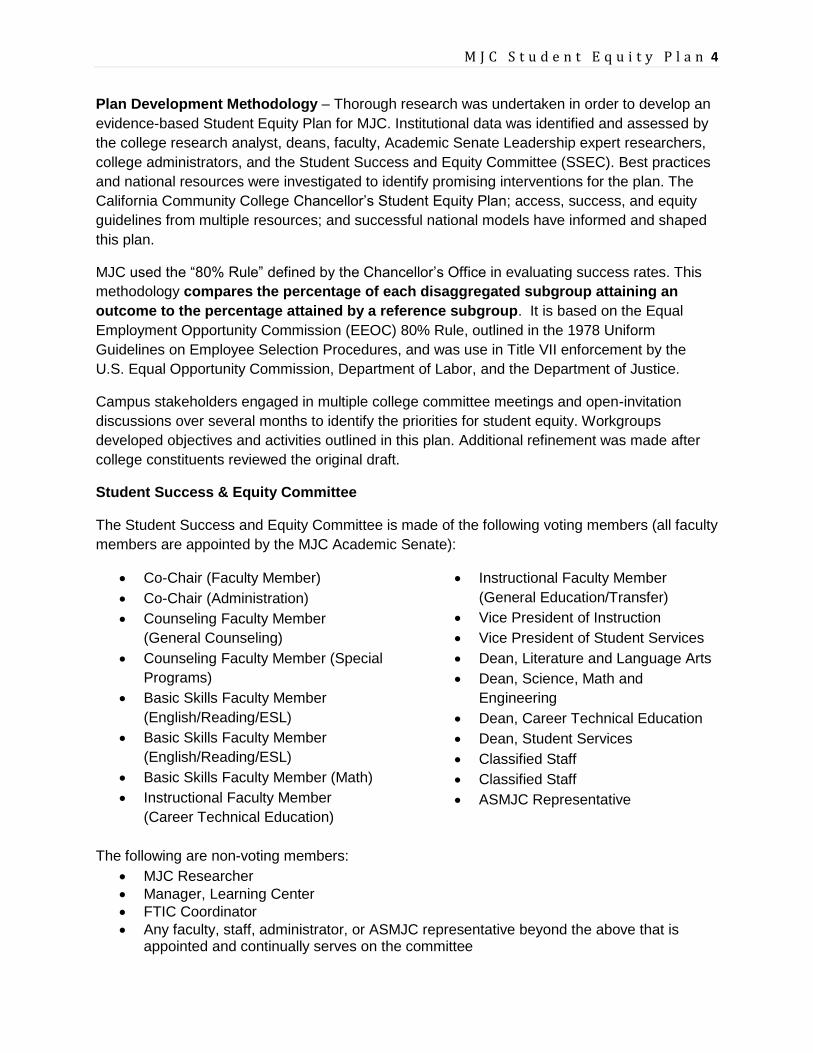
Plan Development Methodology – Thorough research was undertaken in order to develop an
evidence-based Student Equity Plan for MJC. Institutional data was identified and assessed by
the college research analyst, deans, faculty, Academic Senate Leadership expert researchers,
college administrators, and the Student Success and Equity Committee (SSEC). Best practices
and national resources were investigated to identify promising interventions for the plan. The
California Community College Chancellor’s Student Equity Plan; access, success, and equity
guidelines from multiple resources; and successful national models have informed and shaped
this plan.
MJC used the “80% Rule” defined by the Chancellor’s Office in evaluating success rates. This
methodology compares the percentage of each disaggregated subgroup attaining an
outcome to the percentage attained by a reference subgroup. It is based on the Equal
Employment Opportunity Commission (EEOC) 80% Rule, outlined in the 1978 Uniform
Guidelines on Employee Selection Procedures, and was use in Title VII enforcement by the
U.S. Equal Opportunity Commission, Department of Labor, and the Department of Justice.
Campus stakeholders engaged in multiple college committee meetings and open-invitation
discussions over several months to identify the priorities for student equity. Workgroups
developed objectives and activities outlined in this plan. Additional refinement was made after
college constituents reviewed the original draft.
Student Success & Equity Committee
The Student Success and Equity Committee is made of the following voting members (all faculty
members are appointed by the MJC Academic Senate):
Co-Chair (Faculty Member)
Co-Chair (Administration)
Counseling Faculty Member
(General Counseling)
Counseling Faculty Member (Special
Programs)
Basic Skills Faculty Member
(English/Reading/ESL)
Basic Skills Faculty Member
(English/Reading/ESL)
Basic Skills Faculty Member (Math)
Instructional Faculty Member
(Career Technical Education)
Instructional Faculty Member
(General Education/Transfer)
Vice President of Instruction
Vice President of Student Services
Dean, Literature and Language Arts
Dean, Science, Math and
Engineering
Dean, Career Technical Education
Dean, Student Services
Classified Staff
Classified Staff
ASMJC Representative
The following are non-voting members:
MJC Researcher
Manager, Learning Center
FTIC Coordinator
Any faculty, staff, administrator, or ASMJC representative beyond the above that is appointed and continually serves on the committee
M J C S t u d e n t E q u i t y P l a n 2
Target Groups: Modesto Junior College is committed to access, completion, and excellent
education for all students in the service area. Particular groups are targeted for these areas,
based on equity indicators. Additional research will be undertaken through this plan to identify
disparate impact on other populations, including foster youth, veterans, students with
disabilities, and economic subgroups. Current data identified these target groups:
Access: Hispanic students
Course Completion: African American students
Degree/Certificate
Completion: African American students
ESL/Basic Skills
Completion: Hispanic, African American and Asian students
Transfer: Hispanic and African American students
Plan Summary: Review of student equity data produced two overriding observations and
themes:
1) Improved data collection, analysis and communication will lead to better informed
faculty, staff and administrators and produce stronger evidence for decision making.
2) Student demographics at the college continue to change. Faculty, staff and
administrators will better serve students if they understand how to interpret disparate
student needs. Professional development will increase knowledge and skills to do so.
The identification of these themes led to embedded activities in every indicator to increase
capacity at the college for improved data collection, increased understanding of the disparate
needs of students and recognition of effective practices to address the findings. This is a
particularly important focus during the first year of the plan when many activities involve
professional development and working with experts in the field. Activities during Years Two and
Three will be refined to address findings during this first important period.
Indicator Findings and Goals:
ACCESS FINDINGS: When comparing the graduating class of feeder high schools to the MJC student population, MJC serves fewer males by eight percentage points and fewer Hispanics by the same number of percentage points. National data are similar to MJC on college going difference between males and females. The Hispanic data is more troubling, but a deficit of this analysis is that comparisons were not made in this analysis of the “First Time to MJC Class” to the exiting high school class. There is a disparity of nine percentage points in Hispanic student enrollment compared to high
school graduating seniors. Comparison of exiting high school graduates to entering MJC
students will demonstrate whether or not there is disparate impact on other groups, such as
African American students.
ACCESS GOAL: Increase the percentage of first-time-in-college Hispanic students.
M J C S t u d e n t E q u i t y P l a n 3
COURSE COMPLETION FINDINGS: African American students demonstrate consistently
lower success rates than other races/ethnicities. Their success rates have resulted in
disproportionate impact across all types of coursework.
COURSE COMPLETION GOAL: Increase course completion for all students with
particular attention to African American students.
ESL AND BASIC SKILLS COMPLETION FINDINGS: ESL transition rates to transfer level
coursework are very low. Basic Skills transition rates in English and Math are low for Hispanic,
African American and Pacific Islander students. Older students and students of color are less
successful than the reference groups.
ESL AND BASIC SKILLS COMPLETION GOAL: Increase course completion in ESL
and Basic Skills courses for all students with particular attention to African American and
Hispanic students.
DEGREE AND CERTIFICATE COMPLETION FINDINGS: Almost 70% of cohort students earn
30 units, but only 11% of students earn a degree or certificate. According to the Transfer
Velocity study, 30% of students transfer. While the methodologies are different for each
indicator, the difference between the milestone of 30 units and those that earn a degree,
certificate or transfer appears to be significant. These data points suggest further investigation.
In regard to disproportionate impact, older students and students of color tend to do less well
than reference groups.
DEGREE AND CERTIFICATE COMPLETION GOAL: Increase degree and certificate
completion for all students with particular attention to African American and Hispanic
students.
TRANSFER FINDINGS: Based on the Transfer Velocity report, 30% of students transfer. There
is some disproportionate impact among student 20 years and older, Hispanics and “unknown”
race/ethnicity.
TRANSFER GOAL: Increase the number of students who transfer to a four-year
university with particular attention to Hispanic and African American students.
Major Initiatives for MJC Student Equity Plan Improve data gathering, analysis and communication
Data coaching
Enhance outreach and marketing efforts
Develop new multi-disciplinary First-time-in-College (FTIC) course
Explore and support course redesign and sequencing
Deep dive in researching, identifying and implementing best practices to help students of
color succeed
Improvement of transfer pathways
Faculty professional develop
Proactive communication with students on progress-toward-completion (degree audit)

M J C S t u d e n t E q u i t y P l a n 4
Section B. Campus-Based Research
The Chancellors’ Office guidelines for student equity planning research identify five key areas to
be investigated. These include Access, Course Completion, Basis Skills Completion, ESL and
Basic Skills Completion, Degree and Certificate Completion and Transfer. Each of these five
areas requires an analysis of disproportionate impact be conducted disaggregating data by the
demographic variables of gender age and race/ethnicity.
In trailer bill language adopted after the guidelines were developed, additional breakouts by
foster youth, veterans, disability, disabled and levels of poverty were added. These additional
breakouts were addressed in course completion data but were added too late for a thorough
analysis to be conducted and will be address in the next planning cycle. Given the size of MJC,
to maintain statistical reliability, cell sizes of less than 100 were not included in the
disproportionate impact calculations. That said, MJC recognizes there is disproportionate impact
potentially occurring in cell sizes of less than 100. Consequently, we will analyze this
information further through the implementation of this plan.
The following report displays and analyzes outcomes for the five indicators by the demographic
variables originally cited.
The Chancellor’s Office suggested methodology that creates cohorts of students who have to
first attain a certain level of success before they are included greatly reduces the number of
students reviewed in this analysis. While MJC used the Chancellor’s Office methodology, we
are committed to conduct local research on the MJC student population on each of the
indicators, where appropriate, and data is available through the implementation of this plan to
determine the actual outcomes.
M J C S t u d e n t E q u i t y P l a n 5
ACCESS
HS Grad class MJC
2012-13 2013-14
Number Percent Number Percent Diff
Female 3,963 49% 13,723 57% -8%
Male 4,117 51% 10,245 43% 8%
Undeclared 67 0% N/A
African American 301 4% 901 4% 0%
Asian 361 4% 1,305 5% -1%
Filipino 69 1% 245 1% 0%
Hispanic 4164 52% 10,442 43% 9%
Native 67 1% 124 1% 0%
Pacific Islander 71 1% 229 1% 0%
Two or More Races 173 2% 900 4% -2%
White 2822 35% 8,807 37% -2%
Undeclared 52 1% 1082 5% -4%
Total 8080 100% 24,035 100%
Only cell sizes of more than 100 were included in disproportionate impact calculations
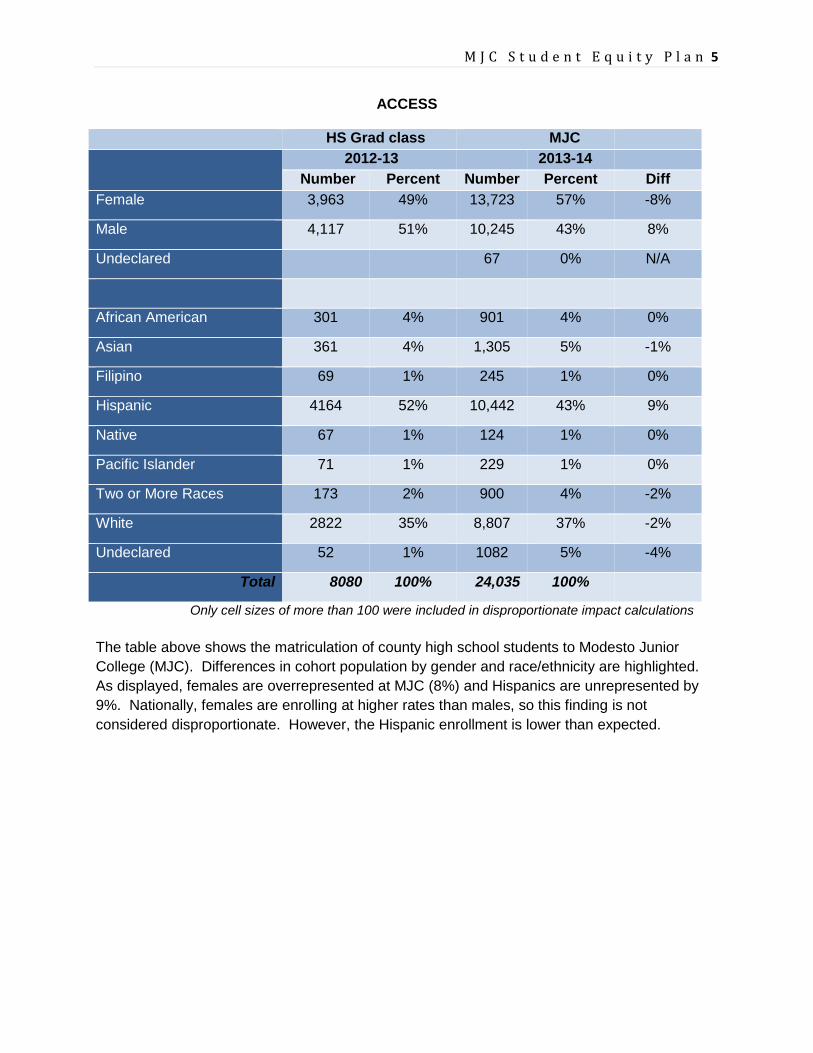
The table above shows the matriculation of county high school students to Modesto Junior
College (MJC). Differences in cohort population by gender and race/ethnicity are highlighted.
As displayed, females are overrepresented at MJC (8%) and Hispanics are unrepresented by
9%. Nationally, females are enrolling at higher rates than males, so this finding is not
considered disproportionate. However, the Hispanic enrollment is lower than expected.
M J C S t u d e n t E q u i t y P l a n 6
2013-14 Basic Skills Course Completion
Enrollment
Count % of
Cohort Success
Count Success
Rate 80 % Index
All 5067 3236 64%
Female 3193 63.0% 2134 67% 1.00
Male 1872 36.9% 1100 59% 0.88
1 to 17 60 1.2% 38 63% 0.94
18 & 19 1553 30.6% 997 64% 0.96
20 to 24 1454 28.7% 881 61% 0.93
25 to 29 577 11.4% 383 66% 0.99
30 to 34 344 6.8% 225 65% 0.97
35 to 39 231 4.6% 155 67% 1.00
40 to 49 420 8.3% 277 66% 0.98
50 + 428 8.4% 280 65% 0.97
African-American 254 5.0% 124 49% 0.69
American Indian/Alaskan Native
15 0.3% 8 53% 0.75
Asian 456 9.0% 323 71% 1.00
Hispanic 2365 46.7% 1485 63% 0.89
Multi-Ethnicity 149 2.9% 89 60% 0.84
Pacific Islander 48 0.9% 29 60% 0.85
Unknown 253 5.0% 171 68% 0.95
White Non-Hispanic 1527 30.1% 1007 66% 0.93
Only cell sizes of more than 100 were included in disproportionate impact calculations
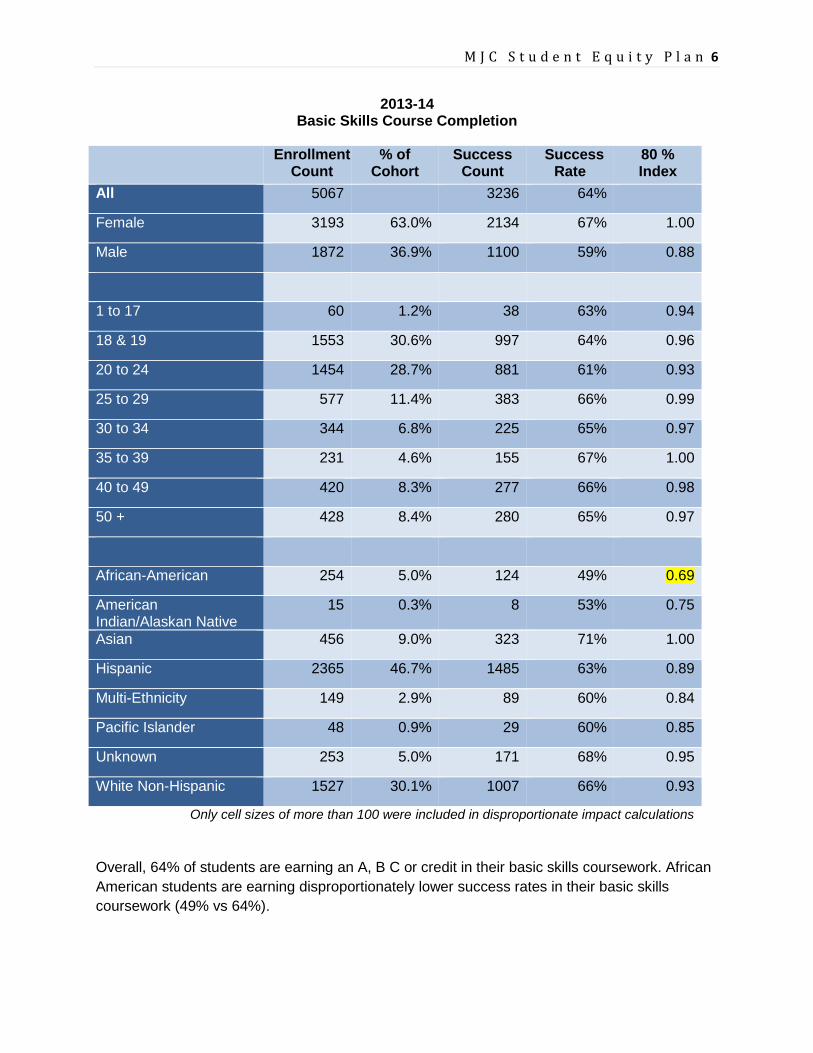
Overall, 64% of students are earning an A, B C or credit in their basic skills coursework. African
American students are earning disproportionately lower success rates in their basic skills
coursework (49% vs 64%).
M J C S t u d e n t E q u i t y P l a n 7
2013-14
Credit Course Completion
Only cell sizes of more than 100 were included in disproportionate impact calculations
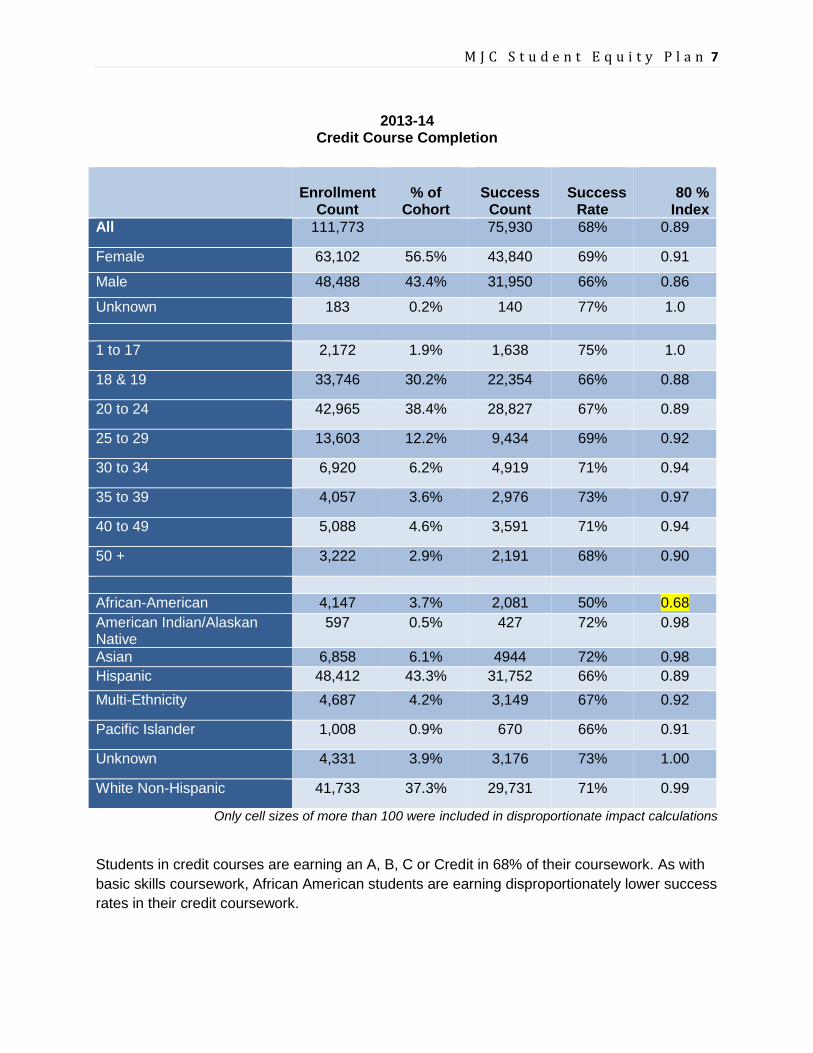
Students in credit courses are earning an A, B, C or Credit in 68% of their coursework. As with
basic skills coursework, African American students are earning disproportionately lower success
rates in their credit coursework.
Enrollment
Count
% of
Cohort
Success
Count
Success
Rate
80 %
Index
All 111,773 75,930 68% 0.89
Female 63,102 56.5% 43,840 69% 0.91
Male 48,488 43.4% 31,950 66% 0.86
Unknown 183 0.2% 140 77% 1.0
1 to 17 2,172 1.9% 1,638 75% 1.0
18 & 19 33,746 30.2% 22,354 66% 0.88
20 to 24 42,965 38.4% 28,827 67% 0.89
25 to 29 13,603 12.2% 9,434 69% 0.92
30 to 34 6,920 6.2% 4,919 71% 0.94
35 to 39 4,057 3.6% 2,976 73% 0.97
40 to 49 5,088 4.6% 3,591 71% 0.94
50 + 3,222 2.9% 2,191 68% 0.90
African-American 4,147 3.7% 2,081 50% 0.68
American Indian/Alaskan Native
597 0.5% 427 72% 0.98
Asian 6,858 6.1% 4944 72% 0.98
Hispanic 48,412 43.3% 31,752 66% 0.89
Multi-Ethnicity 4,687 4.2% 3,149 67% 0.92
Pacific Islander 1,008 0.9% 670 66% 0.91
Unknown 4,331 3.9% 3,176 73% 1.00
White Non-Hispanic 41,733 37.3% 29,731 71% 0.99
M J C S t u d e n t E q u i t y P l a n 8
2013-2014 Degree Course Completion
Enrollment
Count % of
Cohort Success
Count Success
Rate 80 % Index
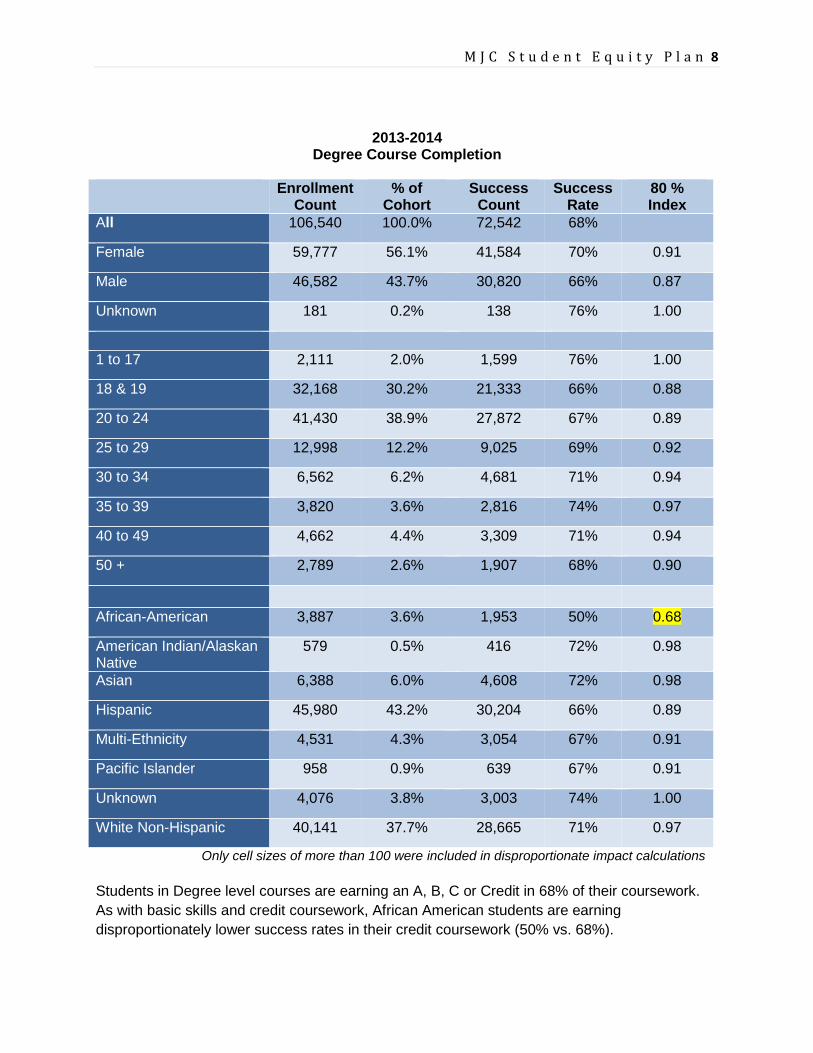
All 106,540 100.0% 72,542 68%
Female 59,777 56.1% 41,584 70% 0.91
Male 46,582 43.7% 30,820 66% 0.87
Unknown 181 0.2% 138 76% 1.00
1 to 17 2,111 2.0% 1,599 76% 1.00
18 & 19 32,168 30.2% 21,333 66% 0.88
20 to 24 41,430 38.9% 27,872 67% 0.89
25 to 29 12,998 12.2% 9,025 69% 0.92
30 to 34 6,562 6.2% 4,681 71% 0.94
35 to 39 3,820 3.6% 2,816 74% 0.97
40 to 49 4,662 4.4% 3,309 71% 0.94
50 + 2,789 2.6% 1,907 68% 0.90
African-American 3,887 3.6% 1,953 50% 0.68
American Indian/Alaskan Native
579 0.5% 416 72% 0.98
Asian 6,388 6.0% 4,608 72% 0.98
Hispanic 45,980 43.2% 30,204 66% 0.89
Multi-Ethnicity 4,531 4.3% 3,054 67% 0.91
Pacific Islander 958 0.9% 639 67% 0.91
Unknown 4,076 3.8% 3,003 74% 1.00
White Non-Hispanic 40,141 37.7% 28,665 71% 0.97
Only cell sizes of more than 100 were included in disproportionate impact calculations
Students in Degree level courses are earning an A, B, C or Credit in 68% of their coursework.
As with basic skills and credit coursework, African American students are earning
disproportionately lower success rates in their credit coursework (50% vs. 68%).
M J C S t u d e n t E q u i t y P l a n 9
2013-14 Transfer Course Completion
Enrollment
Count % of
Cohort Success
Count Success
Rate 80%
Index
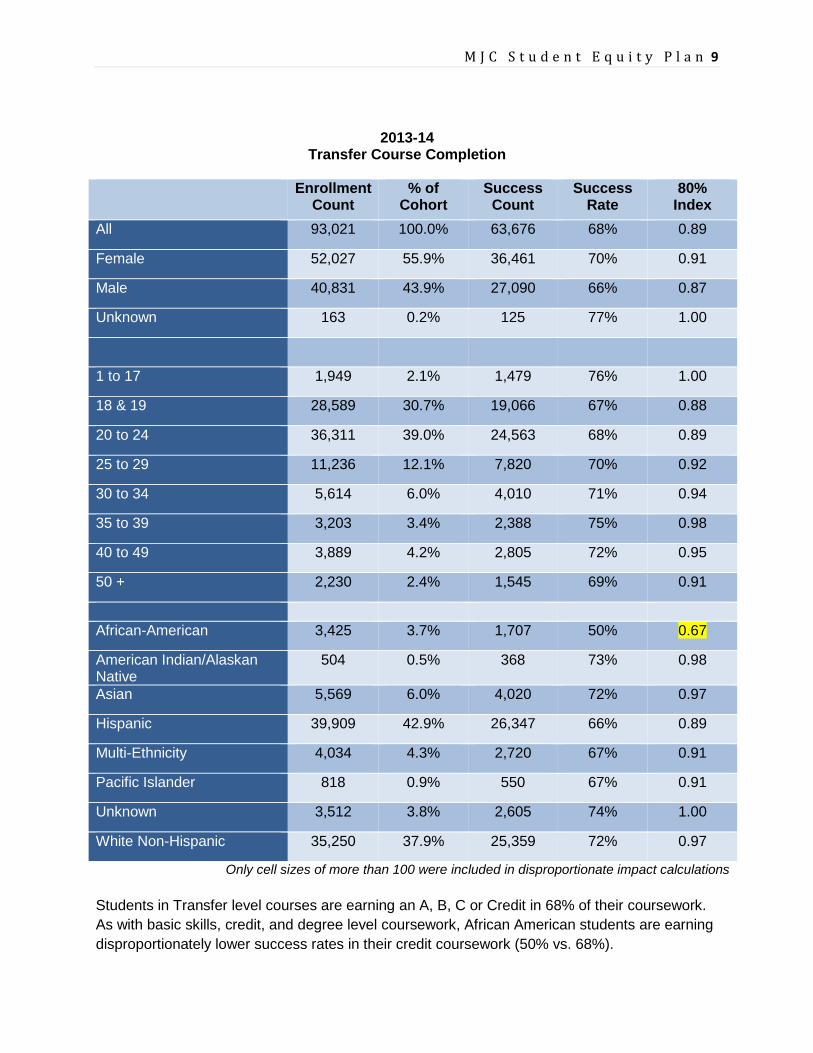
All 93,021 100.0% 63,676 68% 0.89
Female 52,027 55.9% 36,461 70% 0.91
Male 40,831 43.9% 27,090 66% 0.87
Unknown 163 0.2% 125 77% 1.00
1 to 17 1,949 2.1% 1,479 76% 1.00
18 & 19 28,589 30.7% 19,066 67% 0.88
20 to 24 36,311 39.0% 24,563 68% 0.89
25 to 29 11,236 12.1% 7,820 70% 0.92
30 to 34 5,614 6.0% 4,010 71% 0.94
35 to 39 3,203 3.4% 2,388 75% 0.98
40 to 49 3,889 4.2% 2,805 72% 0.95
50 + 2,230 2.4% 1,545 69% 0.91
African-American 3,425 3.7% 1,707 50% 0.67
American Indian/Alaskan Native
504 0.5% 368 73% 0.98
Asian 5,569 6.0% 4,020 72% 0.97
Hispanic 39,909 42.9% 26,347 66% 0.89
Multi-Ethnicity 4,034 4.3% 2,720 67% 0.91
Pacific Islander 818 0.9% 550 67% 0.91
Unknown 3,512 3.8% 2,605 74% 1.00
White Non-Hispanic 35,250 37.9% 25,359 72% 0.97
Only cell sizes of more than 100 were included in disproportionate impact calculations
Students in Transfer level courses are earning an A, B, C or Credit in 68% of their coursework.
As with basic skills, credit, and degree level coursework, African American students are earning
disproportionately lower success rates in their credit coursework (50% vs. 68%).
M J C S t u d e n t E q u i t y P l a n 10
2013-14 Vocational Course Completion
Enrollment
Count
% of
Cohort
Success
Count
Success
Rate
80 % Index
All
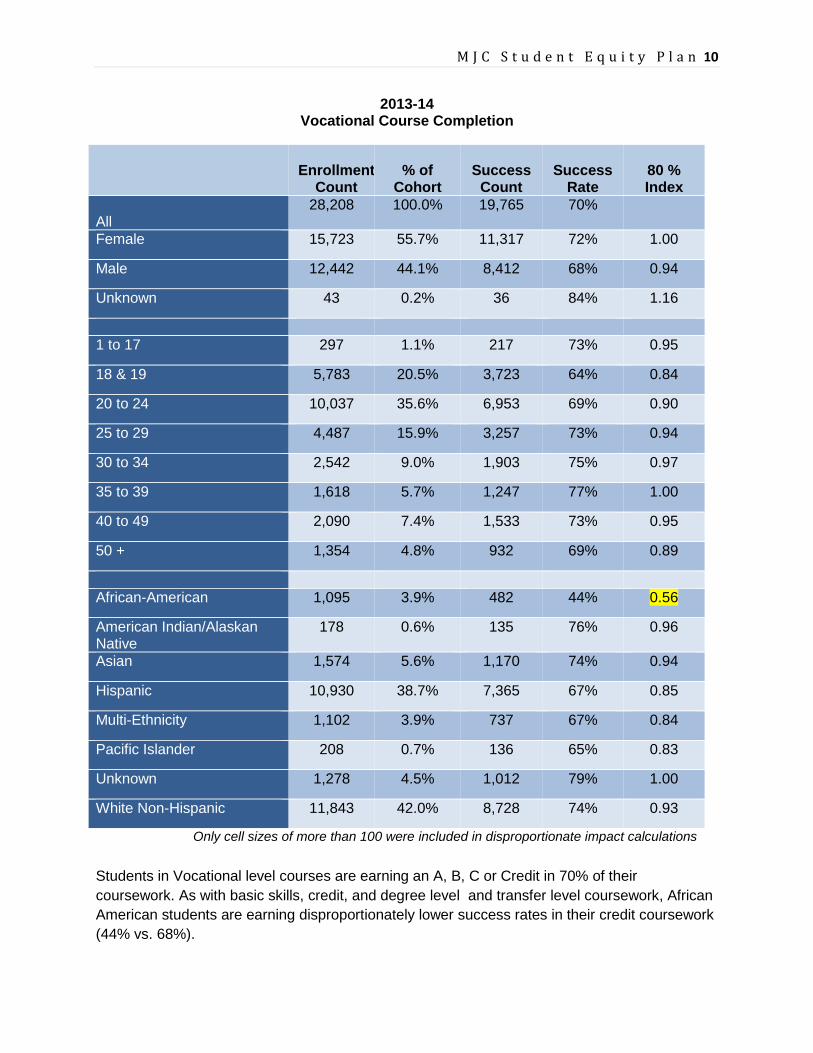
28,208 100.0% 19,765 70%
Female 15,723 55.7% 11,317 72% 1.00
Male 12,442 44.1% 8,412 68% 0.94
Unknown 43 0.2% 36 84% 1.16
1 to 17 297 1.1% 217 73% 0.95
18 & 19 5,783 20.5% 3,723 64% 0.84
20 to 24 10,037 35.6% 6,953 69% 0.90
25 to 29 4,487 15.9% 3,257 73% 0.94
30 to 34 2,542 9.0% 1,903 75% 0.97
35 to 39 1,618 5.7% 1,247 77% 1.00
40 to 49 2,090 7.4% 1,533 73% 0.95
50 + 1,354 4.8% 932 69% 0.89
African-American 1,095 3.9% 482 44% 0.56
American Indian/Alaskan Native
178 0.6% 135 76% 0.96
Asian 1,574 5.6% 1,170 74% 0.94
Hispanic 10,930 38.7% 7,365 67% 0.85
Multi-Ethnicity 1,102 3.9% 737 67% 0.84
Pacific Islander 208 0.7% 136 65% 0.83
Unknown 1,278 4.5% 1,012 79% 1.00
White Non-Hispanic 11,843 42.0% 8,728 74% 0.93
Only cell sizes of more than 100 were included in disproportionate impact calculations
Students in Vocational level courses are earning an A, B, C or Credit in 70% of their
coursework. As with basic skills, credit, and degree level and transfer level coursework, African
American students are earning disproportionately lower success rates in their credit coursework
(44% vs. 68%).

M J C S t u d e n t E q u i t y P l a n 11
2005-08
ESL and Basic Skills Completion ESL Completion (Transition to College Level Coursework)
Cohort
Size % of
Cohort Success
Count Success
Rate 80%
Index
All 589 76 12.9%
Female 410 69.6% 53 12.9% 1.00
Male 179 30.4% 23 12.9% 1.00
< 20 years old 73 12.4% 16 21.9% 1.00
20 to 24 years old 117 19.9% 23 19.7% 0.90
25 to 39 years old 252 42.8% 28 11.1% 0.51
40+ years old 147 25.0% 9 6.1% 0.28
African American
American Indian/Alaska Native
Asian 146 24.8% 32 21.9% 1.00
Filipino
Hispanic 199 33.8% 14 7.0% 0.32
Pacific Islander
White 112 16.0% 23 0.9% 0.73
Only cell sizes of more than 100 were included in disproportionate impact calculations
According to the Chancellor’s Office data system, 12.9% of student beginning in an ESL course
below transfer level transition to an English course at the Transfer level. This actually transition
rate may be higher, and MJC will be investigating this metric in next year’s analysis.
Nevertheless, students older than 20 years of age and both African American and White
students are progressing at disproportionately lower rates that reference group students.
M J C S t u d e n t E q u i t y P l a n 12
2005-08 Basic Skills Completion (Transition to College Level Coursework)
Remedial English
Cohort Size
% of Cohort
Success Count
% Successful
80% Index
All 6,635 2654 40.0%
Female 3,932 59.3% 1632 41.5% 1.00
Male 2,679 40.4% 1014 37.9% 0.91
< 20 years old 4,137 62.4% 1873 45.3% 1.00
20 to 24 years old 1,313 19.8% 455 34.7% 0.77
25 to 39 years old 859 12.9% 263 30.6% 0.68
40+ years old 326 4.9% 63 19.3% 0.43
African American 302 4.6% 89 29.5% 0.69
American Indian/Alaska Native
74 1.1% 23 31.1% 0.65
Asian 484 7.3% 231 47.7% 1.00
Filipino 105 1.6% 50 47.6% 1.00
Hispanic 2,225 33.5% 837 37.6% 0.79
Pacific Islander 113 1.7% 34 30.1% 0.63
White 2,224 33.5% 949 42.7% 0.89
Only cell sizes of more than 100 were included in disproportionate impact calculations
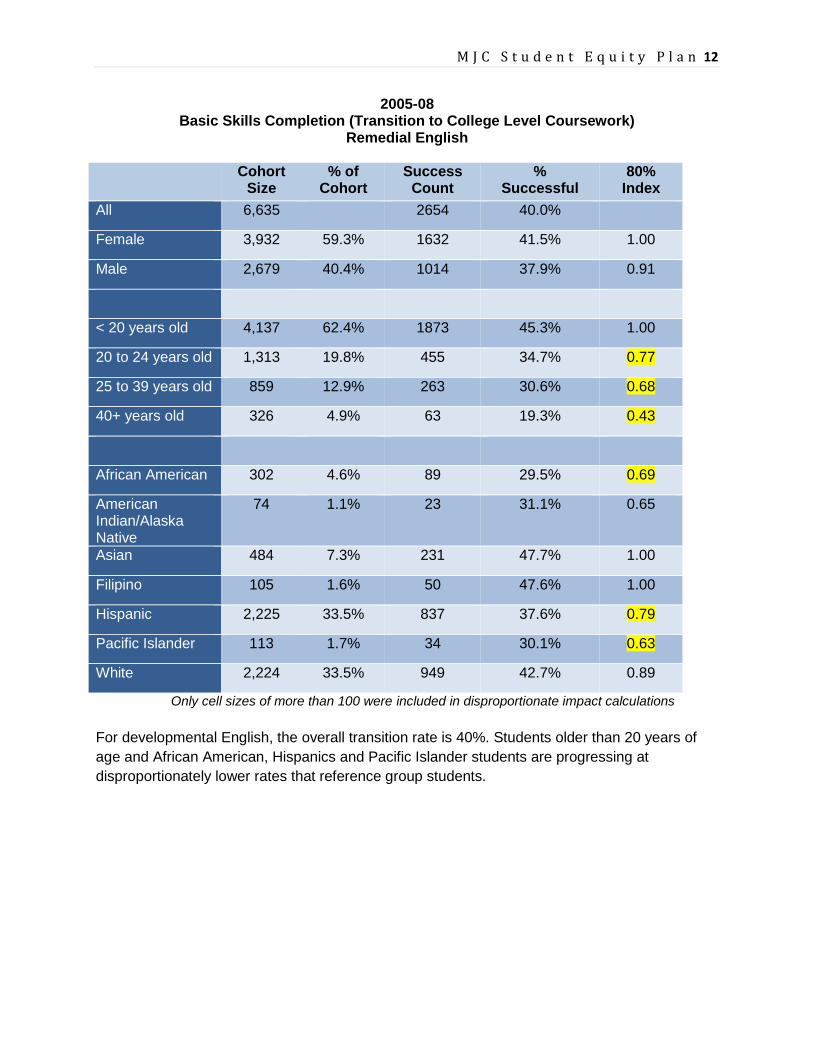
For developmental English, the overall transition rate is 40%. Students older than 20 years of
age and African American, Hispanics and Pacific Islander students are progressing at
disproportionately lower rates that reference group students.

M J C S t u d e n t E q u i t y P l a n 13
2005-08 Basic Skills Completion (Transition to College Level Coursework)
Remedial Math
Cohort Size
% of Cohort
Success Count
% successful
80% Index
All 5,350 100.0% 1692 31.6%
Female 3,449 64.5% 1118 32.4% 1.00
Male 1,891 35.3% 570 30.1% 0.93
< 20 years old 2,574 48.1% 956 37.1% 1.00
20 to 24 years old 1,427 26.7% 440 30.8% 0.83
25 to 39 years old 935 17.5% 234 25.0% 0.67
40+ years old 414 7.7% 62 15.0% 0.40
African American 224 4.2% 47 21.0% 0.48
American Indian/Alaska Native
69 1.3% 15 21.7% 0.50
Asian 279 5.2% 122 43.7% 1.00
Filipino 68 1.3% 26 38.2% 0.87
Hispanic 1,625 30.4% 468 28.8% 0.66
Pacific Islander 89 1.7% 28 31.5% 0.72
White 2,115 39.5% 676 31.9% 0.73
Only cell sizes of more than 100 were included in disproportionate impact calculations
For developmental Math, the overall transition rate is 31.6%. Students 25 years of age and older
and African American, Hispanics and White students are progressing at disproportionately lower
rates that reference group students.
M J C S t u d e n t E q u i t y P l a n 14
2007-08
Degree and Certificate Completion 30 Unit Completion (Overall)
Cohort
Size Cohort Percent
Success Count
% Successful
80% Index
All 2,925 69.3%
Female 1,624 55.5% 1117 68.8% 0.99
Male 1,268 43.4% 885 69.8% 1.00
< 20 years old 2,357 80.6% 1666 70.7% 1.00
20 to 24 years old 221 7.6% 136 61.5% 0.87
25 to 39 years old 231 7.9% 151 65.4% 0.93
40+ years old 116 4.0% 73 62.9% 0.89
African American 104 3.6% 62 59.6% 0.77
American Indian/Alaska Native
32 1.1% 23 71.9% 0.93
Asian 208 7.1% 161 77.4% 1.00
Filipino 44 1.5% 33 75.0% 0.97
Hispanic 873 29.8% 562 64.4% 0.83
Pacific Islander 38 1.3% 22 57.9% 0.75
White 1,263 43.2% 911 72.1% 0.93
Only cell sizes of more than 100 were included in disproportionate impact calculations
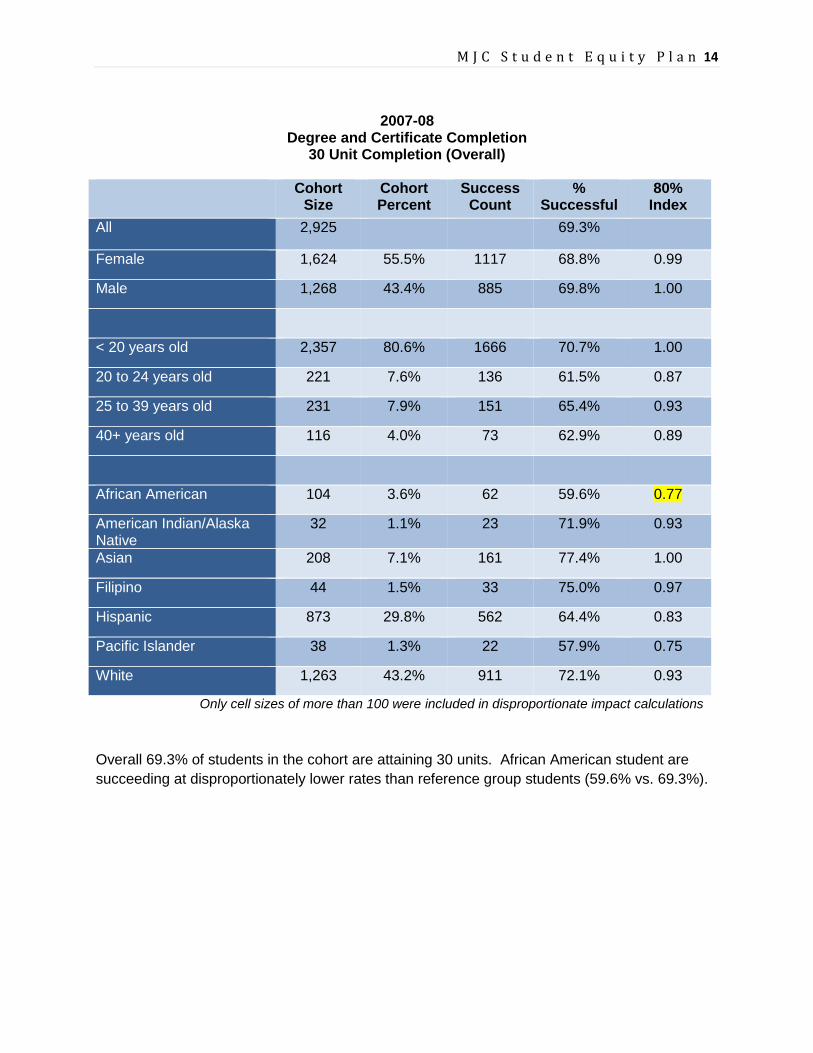
Overall 69.3% of students in the cohort are attaining 30 units. African American student are
succeeding at disproportionately lower rates than reference group students (59.6% vs. 69.3%).
M J C S t u d e n t E q u i t y P l a n 15
2007-08 Degree and Certificate Completion
30 units (Prepared)
Cohort Size Cohort Percent
Success Count
% Successful
80% Index
All 569 394 69.2% 0.97
Female 258 45.5% 175 67.8%
Male 306 54.5% 214 69.9% 1.00
< 20 years old 502 88.2% 362 72.1% 1.00
20 to 24 years old 25 4.4% 14 56.0%
25 to 39 years old 29 5.1% 14 48.3%
40+ years old 13 2.2% 4 30.8%
African American 17 3.0% 8 47.1% N/A
American Indian/Alaska Native
1 to 9 75.0% N/A
Asian 28 4.9% 21 75.0% N/A
Filipino 13 2.3% 13 100.0% N/A
Hispanic 110 1.9% 68 61.8% 0.88
Pacific Islander 1 to 9 50.0% N/A
White 310 5.5% 218 70.3% 1.00
Only cell sizes of more than 100 were included in disproportionate impact calculations
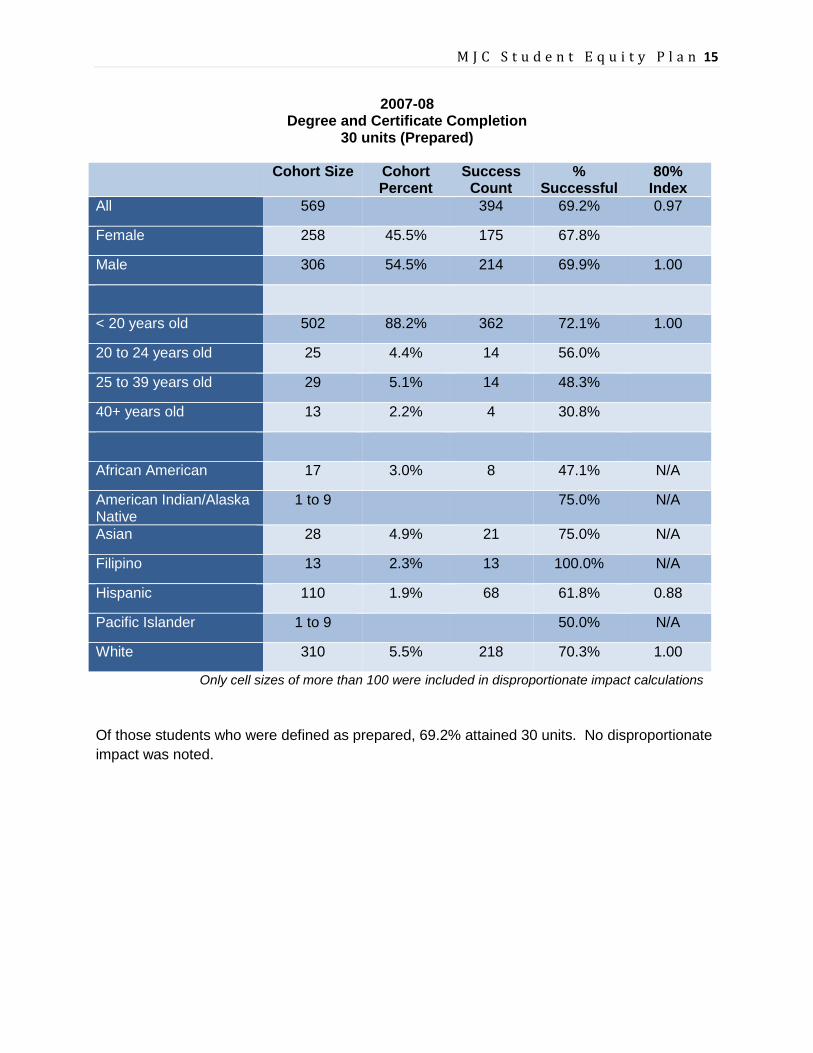
Of those students who were defined as prepared, 69.2% attained 30 units. No disproportionate
impact was noted.
M J C S t u d e n t E q u i t y P l a n 16
2007-08 Degree and Certificate Completion
30 units (Unprepared)
Cohort Size
Cohort Percent
Success Count
% Successful
80% Index
All 2,356 1,633 69.3%
Female 1,366 58.0% 943 69.0% 0.99
Male 962 40.8% 671 69.8% 1.00
< 20 years old 1,855 78.7% 1,304 70.3% 1.00
20 to 24 years old 196 8.3% 122 62.2% 0.88
25 to 39 years old 202 8.6% 137 67.8% 0.96
40+ years old 103 4.4% 69 67.0% 0.95
African American 87 3.7% 54 62.1%
American Indian/Alaska Native
24 1.0% 17 70.8%
Asian 180 7.6% 140 77.8% 1.00
Filipino 31 1.3% 20 64.5%
Hispanic 763 32.4% 494 64.7% 0.83
Pacific Islander 34 1.4% 20 58.8%
White 953 40.4% 692 72.6% 0.93
Only cell sizes of more than 100 were included in disproportionate impact calculations
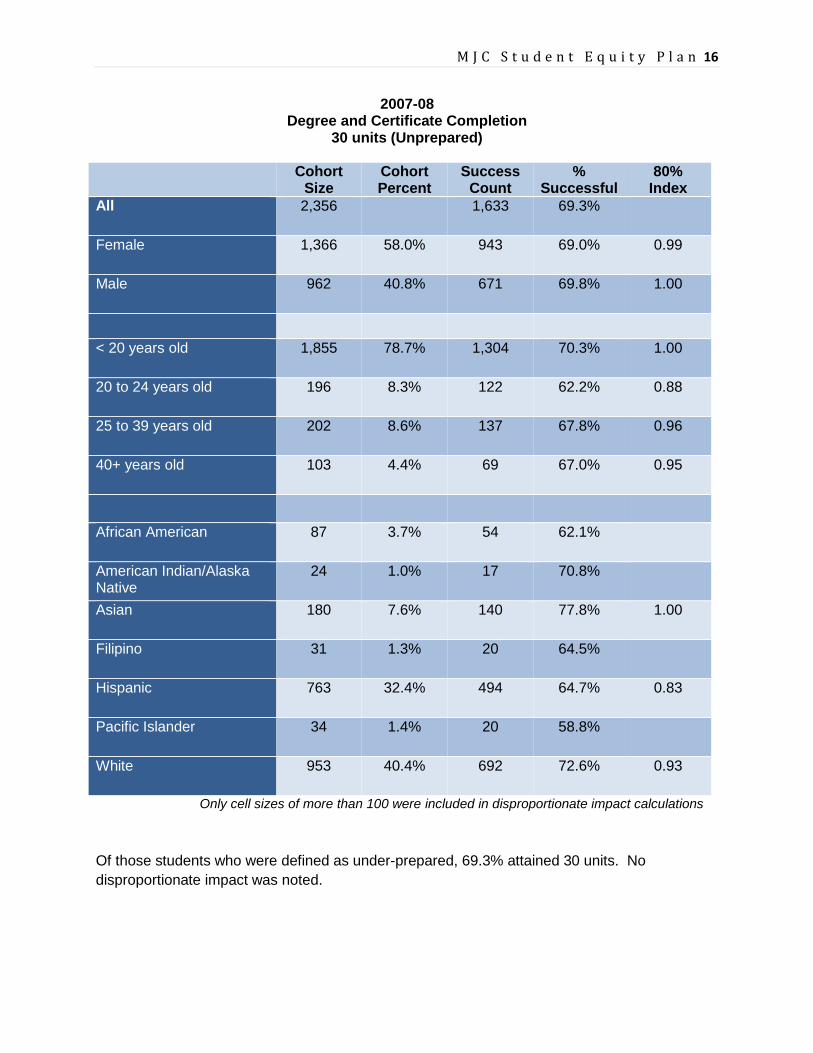
Of those students who were defined as under-prepared, 69.3% attained 30 units. No
disproportionate impact was noted.
M J C S t u d e n t E q u i t y P l a n 17
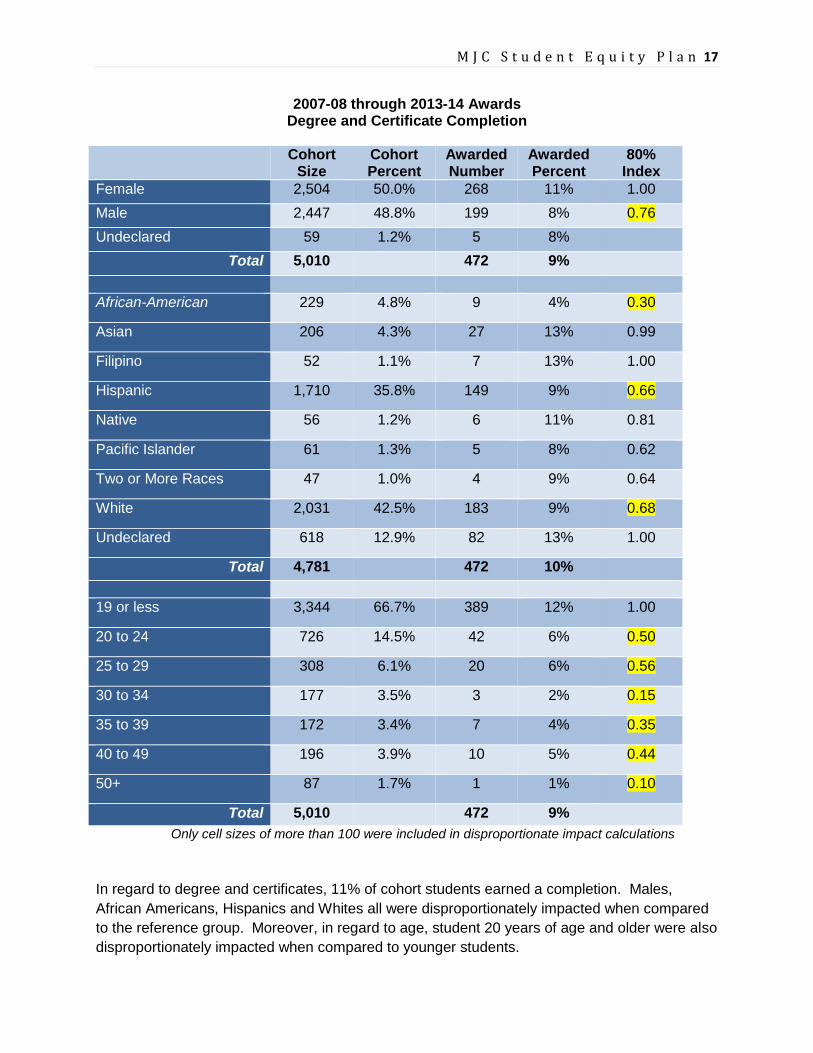
2007-08 through 2013-14 Awards Degree and Certificate Completion
Cohort
Size Cohort Percent
Awarded Number
Awarded Percent
80% Index
Female 2,504 50.0% 268 11% 1.00
Male 2,447 48.8% 199 8% 0.76
Undeclared 59 1.2% 5 8%
Total 5,010 472 9%
African-American 229 4.8% 9 4% 0.30
Asian 206 4.3% 27 13% 0.99
Filipino 52 1.1% 7 13% 1.00
Hispanic 1,710 35.8% 149 9% 0.66
Native 56 1.2% 6 11% 0.81
Pacific Islander 61 1.3% 5 8% 0.62
Two or More Races 47 1.0% 4 9% 0.64
White 2,031 42.5% 183 9% 0.68
Undeclared 618 12.9% 82 13% 1.00
Total 4,781 472 10%
19 or less 3,344 66.7% 389 12% 1.00
20 to 24 726 14.5% 42 6% 0.50
25 to 29 308 6.1% 20 6% 0.56
30 to 34 177 3.5% 3 2% 0.15
35 to 39 172 3.4% 7 4% 0.35
40 to 49 196 3.9% 10 5% 0.44
50+ 87 1.7% 1 1% 0.10
Total 5,010 472 9%
Only cell sizes of more than 100 were included in disproportionate impact calculations
In regard to degree and certificates, 11% of cohort students earned a completion. Males,
African Americans, Hispanics and Whites all were disproportionately impacted when compared
to the reference group. Moreover, in regard to age, student 20 years of age and older were also
disproportionately impacted when compared to younger students.

M J C S t u d e n t E q u i t y P l a n 18
2005-07
SPAR
Cohort Size
SPAR
Rate
80% Index
All 7,883 3,390 43.0%
Female 4,399 1,896 43.1% 1.00
Male 3,425 1,469 42.9% 0.99
< 20 years old 6,453 2,986 46.3% 1.00
20 to 24 years old 594 157 26.5% 0.57
25 to 39 years old 569 175 30.7% 0.66
40+ years old 266 71 26.7% 0.58
African American 241 93 38.6% 0.77
American Indian/Alaska Native
82 40 48.8% 0.98
Asian 536 248 46.2% 0.92
Filipino 126 63 50.0% 1.00
Hispanic 2,300 844 36.7% 0.75
Pacific Islander 102 37 36.3% 0.73
White 3,374 1,590 47.1% 0.94
Only cell sizes of more than 100 were included in disproportionate impact calculations
For the SPAR rate, 43% of student completed a Degree, Certificate or transferred to a 4-yr
institution. Students over 20 years of age, African Americans, Hispanics and Pacific Islanders
succeeded at disproportionately lower rates than the reference group.

M J C S t u d e n t E q u i t y P l a n 19
2007-08 Transfer Velocity
Cohort
Size Cohort
% Success
Rate %
Successful 80%
Index
All 2,058 627 30%
Female 1,137 55.2% 334 29% 0.91
Male 899 43.7% 289 32% 1.00
Unknown 22 1.1% 4 18% 0.56
17 or Less 514 25.0% 193 38% 1.00
18 & 19 1,200 58.3% 375 31% 0.83
20 to 24 150 7.3% 29 19% 0.51
25 to 29 66 3.2% 12 18% 0.48
30 to 34 30 1.5% 7 23% 0.62
35 to 39 43 2.1% 8 19% 0.50
40 to 49 47 2.3% 2 4% 0.11
50 + 1 to 9 1 to 9 13% 0.33
African-American 60 2.9% 17 28% 0.72
American Indian/Alaskan Native
33 1.6% 9 27% 0.70
Asian 138 6.7% 54 39% 1.00
Filipino 33 1.6% 14 42% 1.08
Hispanic 564 27.4% 145 26% 0.66
Pacific Islander 18 0.9% 4 22% 0.57
Unknown 256 12.4% 68 27% 0.68
White Non-Hispanic 956 46.5% 316 33% 0.84
For transfer, the rate for the transfer velocity outcomes is 30%. 20 to 24 year olds and
Hispanics and Unknown race ethnicity students earned disproportionately lower rates that the
reference group students.
M J C S t u d e n t E q u i t y P l a n 20
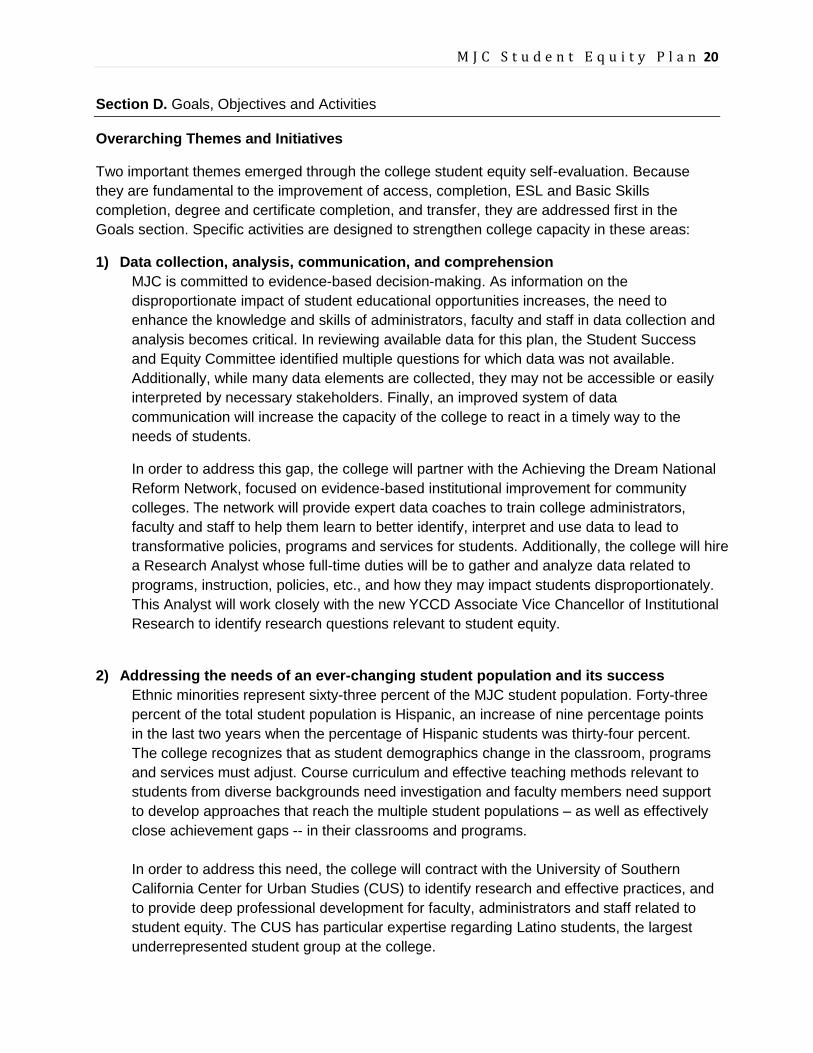
Section D. Goals, Objectives and Activities
Overarching Themes and Initiatives
Two important themes emerged through the college student equity self-evaluation. Because
they are fundamental to the improvement of access, completion, ESL and Basic Skills
completion, degree and certificate completion, and transfer, they are addressed first in the
Goals section. Specific activities are designed to strengthen college capacity in these areas:
1) Data collection, analysis, communication, and comprehension
MJC is committed to evidence-based decision-making. As information on the
disproportionate impact of student educational opportunities increases, the need to
enhance the knowledge and skills of administrators, faculty and staff in data collection and
analysis becomes critical. In reviewing available data for this plan, the Student Success
and Equity Committee identified multiple questions for which data was not available.
Additionally, while many data elements are collected, they may not be accessible or easily
interpreted by necessary stakeholders. Finally, an improved system of data
communication will increase the capacity of the college to react in a timely way to the
needs of students.
In order to address this gap, the college will partner with the Achieving the Dream National
Reform Network, focused on evidence-based institutional improvement for community
colleges. The network will provide expert data coaches to train college administrators,
faculty and staff to help them learn to better identify, interpret and use data to lead to
transformative policies, programs and services for students. Additionally, the college will hire
a Research Analyst whose full-time duties will be to gather and analyze data related to
programs, instruction, policies, etc., and how they may impact students disproportionately.
This Analyst will work closely with the new YCCD Associate Vice Chancellor of Institutional
Research to identify research questions relevant to student equity.
2) Addressing the needs of an ever-changing student population and its success
Ethnic minorities represent sixty-three percent of the MJC student population. Forty-three
percent of the total student population is Hispanic, an increase of nine percentage points
in the last two years when the percentage of Hispanic students was thirty-four percent.
The college recognizes that as student demographics change in the classroom, programs
and services must adjust. Course curriculum and effective teaching methods relevant to
students from diverse backgrounds need investigation and faculty members need support
to develop approaches that reach the multiple student populations – as well as effectively
close achievement gaps -- in their classrooms and programs.
In order to address this need, the college will contract with the University of Southern
California Center for Urban Studies (CUS) to identify research and effective practices, and
to provide deep professional development for faculty, administrators and staff related to
student equity. The CUS has particular expertise regarding Latino students, the largest
underrepresented student group at the college.
M J C S t u d e n t E q u i t y P l a n 21
Additional Questions
Baseline data for this plan looked at achievement gaps in multiple areas. There are, however
more questions to consider. Additional areas to investigate have been identified for which we do
not have current data. A priority in the Student Equity Plan is to understand the root causes for
access and achievement gaps for underrepresented students in order to develop appropriate
improvement activities. Research questions will be investigated during Year One of this plan.
Questions include:
What messages are high school counselors giving to students about college, and in
particular, MJC?
What equity issues exist regarding foster youth, veterans and other
underrepresented populations?
What additional disparate impact exists in regard to gender and/or age?
What personal and family challenges contribute to low access and completion rates?
How do we identify and reach critical mass for students in a classroom (online and
Face-to-Face [FTF]) that encourages them to complete a course?
Is there sufficient instructional design support for faculty to incorporate strategies that
increase completion for underserved students?
Are courses offered at times and in modalities that meet the needs of students, with
particular attention focused on African American and Hispanic students (FTF, Hybrid,
weekend, evening, etc)?
What instructional methods are used in the classroom (online and FTF), particularly
in developmental courses?
What instructional methods are shown to increase student success and retention,
especially for students of color?
How do success and retention rates for compressed or accelerated courses compare
with regular course offerings?
In what ways can the college best leverage student support services and
instructional areas, including the Library and Learning Center, to best support
Student Equity efforts?
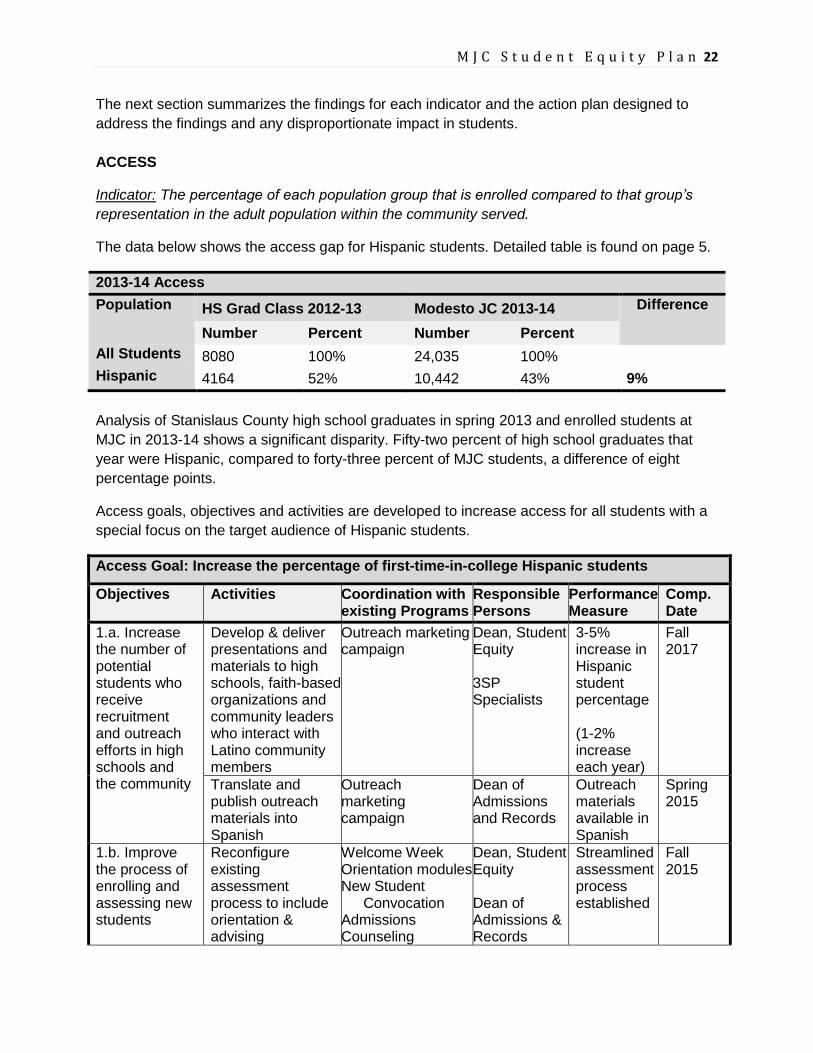
M J C S t u d e n t E q u i t y P l a n 22
The next section summarizes the findings for each indicator and the action plan designed to
address the findings and any disproportionate impact in students.
ACCESS
Indicator: The percentage of each population group that is enrolled compared to that group’s
representation in the adult population within the community served.
The data below shows the access gap for Hispanic students. Detailed table is found on page 5.
2013-14 Access
Population HS Grad Class 2012-13 Modesto JC 2013-14 Difference
Number Percent Number Percent
All Students 8080 100% 24,035 100%
Hispanic 4164 52% 10,442 43% 9%
Analysis of Stanislaus County high school graduates in spring 2013 and enrolled students at
MJC in 2013-14 shows a significant disparity. Fifty-two percent of high school graduates that
year were Hispanic, compared to forty-three percent of MJC students, a difference of eight
percentage points.
Access goals, objectives and activities are developed to increase access for all students with a
special focus on the target audience of Hispanic students.
Access Goal: Increase the percentage of first-time-in-college Hispanic students
Objectives Activities
Coordination with existing Programs
Responsible Persons
Performance Measure
Comp. Date
1.a. Increase the number of potential students who receive recruitment and outreach efforts in high schools and the community
Develop & deliver presentations and materials to high schools, faith-based organizations and community leaders who interact with Latino community members
Outreach marketing campaign
Dean, Student Equity 3SP Specialists
3-5% increase in Hispanic student percentage (1-2% increase each year)
Fall 2017
Translate and publish outreach materials into Spanish
Outreach marketing campaign
Dean of Admissions and Records
Outreach materials available in Spanish
Spring 2015
1.b. Improve the process of enrolling and assessing new students
Reconfigure existing assessment process to include orientation & advising
Welcome Week Orientation modules New Student
Convocation Admissions Counseling
Dean, Student Equity Dean of Admissions & Records
Streamlined assessment process established
Fall 2015
M J C S t u d e n t E q u i t y P l a n 23
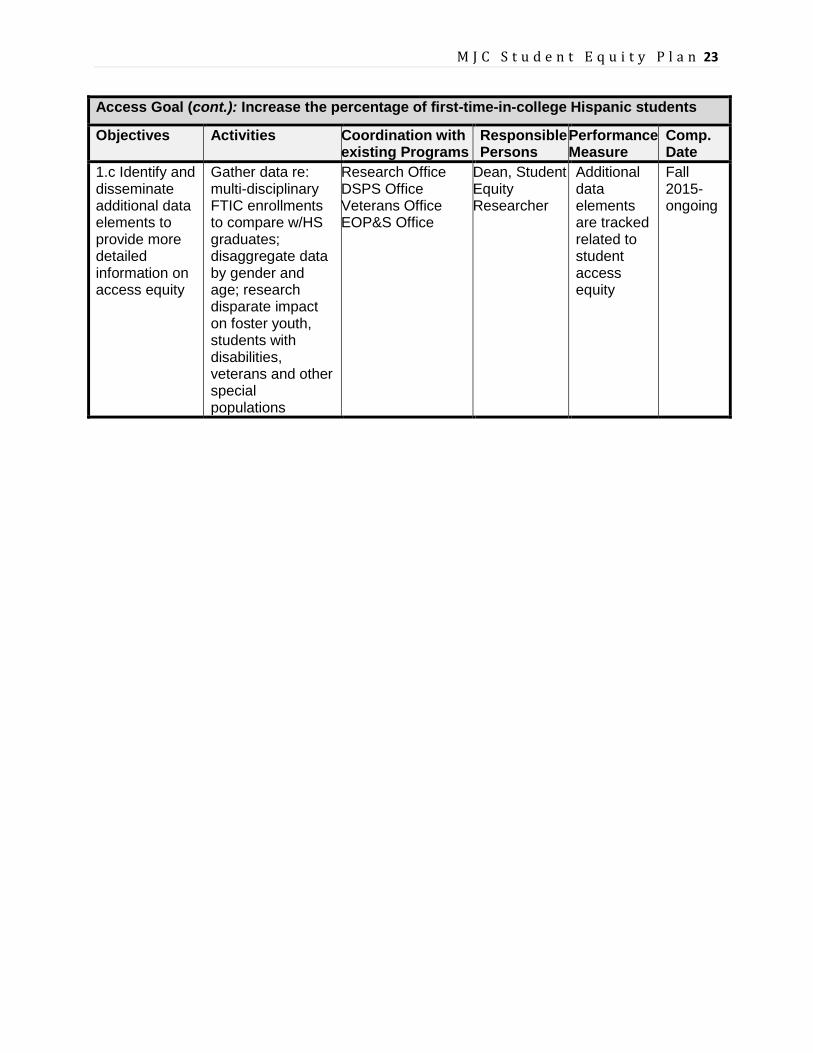
Access Goal (cont.): Increase the percentage of first-time-in-college Hispanic students
Objectives Activities Coordination with existing Programs
Responsible Persons
Performance Measure
Comp. Date
1.c Identify and disseminate additional data elements to provide more detailed information on access equity
Gather data re: multi-disciplinary FTIC enrollments to compare w/HS graduates; disaggregate data by gender and age; research disparate impact on foster youth, students with disabilities, veterans and other special populations
Research Office DSPS Office Veterans Office EOP&S Office
Dean, Student Equity Researcher
Additional data elements are tracked related to student access equity
Fall 2015-ongoing
M J C S t u d e n t E q u i t y P l a n 24
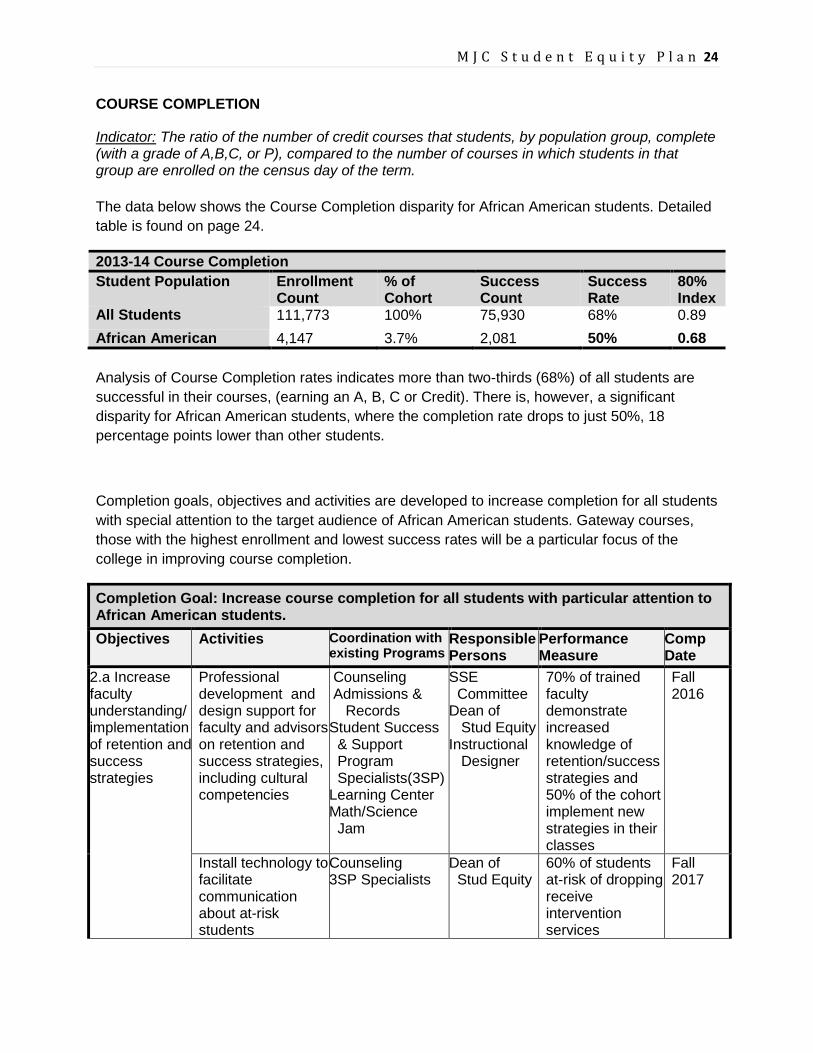
COURSE COMPLETION
Indicator: The ratio of the number of credit courses that students, by population group, complete (with a grade of A,B,C, or P), compared to the number of courses in which students in that group are enrolled on the census day of the term.
The data below shows the Course Completion disparity for African American students. Detailed
table is found on page 24.
2013-14 Course Completion
Student Population Enrollment Count
% of Cohort
Success Count
Success Rate
80% Index
All Students 111,773 100% 75,930 68% 0.89
African American 4,147 3.7% 2,081 50% 0.68
Analysis of Course Completion rates indicates more than two-thirds (68%) of all students are
successful in their courses, (earning an A, B, C or Credit). There is, however, a significant
disparity for African American students, where the completion rate drops to just 50%, 18
percentage points lower than other students.
Completion goals, objectives and activities are developed to increase completion for all students
with special attention to the target audience of African American students. Gateway courses,
those with the highest enrollment and lowest success rates will be a particular focus of the
college in improving course completion.
Completion Goal: Increase course completion for all students with particular attention to African American students.
Objectives Activities
Coordination with existing Programs
Responsible Persons
Performance Measure
Comp Date
2.a Increase faculty understanding/ implementation of retention and success strategies
Professional development and design support for faculty and advisors on retention and success strategies, including cultural competencies
Counseling Admissions & Records Student Success & Support Program Specialists(3SP) Learning Center Math/Science Jam
SSE Committee Dean of Stud Equity Instructional Designer
70% of trained faculty demonstrate increased knowledge of retention/success strategies and 50% of the cohort implement new strategies in their classes
Fall 2016
Install technology to facilitate communication about at-risk students
Counseling 3SP Specialists
Dean of Stud Equity
60% of students at-risk of dropping receive intervention services
Fall 2017

M J C S t u d e n t E q u i t y P l a n 25
Completion Goal (cont): Increase course completion for all students with particular attention to African American students.
Objectives Activities Coordination with existing Programs
Responsible Persons
Performance Measure
CompDate
2.b Develop new multi-disciplinary FTIC course
Sponsor 10 faculty to attend the national FYE Conference & best practice sites
Information Literacy workshops
SSE Committee Academic Senate Instructional Designer
Best practices identified and developed for FTIC course
Fall 2015
Faculty committee writes curriculum for new FTIC course
Information Literacy workshops Learning Center
SSE Committee Academic Senate Learning Center Dir.
FTIC course approved by Curriculum Committee
Spring 2015
2.c Increase completion in gateway courses
Examine pre- and co-requisites for key courses
Curriculum Committee
Academic Senate
Low completion pre-/co-requisites are revised
Spring 2016
Faculty develop a process for determining exit expectations for what students know, understand and do in gateway courses
Discipline faculty Outcomes Assessment Workgroup
Academic Senate Division Deans
70% of aligned gateway courses show increased and equitable completion
Fall 2017
2.d Identify additional data elements to provide more detailed information on completion equity
Gather data re: personal challenges that affect completion; disaggregated data by gender and age; research disparate impact on foster youth, students with disabilities, veterans and other special populations; compare compressed and accelerated completion rates with regular offerings
Research Office DSPS Office Veterans Office EOP&S Office
Dean, Student Equity Research Analyst
Additional data elements are tracked related to completion equity
Fall 2015
M J C S t u d e n t E q u i t y P l a n 26
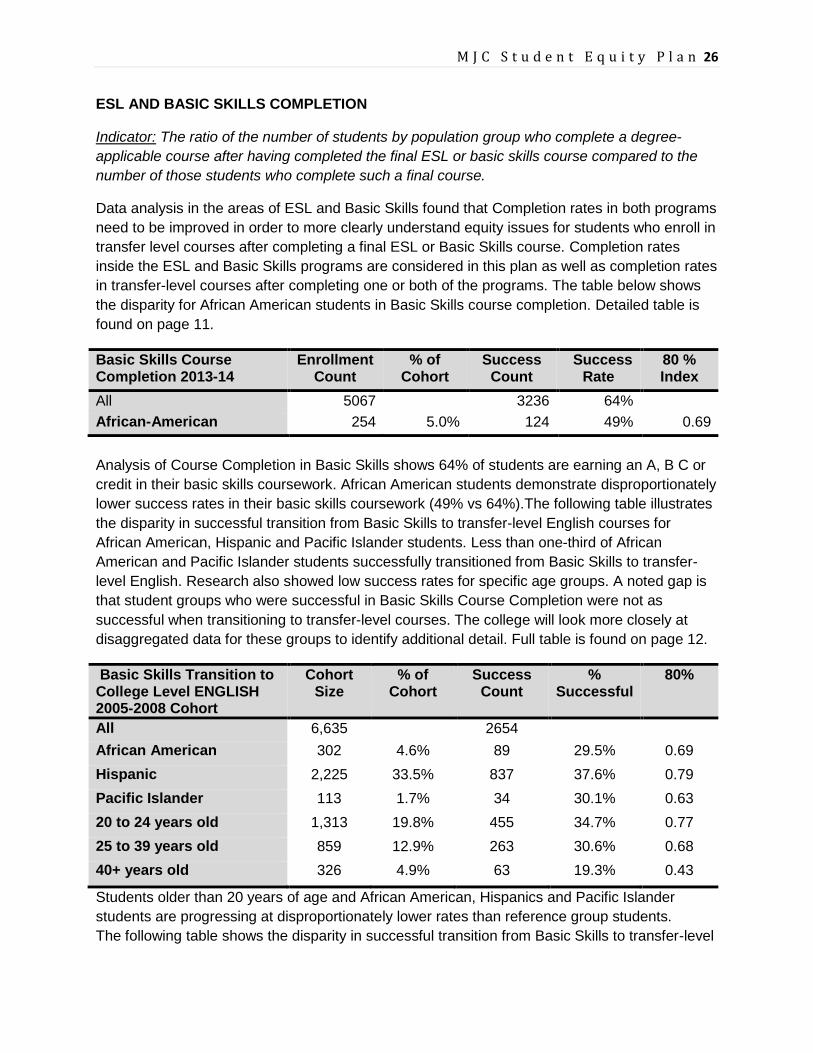
ESL AND BASIC SKILLS COMPLETION
Indicator: The ratio of the number of students by population group who complete a degree-
applicable course after having completed the final ESL or basic skills course compared to the
number of those students who complete such a final course.
Data analysis in the areas of ESL and Basic Skills found that Completion rates in both programs
need to be improved in order to more clearly understand equity issues for students who enroll in
transfer level courses after completing a final ESL or Basic Skills course. Completion rates
inside the ESL and Basic Skills programs are considered in this plan as well as completion rates
in transfer-level courses after completing one or both of the programs. The table below shows
the disparity for African American students in Basic Skills course completion. Detailed table is
found on page 11.
Basic Skills Course Completion 2013-14
Enrollment Count
% of Cohort
Success Count
Success Rate
80 % Index
All 5067 3236 64%
African-American 254 5.0% 124 49% 0.69
Analysis of Course Completion in Basic Skills shows 64% of students are earning an A, B C or
credit in their basic skills coursework. African American students demonstrate disproportionately
lower success rates in their basic skills coursework (49% vs 64%).The following table illustrates
the disparity in successful transition from Basic Skills to transfer-level English courses for
African American, Hispanic and Pacific Islander students. Less than one-third of African
American and Pacific Islander students successfully transitioned from Basic Skills to transfer-
level English. Research also showed low success rates for specific age groups. A noted gap is
that student groups who were successful in Basic Skills Course Completion were not as
successful when transitioning to transfer-level courses. The college will look more closely at
disaggregated data for these groups to identify additional detail. Full table is found on page 12.
Basic Skills Transition to College Level ENGLISH 2005-2008 Cohort
Cohort Size
% of Cohort
Success Count
% Successful
80%
All 6,635 2654
African American 302 4.6% 89 29.5% 0.69
Hispanic 2,225 33.5% 837 37.6% 0.79
Pacific Islander 113 1.7% 34 30.1% 0.63
20 to 24 years old 1,313 19.8% 455 34.7% 0.77
25 to 39 years old 859 12.9% 263 30.6% 0.68
40+ years old 326 4.9% 63 19.3% 0.43
Students older than 20 years of age and African American, Hispanics and Pacific Islander
students are progressing at disproportionately lower rates than reference group students.
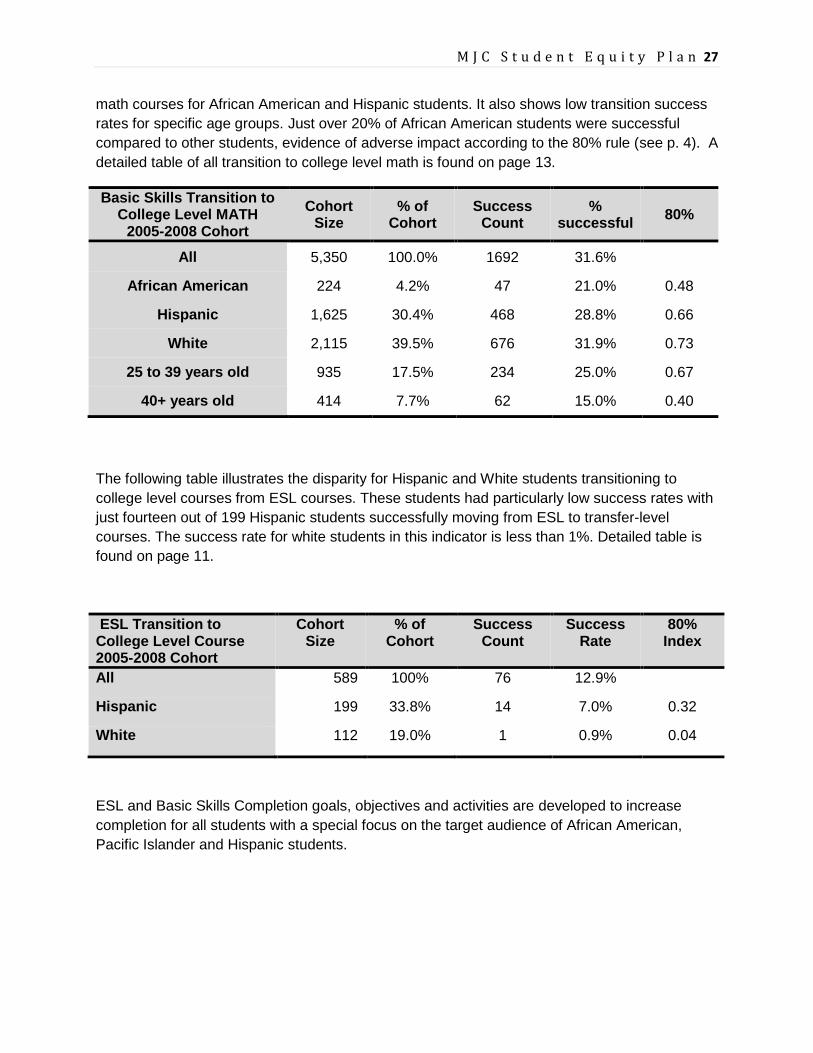
The following table shows the disparity in successful transition from Basic Skills to transfer-level
M J C S t u d e n t E q u i t y P l a n 27
math courses for African American and Hispanic students. It also shows low transition success
rates for specific age groups. Just over 20% of African American students were successful
compared to other students, evidence of adverse impact according to the 80% rule (see p. 4). A
detailed table of all transition to college level math is found on page 13.
Basic Skills Transition to College Level MATH
2005-2008 Cohort
Cohort Size
% of Cohort
Success Count
% successful
80%
All 5,350 100.0% 1692 31.6%
African American 224 4.2% 47 21.0% 0.48
Hispanic 1,625 30.4% 468 28.8% 0.66
White 2,115 39.5% 676 31.9% 0.73
25 to 39 years old 935 17.5% 234 25.0% 0.67
40+ years old 414 7.7% 62 15.0% 0.40
The following table illustrates the disparity for Hispanic and White students transitioning to
college level courses from ESL courses. These students had particularly low success rates with
just fourteen out of 199 Hispanic students successfully moving from ESL to transfer-level
courses. The success rate for white students in this indicator is less than 1%. Detailed table is
found on page 11.
ESL Transition to College Level Course 2005-2008 Cohort
Cohort Size
% of Cohort
Success Count
Success Rate
80% Index
All 589 100% 76 12.9%
Hispanic 199 33.8% 14 7.0% 0.32
White 112 19.0% 1 0.9% 0.04
ESL and Basic Skills Completion goals, objectives and activities are developed to increase
completion for all students with a special focus on the target audience of African American,
Pacific Islander and Hispanic students.
M J C S t u d e n t E q u i t y P l a n 28
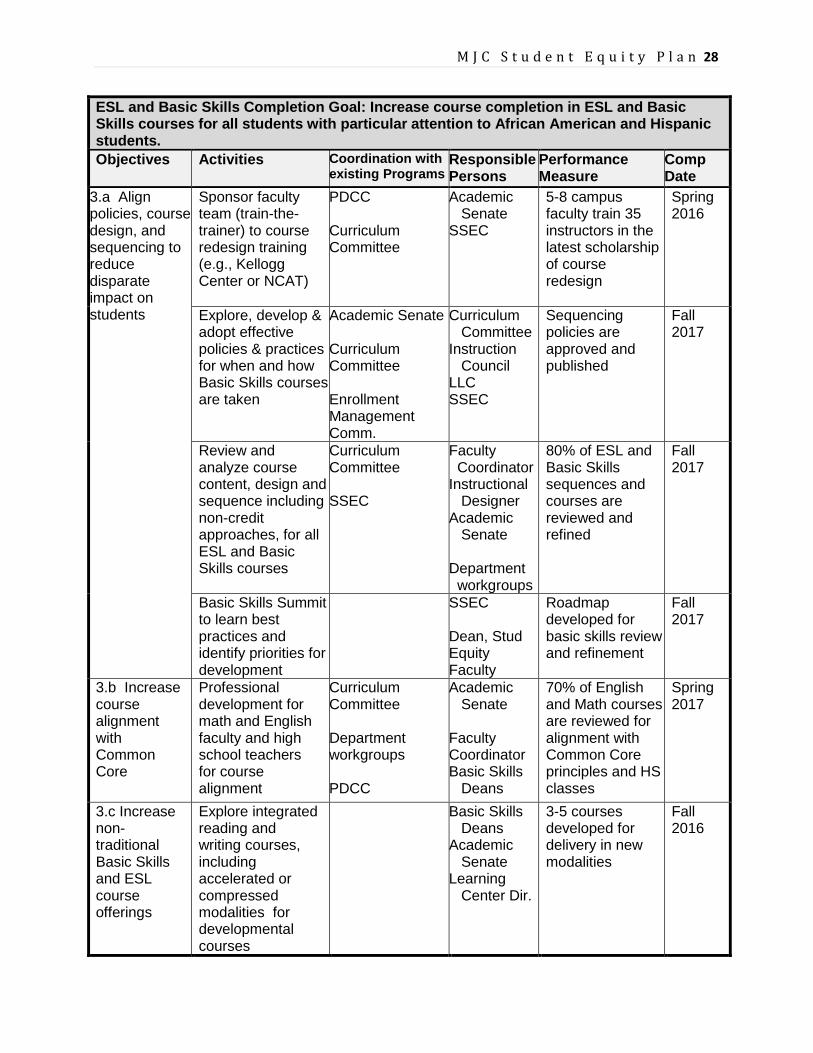
ESL and Basic Skills Completion Goal: Increase course completion in ESL and Basic Skills courses for all students with particular attention to African American and Hispanic students.
Objectives Activities
Coordination with existing Programs
Responsible Persons
Performance Measure
Comp Date
3.a Align policies, course design, and sequencing to reduce disparate impact on students
Sponsor faculty team (train-the-trainer) to course redesign training (e.g., Kellogg Center or NCAT)
PDCC Curriculum Committee
Academic Senate SSEC
5-8 campus faculty train 35 instructors in the latest scholarship of course redesign
Spring 2016
Explore, develop & adopt effective policies & practices for when and how Basic Skills courses are taken
Academic Senate Curriculum Committee Enrollment Management Comm.
Curriculum Committee Instruction Council LLC SSEC
Sequencing policies are approved and published
Fall 2017
Review and analyze course content, design and sequence including non-credit approaches, for all ESL and Basic Skills courses
Curriculum Committee SSEC
Faculty Coordinator Instructional Designer Academic Senate Department workgroups
80% of ESL and Basic Skills sequences and courses are reviewed and refined
Fall 2017
Basic Skills Summit to learn best practices and identify priorities for development
SSEC Dean, Stud Equity Faculty
Roadmap developed for basic skills review and refinement
Fall 2017
3.b Increase course alignment with Common Core
Professional development for math and English faculty and high school teachers for course alignment
Curriculum Committee Department workgroups PDCC
Academic Senate Faculty Coordinator Basic Skills Deans
70% of English and Math courses are reviewed for alignment with Common Core principles and HS classes
Spring 2017
3.c Increase non-traditional Basic Skills and ESL course offerings
Explore integrated reading and writing courses, including accelerated or compressed modalities for developmental courses
Basic Skills Deans Academic Senate Learning Center Dir.
3-5 courses developed for delivery in new modalities
Fall 2016
M J C S t u d e n t E q u i t y P l a n 29
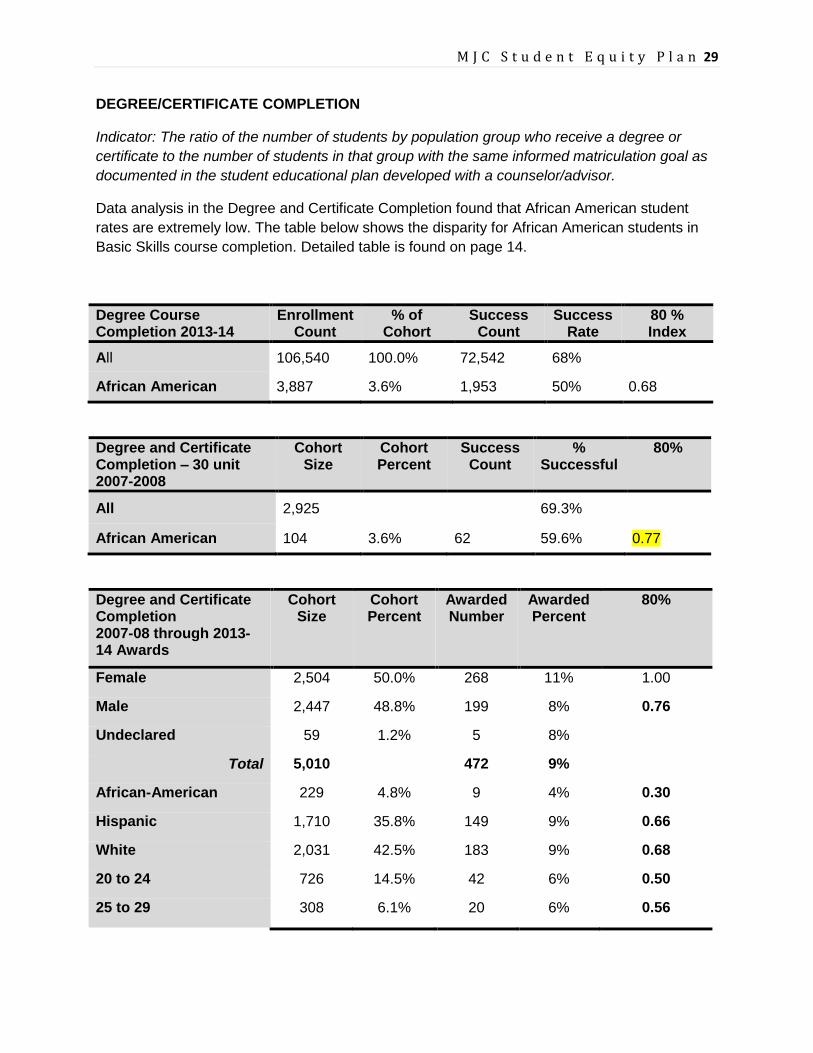
DEGREE/CERTIFICATE COMPLETION
Indicator: The ratio of the number of students by population group who receive a degree or
certificate to the number of students in that group with the same informed matriculation goal as
documented in the student educational plan developed with a counselor/advisor.
Data analysis in the Degree and Certificate Completion found that African American student
rates are extremely low. The table below shows the disparity for African American students in
Basic Skills course completion. Detailed table is found on page 14.
Degree Course Completion 2013-14
Enrollment Count
% of Cohort
Success Count
Success Rate
80 % Index
All 106,540 100.0% 72,542 68%
African American 3,887 3.6% 1,953 50% 0.68
Degree and Certificate Completion – 30 unit 2007-2008
Cohort Size
Cohort Percent
Success Count
% Successful
80%
All 2,925
69.3%
African American 104 3.6% 62 59.6% 0.77
Degree and Certificate Completion 2007-08 through 2013-14 Awards
Cohort Size
Cohort Percent
Awarded Number
Awarded Percent
80%
Female 2,504 50.0% 268 11% 1.00
Male 2,447 48.8% 199 8% 0.76
Undeclared 59 1.2% 5 8%
Total 5,010 472 9%
African-American 229 4.8% 9 4% 0.30
Hispanic 1,710 35.8% 149 9% 0.66
White 2,031 42.5% 183 9% 0.68
20 to 24 726 14.5% 42 6% 0.50
25 to 29 308 6.1% 20 6% 0.56
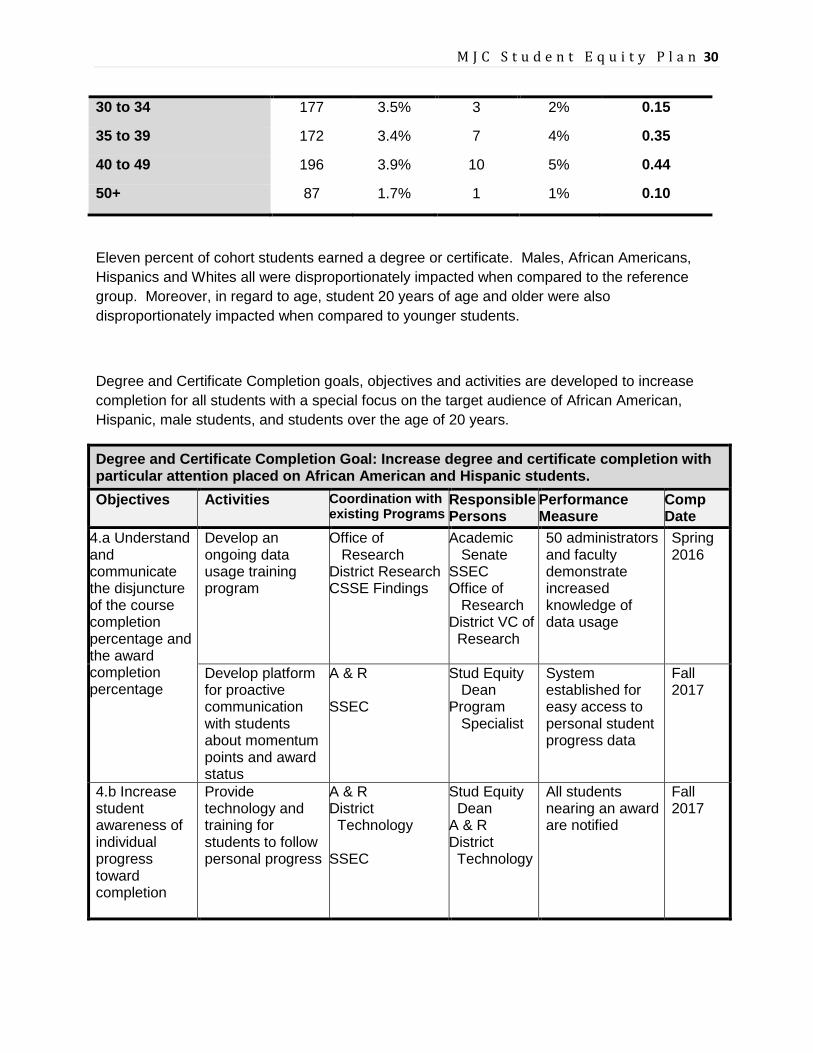
M J C S t u d e n t E q u i t y P l a n 30
30 to 34 177 3.5% 3 2% 0.15
35 to 39 172 3.4% 7 4% 0.35
40 to 49 196 3.9% 10 5% 0.44
50+ 87 1.7% 1 1% 0.10
Eleven percent of cohort students earned a degree or certificate. Males, African Americans,
Hispanics and Whites all were disproportionately impacted when compared to the reference
group. Moreover, in regard to age, student 20 years of age and older were also
disproportionately impacted when compared to younger students.
Degree and Certificate Completion goals, objectives and activities are developed to increase
completion for all students with a special focus on the target audience of African American,
Hispanic, male students, and students over the age of 20 years.
Degree and Certificate Completion Goal: Increase degree and certificate completion with particular attention placed on African American and Hispanic students.
Objectives Activities
Coordination with existing Programs
Responsible Persons
Performance Measure
Comp Date
4.a Understand and communicate the disjuncture of the course completion percentage and the award completion percentage
Develop an ongoing data usage training program
Office of Research District Research CSSE Findings
Academic Senate SSEC Office of Research District VC of Research
50 administrators and faculty demonstrate increased knowledge of data usage
Spring 2016
Develop platform for proactive communication with students about momentum points and award status
A & R SSEC
Stud Equity Dean Program Specialist
System established for easy access to personal student progress data
Fall 2017
4.b Increase student awareness of individual progress toward completion
Provide technology and training for students to follow personal progress
A & R District Technology SSEC
Stud Equity Dean A & R District Technology
All students nearing an award are notified
Fall 2017
M J C S t u d e n t E q u i t y P l a n 31
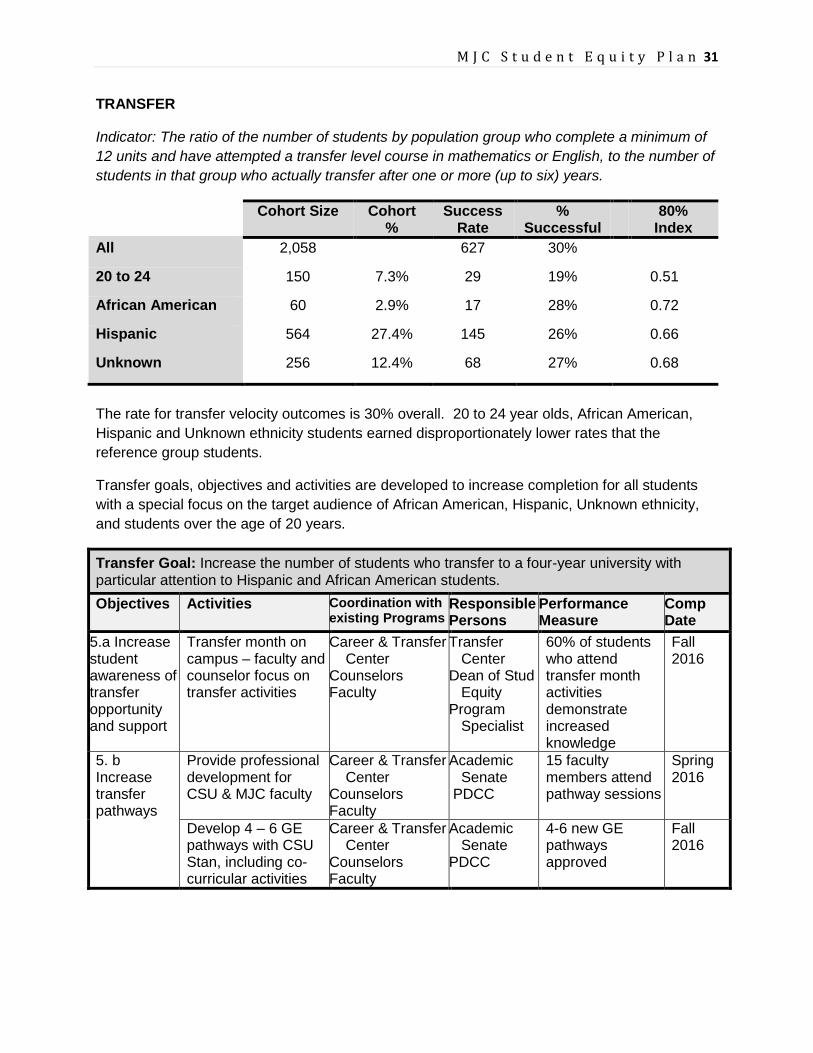
TRANSFER
Indicator: The ratio of the number of students by population group who complete a minimum of
12 units and have attempted a transfer level course in mathematics or English, to the number of
students in that group who actually transfer after one or more (up to six) years.
Cohort Size Cohort %
Success Rate
% Successful
80% Index
All 2,058 627 30%
20 to 24 150 7.3% 29 19% 0.51
African American 60 2.9% 17 28% 0.72
Hispanic 564 27.4% 145 26% 0.66
Unknown 256 12.4% 68 27% 0.68
The rate for transfer velocity outcomes is 30% overall. 20 to 24 year olds, African American,
Hispanic and Unknown ethnicity students earned disproportionately lower rates that the
reference group students.
Transfer goals, objectives and activities are developed to increase completion for all students
with a special focus on the target audience of African American, Hispanic, Unknown ethnicity,
and students over the age of 20 years.
Transfer Goal: Increase the number of students who transfer to a four-year university with particular attention to Hispanic and African American students.
Objectives Activities
Coordination with existing Programs
Responsible Persons
Performance Measure
Comp Date
5.a Increase student awareness of transfer opportunity and support
Transfer month on campus – faculty and counselor focus on transfer activities
Career & Transfer Center Counselors Faculty
Transfer Center Dean of Stud Equity Program Specialist
60% of students who attend transfer month activities demonstrate increased knowledge
Fall 2016
5. b Increase transfer pathways
Provide professional development for CSU & MJC faculty
Career & Transfer Center Counselors Faculty
Academic Senate PDCC
15 faculty members attend pathway sessions
Spring 2016
Develop 4 – 6 GE pathways with CSU Stan, including co-curricular activities
Career & Transfer Center Counselors Faculty
Academic Senate PDCC
4-6 new GE pathways approved
Fall 2016

M J C S t u d e n t E q u i t y P l a n 32
Section E. Budget
MJC Student Equity Budget - 2015 DRAFT
Line Item Expenditure Cost Goal Description
Salaries for are estimated for 7 months Year One. They will be 12 month salaries beginning Year Two.
1000 - Academic Salaries
Dean, Success & Equity (.5 FTE) (shared with SSSP) $31,209 All Goals Implement Student Equity Plan activities
Instructional Designer (1 FTE) $24,778 All Goals
Experienced Instructional Designer to work with faculty to reimagine, modify and create courses through evidence-based practices that increase retention and completion for students of color.
Faculty Coordinator - Basic Skills (1 FTE) $24,778
ESL/Basic Skills
Coordinate professional development and training for faculty related to Basic Skills and ESL
Faculty Spring &Summer Stipends for Outcomes Assessment Workgroup and Program Review Workgroup. $10,000
Completion, Degree/ Certificate Completion
Program Review Workgroup will develop a college-wide process to include Student Equity measures in Program Review; Outcomes Assessment Workgroup will develop a college plan to align Student Equity issues with SLO processes.
Faculty Spring &Summer Stipends for professional development activities and responsibilities following training: multi-disciplinary FTIC team (10 faculty); Basic Skills/ESL team (15 faculty); Campus data coaches (7 faculty) $1,250 x 32 =$40,000 $40,000
Access, Completion, Basic Skills & ESL
Faculty who return from training will 1) identify effective practices and methods to address and improve outcomes for underserved students; 2) train additional faculty; 3) lead workgroups to develop new approaches. Data coaches will train others in understanding and using data at the program level to identify and address the needs of disproportionately impacted students.
Faculty Summer Stipends for PT and FT faculty to review disproportionate impact in their programs and identify ways to improve outcomes for underserved students. 120 faculty @$500 each. $60,000
Completion, Basic Skills & ESL, Degree/ Certificate Completion/Transfer
Events for FT and PT faculty from multiple programs to participate in workgroups: 1) training in: understanding data, specific needs of students of color, and best practices; 2) identify root causes and develop classroom or curricular strategies to improve outcomes and completion for underserved students; 3) identify measures to evaluate progress including in Program Review; 4) produce plan for course and program levels w/timeline for implementation & evaluation metrics.
M J C S t u d e n t E q u i t y P l a n 33
Line Item Expenditure Cost Goal Description
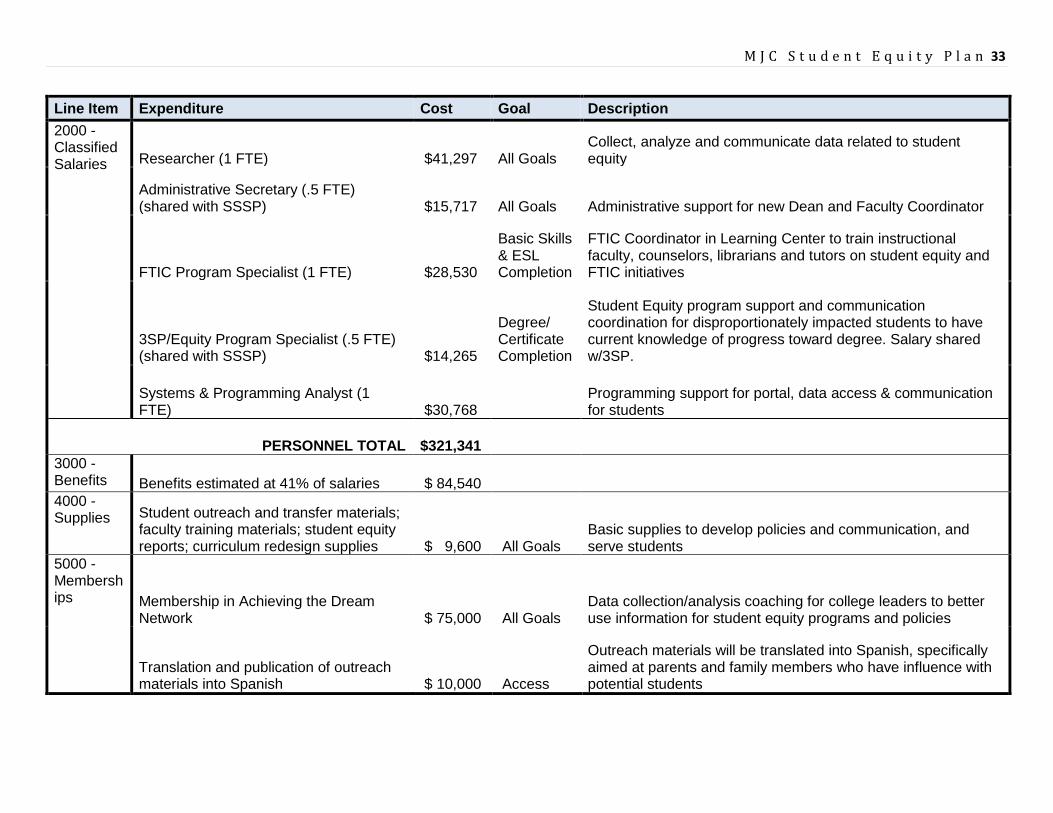
2000 - Classified Salaries Researcher (1 FTE) $41,297 All Goals
Collect, analyze and communicate data related to student equity
Administrative Secretary (.5 FTE) (shared with SSSP) $15,717 All Goals Administrative support for new Dean and Faculty Coordinator
FTIC Program Specialist (1 FTE) $28,530
Basic Skills & ESL Completion
FTIC Coordinator in Learning Center to train instructional faculty, counselors, librarians and tutors on student equity and FTIC initiatives
3SP/Equity Program Specialist (.5 FTE) (shared with SSSP) $14,265
Degree/ Certificate Completion
Student Equity program support and communication coordination for disproportionately impacted students to have current knowledge of progress toward degree. Salary shared w/3SP.
Systems & Programming Analyst (1 FTE) $30,768
Programming support for portal, data access & communication for students
PERSONNEL TOTAL $321,341
3000 - Benefits Benefits estimated at 41% of salaries $ 84,540
4000 - Supplies Student outreach and transfer materials;
faculty training materials; student equity reports; curriculum redesign supplies $ 9,600 All Goals
Basic supplies to develop policies and communication, and serve students
5000 - Memberships Membership in Achieving the Dream
Network $ 75,000 All Goals Data collection/analysis coaching for college leaders to better use information for student equity programs and policies
Translation and publication of outreach materials into Spanish $ 10,000 Access
Outreach materials will be translated into Spanish, specifically aimed at parents and family members who have influence with potential students
M J C S t u d e n t E q u i t y P l a n 34
Line Item Expenditure Cost Goal Description
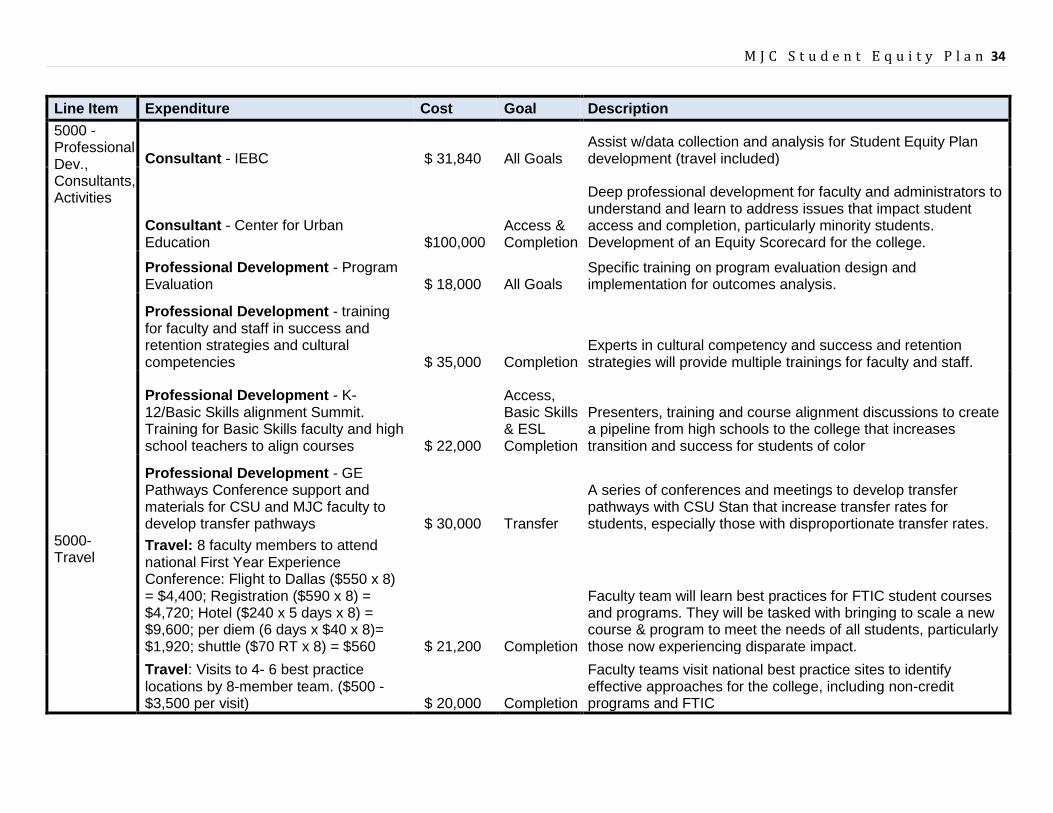
5000 - Professional Dev., Consultants, Activities
Consultant - IEBC $ 31,840 All Goals Assist w/data collection and analysis for Student Equity Plan development (travel included)
Consultant - Center for Urban Education $100,000
Access & Completion
Deep professional development for faculty and administrators to understand and learn to address issues that impact student access and completion, particularly minority students. Development of an Equity Scorecard for the college.
Professional Development - Program Evaluation $ 18,000 All Goals
Specific training on program evaluation design and implementation for outcomes analysis.
Professional Development - training for faculty and staff in success and retention strategies and cultural competencies $ 35,000 Completion
Experts in cultural competency and success and retention strategies will provide multiple trainings for faculty and staff.
Professional Development - K-12/Basic Skills alignment Summit. Training for Basic Skills faculty and high school teachers to align courses $ 22,000
Access, Basic Skills & ESL Completion
Presenters, training and course alignment discussions to create a pipeline from high schools to the college that increases transition and success for students of color
Professional Development - GE Pathways Conference support and materials for CSU and MJC faculty to develop transfer pathways $ 30,000 Transfer
A series of conferences and meetings to develop transfer pathways with CSU Stan that increase transfer rates for students, especially those with disproportionate transfer rates.
5000- Travel
Travel: 8 faculty members to attend national First Year Experience Conference: Flight to Dallas ($550 x 8) = $4,400; Registration ($590 x 8) = $4,720; Hotel ($240 x 5 days x 8) = $9,600; per diem (6 days x $40 x 8)= $1,920; shuttle ($70 RT x 8) = $560 $ 21,200 Completion
Faculty team will learn best practices for FTIC student courses and programs. They will be tasked with bringing to scale a new course & program to meet the needs of all students, particularly those now experiencing disparate impact.
Travel: Visits to 4- 6 best practice locations by 8-member team. ($500 - $3,500 per visit) $ 20,000 Completion
Faculty teams visit national best practice sites to identify effective approaches for the college, including non-credit programs and FTIC
M J C S t u d e n t E q u i t y P l a n 35
Line Item Expenditure Cost Goal Description
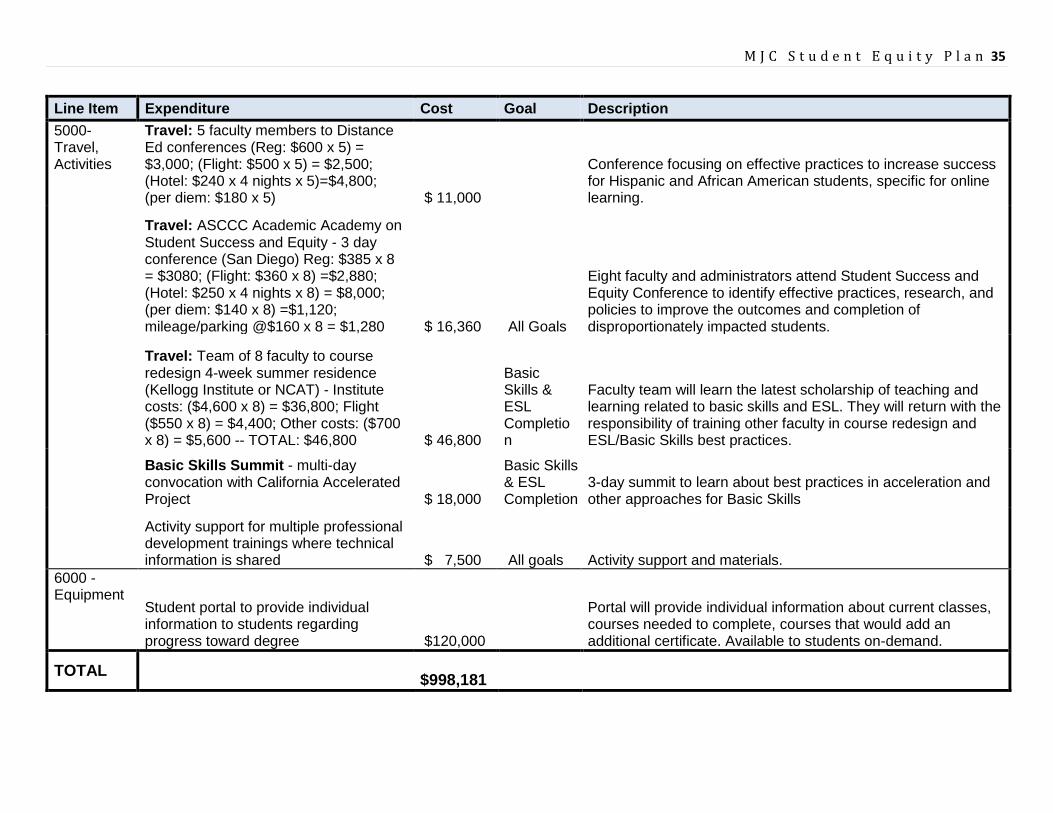
5000- Travel, Activities
Travel: 5 faculty members to Distance Ed conferences (Reg: $600 x 5) = $3,000; (Flight: $500 x 5) = $2,500; (Hotel: $240 x 4 nights x 5)=$4,800; (per diem: $180 x 5) $ 11,000
Conference focusing on effective practices to increase success for Hispanic and African American students, specific for online learning.
Travel: ASCCC Academic Academy on Student Success and Equity - 3 day conference (San Diego) Reg: $385 x 8 = $3080; (Flight: $360 x 8) =$2,880; (Hotel: $250 x 4 nights x 8) = $8,000; (per diem: $140 x 8) =$1,120; mileage/parking @$160 x 8 = $1,280 $ 16,360 All Goals
Eight faculty and administrators attend Student Success and Equity Conference to identify effective practices, research, and policies to improve the outcomes and completion of disproportionately impacted students.
Travel: Team of 8 faculty to course redesign 4-week summer residence (Kellogg Institute or NCAT) - Institute costs: ($4,600 x 8) = $36,800; Flight ($550 x 8) = $4,400; Other costs: ($700 x 8) = $5,600 -- TOTAL: $46,800 $ 46,800
Basic Skills & ESL Completion
Faculty team will learn the latest scholarship of teaching and learning related to basic skills and ESL. They will return with the responsibility of training other faculty in course redesign and ESL/Basic Skills best practices.
Basic Skills Summit - multi-day convocation with California Accelerated Project $ 18,000
Basic Skills & ESL Completion
3-day summit to learn about best practices in acceleration and other approaches for Basic Skills
Activity support for multiple professional development trainings where technical information is shared $ 7,500 All goals Activity support and materials.
6000 - Equipment
Student portal to provide individual information to students regarding progress toward degree $120,000
Portal will provide individual information about current classes, courses needed to complete, courses that would add an additional certificate. Available to students on-demand.
TOTAL
$998,181