Embed Size (px)
Citation preview
TNO Quality of Life
Modern techniques to assessshelf life and safety
Erik Hoornstra
2
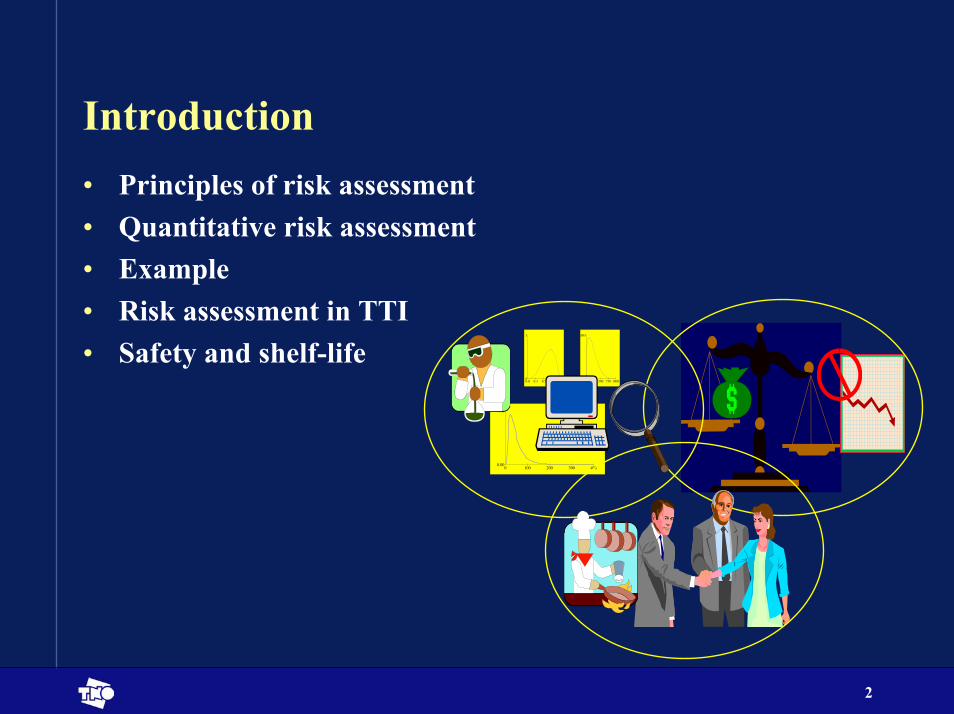
Introduction
0
3
0.0 0.3 0.5 0.8 1.0.000
.003
0 250 500 750 1000
0.00
0.02
0 100 200 300 400
• Principles of risk assessment• Quantitative risk assessment• Example• Risk assessment in TTI• Safety and shelf-life
3
TNO Department Microbiology• Research during product and process innovation• Novel preservation strategies
• Testing and Validation• European Hygienic Engineering and Design Group
(EHEDG) certified test laboratory
• Trouble-shooting and emergencies (24 hour service)• Rapid detection tools• New developments: genomics & metabolomics
4
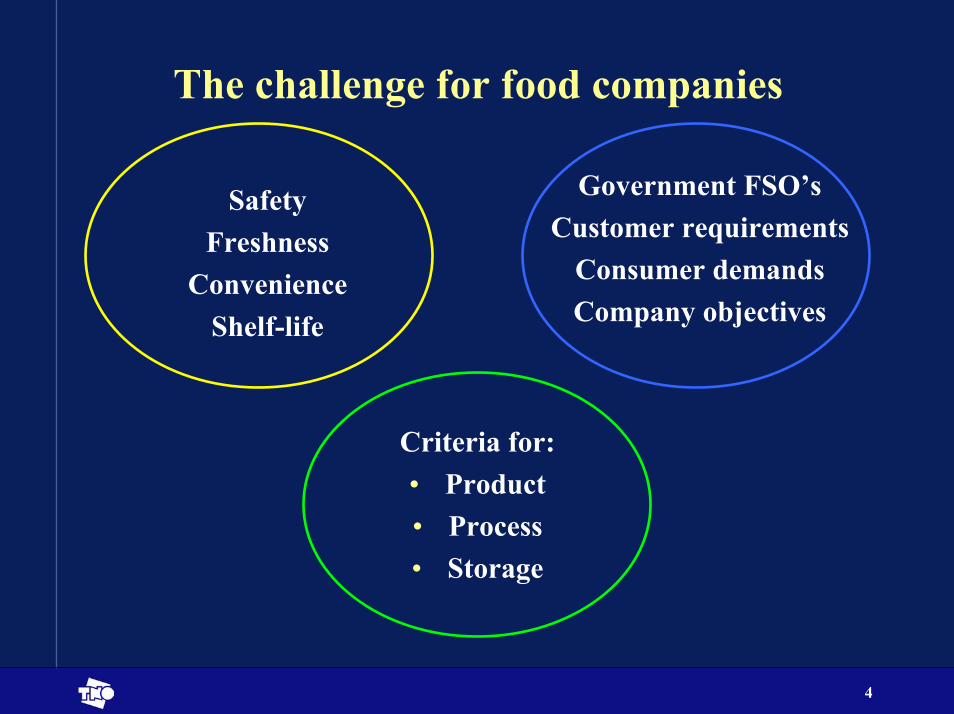
The challenge for food companies
SafetyFreshness
ConvenienceShelf-life
Government FSO’sCustomer requirements
Consumer demandsCompany objectives
Criteria for:• Product• Process• Storage
5
Question
What is safe food ?
6
Why define safe foodEU• “The free movement of safe and wholesome food …”• “Food shall not be placed on the market if it is unsafe”• “A high level of protection of human life and health …”• “… free movement … only if food safety requirements do not differ
from Member State to Member State”• “The Community has chosen a high level of health protection …”
7
Other aspects of defining safe foodEU• “It is necessary to ensure that consumers, other stakeholders and
trading partners have confidence in the decision making process …”• “… risk analysis provides a systematic methodology for the
determination of effective, proportionate and targeted measures to protect health …”
• “… scientific risk assessment alone cannot provide all the information on which a risk management decision should be based …societal, economic, traditional, ethical and environmental factors and thefeasibility of controls”
• Precautionary principle: risk is identified but unknown / uncertainty
8
Who should define food safetyEU• “… the European Food Safety Authority should provide a
comprehensive independent scientific view of the safety of the food …”• “ EFSA should be able to commission scientific studies …”
Remember• Defining food safety is a political issue
9
Safe foodEU• Unsafe = “Injurious to health”• Unsafe = “Unfit for human consumption”• “… normal conditions of use of the food by the consumer and at each stage
of production, processing and distribution”• “… information provided to the consumer … information on label …”• “… according to its intended use.”• “… any food which is unsafe is part of a batch … all food in that batch is
unsafe, unless … detailed assessment …”• “Traceability: Identify any person from whom they have been supplied …”
10
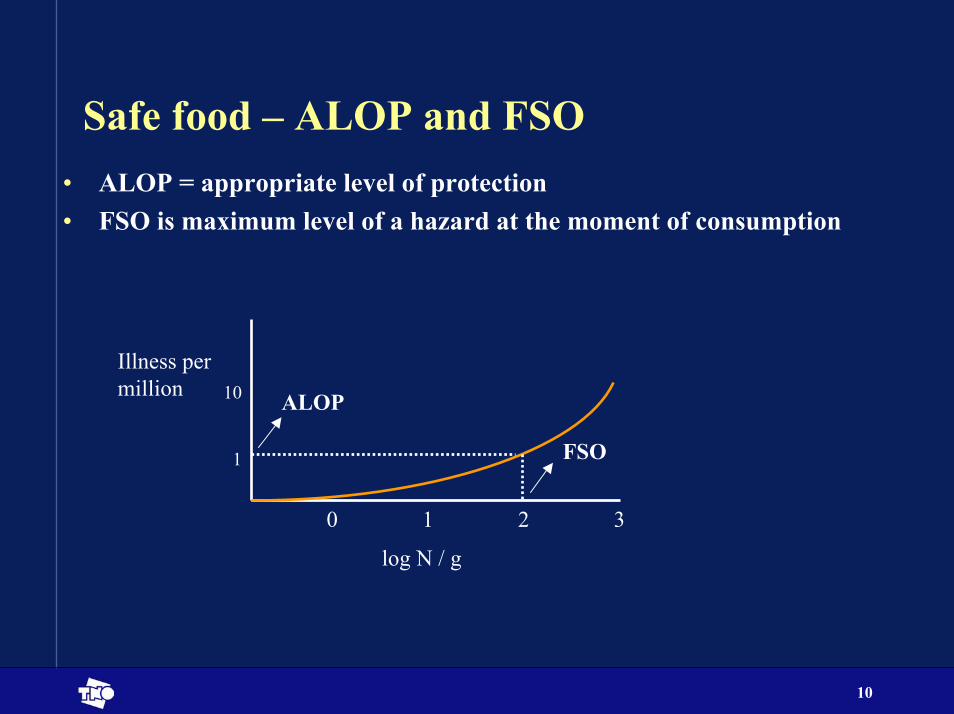
Safe food – ALOP and FSO• ALOP = appropriate level of protection• FSO is maximum level of a hazard at the moment of consumption
Illness per million
log N / g
10
1
0 1 2 3
ALOP
FSO
11
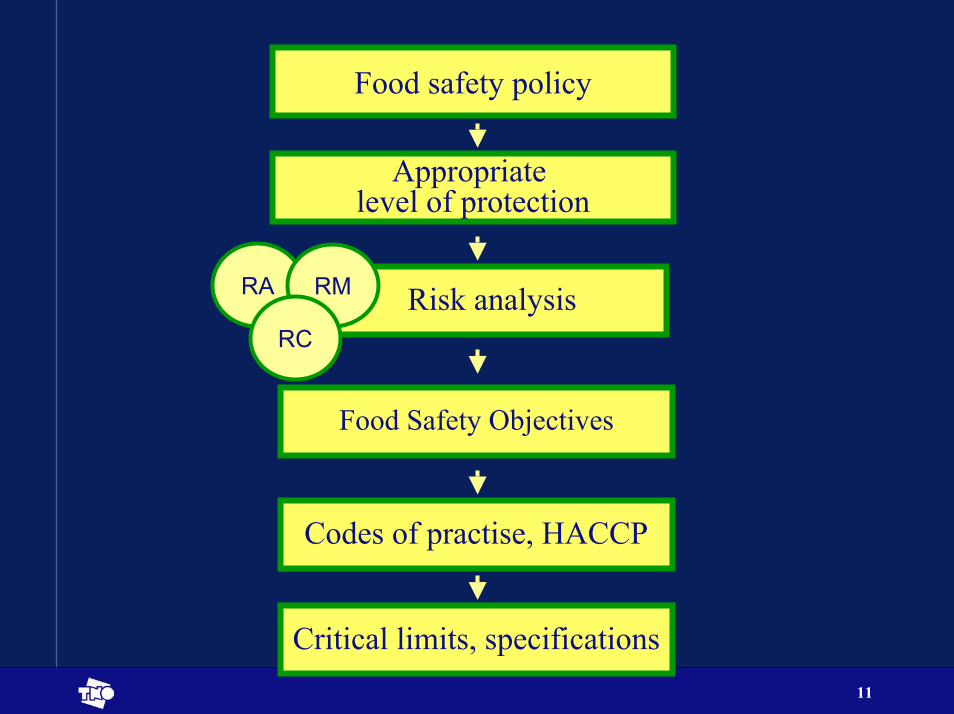
Food safety policy
Appropriate level of protection
RA RM Risk analysisRC
Food Safety Objectives
Codes of practise, HACCP
Critical limits, specifications
12
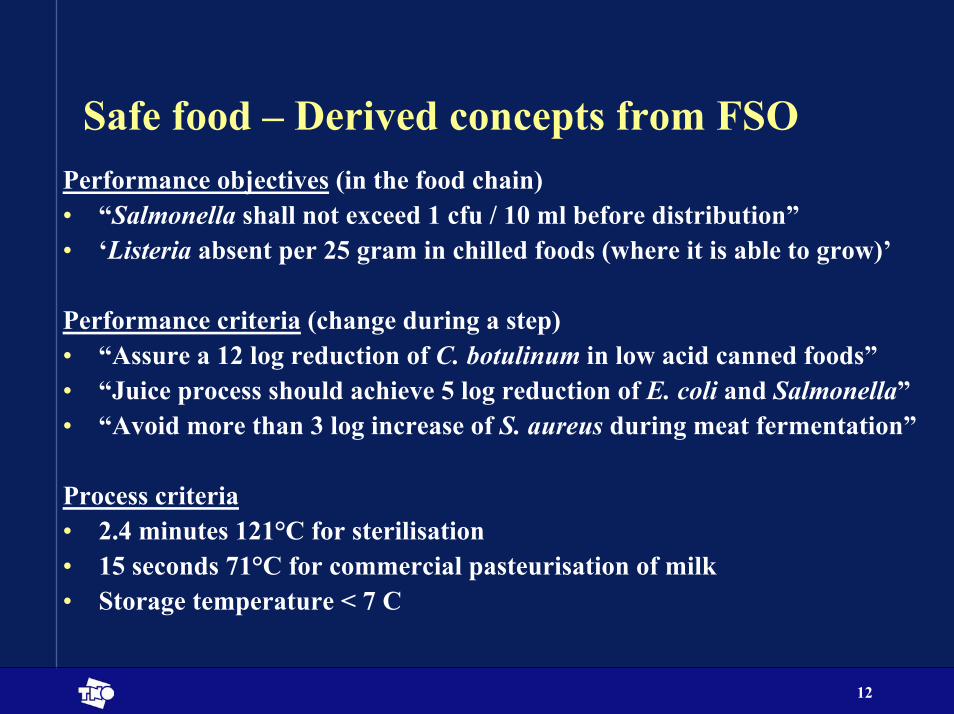
Safe food – Derived concepts from FSOPerformance objectives (in the food chain)• “Salmonella shall not exceed 1 cfu / 10 ml before distribution”• ‘Listeria absent per 25 gram in chilled foods (where it is able to grow)’
Performance criteria (change during a step)• “Assure a 12 log reduction of C. botulinum in low acid canned foods”• “Juice process should achieve 5 log reduction of E. coli and Salmonella”• “Avoid more than 3 log increase of S. aureus during meat fermentation”
Process criteria• 2.4 minutes 121°C for sterilisation• 15 seconds 71°C for commercial pasteurisation of milk• Storage temperature < 7 C
13
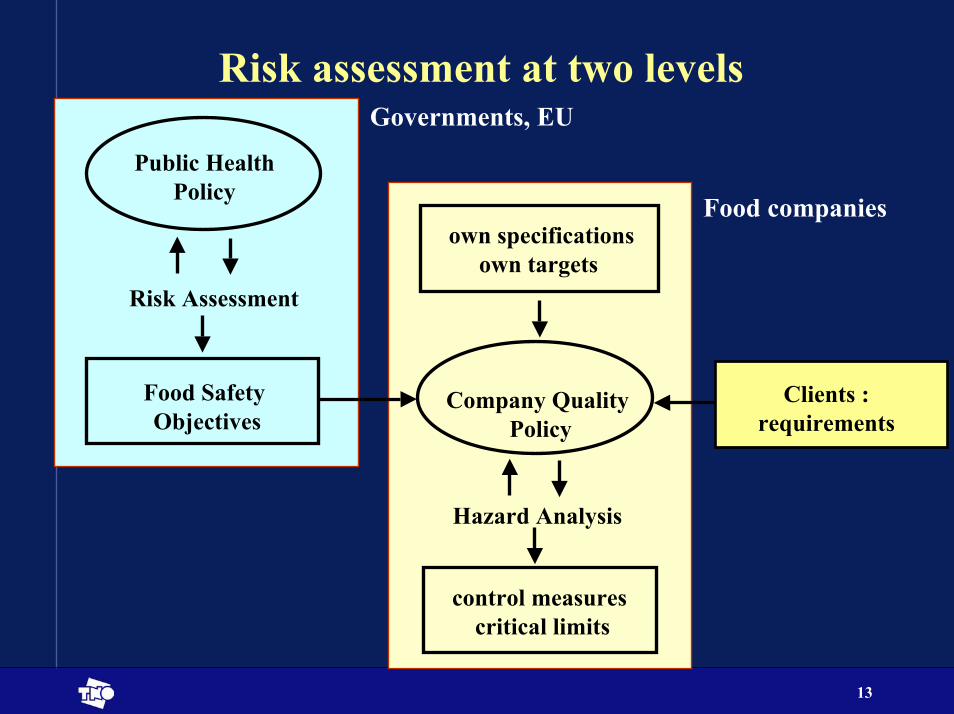
Risk assessment at two levelsGovernments, EU
Public HealthPolicy
Food SafetyObjectives
Risk Assessment
Food companies
control measurescritical limits
own specificationsown targets
Company QualityPolicy
Hazard Analysis
Clients : requirements
14
Risk analysis
0
3
0.0 0.3 0.5 0.8 1.0.000
.003
0 250 500 750 1000
0.00
0.02
0 100 200 300 400
15
Hazard identificationGovernment• Epidemiology• (Public) opinion
Food company• Raw materials• Production process• Product: complaints, history 0
3
0.0 0.3 0.5 0.8 1.0.000
.003
0 250 500 750 1000
0.00
0.02
0 100 200 300 400
16
Hazard characterizationGovernment• Dose-response relation
• Virulence of microorganism• Consumer sensitivity
Food company• Criteria
• Food Safety Objectives• Legislation• Specifications
0
3
0.0 0.3 0.5 0.8 1.0.000
.003
0 250 500 750 1000
0.00
0.02
0 100 200 300 400
17
Exposure assessment
• Risk factors• Occurrence in raw materials• Growth• Inactivation• Mixing, portioning• Recontamination
• Quantification• Single point: worst-case• Single point: what if• Probability distribution functions
0
3
0.0 0.3 0.5 0.8 1.0.000
.003
0 250 500 750 1000
0.00
0.02
0 100 200 300 400
18
Risk characterization
• Risk estimate: 0………1• Risk classes: f (occurrence, severity)• Risk profile• Prioritize control measures• Scenario analyses• Uncertainty and variability
0
3
0.0 0.3 0.5 0.8 1.0.000
.003
0 250 500 750 1000
0.00
0.02
0 100 200 300 400
19
Learnings from first years of experience using QRA (negative)
• Quantitative risk assessment may be time consuming• Sometimes trivial results• Uncertainty about risk factors• Results difficult to understand by managers• Lack of data• Do we really understand what is going on
20
Learnings from first years of experience using QRA (positive)
• Zero risk does not exist• Quantification gives a lot of insight• Uncertainty and variability• List most important risk factors• Scenario analysis for efficient improvements• Meaningful sampling
QRA
21
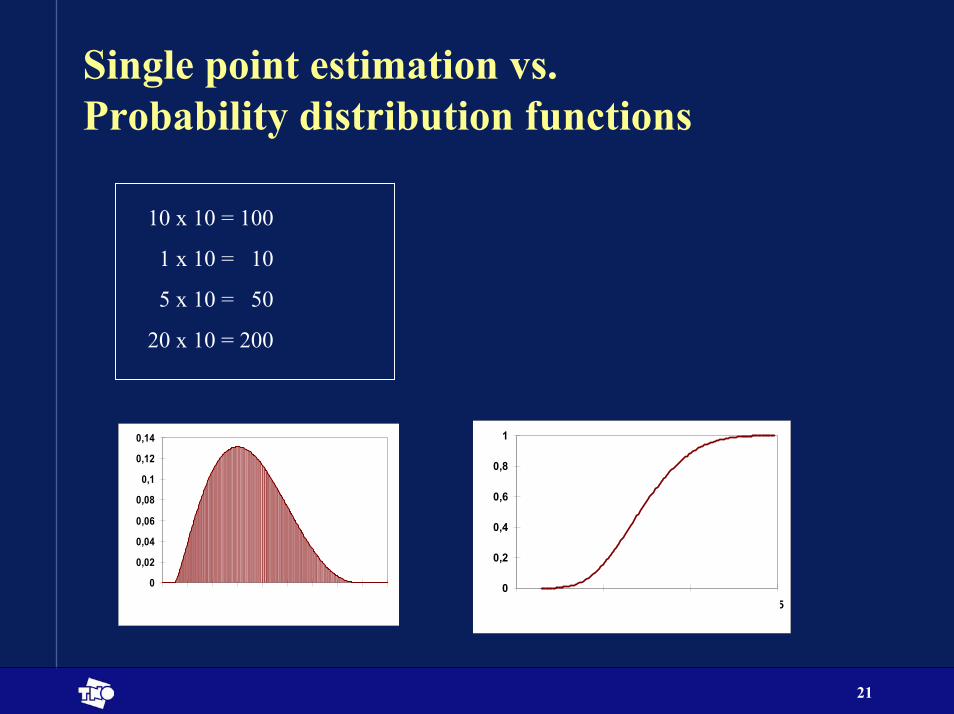
Single point estimation vs.Probability distribution functions
10 x 10 = 100
1 x 10 = 10
5 x 10 = 50
20 x 10 = 200
0
0,2
0,4
0,6
0,8
1
50 65 80 95
0
0,02
0,04
0,06
0,08
0,1
0,12
0,14
4 6 8 10 12 14 16 18 20 22
22
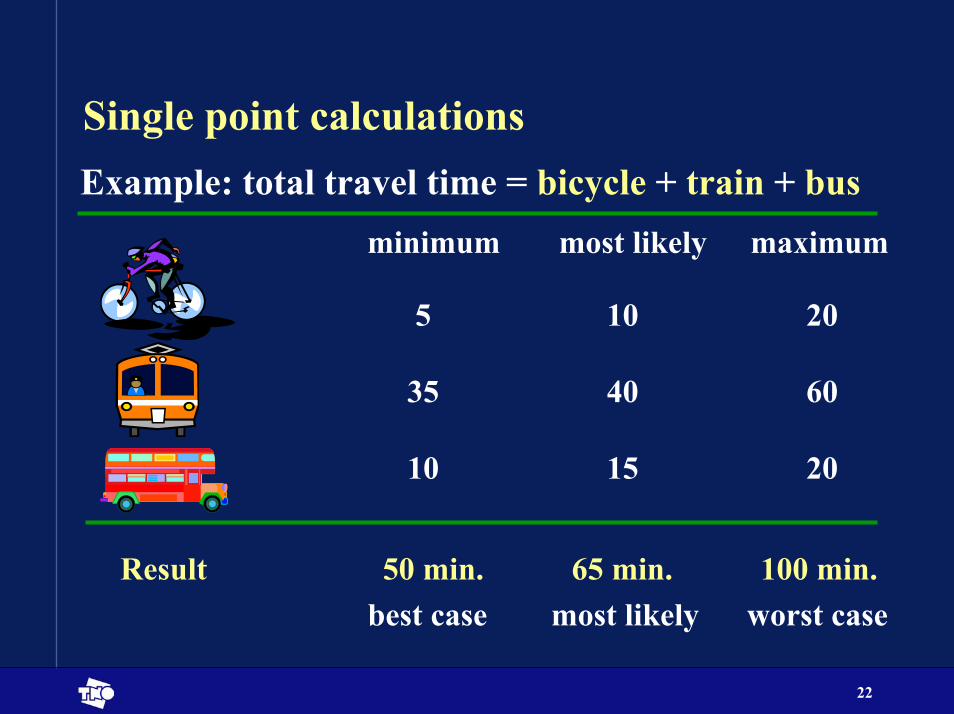
Single point calculationsExample: total travel time = bicycle + train + bus
minimum most likely maximum
5 10 20
35 40 60
10 15 20
Result 50 min. 65 min. 100 min.best case most likely worst case
23
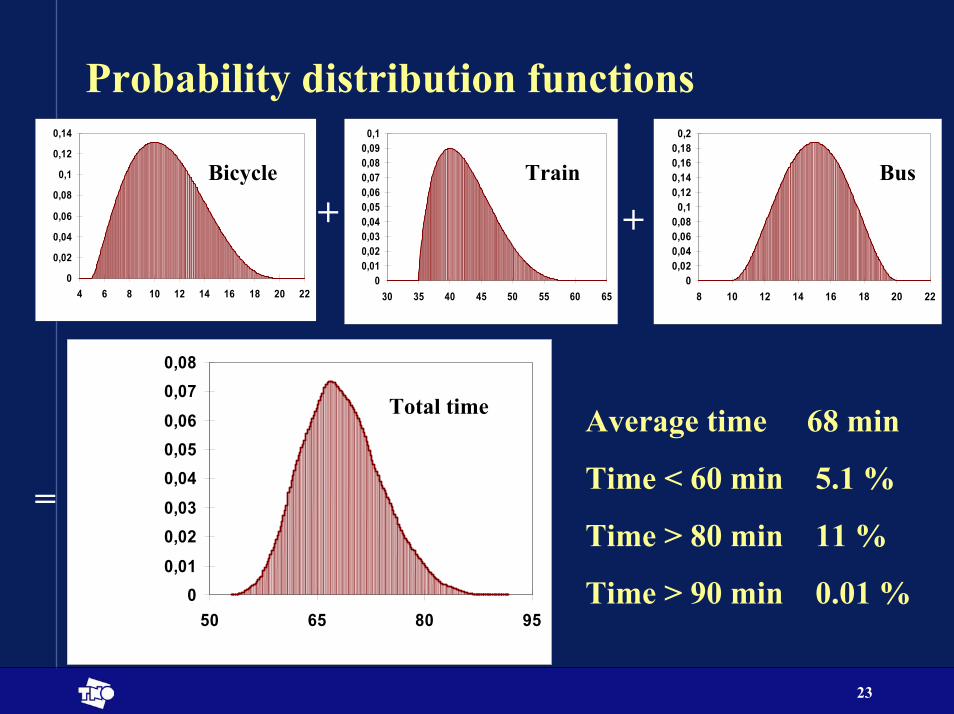
Probability distribution functions
0
0,02
0,04
0,06
0,08
0,1
0,12
0,14
4 6 8 10 12 14 16 18 20 22
00,010,020,030,040,050,060,070,080,09
0,1
30 35 40 45 50 55 60 65
Bicycle Train
+ +0
0,020,040,060,08
0,10,120,140,160,18
0,2
8 10 12 14 16 18 20 22
Bus
Time in min
00,01
0,020,03
0,040,050,06
0,070,08
50 65 80 95
Total time
=
Average time 68 min
Time < 60 min 5.1 %
Time > 80 min 11 %
Time > 90 min 0.01 %
24
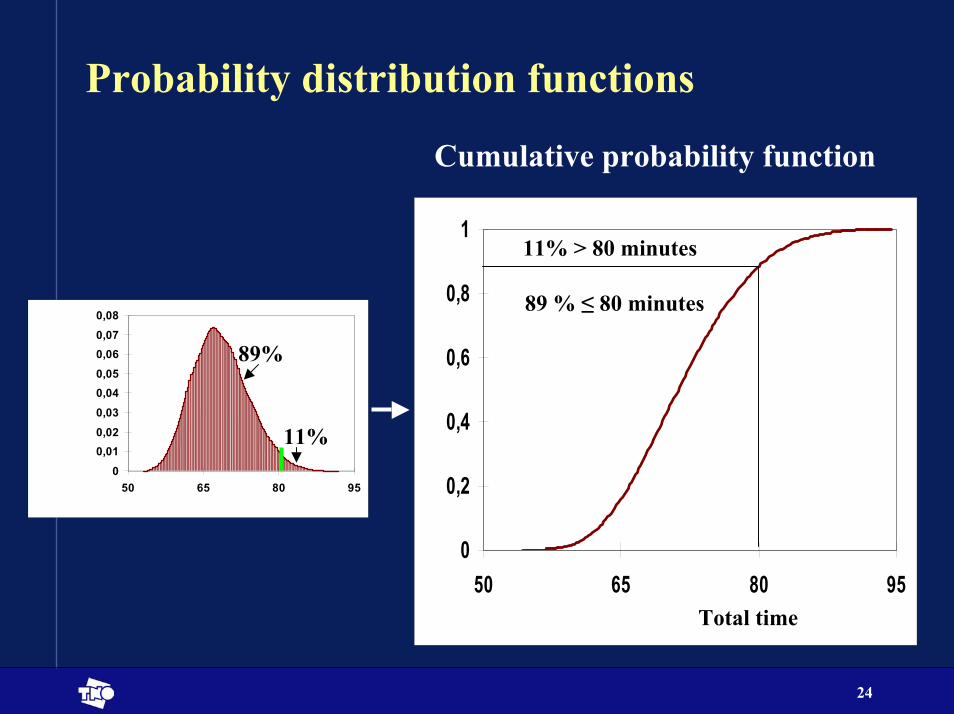
Probability distribution functions
Cumulative probability function
0
0,2
0,4
0,6
0,8
1
50 65 80 95
Total time
11% > 80 minutes
89 % ≤ 80 minutes
0
0,010,02
0,030,040,050,060,070,08
50 65 80 95
89%
11%
25
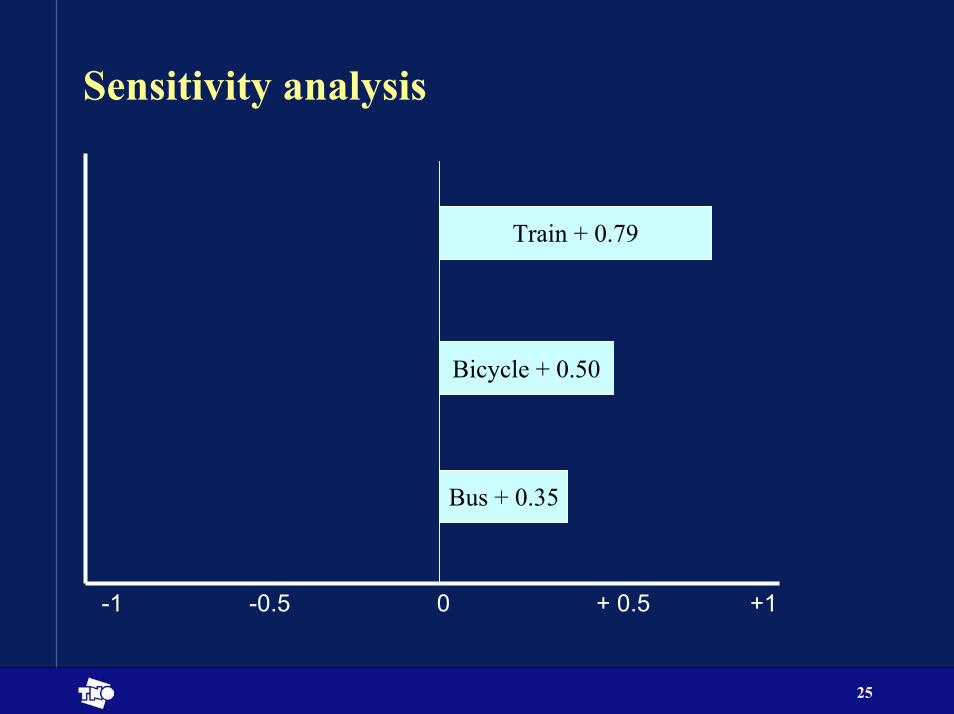
Sensitivity analysis
Train + 0.79
Bicycle + 0.50
Bus + 0.35
-1 -0.5 0 + 0.5 +1
26
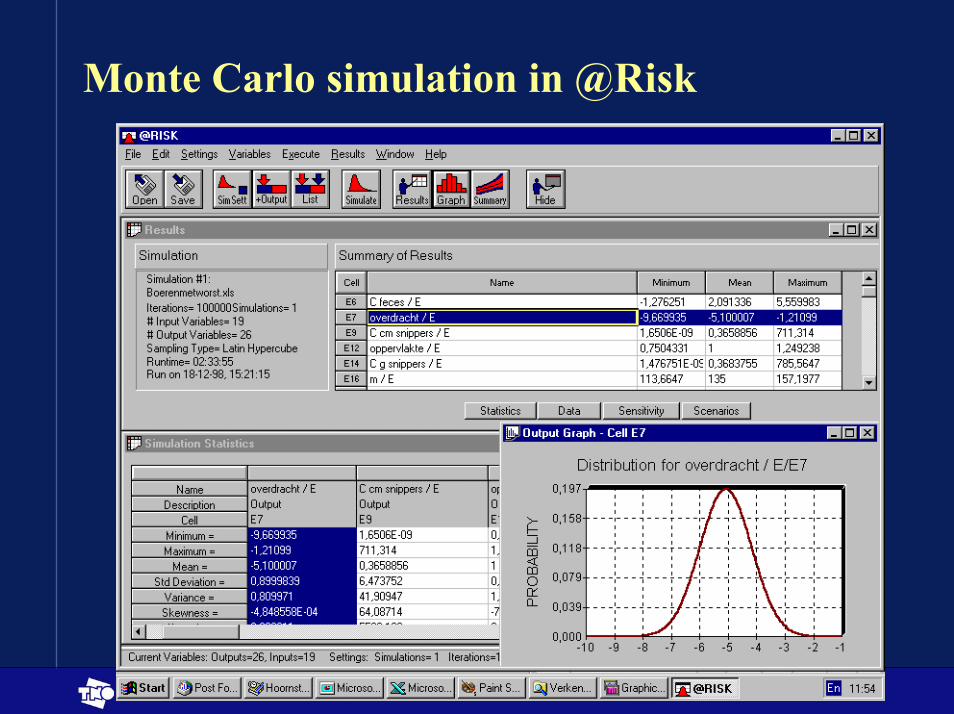
Monte Carlo simulation in @Risk
27
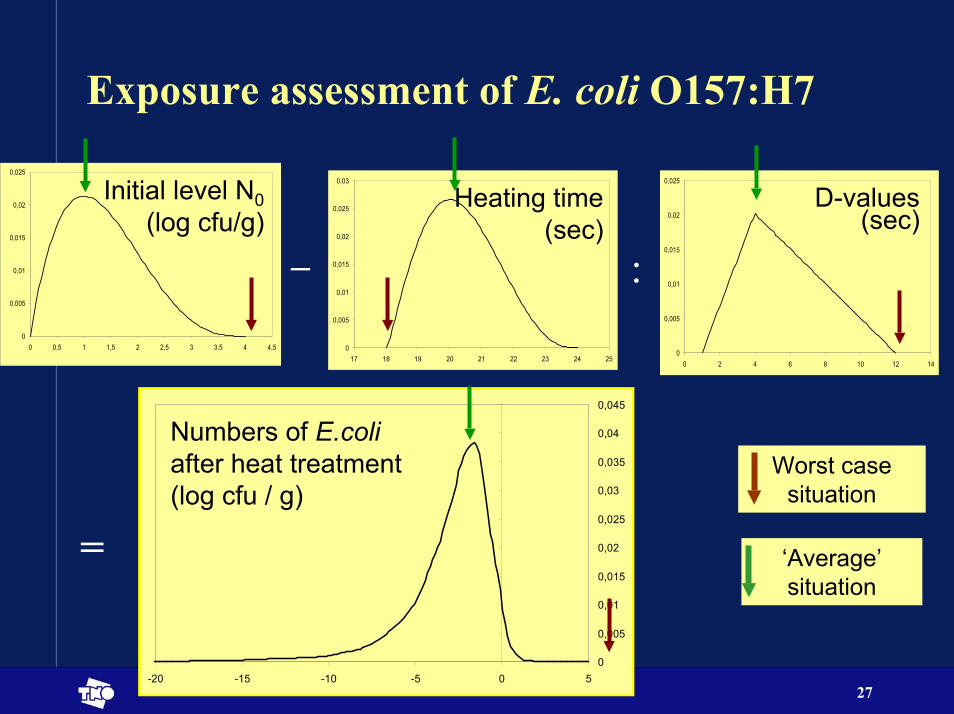
Exposure assessment of E. coli O157:H7
0
0,005
0,01
0,015
0,02
0,025
0 0,5 1 1,5 2 2,5 3 3,5 4 4,5 0
0,005
0,01
0,015
0,02
0,025
0,03
17 18 19 20 21 22 23 24 250
0,005
0,01
0,015
0,02
0,025
0 2 4 6 8 10 12 14
0
0,005
0,01
0,015
0,02
0,025
0,03
0,035
0,04
0,045
-20 -15 -10 -5 0 5
Initial level N0 (log cfu/g)
Heating time (sec)
D-values (sec)
Numbers of E.coliafter heat treatment (log cfu / g)
Worst case situation
‘Average’ situation
_ :
=
28
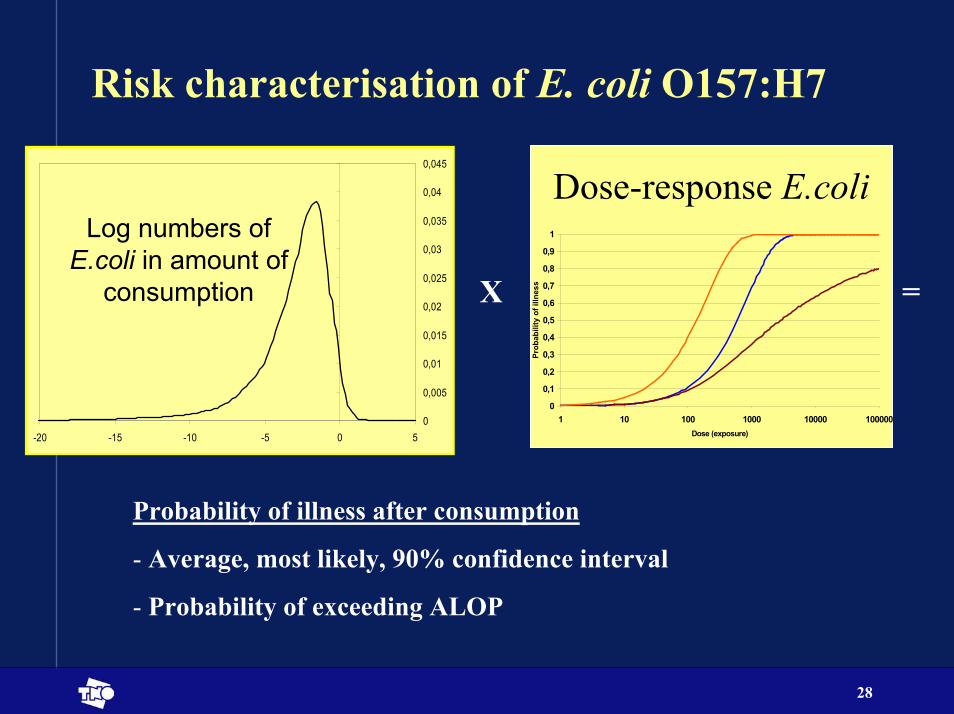
Risk characterisation of E. coli O157:H7
0
0,005
0,01
0,015
0,02
0,025
0,03
0,035
0,04
0,045
-20 -15 -10 -5 0 5
Log numbers of E.coli in amount of
consumption
Dose-response E.coli
=
0
0,1
0,2
0,3
0,4
0,5
0,6
0,7
0,8
0,9
1
1 10 100 1000 10000 100000Dose (exposure)
Prob
abili
ty o
f illn
ess
Probability of illness after consumption
- Average, most likely, 90% confidence interval
- Probability of exceeding ALOP
X
29
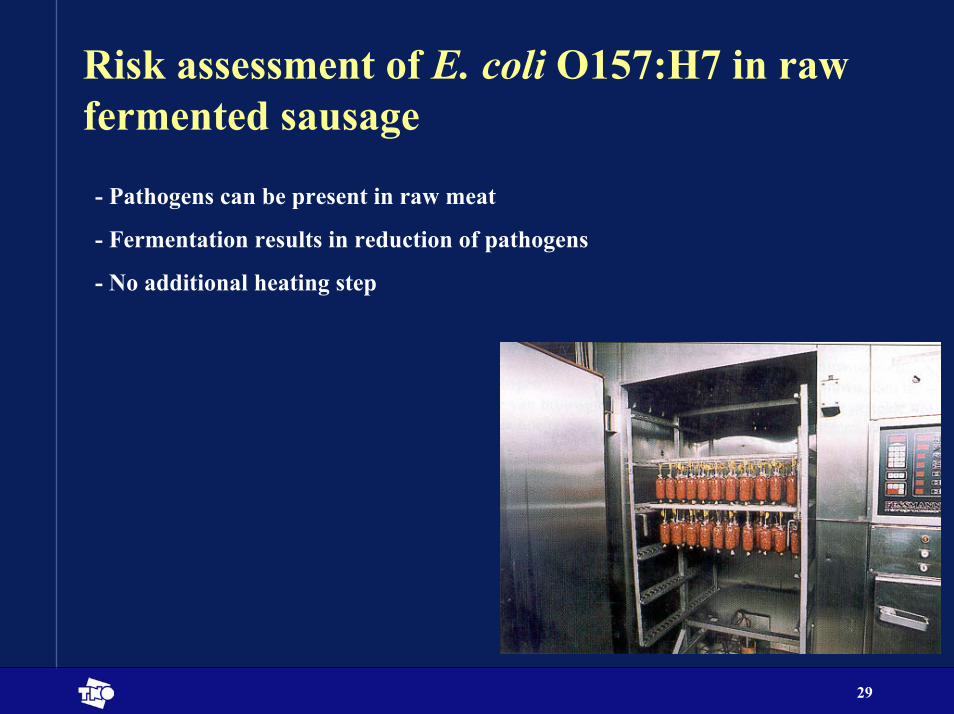
Risk assessment of E. coli O157:H7 in raw fermented sausage
- Pathogens can be present in raw meat
- Fermentation results in reduction of pathogens
- No additional heating step
30
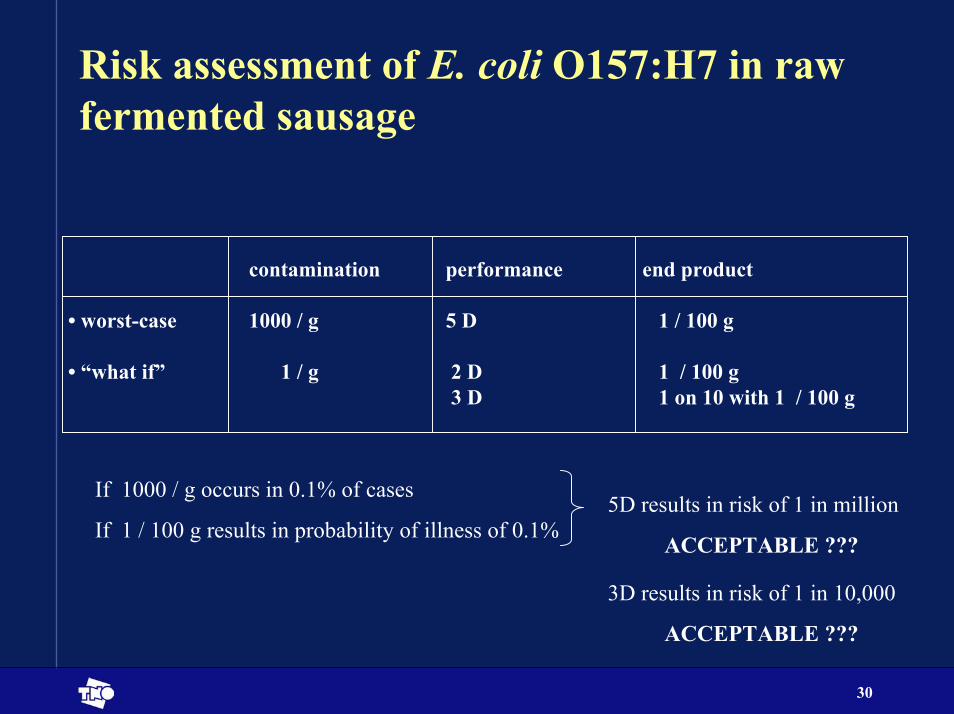
Risk assessment of E. coli O157:H7 in raw fermented sausage
contamination performance end product
• worst-case 1000 / g 5 D 1 / 100 g
• “what if” 1 / g 2 D 1 / 100 g3 D 1 on 10 with 1 / 100 g
If 1000 / g occurs in 0.1% of cases
If 1 / 100 g results in probability of illness of 0.1%5D results in risk of 1 in million
ACCEPTABLE ???
3D results in risk of 1 in 10,000
ACCEPTABLE ???
31
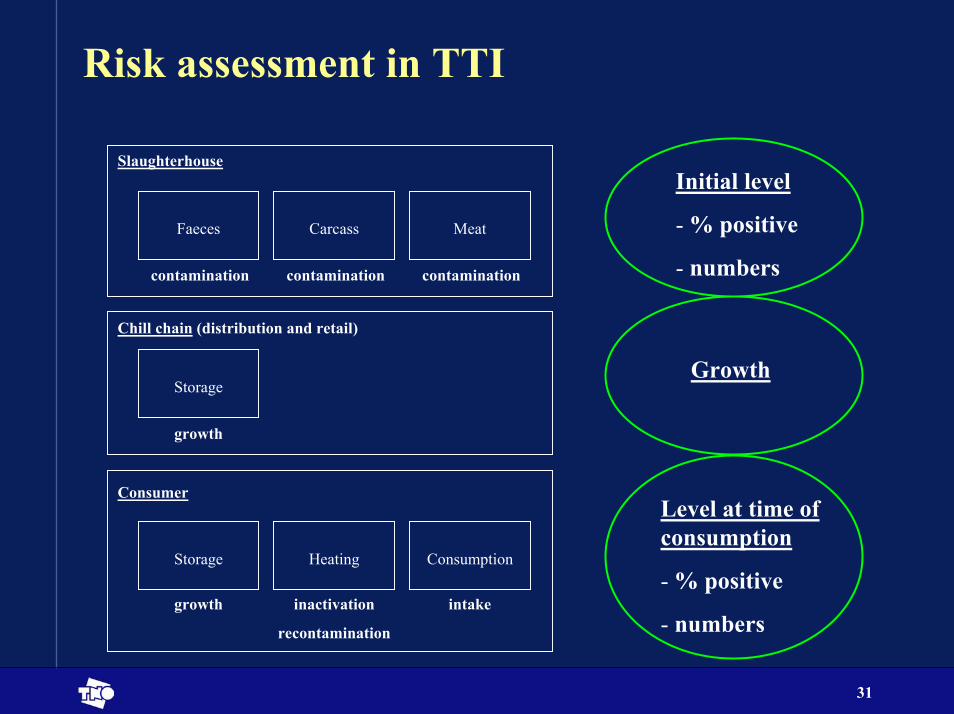
Risk assessment in TTI
Initial level
- % positive
- numbers
Growth
Level at time of consumption
- % positive
- numbers
Faeces Carcass Meat
contamination
Slaughterhouse
contamination contamination
Storage
growth
Chill chain (distribution and retail)
Storage
growth
Heating Consumption
Consumer
inactivation
recontamination
intake
32
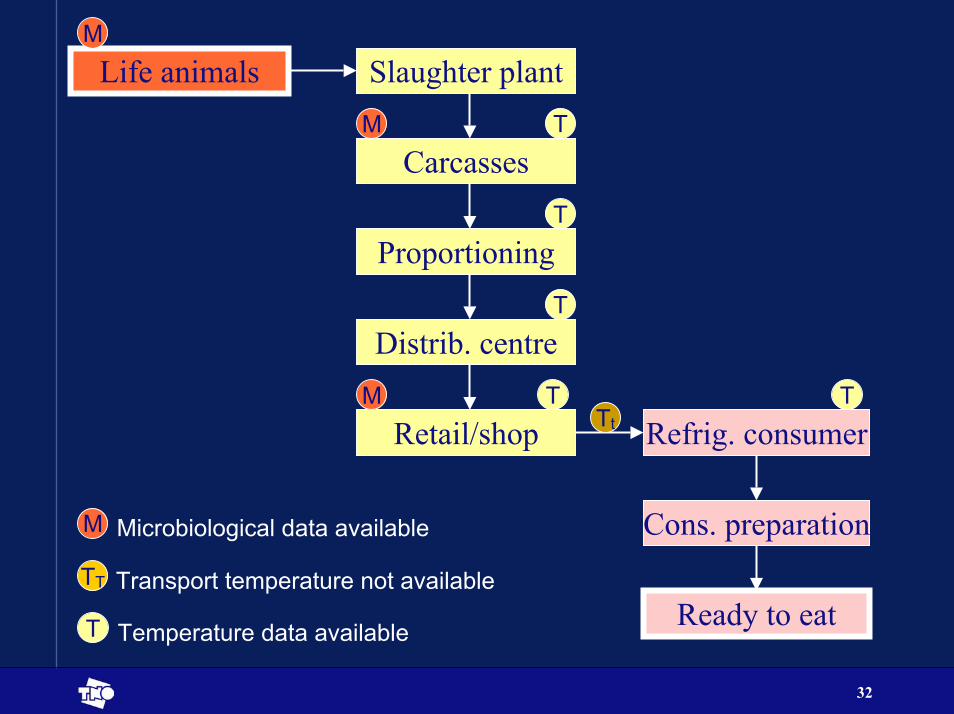
Life animalsM
Slaughter plantTM
Carcasses
Distrib. centre
T
Microbiological data available
Temperature data available
Transport temperature not availableTT
M
ProportioningT
T
Retail/shop Refrig. consumerT TM
Tt
Cons. preparation
Ready to eat
33
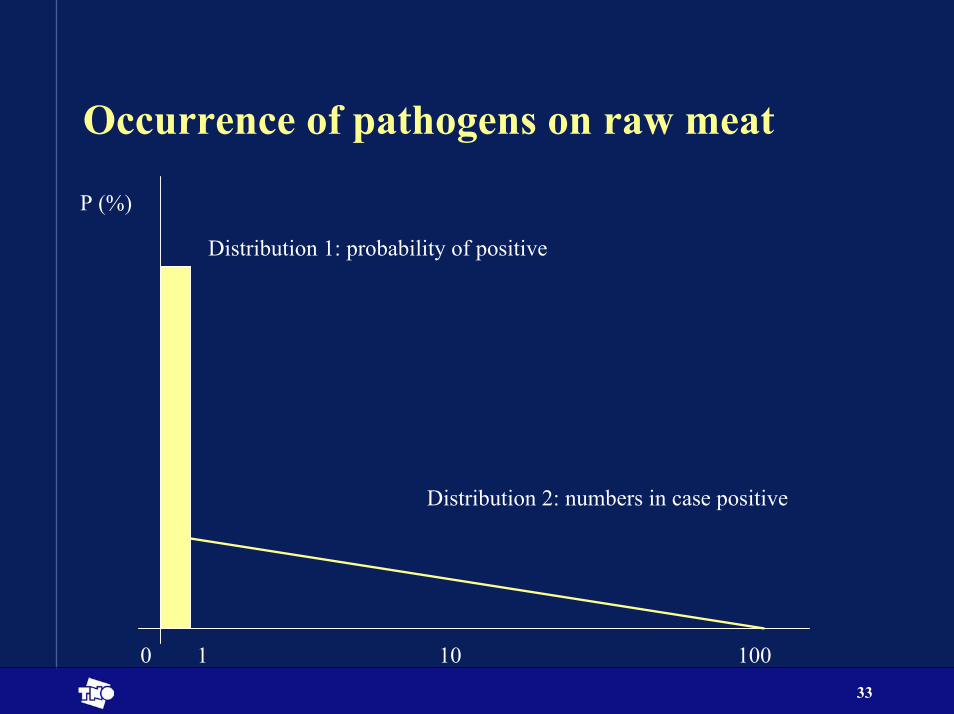
Occurrence of pathogens on raw meat
0 1 10 100
P (%)
Distribution 1: probability of positive
Distribution 2: numbers in case positive
34
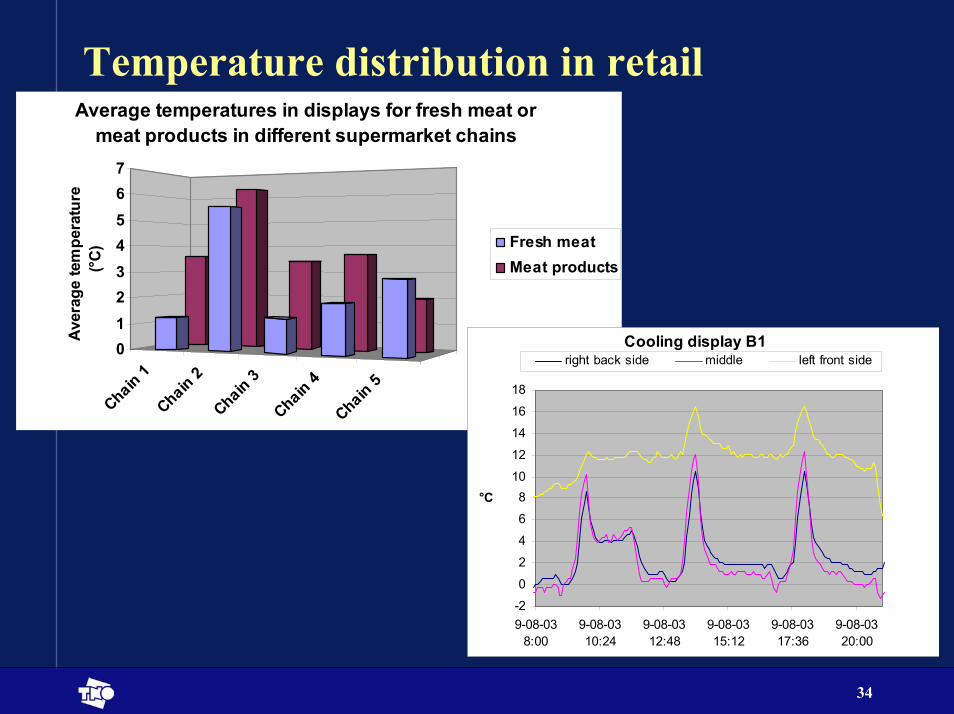
Temperature distribution in retail
Chain 1Chain 2Chain 3Chain 4
Chain 5
01234567
Ave
rage
tem
pera
ture
(°C
)Average temperatures in displays for fresh meat or
meat products in different supermarket chains
Fresh meatMeat products
Cooling display B1
-2
0
2
4
6
810
12
14
16
18
9-08-038:00
9-08-0310:24
9-08-0312:48
9-08-0315:12
9-08-0317:36
9-08-0320:00
°C
right back side middle left front side
35
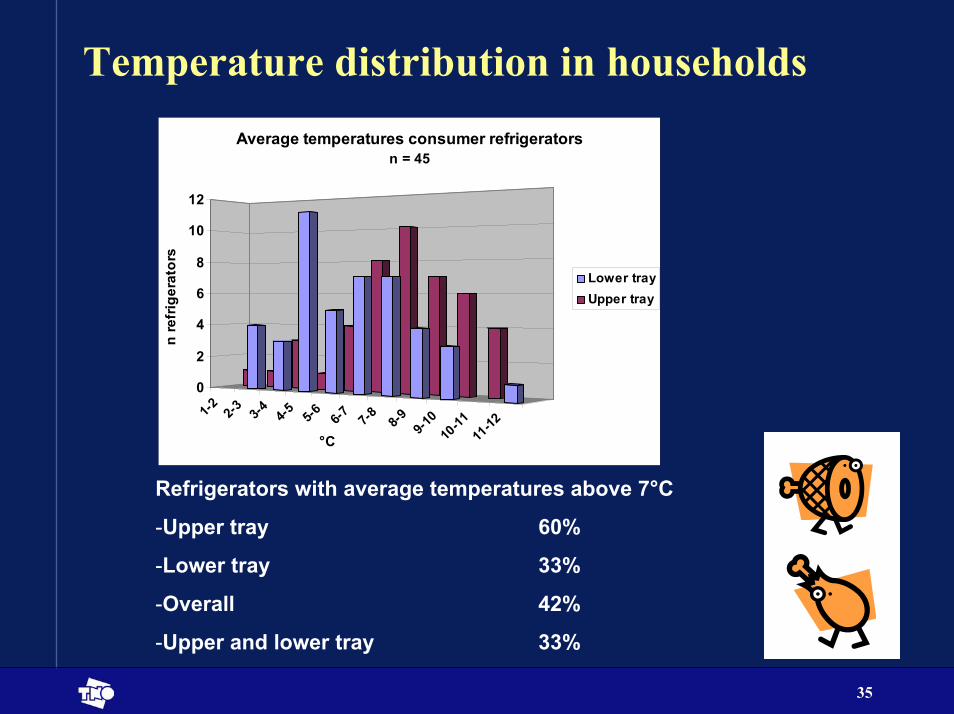
Temperature distribution in households
1-2 2-3 3-4 4-5 5-6 6-7 7-8 8-9 9-10
10-11
11-12
0
2
4
6
8
10
12
n re
frig
erat
ors
°C
Average temperatures consumer refrigeratorsn = 45
Lower trayUpper tray
Refrigerators with average temperatures above 7°C
-Upper tray 60%
-Lower tray 33%
-Overall 42%
-Upper and lower tray 33%
36
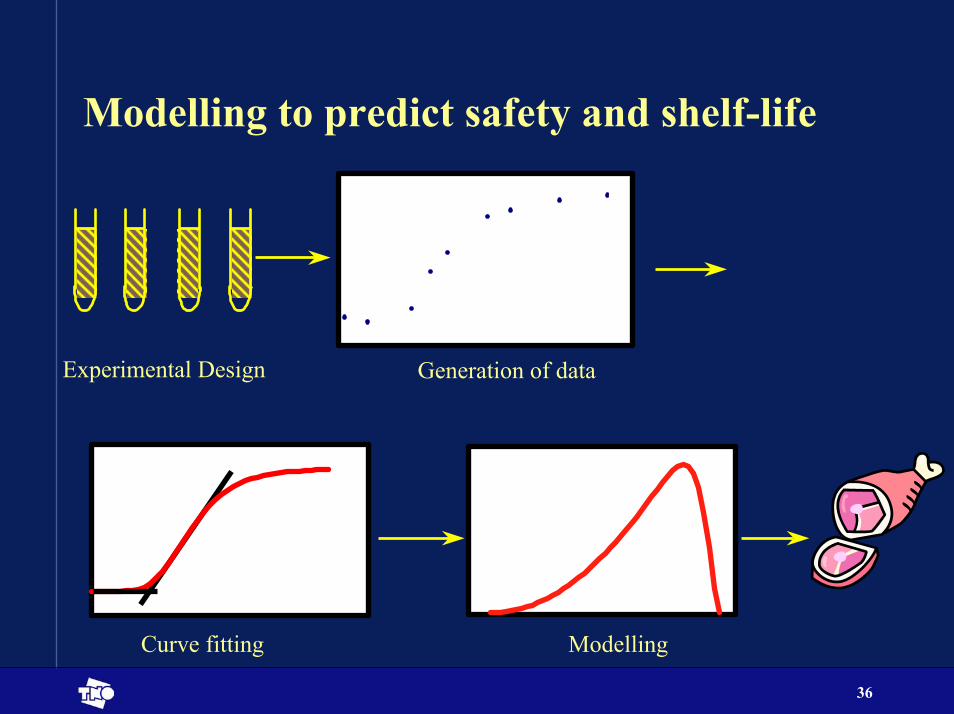
Modelling to predict safety and shelf-life
Experimental Design Generation of data
Curve fitting Modelling
37
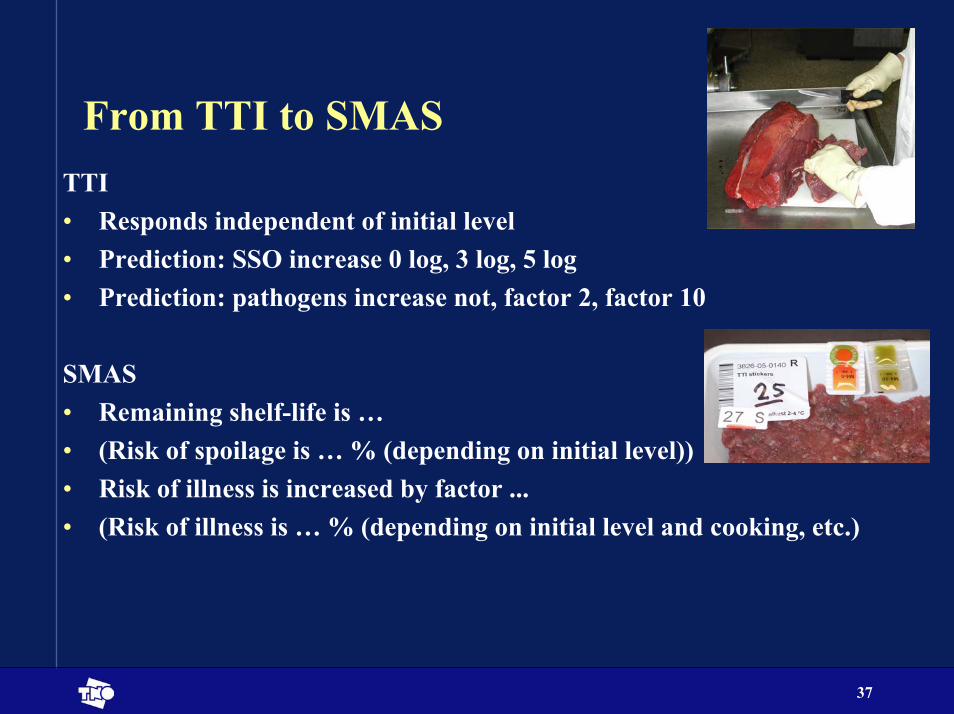
From TTI to SMASTTI• Responds independent of initial level• Prediction: SSO increase 0 log, 3 log, 5 log• Prediction: pathogens increase not, factor 2, factor 10
SMAS• Remaining shelf-life is …• (Risk of spoilage is … % (depending on initial level))• Risk of illness is increased by factor ... • (Risk of illness is … % (depending on initial level and cooking, etc.)
38
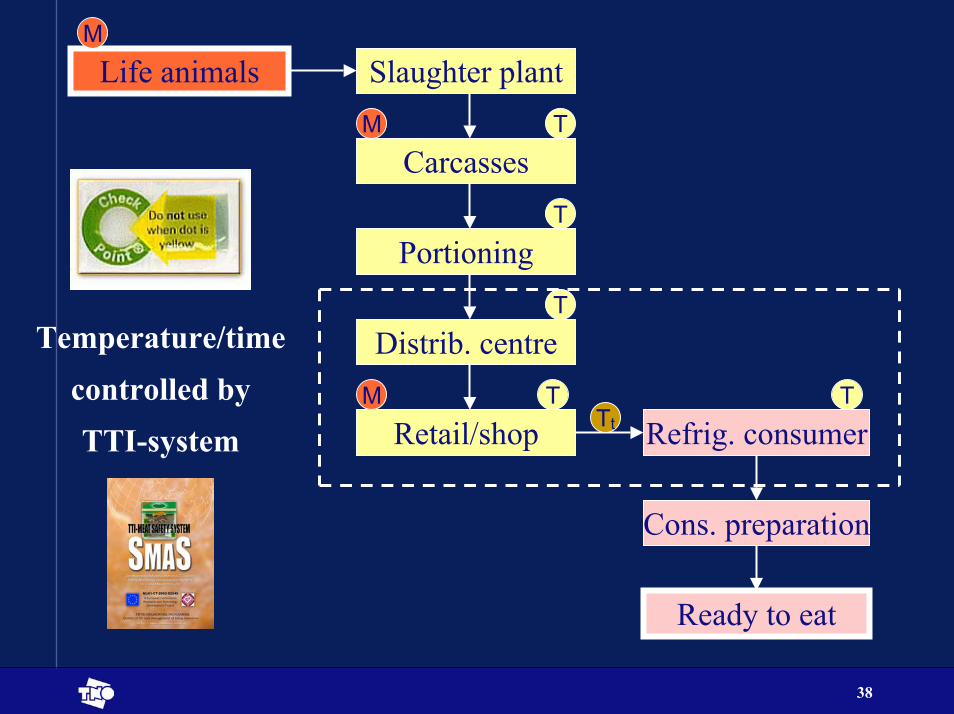
Life animalsM
Slaughter plantTM
CarcassesT
PortioningT
Distrib. centre
Retail/shop Refrig. consumerM
TtT T
Cons. preparation
Ready to eat
Temperature/time controlled byTTI-system
39
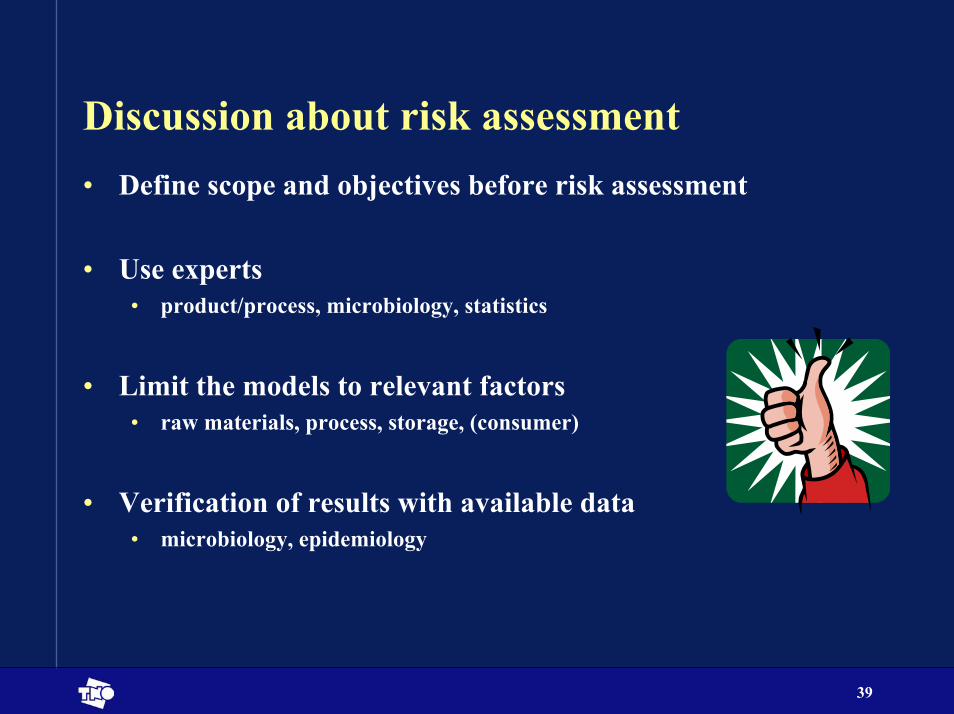
Discussion about risk assessment• Define scope and objectives before risk assessment
• Use experts• product/process, microbiology, statistics
• Limit the models to relevant factors• raw materials, process, storage, (consumer)
• Verification of results with available data• microbiology, epidemiology