Embed Size (px)
Citation preview

MODELS RELATING PAVEMENT QUALITY
MEASURES Lisa Aultman-Hall
Eric Jackson
Charles E. Dougan
Soon-Nam Choi

Background• International Roughness Index-
(IRI) is a mathematical representation of the accumulated suspension stroke of a vehicle, divided by the distance that it travels during the same time period
• Lower values represent a smoother ride; while higher values indicate a rougher one
(Sayers and Karamihas 1998)

Background
• IRI:– Easy to collect– Reliable and repeatable – Limited knowledge as to IRI’s relationship
with other measures of distress

Previous Research
• California’s LTPP (Long Term Pavement Performance)– Rutting, cracking, patching, weathering and
raveling – Based on 39 observations measured at 15 m
intervals on a 152.4 m test section – Linear relationship developed between IRI and a
measure of pavement distress. • R2 = 0.52
(Dewan and Smith 2002)

Previous Research
Westrack project– IRI= 0.597(IRIinit) + 0.0094(Fatigue %) + 0.00847(RutDepth) + .0382
• R2 = 0.71 • Mean error = 0.107 m/km
– IRI is most sensitive to the initial IRI
(Mactutis et al. 2000)

Previous Research Neural network techniques
• Automatic Road Analyzer (ARAN) videolog vehicle• 125, 1-km segments of provincial highways and country roads
in Taiwan • IRI as a function of ;
– rutting, alligator cracking, cracking, digging/patching, potholes, corrugations, man-holes, stripping, patching, and bleeding
• Correlation coefficient reached 0.944• Severe potholes, digging/patching, and rutting were
determined to have the largest impact on IRI
(Lin et al. 2003)

Study Objectives
• Investigate the relationships between IRI, pavement rutting and cracking on real world limited access highways.
• Determine if IRI can be used as a surrogate for pavement distress
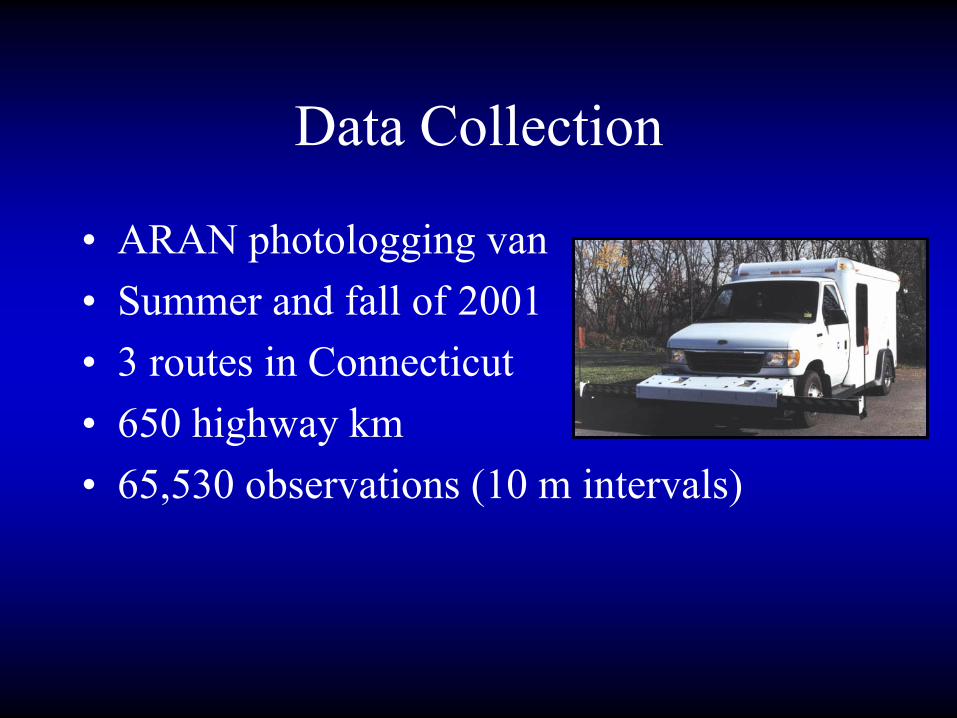
Data Collection
• ARAN photologging van • Summer and fall of 2001 • 3 routes in Connecticut• 650 highway km • 65,530 observations (10 m intervals)

Route Description
• Full depth hot-mixed asphalt (HMA)- OR -
• HMA over Portland Cement Concrete (PCC). • Routes pavement
ranged from 1986 to 2001
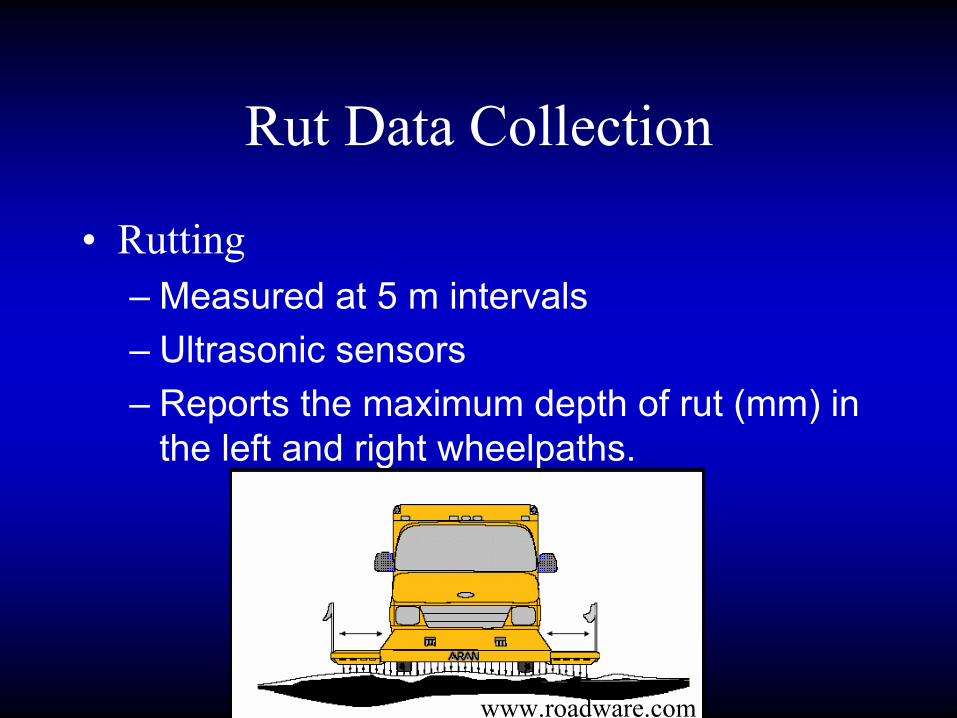
Rut Data Collection
• Rutting– Measured at 5 m intervals – Ultrasonic sensors – Reports the maximum depth of rut (mm) in
the left and right wheelpaths.
www.roadware.com

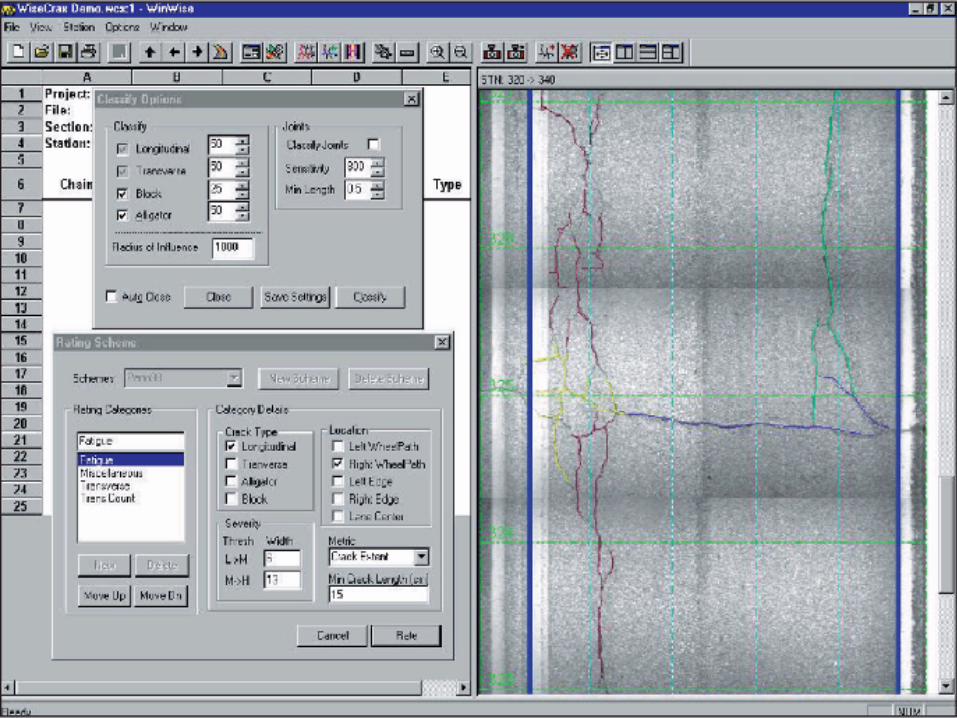
Cracking Data Collection• Cracking
– Downward facing cameras on the ARAN van.– WISECRAX® software
• Automated crack detection software
– Total number, Total length and Average width per 10 m section
www.roadware.com

RouteMean IRI (m/km)
Mean Rut Depth (mm)
Mean Number of Cracks
(per 10 m section)395 1.19 2.53 0.32
8 1.54 3.22 2.2515 1.78 2.81 3.57
IRI VS. Rut Depth• Appears there is little to no correlation
IRI VS Mean Number of Cracks (per 10 m section)
• An increase in the mean number of cracks, corresponds to a higher IRI

•IRI with and without crackingStudent’s t-test (p<0.0005) indicating the average difference in IRI is significant
8 13811 1.56 0.82 7635 1.5 0.82 21446 1.53 0.8215 19170 1.79 0.83 7348 1.75 0.9 26518 1.78 0.85
395 2181 1.48 0.82 15385 1.15 0.49 17566 1.19 0.55All routes 35162 1.68 0.83 30368 1.38 0.74 65530 1.54 0.81
All RecordsNumber
of Records
Mean IRI
(m/km)
IRI Standard Deviation
Number of
Records
Mean IRI
(m/km)
IRI Standard Deviation
Number of
Records
Mean IRI
(m/km)
IRI Standard
DeviationRoute
With Detectable1 Cracks Without Detectable Cracks
1 Defined as cracks that are greater than 4 mm in width

Rut Depth (mm)
Mean IRI
(m/km)
Number of
Cracks (10 m)
Total Length of Cracks
(m)
Average Crack Width (mm)
0-2 1.25 1.32 1.16 7.782.01-4 1.59 2.53 2.13 8.224.01-6 1.9 3.2 2.56 8.386.01-8 2.23 3.32 2.8 8.45
>8 2.89 3.57 3.13 9.15
•IRI and Rutting and CrackingAnalysis of Variance (ANOVA) (p<0.0005) indicating increased rut depth increases IRI
• Several statistical tests indicate that there is an overall relationship between IRI, rutting, and cracking.
Results

• Linear Regression
10 m segments
30 m segments
90 m segments
Mean Absolute Error (for actual data)
0.52 0.42 0.35
R2 17.70% 24.20% 29.90%
IRI (m/Km)
10 m segments
30 m segments
90 m segments
Constant 0.79 0.82 0.84Rut Depth Mean 10 m 0.12Rut Depth Mean 30 m 0.1Rut Depth Mean 90 m 0.1Rut Standard Dev. 30 m 0.15 0.13Rut Standard Dev. 90 m 0.35 0.38 0.44Mean Crack Length 90 m 0.07 0.07 0.06Mean Crack Width 90 m 0.02
IRI (m/Km)
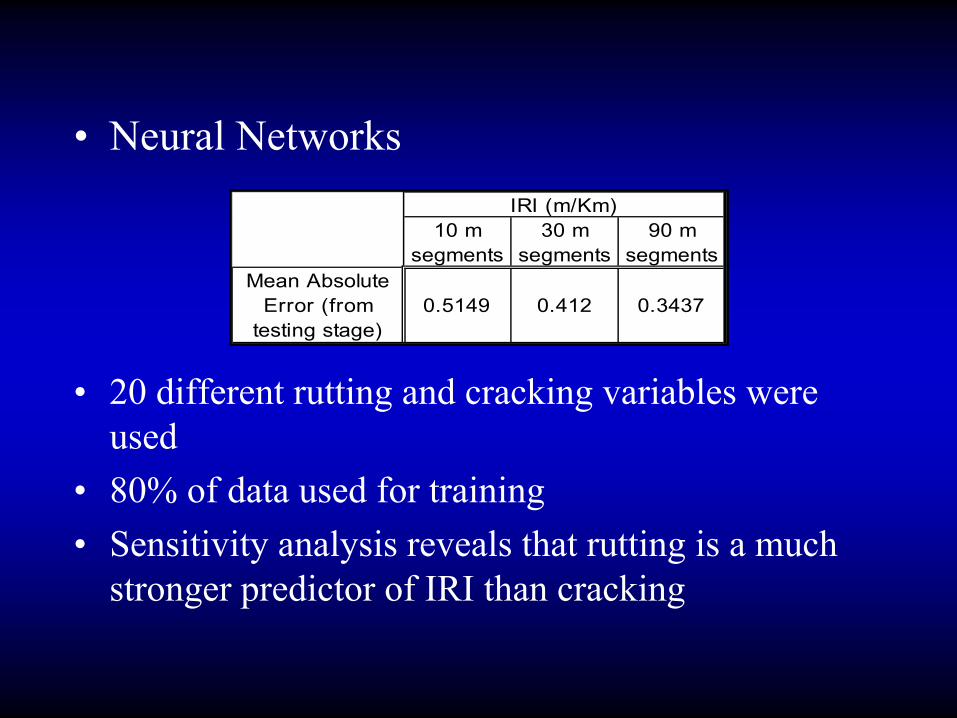
• Neural Networks
• 20 different rutting and cracking variables were used
• 80% of data used for training • Sensitivity analysis reveals that rutting is a much
stronger predictor of IRI than cracking
10 m segments
30 m segments
90 m segments
Mean Absolute Error (from
testing stage)0.5149 0.412 0.3437
IRI (m/Km)

• Linear Regression
• Neural Networks
10 m segments
30 m segments
90 m segments
Mean Absolute Error (from testing
stage)0.515 0.412 0.344
IRI (m/Km)
10 m 30 m 90 mMean Absolute Error (for actual data)
0.52 0.42 0.35
R2 17.70% 24.20% 29.90%
IRI (m/Km)
Linear regression and neural network models have similar success at predicting IRI, which differs from previous research
Conclusions
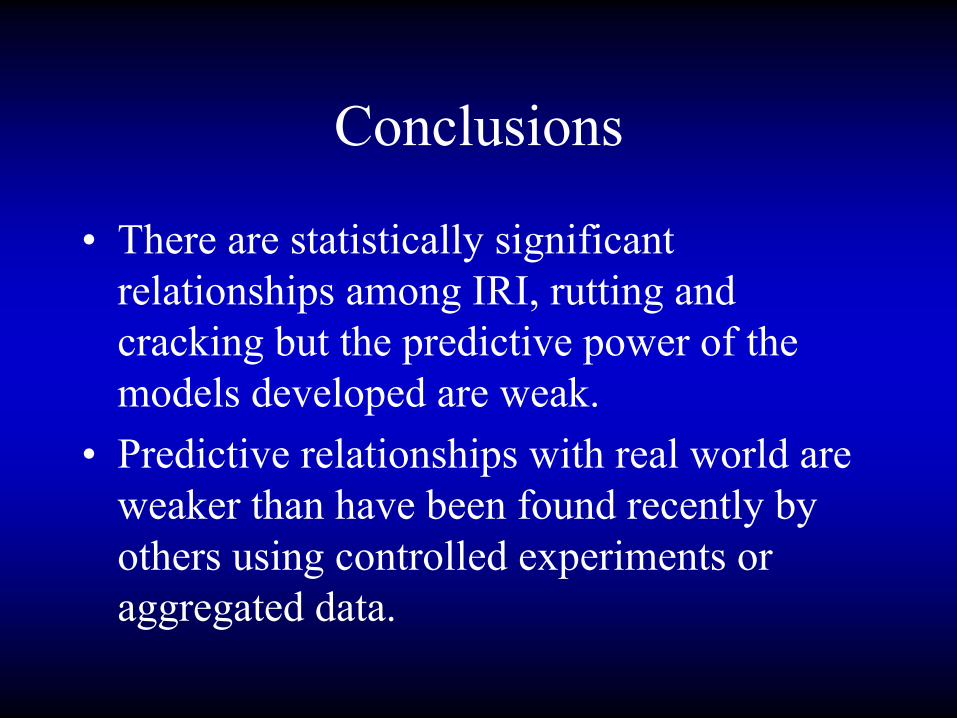
• There are statistically significant relationships among IRI, rutting and cracking but the predictive power of the models developed are weak.
• Predictive relationships with real world are weaker than have been found recently by others using controlled experiments or aggregated data.

Conclusions
• Given the ability of neural networks to successfully find patterns in non-linear and correlated data for other applications, these results suggest the relationship between IRI, cracking and rutting may simply not exist.
• Overall, these findings do not provide strong support that IRI can be used as a surrogate measure for overall pavement condition.
• IRI may simply be a rideability measure

Recommendations
• An investigation into other pavement stress variables might prove beneficial in determining a relationship between distress and IRI

Acknowledgements
This research was conducted with funding from the Connecticut Department of Transportation with the cooperation of the Federal Highway Administration. The contributions of the technical advisory committee, especially Bradley Overturfand David Kilpatrick are gratefully acknowledged. However, the conclusions and interpretation of the data are solely those of the authors.


ReferencesS.A. Dewan and R.E. Smith, (2002) "Estimating IRI from Pavement Distresses to Calculate Vehicle
Operating Costs for the Cities and Counties of San Francisco Bay Area." Transportation Research Record 1816, Transportation Research Board; Washington, DC. p. 65-72.
J.A. Mactutis, S.H. Alavi, and W.C. Ott, (2000). "Investigation of Relationship Between Roughness and Pavement Surface Distress Based on WesTrack Project." Transportation Research Record1699, Transportation Research Board; Washington, DC. p. 107-113.
J.-D. Lin, J.-T. Yau, and L.-H. Hsiao. (2003). "Correlation Analysis Between International Roughness Index (IRI) and Pavement Distress by Neural Network." in 82nd Annual Meeting of the Transportation Research Board. Transportation Research Board; Washington, DC.
Sayers, Michael and Steven Karamihas. The little book of profiling: basic information about measuring and interpreting road profiles. The Regent of the University of Michigan. 1998