Embed Size (px)
Citation preview
Models - FactsheetsPrepared on: 5/1/2013 | Fund data as of 3/31/2013
Prepared By:
Mark Deniro
M.D.C. Advisors
110 Main St.
Sewickley, PA 16066
412-239-1202
Page 1 of 25
Fund data as of 3/31/2013
Analysis, search process, and layout are © 2000-2013, fi360, Inc. (www.fi360.com). All rights reserved. The analysis and opinions generated by fi360: (1) do not constitute professional investment advice; (2) are provided
solely for informational purposes; (3) are not warranted or represented to be correct, complete, or accurate; and (4) are for the exclusive use of subscribers to fi360. The data source is © 2013 Morningstar, Inc. All rights
reserved. The data contained herein: (1) is proprietary to Morningstar, Inc and/or its content providers; (2) may not be copied or distributed; and (3) is not warranted to be accurate, complete or timely. Neither Morningstar,
Inc nor its content providers are responsible for any damages or losses arising from any use of this information. Past performance is no guarantee of future results.
fi360_Portrait_v4_3

Models - Factsheet: ModerateThis model attempts to match the s&p 500 by taking on additional risk. It is appropriate for individuals with a medium risk tolerance.
Current Model Allocations as of 3/31/2013 Risk Level
0
5
10 15
20
25Current
3-Year 5-Year
Large-Cap Equity 22.0%Developed International Equity 14.0%Intermediate Fixed Income 12.0%Short-Term Fixed Income 12.0%Small-Cap Equity 12.0%Emerging Market Equity 7.0%International Fixed Income 7.0%Long-Term Fixed Income 7.0%Mid-Cap Equity 7.0%
Total: 100.0%
Using the model's 3-year and 5-year standard deviation (if available) as the
benchmark, the gauge below reflects, on a relative scale, the risk associated
with this model.
The current model allocation is shown below. Specific investment positions may be
found in the table below.
Current Model Performance vs Benchmark(s)
Model Tactical Peer
Group
Benchmark
Strategic Peer
Group
Benchmark
Custom
Benchmark
1-Month 1.78 1.81 1.13 1.72
3-Month 5.53 5.24 2.57 3.79
YTD 5.53 5.24 2.57 3.79
1-Year 10.29 9.29 6.33 6.60
3-Year 9.09 8.49 7.79 8.61
5-Year 7.03 5.57 4.95 5.09
Return Since
Inception
7.35 5.67 5.42 5.93
Growth of 10k 15,953.52 14,378.34 14,156.24 14,613.59
Growth of a $10,000 investment
$8,000
$9,000
$10,000
$11,000
$12,000
$13,000
$14,000
$15,000
$16,000
8/20
06
8/20
07
8/20
08
8/20
09
8/20
10
8/20
11
8/20
12
As of Date: 3/31/2013
Inception Date: 8/31/2006
Rebalancing Frequency: Quarterly
Model Performance (+/-) the Tactical Peer Group Benchmark
This section will report the performance of the model as compared to its tactical peer group benchmark. A positive return indicates benchmark outperformance.
Based on the amount of model history entered, a 1-, 3-, 5- and 10-Year return will be available through the most recent model update. Please view the appendix for
additional details and benchmark compositions.
-1
-1
0
1
1
2
2
3
3
4
4
9/20
06
9/20
07
9/20
08
9/20
09
9/20
10
9/20
11
9/20
12
1-Month 3-Month 1-Year 3-Year 5-Year
Page 2 of 25
Fund data as of 3/31/2013
Analysis, search process, and layout are © 2000-2013, fi360, Inc. (www.fi360.com). All rights reserved. The analysis and opinions generated by fi360: (1) do not constitute professional investment advice; (2) are provided
solely for informational purposes; (3) are not warranted or represented to be correct, complete, or accurate; and (4) are for the exclusive use of subscribers to fi360. The data source is © 2013 Morningstar, Inc. All rights
reserved. The data contained herein: (1) is proprietary to Morningstar, Inc and/or its content providers; (2) may not be copied or distributed; and (3) is not warranted to be accurate, complete or timely. Neither Morningstar,
Inc nor its content providers are responsible for any damages or losses arising from any use of this information. Past performance is no guarantee of future results.
fi360_Portrait_v4_3
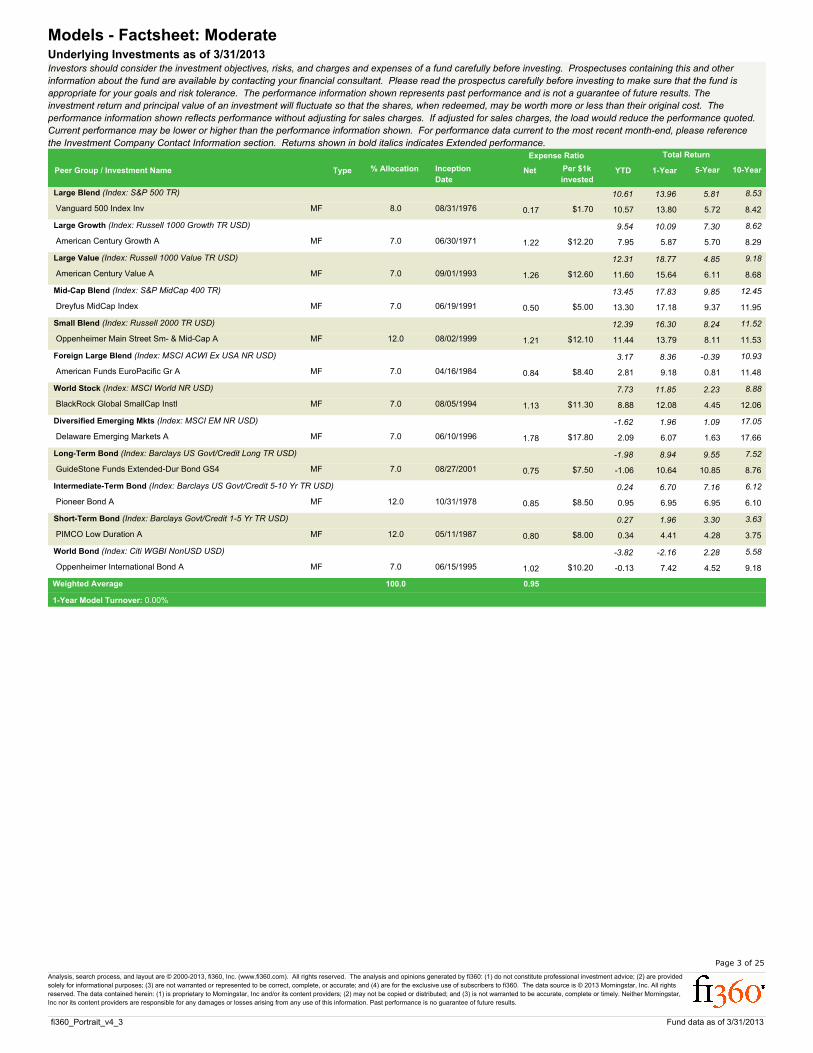
Models - Factsheet: ModerateUnderlying Investments as of 3/31/2013Investors should consider the investment objectives, risks, and charges and expenses of a fund carefully before investing. Prospectuses containing this and other
information about the fund are available by contacting your financial consultant. Please read the prospectus carefully before investing to make sure that the fund is
appropriate for your goals and risk tolerance. The performance information shown represents past performance and is not a guarantee of future results. The
investment return and principal value of an investment will fluctuate so that the shares, when redeemed, may be worth more or less than their original cost. The
performance information shown reflects performance without adjusting for sales charges. If adjusted for sales charges, the load would reduce the performance quoted.
Current performance may be lower or higher than the performance information shown. For performance data current to the most recent month-end, please reference
the Investment Company Contact Information section. Returns shown in bold italics indicates Extended performance.
Peer Group / Investment Name
Total Return
1-Year 5-Year 10-Year
Expense Ratio
Inception
Date
% Allocation Net YTDPer $1k
investedType
10.61 13.96 5.81 8.53Large Blend (Index: S&P 500 TR)
Vanguard 500 Index Inv 13.80 5.72 8.42 0.17 8.0MF 08/31/1976 10.57$1.70
9.54 10.09 7.30 8.62Large Growth (Index: Russell 1000 Growth TR USD)
American Century Growth A 5.87 5.70 8.29 1.22 7.0MF 06/30/1971 7.95$12.20
12.31 18.77 4.85 9.18Large Value (Index: Russell 1000 Value TR USD)
American Century Value A 15.64 6.11 8.68 1.26 7.0MF 09/01/1993 11.60$12.60
13.45 17.83 9.85 12.45Mid-Cap Blend (Index: S&P MidCap 400 TR)
Dreyfus MidCap Index 17.18 9.37 11.95 0.50 7.0MF 06/19/1991 13.30$5.00
12.39 16.30 8.24 11.52Small Blend (Index: Russell 2000 TR USD)
Oppenheimer Main Street Sm- & Mid-Cap A 13.79 8.11 11.53 1.21 12.0MF 08/02/1999 11.44$12.10
3.17 8.36 -0.39 10.93Foreign Large Blend (Index: MSCI ACWI Ex USA NR USD)
American Funds EuroPacific Gr A 9.18 0.81 11.48 0.84 7.0MF 04/16/1984 2.81$8.40
7.73 11.85 2.23 8.88World Stock (Index: MSCI World NR USD)
BlackRock Global SmallCap Instl 12.08 4.45 12.06 1.13 7.0MF 08/05/1994 8.88$11.30
-1.62 1.96 1.09 17.05Diversified Emerging Mkts (Index: MSCI EM NR USD)
Delaware Emerging Markets A 6.07 1.63 17.66 1.78 7.0MF 06/10/1996 2.09$17.80
-1.98 8.94 9.55 7.52Long-Term Bond (Index: Barclays US Govt/Credit Long TR USD)
GuideStone Funds Extended-Dur Bond GS4 10.64 10.85 8.76 0.75 7.0MF 08/27/2001 -1.06$7.50
0.24 6.70 7.16 6.12Intermediate-Term Bond (Index: Barclays US Govt/Credit 5-10 Yr TR USD)
Pioneer Bond A 6.95 6.95 6.10 0.85 12.0MF 10/31/1978 0.95$8.50
0.27 1.96 3.30 3.63Short-Term Bond (Index: Barclays Govt/Credit 1-5 Yr TR USD)
PIMCO Low Duration A 4.41 4.28 3.75 0.80 12.0MF 05/11/1987 0.34$8.00
-3.82 -2.16 2.28 5.58World Bond (Index: Citi WGBI NonUSD USD)
Oppenheimer International Bond A 7.42 4.52 9.18 1.02 7.0MF 06/15/1995 -0.13$10.20
100.0 0.95Weighted Average
1-Year Model Turnover: 0.00%
Page 3 of 25
Fund data as of 3/31/2013
Analysis, search process, and layout are © 2000-2013, fi360, Inc. (www.fi360.com). All rights reserved. The analysis and opinions generated by fi360: (1) do not constitute professional investment advice; (2) are provided
solely for informational purposes; (3) are not warranted or represented to be correct, complete, or accurate; and (4) are for the exclusive use of subscribers to fi360. The data source is © 2013 Morningstar, Inc. All rights
reserved. The data contained herein: (1) is proprietary to Morningstar, Inc and/or its content providers; (2) may not be copied or distributed; and (3) is not warranted to be accurate, complete or timely. Neither Morningstar,
Inc nor its content providers are responsible for any damages or losses arising from any use of this information. Past performance is no guarantee of future results.
fi360_Portrait_v4_3

Models - Factsheet: Conservative
Current Model Allocations as of 3/31/2013 Risk Level
0
5
10 15
20
25Current
3-Year 5-Year
Stable Value / Money Market 54.0%Allocation 13.0%Large-Cap Equity 9.0%Intermediate Fixed Income 6.0%International Fixed Income 4.0%Long-Term Fixed Income 4.0%Real Estate 3.0%Small-Cap Equity 3.0%Emerging Market Equity 2.0%Mid-Cap Equity 2.0%
Total: 100.0%
Using the model's 3-year and 5-year standard deviation (if available) as the
benchmark, the gauge below reflects, on a relative scale, the risk associated
with this model.
The current model allocation is shown below. Specific investment positions may be
found in the table below.
Current Model Performance vs Benchmark(s)
Model Tactical Peer
Group
Benchmark
Strategic Peer
Group
Benchmark
Custom
Benchmark
1-Month 0.81 0.88 0.60 0.05
3-Month 1.64 1.70 1.38 0.16
YTD 1.64 1.70 1.38 0.16
1-Year 4.65 4.31 3.64 1.24
3-Year 4.50 4.12 6.85 2.41
5-Year 3.86 3.16 4.81 2.63
Return Since
Inception
4.88 4.28 6.04 3.79
Growth of 10k 14,702.82 14,035.20 16,067.31 13,511.34
Growth of a $10,000 investment
$9,000
$10,000
$11,000
$12,000
$13,000
$14,000
$15,000
2/20
05
2/20
06
2/20
07
2/20
08
2/20
09
2/20
10
2/20
11
2/20
12
2/20
13
As of Date: 3/31/2013
Inception Date: 2/28/2005
Rebalancing Frequency: Quarterly
Model Performance (+/-) the Tactical Peer Group Benchmark
This section will report the performance of the model as compared to its tactical peer group benchmark. A positive return indicates benchmark outperformance.
Based on the amount of model history entered, a 1-, 3-, 5- and 10-Year return will be available through the most recent model update. Please view the appendix for
additional details and benchmark compositions.
-1
-1
0
1
1
2
2
3
3
3/20
05
3/20
06
3/20
07
3/20
08
3/20
09
3/20
10
3/20
11
3/20
12
3/20
13
1-Month 3-Month 1-Year 3-Year 5-Year
Page 4 of 25
Fund data as of 3/31/2013
Analysis, search process, and layout are © 2000-2013, fi360, Inc. (www.fi360.com). All rights reserved. The analysis and opinions generated by fi360: (1) do not constitute professional investment advice; (2) are provided
solely for informational purposes; (3) are not warranted or represented to be correct, complete, or accurate; and (4) are for the exclusive use of subscribers to fi360. The data source is © 2013 Morningstar, Inc. All rights
reserved. The data contained herein: (1) is proprietary to Morningstar, Inc and/or its content providers; (2) may not be copied or distributed; and (3) is not warranted to be accurate, complete or timely. Neither Morningstar,
Inc nor its content providers are responsible for any damages or losses arising from any use of this information. Past performance is no guarantee of future results.
fi360_Portrait_v4_3

Models - Factsheet: ConservativeUnderlying Investments as of 3/31/2013Investors should consider the investment objectives, risks, and charges and expenses of a fund carefully before investing. Prospectuses containing this and other
information about the fund are available by contacting your financial consultant. Please read the prospectus carefully before investing to make sure that the fund is
appropriate for your goals and risk tolerance. The performance information shown represents past performance and is not a guarantee of future results. The
investment return and principal value of an investment will fluctuate so that the shares, when redeemed, may be worth more or less than their original cost. The
performance information shown reflects performance without adjusting for sales charges. If adjusted for sales charges, the load would reduce the performance quoted.
Current performance may be lower or higher than the performance information shown. For performance data current to the most recent month-end, please reference
the Investment Company Contact Information section. Returns shown in bold italics indicates Extended performance.
Peer Group / Investment Name
Total Return
1-Year 5-Year 10-Year
Expense Ratio
Inception
Date
% Allocation Net YTDPer $1k
investedType
10.61 13.96 5.81 8.53Large Blend (Index: S&P 500 TR)
Columbia Large Cap Core A 12.11 4.86 7.90 1.20 6.0MF 10/02/1998 9.27$12.00
9.54 10.09 7.30 8.62Large Growth (Index: Russell 1000 Growth TR USD)
American Century Growth A 5.87 5.70 8.29 1.22 2.0MF 06/30/1971 7.95$12.20
12.31 18.77 4.85 9.18Large Value (Index: Russell 1000 Value TR USD)
American Century Value A 15.64 6.11 8.68 1.26 1.0MF 09/01/1993 11.60$12.60
13.45 17.83 9.85 12.45Mid-Cap Blend (Index: S&P MidCap 400 TR)
Columbia Mid Cap Index A 17.29 9.44 12.04 0.46 2.0MF 03/31/2000 13.33$4.60
12.39 16.30 8.24 11.52Small Blend (Index: Russell 2000 TR USD)
Columbia Small Cap Core A 11.48 8.10 11.11 1.38 3.0MF 12/14/1992 10.11$13.80
-1.62 1.96 1.09 17.05Diversified Emerging Mkts (Index: MSCI EM NR USD)
BlackRock Emerging Mkts Inv A 2.84 1.11 15.97 1.68 2.0MF 09/01/1989 -1.16$16.80
7.04 13.19 6.07 12.10Real Estate (Index: DJ US Select REIT TR USD)
PIMCO Real Estate Real Return Strategy A 22.69 12.41 1.14 3.0MF 10/30/2003 6.75$11.40
-1.98 8.94 9.55 7.52Long-Term Bond (Index: Barclays US Govt/Credit Long TR USD)
Western Asset Corporate Bond A 9.24 7.38 4.96 1.02 4.0MF 01/04/1982 -0.08$10.20
0.24 6.70 7.16 6.12Intermediate-Term Bond (Index: Barclays US Govt/Credit 5-10 Yr TR USD)
Pioneer Bond A 6.95 6.95 6.10 0.85 6.0MF 10/31/1978 0.95$8.50
-3.82 -2.16 2.28 5.58World Bond (Index: Citi WGBI NonUSD USD)
AllianceBern Global Bond A 6.22 6.25 7.64 0.91 4.0MF 03/27/1992 0.89$9.10
6.82 10.91 5.36 9.79Moderate Allocation (Index: Morningstar Moderately Aggr Target Risk)
Virtus Allocator Premium AlphaSector A 8.49 2.02 13.0MF 03/15/2011 4.61$20.20
0.02 0.09 0.28 1.72Money Market Taxable (Index: USTREAS T-Bill Auction Ave 3 Mon)
Western Asset Instl Liqd Rsrvs Instl 0.17 0.67 1.98 0.20 54.0MF 10/02/1992 0.03$2.00
100.0 0.73Weighted Average
1-Year Model Turnover: 7.74%
Page 5 of 25
Fund data as of 3/31/2013
Analysis, search process, and layout are © 2000-2013, fi360, Inc. (www.fi360.com). All rights reserved. The analysis and opinions generated by fi360: (1) do not constitute professional investment advice; (2) are provided
solely for informational purposes; (3) are not warranted or represented to be correct, complete, or accurate; and (4) are for the exclusive use of subscribers to fi360. The data source is © 2013 Morningstar, Inc. All rights
reserved. The data contained herein: (1) is proprietary to Morningstar, Inc and/or its content providers; (2) may not be copied or distributed; and (3) is not warranted to be accurate, complete or timely. Neither Morningstar,
Inc nor its content providers are responsible for any damages or losses arising from any use of this information. Past performance is no guarantee of future results.
fi360_Portrait_v4_3

Models - Factsheet: AggressiveThis model attempts to outperform the s&p 500 by taking on additional risk. It is appropriate for individuals with a high risk tolerance.
Current Model Allocations as of 3/31/2013 Risk Level
0
5
10 15
20
25Current
3-Year 5-Year
Developed International Equity 20.0%Emerging Market Equity 15.0%Large-Cap Equity 15.0%Real Estate 12.0%Small-Cap Equity 10.0%Mid-Cap Equity 8.0%Alternative 6.0%Long-Term Fixed Income 5.0%Stable Value / Money Market 5.0%International Fixed Income 4.0%
Total: 100.0%
Using the model's 3-year and 5-year standard deviation (if available) as the
benchmark, the gauge below reflects, on a relative scale, the risk associated
with this model.
The current model allocation is shown below. Specific investment positions may be
found in the table below.
Current Model Performance vs Benchmark(s)
Model Tactical Peer
Group
Benchmark
Strategic Peer
Group
Benchmark
Custom
Benchmark
1-Month 1.62 1.73 1.32 1.99
3-Month 4.52 4.92 3.80 5.32
YTD 4.52 4.92 3.80 5.32
1-Year 9.14 8.97 8.22 8.11
3-Year 9.72 8.22 8.51 9.17
5-Year 4.98 3.48 5.19 6.72
10-Year 10.78 9.21 9.22 7.56
Return Since
Inception
8.71 7.28 7.49 6.04
Growth of 10k 25,253.06 21,799.48 22,267.25 19,154.76
Growth of a $10,000 investment
$8,000
$10,000
$12,000
$14,000
$16,000
$18,000
$20,000
$22,000
$24,000
$26,000
2/20
02
2/20
03
2/20
04
2/20
05
2/20
06
2/20
07
2/20
08
2/20
09
2/20
10
2/20
11
2/20
12
2/20
13
As of Date: 3/31/2013
Inception Date: 2/28/2002
Rebalancing Frequency: Quarterly
Model Performance (+/-) the Tactical Peer Group Benchmark
This section will report the performance of the model as compared to its tactical peer group benchmark. A positive return indicates benchmark outperformance.
Based on the amount of model history entered, a 1-, 3-, 5- and 10-Year return will be available through the most recent model update. Please view the appendix for
additional details and benchmark compositions.
-2
0
2
4
6
8
10
3/20
02
3/20
03
3/20
04
3/20
05
3/20
06
3/20
07
3/20
08
3/20
09
3/20
10
3/20
11
3/20
12
3/20
13
1-Month 3-Month 1-Year 3-Year 5-Year 10-Year
Page 6 of 25
Fund data as of 3/31/2013
Analysis, search process, and layout are © 2000-2013, fi360, Inc. (www.fi360.com). All rights reserved. The analysis and opinions generated by fi360: (1) do not constitute professional investment advice; (2) are provided
solely for informational purposes; (3) are not warranted or represented to be correct, complete, or accurate; and (4) are for the exclusive use of subscribers to fi360. The data source is © 2013 Morningstar, Inc. All rights
reserved. The data contained herein: (1) is proprietary to Morningstar, Inc and/or its content providers; (2) may not be copied or distributed; and (3) is not warranted to be accurate, complete or timely. Neither Morningstar,
Inc nor its content providers are responsible for any damages or losses arising from any use of this information. Past performance is no guarantee of future results.
fi360_Portrait_v4_3

Models - Factsheet: AggressiveUnderlying Investments as of 3/31/2013Investors should consider the investment objectives, risks, and charges and expenses of a fund carefully before investing. Prospectuses containing this and other
information about the fund are available by contacting your financial consultant. Please read the prospectus carefully before investing to make sure that the fund is
appropriate for your goals and risk tolerance. The performance information shown represents past performance and is not a guarantee of future results. The
investment return and principal value of an investment will fluctuate so that the shares, when redeemed, may be worth more or less than their original cost. The
performance information shown reflects performance without adjusting for sales charges. If adjusted for sales charges, the load would reduce the performance quoted.
Current performance may be lower or higher than the performance information shown. For performance data current to the most recent month-end, please reference
the Investment Company Contact Information section. Returns shown in bold italics indicates Extended performance.
Peer Group / Investment Name
Total Return
1-Year 5-Year 10-Year
Expense Ratio
Inception
Date
% Allocation Net YTDPer $1k
investedType
10.61 13.96 5.81 8.53Large Blend (Index: S&P 500 TR)
Columbia Large Cap Core A 12.11 4.86 7.90 1.20 15.0MF 10/02/1998 9.27$12.00
13.45 17.83 9.85 12.45Mid-Cap Blend (Index: S&P MidCap 400 TR)
Columbia Mid Cap Index A 17.29 9.44 12.04 0.46 8.0MF 03/31/2000 13.33$4.60
12.39 16.30 8.24 11.52Small Blend (Index: Russell 2000 TR USD)
Columbia Small Cap Core A 11.48 8.10 11.11 1.38 10.0MF 12/14/1992 10.11$13.80
3.17 8.36 -0.39 10.93Foreign Large Blend (Index: MSCI ACWI Ex USA NR USD)
MFS Research International A 9.22 -0.31 9.91 1.22 12.0MF 01/02/1997 3.93$12.20
ING Diversified International A 7.02 -1.83 1.65 8.0MF 12/21/2005 2.59$16.50
-1.62 1.96 1.09 17.05Diversified Emerging Mkts (Index: MSCI EM NR USD)
BlackRock Emerging Mkts Inv A 2.84 1.11 15.97 1.68 15.0MF 09/01/1989 -1.16$16.80
7.04 13.19 6.07 12.10Real Estate (Index: DJ US Select REIT TR USD)
PIMCO Real Estate Real Return Strategy A 22.69 12.41 1.14 12.0MF 10/30/2003 6.75$11.40
-1.98 8.94 9.55 7.52Long-Term Bond (Index: Barclays US Govt/Credit Long TR USD)
Western Asset Corporate Bond A 9.24 7.38 4.96 1.02 5.0MF 01/04/1982 -0.08$10.20
-3.82 -2.16 2.28 5.58World Bond (Index: Citi WGBI NonUSD USD)
AllianceBern Global Bond A 6.22 6.25 7.64 0.91 4.0MF 03/27/1992 0.89$9.10
-12.92 -17.12 -9.94 11.47Equity Precious Metals (Index: MSCI World/Metals&Mining PR USD)
Wells Fargo Advantage Precious Metals A -21.14 -1.29 15.20 1.10 6.0MF 01/30/1978 -16.79$11.00
0.02 0.09 0.28 1.72Money Market Taxable (Index: USTREAS T-Bill Auction Ave 3 Mon)
Western Asset Instl Liqd Rsrvs Instl 0.17 0.67 1.98 0.20 5.0MF 10/02/1992 0.03$2.00
100.0 1.19Weighted Average
1-Year Model Turnover: 0.00%
Page 7 of 25
Fund data as of 3/31/2013
Analysis, search process, and layout are © 2000-2013, fi360, Inc. (www.fi360.com). All rights reserved. The analysis and opinions generated by fi360: (1) do not constitute professional investment advice; (2) are provided
solely for informational purposes; (3) are not warranted or represented to be correct, complete, or accurate; and (4) are for the exclusive use of subscribers to fi360. The data source is © 2013 Morningstar, Inc. All rights
reserved. The data contained herein: (1) is proprietary to Morningstar, Inc and/or its content providers; (2) may not be copied or distributed; and (3) is not warranted to be accurate, complete or timely. Neither Morningstar,
Inc nor its content providers are responsible for any damages or losses arising from any use of this information. Past performance is no guarantee of future results.
fi360_Portrait_v4_3

Peer Group Definitions
Diversified Emerging Mkts
Diversified emerging-markets portfolios tend to divide their assets among 20 or more nations, although they tend to focus on the emerging markets of Asia and Latin America
rather than on those of the Middle East, Africa, or Europe. These portfolios invest at least 70% of total assets in equities and invest at least 50% of stock assets in emerging
markets.
Equity Precious Metals
Precious metals portfolios focus on mining stocks, though some do own small amounts of gold bullion. Most portfolios concentrate on gold-mining stocks, but some have
significant exposure to silver-, platinum-, and base-metal-mining stocks as well. Precious-metals companies are typically based in North America, Australia, or South Africa.
Foreign Large Blend
Foreign large-blend portfolios invest in a variety of big international stocks. Most of these portfolios divide their assets among a dozen or more developed markets, including
Japan, Britain, France, and Germany. These portfolios primarily invest in stocks that have market caps in the top 70% of each economically integrated market (such as Europe
or Asia ex-Japan). The blend style is assigned to portfolios where neither growth nor value characteristics predominate. These portfolios typically will have less than 20% of
assets invested in U.S. stocks.
Intermediate-Term Bond
Intermediate-term bond portfolios invest primarily in corporate and other investment-grade U.S. fixed-income issues and typically have durations of 3.5 to six years. These
portfolios are less sensitive to interest rates, and therefore less volatile, than portfolios that have longer durations. Morningstar calculates monthly breakpoints using the
effective duration of the Morningstar Core Bond Index (MCBI) in determing duration assignment. Intermediate-term is defined as 75% to 125% of the 3 year average effective
duration of the MCBI.
Large Blend
Large-blend portfolios are fairly representative of the overall U.S. stock market in size, growth rates, and price. Stocks in the top 70% of the capitalization of the U.S. equity
market are defined as large-cap. The blend style is assigned to portfolios where neither growth nor value characteristics predominate. These portfolios tend to invest across
the spectrum of U.S. industries, and owing to their broad exposure, the portfolios' returns are often similar to those of the S&P 500 Index.
Large Growth
Large-growth portfolios invest in big U.S. companies that are projected to grow faster than other large-cap stocks. Stocks in the top 70% of the capitalization of the U.S. equity
market are defined as large-cap. Growth is defined based on fast growth (high growth rates for earnings, sales, book value, and cash flow) and high valuations (high price
ratios and low dividend yields). Most of these portfolios focus on companies in rapidly expanding industries.
Large Value
Large-value portfolios invest primarily in big U.S. companies that are less expensive or growing more slowly than other large-cap stocks. Stocks in the top 70% of the
capitalization of the U.S. equity market are defined as large-cap. Value is defined based on low valuations (low price ratios and high dividend yields) and slow growth (low
growth rates for earnings, sales, book value, and cash flow).
Long-Term Bond
Long-term bond portfolios invest primarily in corporate and other investment-grade U.S. fixed-income issues and typically have durations of more than six years. Due to their
long durations, these portfolios are exposed to greater interest rate risk. Morningstar calculates monthly breakpoints using the effective duration of the Morningstar Core Bond
Index (MCBI) in determing duration assignment. Long-term is defined as 125% of the 3 year average effective duration of the MCBI.
Mid-Cap Blend
The typical mid-cap blend portfolio invests in U.S. stocks of various sizes and styles, giving it a middle-of-the-road profile. Most shy away from high-priced growth stocks, but
aren't so price-conscious that they land in value territory. The U.S. mid-cap range for market capitalization typically falls between $1 billion-$8 billion and represents 20% of the
total capitalization of the U.S. equity market. The blend style is assigned to portfolios where neither growth nor value characteristics predominate.
Moderate Allocation
Moderate-allocation portfolios seek to provide both capital appreciation and income by investing in three major areas: stocks, bonds, and cash. These portfolios tend to hold
larger positions in stocks than conservative-allocation portfolios. These portfolios typically have 50% to 70% of assets in equities and the remainder in fixed income and cash.
Money Market Taxable
These portfolios invest in short-term money market securities in order to provide a level of current income that is consistent with the preservation of capital.
Real Estate
These portfolios seek capital appreciation by investing primarily in US or non-US real-estate-related equity securities.
Short-Term Bond
Short-term bond portfolios invest primarily in corporate and other investment-grade U.S. fixed-income issues and typically have durations of one to 3.5 years. These portfolios
are attractive to fairly conservative investors, because they are less sensitive to interest rates than portfolios with longer durations. Morningstar calculates monthly breakpoints
using the effective duration of the Morningstar Core Bond Index (MCBI) in determing duration assignment. Short-term is defined as 25% to 75% of the 3 year average effective
duration of the MCBI.
Small Blend
Small-blend portfolios favor U.S. firms at the smaller end of the market-capitalization range. Some aim to own an array of value and growth stocks while others employ a
discipline that leads to holdings with valuations and growth rates close to the small-cap averages. Stocks in the bottom 10% of the capitalization of the U.S. equity market are
defined as small-cap. The blend style is assigned to portfolios where neither growth nor value characteristics predominate.
World Bond
World bond portfolios invest 40% or more of their assets in foreign bonds. Some world bond portfolios follow a conservative approach, favoring high-quality bonds from
developed markets. Others are more adventurous, and own some lower-quality bonds from developed or emerging markets. Some portfolios invest exclusively outside the
U.S., while others regularly invest in both U.S. and non-U.S. bonds.
World Stock
World-stock portfolios have few geographical limitations. It is common for these portfolios to invest the majority of their assets in the U.S., Europe, and Japan, with the
remainder divided among the globe's smaller markets. These portfolios typically have 20%-60% of assets in U.S. stocks.
Page 8 of 25
Fund data as of 3/31/2013
Analysis, search process, and layout are © 2000-2013, fi360, Inc. (www.fi360.com). All rights reserved. The analysis and opinions generated by fi360: (1) do not constitute professional investment advice; (2) are provided
solely for informational purposes; (3) are not warranted or represented to be correct, complete, or accurate; and (4) are for the exclusive use of subscribers to fi360. The data source is © 2013 Morningstar, Inc. All rights
reserved. The data contained herein: (1) is proprietary to Morningstar, Inc and/or its content providers; (2) may not be copied or distributed; and (3) is not warranted to be accurate, complete or timely. Neither Morningstar,
Inc nor its content providers are responsible for any damages or losses arising from any use of this information. Past performance is no guarantee of future results.
fi360_Portrait_v4_3

Glossary Fund Family
A company which offers mutual funds. Generally speaking, the company name is included in the official fund name. (Description provided by Morningstar)
Strategic Allocation
A strategic allocation is a long term, or market neutral allocation decision set to meet an expected risk/ return profile. An allocation profile may deviate from the strategic
allocation from time to time, but the strategic allocation is not expected to change very frequently. (Description provided by fi360)
Tactical Allocation
A tactical allocation is the implementation of a strategic allocation, both in terms of investment vehicle selection and short term allocation changes. Tactical allocation changes
may be made to over-weight or under-weight certain asset classes for small periods of time to take advantage of short term shifts in an investors view of the market and
economy. (Description provided by fi360)
Page 9 of 25
Fund data as of 3/31/2013
Analysis, search process, and layout are © 2000-2013, fi360, Inc. (www.fi360.com). All rights reserved. The analysis and opinions generated by fi360: (1) do not constitute professional investment advice; (2) are provided
solely for informational purposes; (3) are not warranted or represented to be correct, complete, or accurate; and (4) are for the exclusive use of subscribers to fi360. The data source is © 2013 Morningstar, Inc. All rights
reserved. The data contained herein: (1) is proprietary to Morningstar, Inc and/or its content providers; (2) may not be copied or distributed; and (3) is not warranted to be accurate, complete or timely. Neither Morningstar,
Inc nor its content providers are responsible for any damages or losses arising from any use of this information. Past performance is no guarantee of future results.
fi360_Portrait_v4_3

Investment Company Contact Information For performance data current to the most recent month-end, please contact the investment company using the number(s) provided below.
Phone Number(s)Company Name
AllianceBernstein 800-221-5672
American Century Investments 800-345-2021
American Funds 800-421-4225
BlackRock 800-441-7762
Columbia 800-345-6611
Delaware Investments 800-523-1918
Dreyfus 800-373-9387
GuideStone Funds 888-984-8433
ING Funds 800-992-0180
Legg Mason 877-721-1926
MFS 800-225-2606
OppenheimerFunds 800-225-5677
PIMCO 800-426-0107
888-877-4626
Pioneer Investments 800-225-6292
Vanguard 800-662-7447
Virtus 800-243-1574
Wells Fargo Advantage 800-222-8222
Page 10 of 25
Fund data as of 3/31/2013
Analysis, search process, and layout are © 2000-2013, fi360, Inc. (www.fi360.com). All rights reserved. The analysis and opinions generated by fi360: (1) do not constitute professional investment advice; (2) are provided
solely for informational purposes; (3) are not warranted or represented to be correct, complete, or accurate; and (4) are for the exclusive use of subscribers to fi360. The data source is © 2013 Morningstar, Inc. All rights
reserved. The data contained herein: (1) is proprietary to Morningstar, Inc and/or its content providers; (2) may not be copied or distributed; and (3) is not warranted to be accurate, complete or timely. Neither Morningstar,
Inc nor its content providers are responsible for any damages or losses arising from any use of this information. Past performance is no guarantee of future results.
fi360_Portrait_v4_3

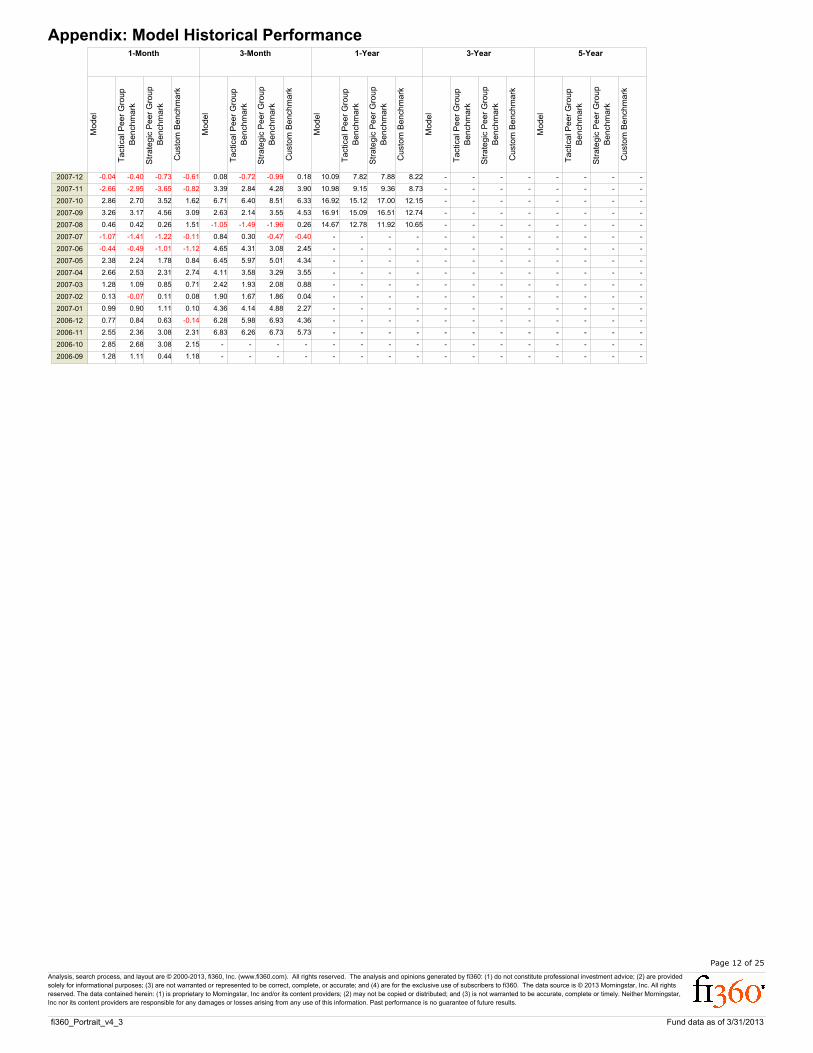
Appendix: Model Historical PerformanceModerate
1-Month 3-Month 1-Year 3-Year 5-Year
Mod
el
Tact
ica
l Peer
Gro
up
Bench
mark
Str
ate
gic
Peer
Gro
up
Ben
chm
ark
Cu
stom
Bench
mark
Mod
el
Tact
ica
l Peer
Gro
up
Bench
mark
Str
ate
gic
Peer
Gro
up
Ben
chm
ark
Cu
stom
Bench
mark
Mod
el
Tact
ica
l Peer
Gro
up
Bench
mark
Str
ate
gic
Peer
Gro
up
Ben
chm
ark
Cu
stom
Bench
mark
Mod
el
Tact
ica
l Peer
Gro
up
Bench
mark
Str
ate
gic
Peer
Gro
up
Ben
chm
ark
Cu
stom
Bench
mark
Mod
el
Tact
ica
l Peer
Gro
up
Bench
mark
Str
ate
gic
Peer
Gro
up
Ben
chm
ark
Cu
stom
Bench
mark
2013-03 1.78 1.81 1.13 1.72 5.53 5.24 2.57 3.79 10.29 9.29 6.33 6.60 9.09 8.49 7.79 8.61 7.03 5.57 4.95 5.09
2013-02 0.39 0.39 -0.24 0.13 5.33 4.98 2.75 2.02 9.19 8.22 5.22 5.96 10.02 9.33 8.94 8.80 6.50 5.01 4.53 5.00
2013-01 3.27 2.97 1.67 1.90 6.00 5.42 3.29 2.07 12.16 10.97 7.68 7.64 10.58 9.85 9.72 9.36 6.34 4.77 4.57 4.91
2012-12 1.59 1.56 1.31 -0.02 2.09 1.91 1.37 -1.08 13.90 12.66 10.23 8.84 8.62 8.01 8.13 8.04 4.99 3.41 3.56 4.26
2012-11 1.03 0.80 0.28 0.19 2.54 2.38 1.99 0.85 12.26 10.88 8.38 9.87 8.84 8.13 8.17 7.50 4.65 3.01 3.14 4.14
2012-10 -0.55 -0.46 -0.23 -1.25 3.41 3.34 3.34 2.16 9.79 8.85 6.76 8.76 9.69 9.02 9.57 9.05 3.87 2.23 2.32 3.93
2012-09 2.05 2.03 1.94 1.94 5.05 4.76 4.48 4.75 19.29 17.74 13.56 16.37 9.22 8.57 9.02 9.18 4.58 2.87 3.08 4.53
2012-08 1.89 1.75 1.60 1.49 5.68 5.27 4.80 4.94 8.87 7.76 4.76 8.90 10.00 9.24 10.04 9.57 4.82 3.10 3.60 4.76
2012-07 1.03 0.90 0.88 1.25 -1.36 -1.58 -1.14 -0.06 2.08 1.17 -0.21 5.58 10.19 9.43 10.51 10.04 4.53 2.83 3.32 4.77
2012-06 2.65 2.54 2.24 2.13 -2.55 -2.72 -2.12 -0.87 -0.21 -0.62 -1.15 4.49 11.97 11.36 12.66 11.25 4.09 2.36 2.89 4.49
2012-05 -4.90 -4.88 -4.16 -3.35 -4.34 -4.35 -4.19 -1.86 -4.10 -4.29 -4.53 1.57 11.24 10.58 11.69 10.54 3.45 1.74 2.23 3.81
2012-04 -0.18 -0.27 -0.11 0.43 3.73 3.50 2.06 3.29 -0.07 -0.23 -1.35 4.39 15.30 14.61 16.13 13.46 4.99 3.22 3.46 4.70
2012-03 0.77 0.82 0.08 1.11 8.98 8.48 6.33 5.97 2.99 2.75 2.02 7.22 19.04 17.80 19.48 15.18 5.58 3.79 3.96 5.17
2012-02 3.13 2.94 2.10 1.72 8.30 7.56 5.83 5.78 3.10 2.78 2.48 6.25 21.06 19.71 21.76 16.89 5.69 3.85 4.12 5.09
2012-01 4.88 4.53 4.07 3.04 3.76 3.40 2.41 3.13 2.30 2.06 2.91 6.50 17.35 16.12 18.24 13.54 5.07 3.24 3.71 4.75
2011-12 0.13 -0.04 -0.39 0.93 6.91 6.50 4.43 5.76 -1.77 -1.72 -0.95 4.60 13.54 12.33 14.38 10.01 4.28 2.51 3.12 4.14
2011-11 -1.19 -1.04 -1.21 -0.83 -0.56 -0.50 -1.41 -0.04 2.58 2.46 3.59 8.02 15.22 13.98 17.13 11.17 4.41 2.69 3.33 3.93
2011-10 8.06 7.67 6.12 5.67 -3.85 -3.95 -3.42 -0.82 3.36 3.08 3.84 6.50 14.14 12.74 16.07 11.00 5.19 3.38 4.21 4.57
2011-09 -6.86 -6.61 -5.96 -4.61 -12.11 -11.57 -9.05 -5.95 -1.92 -1.78 0.44 3.46 6.15 4.72 7.03 5.57 4.16 2.41 3.61 3.87
2011-08 -4.46 -4.48 -3.22 -1.60 -6.91 -6.50 -4.50 -2.12 12.53 12.27 13.79 14.65 5.83 4.20 6.10 5.38 5.92 4.05 4.98 5.10
2011-07 -1.23 -0.88 -0.07 0.20 -3.44 -2.94 -2.27 -1.19 15.20 14.86 16.27 15.09 7.42 5.75 6.76 5.81 - - - -
2011-06 -1.35 -1.25 -1.26 -0.74 0.57 0.58 1.02 1.72 22.52 21.97 22.70 20.92 7.56 5.69 6.09 5.66 - - - -
2011-05 -0.90 -0.84 -0.96 -0.66 2.85 2.72 2.85 2.67 21.44 20.63 22.40 19.70 6.38 4.45 4.76 4.48 - - - -
2011-04 2.87 2.72 3.29 3.15 6.19 5.88 6.46 5.37 15.58 14.94 16.71 14.81 7.29 5.23 5.57 4.69 - - - -
2011-03 0.88 0.85 0.53 0.20 3.95 3.76 3.23 3.38 14.29 13.71 15.44 12.09 7.33 5.30 5.49 3.89 - - - -
2011-02 2.32 2.21 2.52 1.95 7.74 7.22 6.98 7.54 18.31 17.48 19.92 14.38 6.76 4.71 5.00 4.26 - - - -
2011-01 0.70 0.66 0.16 1.20 4.83 4.44 3.33 3.13 17.85 17.04 19.21 14.10 5.82 3.68 4.11 3.49 - - - -
2010-12 4.56 4.21 4.18 4.23 6.74 6.44 5.89 4.61 14.56 13.80 15.80 10.79 4.47 2.22 2.95 2.67 - - - -
2010-11 -0.44 -0.44 -0.98 -2.23 9.09 9.02 8.29 6.09 11.96 11.29 12.73 4.68 2.91 0.69 1.30 1.06 - - - -
2010-10 2.53 2.59 2.65 2.65 7.17 7.02 8.14 7.19 16.30 15.47 18.67 11.97 2.14 -0.16 0.38 1.54 - - - -
2010-09 6.87 6.74 6.54 5.71 9.80 9.81 11.11 9.93 11.36 10.67 13.62 8.10 2.25 -0.12 0.67 1.20 - - - -
2010-08 -2.19 -2.27 -1.11 -1.22 0.46 0.46 2.72 2.19 8.63 7.77 11.78 5.37 1.09 -1.25 0.04 0.36 - - - -
2010-07 5.05 5.26 5.46 5.28 -3.13 -2.87 -1.90 -1.43 13.76 12.77 16.32 9.64 2.00 -0.35 0.50 1.27 - - - -
2010-06 -2.22 -2.34 -1.50 -1.74 -6.19 -6.23 -4.96 -5.71 14.80 13.93 17.89 8.99 -0.02 -2.50 -1.67 -0.48 - - - -
2010-05 -5.69 -5.51 -5.56 -4.72 0.19 0.04 0.77 -1.89 18.19 17.13 19.24 11.09 0.58 -1.89 -1.51 -0.28 - - - -
2010-04 1.73 1.62 2.18 0.70 8.28 7.81 8.74 4.72 32.73 31.27 36.02 21.87 3.37 0.72 0.98 1.63 - - - -
2010-03 4.43 4.19 4.43 2.25 4.19 3.84 3.55 2.18 43.31 39.90 44.82 27.14 3.68 1.02 1.03 2.31 - - - -
2010-02 1.93 1.83 1.91 1.70 1.96 1.57 0.57 -1.58 45.48 42.08 46.88 31.41 2.63 0.01 -0.14 1.79 - - - -
2010-01 -2.12 -2.13 -2.71 -1.74 3.45 3.04 2.86 1.21 34.03 31.08 34.76 20.46 2.03 -0.62 -0.73 1.25 - - - -
2009-12 2.19 1.91 1.42 -1.52 3.76 3.52 3.90 2.07 30.07 26.73 30.49 14.90 3.09 0.40 0.55 1.87 - - - -
2009-11 3.42 3.30 4.24 4.59 5.85 5.57 7.38 6.79 33.21 29.88 37.63 21.51 2.61 0.04 0.29 2.35 - - - -
2009-10 -1.83 -1.67 -1.72 -0.90 4.83 4.52 6.01 4.95 23.70 20.39 26.92 14.68 2.32 -0.26 -0.09 1.60 - - - -
2009-09 4.25 3.94 4.82 3.04 13.19 13.04 15.29 10.83 9.52 5.65 7.44 5.21 3.92 1.19 1.51 2.63 - - - -
2009-08 2.42 2.27 2.91 2.78 9.30 9.20 9.59 7.74 -3.03 -6.49 -6.10 -3.13 2.93 0.26 0.08 2.01 - - - -
2009-07 6.01 6.34 6.89 4.65 13.02 13.06 14.72 9.56 -5.43 -8.69 -10.02 -6.12 - - - - - - - -
2009-06 0.67 0.41 -0.37 0.16 17.11 15.14 16.75 9.99 -11.53 -15.05 -17.45 -10.48 - - - - - - - -
2009-05 5.91 5.89 7.73 4.52 23.32 21.34 24.12 16.05 -16.13 -19.36 -21.22 -14.24 - - - - - - - -
2009-04 9.84 8.30 8.78 5.07 9.34 7.66 7.73 3.51 -19.49 -22.77 -25.87 -18.00 - - - - - - - -
2009-03 6.00 5.81 5.91 5.68 -5.43 -5.94 -6.70 -7.66 -24.52 -26.62 -29.78 -21.33 - - - - - - - -
2009-02 -6.09 -6.06 -6.49 -6.77 -6.63 -7.15 -5.77 -9.00 -29.29 -31.22 -34.28 -24.60 - - - - - - - -
2009-01 -5.00 -5.37 -5.79 -6.27 -4.52 -5.37 -3.13 -3.65 -24.97 -27.35 -29.76 -19.35 - - - - - - - -
2008-12 4.66 4.44 6.97 4.14 -12.64 -13.70 -14.45 -6.55 -23.48 -25.94 -27.79 -14.98 - - - - - - - -
2008-11 -3.96 -4.25 -3.87 -1.29 -22.95 -23.99 -26.74 -14.86 -26.92 -29.37 -32.99 -18.85 - - - - - - - -
2008-10 -13.08 -13.71 -16.81 -9.09 -19.86 -20.73 -24.85 -14.09 -25.92 -28.41 -32.83 -18.46 - - - - - - - -
2008-09 -7.70 -8.01 -8.39 -5.13 -8.57 -9.11 -11.41 -5.70 -12.34 -14.79 -16.43 -8.86 - - - - - - - -
2008-08 -0.11 -0.14 -1.39 -0.39 -5.46 -5.83 -8.06 -4.62 -1.93 -4.44 -4.61 -0.97 - - - - - - - -
2008-07 -0.83 -1.06 -1.93 -0.21 -3.77 -4.37 -5.49 -4.30 -1.37 -3.91 -3.02 0.92 - - - - - - - -
2008-06 -4.56 -4.69 -4.92 -4.05 -0.08 -0.54 -0.69 -3.33 -1.61 -4.25 -2.32 1.02 - - - - - - - -
2008-05 1.67 1.41 1.36 -0.05 3.97 3.48 3.55 2.03 2.64 -0.03 1.71 4.10 - - - - - - - -
2008-04 2.97 2.90 3.05 0.80 1.90 1.26 2.09 1.80 3.36 0.78 2.13 5.03 - - - - - - - -
2008-03 -0.69 -0.84 -0.87 1.28 -4.13 -5.07 -4.05 -0.20 3.05 0.42 1.40 7.06 - - - - - - - -
2008-02 -0.36 -0.77 -0.06 -0.28 -3.50 -4.65 -3.92 -2.06 5.10 2.37 3.15 6.45 - - - - - - - -
2008-01 -3.12 -3.53 -3.15 -1.19 -5.73 -6.74 -7.37 -2.59 5.61 3.09 3.33 6.83 - - - - - - - -
Page 11 of 25
Fund data as of 3/31/2013
Analysis, search process, and layout are © 2000-2013, fi360, Inc. (www.fi360.com). All rights reserved. The analysis and opinions generated by fi360: (1) do not constitute professional investment advice; (2) are provided
solely for informational purposes; (3) are not warranted or represented to be correct, complete, or accurate; and (4) are for the exclusive use of subscribers to fi360. The data source is © 2013 Morningstar, Inc. All rights
reserved. The data contained herein: (1) is proprietary to Morningstar, Inc and/or its content providers; (2) may not be copied or distributed; and (3) is not warranted to be accurate, complete or timely. Neither Morningstar,
Inc nor its content providers are responsible for any damages or losses arising from any use of this information. Past performance is no guarantee of future results.
fi360_Portrait_v4_3
Appendix: Model Historical Performance1-Month 3-Month 1-Year 3-Year 5-Year
Mode
l
Tact
ica
l Pe
er
Gro
up
Ben
chm
ark
Str
ate
gic
Pe
er
Gro
up
Ben
chm
ark
Cu
stom
Be
nch
mark
Mode
l
Tact
ica
l Pe
er
Gro
up
Ben
chm
ark
Str
ate
gic
Pe
er
Gro
up
Ben
chm
ark
Cu
stom
Be
nch
mark
Mode
l
Tact
ica
l Pe
er
Gro
up
Ben
chm
ark
Str
ate
gic
Pe
er
Gro
up
Ben
chm
ark
Cu
stom
Be
nch
mark
Mode
l
Tact
ica
l Pe
er
Gro
up
Ben
chm
ark
Str
ate
gic
Pe
er
Gro
up
Ben
chm
ark
Cu
stom
Be
nch
mark
Mode
l
Tact
ica
l Pe
er
Gro
up
Ben
chm
ark
Str
ate
gic
Pe
er
Gro
up
Ben
chm
ark
Cu
stom
Be
nch
mark
2007-12 -0.04 -0.40 -0.73 -0.61 0.08 -0.72 -0.99 0.18 10.09 7.82 7.88 8.22 - - - - - - - -
2007-11 -2.66 -2.95 -3.65 -0.82 3.39 2.84 4.28 3.90 10.98 9.15 9.36 8.73 - - - - - - - -
2007-10 2.86 2.70 3.52 1.62 6.71 6.40 8.51 6.33 16.92 15.12 17.00 12.15 - - - - - - - -
2007-09 3.26 3.17 4.56 3.09 2.63 2.14 3.55 4.53 16.91 15.09 16.51 12.74 - - - - - - - -
2007-08 0.46 0.42 0.26 1.51 -1.05 -1.49 -1.96 0.26 14.67 12.78 11.92 10.65 - - - - - - - -
2007-07 -1.07 -1.41 -1.22 -0.11 0.84 0.30 -0.47 -0.40 - - - - - - - - - - - -
2007-06 -0.44 -0.49 -1.01 -1.12 4.65 4.31 3.08 2.45 - - - - - - - - - - - -
2007-05 2.38 2.24 1.78 0.84 6.45 5.97 5.01 4.34 - - - - - - - - - - - -
2007-04 2.66 2.53 2.31 2.74 4.11 3.58 3.29 3.55 - - - - - - - - - - - -
2007-03 1.28 1.09 0.85 0.71 2.42 1.93 2.08 0.88 - - - - - - - - - - - -
2007-02 0.13 -0.07 0.11 0.08 1.90 1.67 1.86 0.04 - - - - - - - - - - - -
2007-01 0.99 0.90 1.11 0.10 4.36 4.14 4.88 2.27 - - - - - - - - - - - -
2006-12 0.77 0.84 0.63 -0.14 6.28 5.98 6.93 4.36 - - - - - - - - - - - -
2006-11 2.55 2.36 3.08 2.31 6.83 6.26 6.73 5.73 - - - - - - - - - - - -
2006-10 2.85 2.68 3.08 2.15 - - - - - - - - - - - - - - - -
2006-09 1.28 1.11 0.44 1.18 - - - - - - - - - - - - - - - -
Page 12 of 25
Fund data as of 3/31/2013
Analysis, search process, and layout are © 2000-2013, fi360, Inc. (www.fi360.com). All rights reserved. The analysis and opinions generated by fi360: (1) do not constitute professional investment advice; (2) are provided
solely for informational purposes; (3) are not warranted or represented to be correct, complete, or accurate; and (4) are for the exclusive use of subscribers to fi360. The data source is © 2013 Morningstar, Inc. All rights
reserved. The data contained herein: (1) is proprietary to Morningstar, Inc and/or its content providers; (2) may not be copied or distributed; and (3) is not warranted to be accurate, complete or timely. Neither Morningstar,
Inc nor its content providers are responsible for any damages or losses arising from any use of this information. Past performance is no guarantee of future results.
fi360_Portrait_v4_3

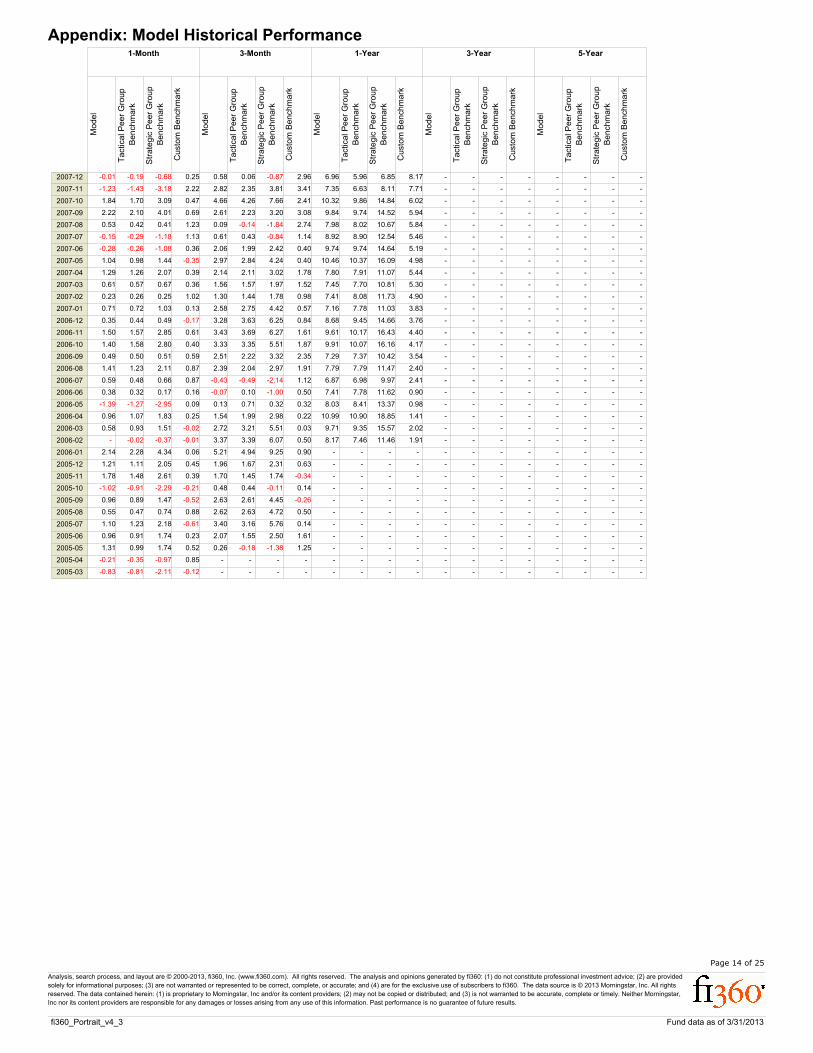
Appendix: Model Historical PerformanceConservative
1-Month 3-Month 1-Year 3-Year 5-Year
Mod
el
Tact
ica
l Peer
Gro
up
Bench
mark
Str
ate
gic
Peer
Gro
up
Ben
chm
ark
Cu
stom
Bench
mark
Mod
el
Tact
ica
l Peer
Gro
up
Bench
mark
Str
ate
gic
Peer
Gro
up
Ben
chm
ark
Cu
stom
Bench
mark
Mod
el
Tact
ica
l Peer
Gro
up
Bench
mark
Str
ate
gic
Peer
Gro
up
Ben
chm
ark
Cu
stom
Bench
mark
Mod
el
Tact
ica
l Peer
Gro
up
Bench
mark
Str
ate
gic
Peer
Gro
up
Ben
chm
ark
Cu
stom
Bench
mark
Mod
el
Tact
ica
l Peer
Gro
up
Bench
mark
Str
ate
gic
Peer
Gro
up
Ben
chm
ark
Cu
stom
Bench
mark
2013-03 0.81 0.88 0.60 0.05 1.64 1.70 1.38 0.16 4.65 4.31 3.64 1.24 4.50 4.12 6.85 2.41 3.86 3.16 4.81 2.63
2013-02 -0.14 -0.21 -0.06 0.23 1.51 1.54 1.45 0.06 4.08 3.54 3.06 0.99 4.97 4.48 8.03 2.23 3.64 2.93 4.54 2.69
2013-01 0.98 1.03 0.83 -0.12 1.94 1.88 1.65 0.05 5.57 4.92 4.19 0.46 5.32 4.86 8.67 2.26 3.68 2.97 4.52 2.90
2012-12 0.67 0.72 0.68 -0.05 0.75 0.65 0.72 0.05 6.97 6.12 5.52 0.90 4.62 4.11 7.60 2.67 3.28 2.52 3.83 3.37
2012-11 0.28 0.12 0.14 0.22 1.32 1.14 1.03 0.10 6.18 5.23 4.76 1.13 4.62 4.06 7.81 2.23 3.13 2.33 3.54 3.43
2012-10 -0.21 -0.19 -0.10 -0.12 1.97 2.07 1.69 -0.07 5.32 4.47 3.95 1.06 5.20 4.69 9.13 2.49 2.82 2.02 2.85 3.84
2012-09 1.25 1.20 0.99 - 2.89 2.75 2.37 0.45 8.92 8.06 7.23 1.28 5.05 4.48 8.65 2.62 3.24 2.40 3.50 3.96
2012-08 0.92 1.05 0.80 0.05 2.91 2.97 2.56 0.36 4.27 3.42 3.00 1.15 5.39 4.77 9.88 2.74 3.44 2.58 4.11 4.10
2012-07 0.70 0.48 0.56 0.40 -0.04 -0.33 -0.31 0.50 1.51 0.66 0.58 1.87 5.59 4.89 10.61 2.92 3.36 2.45 4.03 4.35
2012-06 1.27 1.41 1.18 -0.09 -0.68 -0.83 -0.83 0.58 0.84 0.17 0.19 2.25 6.47 5.77 12.72 2.88 3.18 2.29 3.67 4.50
2012-05 -1.98 -2.19 -2.03 0.19 -1.67 -2.09 -1.96 0.47 -1.08 -1.91 -1.65 2.36 6.06 5.22 12.22 2.80 2.86 1.95 3.20 4.59
2012-04 0.05 -0.03 0.03 0.48 1.60 1.23 1.10 -0.02 0.59 -0.09 -0.32 2.91 8.16 7.22 15.57 2.69 3.49 2.61 3.92 4.48
2012-03 0.27 0.13 0.04 -0.20 3.90 3.47 3.21 -0.18 1.97 1.40 2.73 3.19 9.76 8.64 18.65 2.36 3.75 2.87 4.34 4.46
2012-02 1.28 1.13 1.03 -0.30 3.55 3.21 3.12 0.20 2.09 1.49 3.16 3.32 10.71 9.54 20.70 2.74 3.82 2.96 4.47 4.58
2012-01 2.32 2.18 2.11 0.32 1.70 1.44 1.42 0.65 1.93 1.52 4.47 3.39 9.09 8.03 17.84 2.76 3.60 2.78 4.31 4.85
2011-12 -0.08 -0.13 -0.05 0.18 2.58 2.49 2.35 0.43 -0.32 -0.53 2.57 3.38 7.39 6.23 14.98 2.43 3.27 2.49 4.09 4.81
2011-11 -0.53 -0.60 -0.63 0.15 -0.50 -0.60 -0.67 0.12 1.37 1.37 6.31 2.51 8.47 7.31 17.48 2.66 3.36 2.60 4.20 4.74
2011-10 3.21 3.24 3.05 0.10 -1.72 -1.65 -1.61 0.73 1.60 1.58 5.97 1.93 8.14 7.06 16.36 3.35 3.78 3.05 4.92 4.84
2011-09 -3.08 -3.14 -2.99 -0.13 -4.74 -4.75 -4.35 1.40 -0.25 -0.42 5.31 2.22 4.30 3.46 8.94 3.75 3.41 2.71 4.87 4.90
2011-08 -1.75 -1.65 -1.57 0.76 -2.37 -2.34 -2.07 1.56 5.89 5.72 14.75 2.64 4.09 3.34 7.23 4.08 4.16 3.47 5.62 5.05
2011-07 0.04 -0.01 0.17 0.77 -0.94 -1.07 -1.20 1.53 7.25 6.96 15.66 2.36 4.65 3.79 7.43 4.06 4.83 4.08 6.39 5.07
2011-06 -0.66 -0.69 -0.68 0.02 0.43 0.39 1.68 1.51 9.61 9.50 21.20 2.19 4.42 3.56 6.78 3.97 4.94 4.18 6.50 5.09
2011-05 -0.32 -0.37 -0.69 0.73 1.49 1.31 2.85 1.41 9.50 9.47 20.65 3.03 3.90 3.07 5.42 4.10 5.16 4.39 6.68 5.12
2011-04 1.42 1.46 3.09 0.75 2.96 2.86 5.96 0.45 7.17 7.17 15.56 3.08 4.25 3.42 6.05 3.62 4.93 4.20 6.19 4.99
2011-03 0.39 0.22 0.47 -0.07 1.57 1.50 3.06 0.01 6.95 6.71 14.57 2.80 4.24 3.38 5.91 2.92 4.84 4.12 5.93 4.88
2011-02 1.12 1.16 2.31 -0.23 2.82 3.08 6.26 -0.59 8.85 8.53 18.59 2.39 4.01 3.21 5.50 3.06 4.88 4.26 6.15 4.90
2011-01 0.06 0.12 0.26 0.31 1.36 1.50 2.87 -0.77 8.55 8.25 17.91 2.95 3.65 2.81 4.64 3.57 4.64 4.02 5.59 4.94
2010-12 1.62 1.78 3.59 -0.67 2.66 2.60 5.08 -0.70 7.38 6.90 15.12 3.75 3.28 2.37 3.69 4.19 5.07 4.47 6.43 4.89
2010-11 -0.31 -0.39 -0.95 -0.41 3.94 3.67 7.22 0.25 6.38 5.63 12.52 3.06 2.73 1.71 2.24 4.52 4.99 4.33 6.11 5.12
2010-10 1.34 1.20 2.41 0.38 3.75 3.55 7.40 1.15 8.82 8.11 17.99 4.52 2.41 1.35 1.47 5.43 5.43 4.72 6.86 5.29
2010-09 2.89 2.84 5.70 0.28 4.67 4.74 10.08 1.38 6.71 6.00 13.59 4.37 2.58 1.52 1.69 5.46 4.93 4.27 5.87 5.17
2010-08 -0.50 -0.50 -0.79 0.49 0.96 1.12 2.97 1.94 6.02 5.18 12.26 4.46 2.36 1.28 1.15 5.60 4.53 3.88 5.01 5.00
2010-07 2.24 2.37 4.97 0.60 -1.02 -0.87 -1.29 2.24 8.14 7.20 16.33 4.56 2.71 1.59 1.55 5.86 4.75 4.08 5.33 5.08
2010-06 -0.76 -0.72 -1.13 0.84 -2.01 -2.17 -3.89 2.11 9.20 7.87 17.95 4.21 1.90 0.70 -0.47 6.05 4.52 3.85 4.76 4.83
2010-05 -2.44 -2.46 -4.89 0.78 0.89 0.44 1.09 0.79 10.14 8.50 19.11 3.01 2.07 0.85 -0.45 5.88 4.88 4.18 5.36 4.70
2010-04 1.22 1.02 2.21 0.48 4.29 3.89 8.12 0.32 17.38 15.10 34.02 2.09 3.27 2.03 1.71 5.48 5.67 4.91 6.79 4.65
2010-03 2.17 1.93 3.99 -0.47 1.97 1.68 3.55 0.93 21.24 18.49 41.94 1.09 3.29 2.11 1.66 5.45 5.37 4.63 6.12 4.72
2010-02 0.84 0.89 1.73 0.31 0.48 0.33 0.82 0.05 22.10 19.33 43.72 2.50 2.76 1.65 0.57 5.74 4.75 4.06 4.84 4.80
2010-01 -1.03 -1.13 -2.12 1.09 1.61 1.38 2.94 0.74 17.34 14.73 32.83 1.95 2.55 1.44 0.08 5.99 - - - -
2009-12 0.68 0.58 1.25 -1.33 2.02 1.75 3.68 -0.10 15.71 12.74 28.73 0.18 3.15 2.07 1.14 5.65 - - - -
2009-11 1.98 1.95 3.87 1.00 3.59 3.22 6.97 1.62 18.34 15.42 35.57 2.43 3.04 2.02 0.89 6.07 - - - -
2009-10 -0.63 -0.77 -1.41 0.24 3.10 2.67 5.88 1.19 14.39 11.73 26.00 3.61 2.88 1.90 0.56 5.93 - - - -
2009-09 2.23 2.04 4.46 0.37 7.12 6.59 14.31 1.22 6.61 4.93 8.09 4.67 3.58 2.70 1.97 5.99 - - - -
2009-08 1.50 1.41 2.81 0.58 4.88 4.31 9.25 0.52 0.46 -0.76 -4.28 5.17 2.99 2.18 0.67 6.06 - - - -
2009-07 3.23 3.01 6.44 0.27 7.43 6.44 13.72 -0.18 -1.19 -2.49 -7.84 5.29 2.95 2.12 0.44 6.16 - - - -
2009-06 0.10 -0.14 -0.16 -0.33 8.80 7.46 15.66 -0.95 -4.88 -5.96 -14.83 5.55 2.07 1.28 -1.41 6.38 - - - -
2009-05 3.97 3.48 7.02 -0.12 11.84 10.47 21.98 0.29 -7.00 -7.82 -18.47 6.29 2.16 1.43 -1.30 6.55 - - - -
2009-04 4.55 4.00 8.25 -0.50 4.26 3.55 7.16 0.18 -9.93 -10.33 -22.98 5.73 0.38 -0.15 -4.46 6.62 - - - -
2009-03 2.90 2.65 5.30 0.92 -2.68 -3.26 -6.09 0.02 -12.65 -12.62 -26.94 4.90 -0.78 -1.09 -6.39 6.89 - - - -
2009-02 -3.08 -3.00 -5.98 -0.23 -2.61 -2.96 -4.90 -0.02 -15.34 -15.12 -31.11 4.29 -1.53 -1.65 -7.53 6.56 - - - -
2009-01 -2.41 -2.84 -5.14 -0.66 -0.95 -1.27 -2.35 2.38 -12.58 -12.50 -26.84 5.84 -0.50 -0.65 -5.72 6.64 - - - -
2008-12 2.97 2.97 6.63 0.88 -6.00 -5.31 -12.95 4.37 -11.32 -10.98 -24.78 8.83 1.02 1.07 -2.68 6.89 - - - -
2008-11 -1.43 -1.32 -3.46 2.16 -12.06 -11.25 -24.47 4.34 -13.88 -13.71 -29.93 8.15 0.44 0.45 -4.10 6.74 - - - -
2008-10 -7.39 -6.81 -15.43 1.27 -10.94 -10.39 -22.55 2.84 -13.71 -13.81 -29.73 8.22 1.52 1.39 -2.13 6.12 - - - -
2008-09 -3.67 -3.49 -7.49 0.85 -4.42 -4.48 -9.92 2.07 -5.11 -5.94 -14.34 7.36 3.79 3.49 2.70 5.60 - - - -
2008-08 -0.17 -0.36 -1.01 0.69 -2.91 -3.11 -6.94 1.59 0.69 -0.48 -3.70 7.19 5.43 5.03 5.91 5.12 - - - -
2008-07 -0.62 -0.66 -1.64 0.52 -2.07 -2.12 -4.96 0.24 1.40 0.29 -2.31 7.77 5.68 5.32 6.53 5.19 - - - -
2008-06 -2.14 -2.11 -4.43 0.37 -0.09 -0.15 -0.80 -1.56 1.87 0.66 -1.86 8.42 6.29 5.99 7.89 4.79 - - - -
2008-05 0.69 0.65 1.10 -0.65 1.82 1.71 3.07 -1.59 3.81 2.57 1.58 8.41 7.40 7.06 10.16 4.74 - - - -
2008-04 1.40 1.34 2.68 -1.28 1.19 1.05 1.79 0.29 4.17 2.90 1.92 8.74 7.62 7.18 10.40 5.15 - - - -
2008-03 -0.27 -0.28 -0.70 0.34 -1.20 -1.44 -3.31 3.78 4.06 2.82 1.32 10.58 7.05 6.59 9.07 5.90 - - - -
2008-02 0.07 - -0.16 1.25 -0.94 -1.34 -3.28 3.69 4.98 3.70 2.73 10.60 6.85 6.40 8.55 5.74 - - - -
2008-01 -1.00 -1.16 -2.47 2.15 -2.23 -2.75 -6.21 4.68 5.15 3.98 3.15 10.35 - - - - - - - -
Page 13 of 25
Fund data as of 3/31/2013
Analysis, search process, and layout are © 2000-2013, fi360, Inc. (www.fi360.com). All rights reserved. The analysis and opinions generated by fi360: (1) do not constitute professional investment advice; (2) are provided
solely for informational purposes; (3) are not warranted or represented to be correct, complete, or accurate; and (4) are for the exclusive use of subscribers to fi360. The data source is © 2013 Morningstar, Inc. All rights
reserved. The data contained herein: (1) is proprietary to Morningstar, Inc and/or its content providers; (2) may not be copied or distributed; and (3) is not warranted to be accurate, complete or timely. Neither Morningstar,
Inc nor its content providers are responsible for any damages or losses arising from any use of this information. Past performance is no guarantee of future results.
fi360_Portrait_v4_3
Appendix: Model Historical Performance1-Month 3-Month 1-Year 3-Year 5-Year
Mode
l
Tact
ica
l Pe
er
Gro
up
Ben
chm
ark
Str
ate
gic
Pe
er
Gro
up
Ben
chm
ark
Cu
stom
Be
nch
mark
Mode
l
Tact
ica
l Pe
er
Gro
up
Ben
chm
ark
Str
ate
gic
Pe
er
Gro
up
Ben
chm
ark
Cu
stom
Be
nch
mark
Mode
l
Tact
ica
l Pe
er
Gro
up
Ben
chm
ark
Str
ate
gic
Pe
er
Gro
up
Ben
chm
ark
Cu
stom
Be
nch
mark
Mode
l
Tact
ica
l Pe
er
Gro
up
Ben
chm
ark
Str
ate
gic
Pe
er
Gro
up
Ben
chm
ark
Cu
stom
Be
nch
mark
Mode
l
Tact
ica
l Pe
er
Gro
up
Ben
chm
ark
Str
ate
gic
Pe
er
Gro
up
Ben
chm
ark
Cu
stom
Be
nch
mark
2007-12 -0.01 -0.19 -0.68 0.25 0.58 0.06 -0.87 2.96 6.96 5.96 6.85 8.17 - - - - - - - -
2007-11 -1.23 -1.43 -3.18 2.22 2.82 2.35 3.81 3.41 7.35 6.63 8.11 7.71 - - - - - - - -
2007-10 1.84 1.70 3.09 0.47 4.66 4.26 7.66 2.41 10.32 9.86 14.84 6.02 - - - - - - - -
2007-09 2.22 2.10 4.01 0.69 2.61 2.23 3.20 3.08 9.84 9.74 14.52 5.94 - - - - - - - -
2007-08 0.53 0.42 0.41 1.23 0.09 -0.14 -1.84 2.74 7.98 8.02 10.67 5.84 - - - - - - - -
2007-07 -0.15 -0.29 -1.18 1.13 0.61 0.43 -0.84 1.14 8.92 8.90 12.54 5.46 - - - - - - - -
2007-06 -0.28 -0.26 -1.08 0.36 2.06 1.99 2.42 0.40 9.74 9.74 14.64 5.19 - - - - - - - -
2007-05 1.04 0.98 1.44 -0.35 2.97 2.84 4.24 0.40 10.46 10.37 16.09 4.98 - - - - - - - -
2007-04 1.29 1.26 2.07 0.39 2.14 2.11 3.02 1.78 7.80 7.91 11.07 5.44 - - - - - - - -
2007-03 0.61 0.57 0.67 0.36 1.56 1.57 1.97 1.52 7.45 7.70 10.81 5.30 - - - - - - - -
2007-02 0.23 0.26 0.25 1.02 1.30 1.44 1.78 0.98 7.41 8.08 11.73 4.90 - - - - - - - -
2007-01 0.71 0.72 1.03 0.13 2.58 2.75 4.42 0.57 7.16 7.78 11.03 3.83 - - - - - - - -
2006-12 0.35 0.44 0.49 -0.17 3.28 3.63 6.25 0.84 8.68 9.45 14.66 3.76 - - - - - - - -
2006-11 1.50 1.57 2.85 0.61 3.43 3.69 6.27 1.61 9.61 10.17 16.43 4.40 - - - - - - - -
2006-10 1.40 1.58 2.80 0.40 3.33 3.35 5.51 1.87 9.91 10.07 16.16 4.17 - - - - - - - -
2006-09 0.49 0.50 0.51 0.59 2.51 2.22 3.32 2.35 7.29 7.37 10.42 3.54 - - - - - - - -
2006-08 1.41 1.23 2.11 0.87 2.39 2.04 2.97 1.91 7.79 7.79 11.47 2.40 - - - - - - - -
2006-07 0.59 0.48 0.66 0.87 -0.43 -0.49 -2.14 1.12 6.87 6.98 9.97 2.41 - - - - - - - -
2006-06 0.38 0.32 0.17 0.16 -0.07 0.10 -1.00 0.50 7.41 7.78 11.62 0.90 - - - - - - - -
2006-05 -1.39 -1.27 -2.95 0.09 0.13 0.71 0.32 0.32 8.03 8.41 13.37 0.98 - - - - - - - -
2006-04 0.96 1.07 1.83 0.25 1.54 1.99 2.98 0.22 10.99 10.90 18.85 1.41 - - - - - - - -
2006-03 0.58 0.93 1.51 -0.02 2.72 3.21 5.51 0.03 9.71 9.35 15.57 2.02 - - - - - - - -
2006-02 - -0.02 -0.37 -0.01 3.37 3.39 6.07 0.50 8.17 7.46 11.46 1.91 - - - - - - - -
2006-01 2.14 2.28 4.34 0.06 5.21 4.94 9.25 0.90 - - - - - - - - - - - -
2005-12 1.21 1.11 2.05 0.45 1.96 1.67 2.31 0.63 - - - - - - - - - - - -
2005-11 1.78 1.48 2.61 0.39 1.70 1.45 1.74 -0.34 - - - - - - - - - - - -
2005-10 -1.02 -0.91 -2.29 -0.21 0.48 0.44 -0.11 0.14 - - - - - - - - - - - -
2005-09 0.96 0.89 1.47 -0.52 2.63 2.61 4.45 -0.26 - - - - - - - - - - - -
2005-08 0.55 0.47 0.74 0.88 2.62 2.63 4.72 0.50 - - - - - - - - - - - -
2005-07 1.10 1.23 2.18 -0.61 3.40 3.16 5.76 0.14 - - - - - - - - - - - -
2005-06 0.96 0.91 1.74 0.23 2.07 1.55 2.50 1.61 - - - - - - - - - - - -
2005-05 1.31 0.99 1.74 0.52 0.26 -0.18 -1.38 1.25 - - - - - - - - - - - -
2005-04 -0.21 -0.35 -0.97 0.85 - - - - - - - - - - - - - - - -
2005-03 -0.83 -0.81 -2.11 -0.12 - - - - - - - - - - - - - - - -
Page 14 of 25
Fund data as of 3/31/2013
Analysis, search process, and layout are © 2000-2013, fi360, Inc. (www.fi360.com). All rights reserved. The analysis and opinions generated by fi360: (1) do not constitute professional investment advice; (2) are provided
solely for informational purposes; (3) are not warranted or represented to be correct, complete, or accurate; and (4) are for the exclusive use of subscribers to fi360. The data source is © 2013 Morningstar, Inc. All rights
reserved. The data contained herein: (1) is proprietary to Morningstar, Inc and/or its content providers; (2) may not be copied or distributed; and (3) is not warranted to be accurate, complete or timely. Neither Morningstar,
Inc nor its content providers are responsible for any damages or losses arising from any use of this information. Past performance is no guarantee of future results.
fi360_Portrait_v4_3

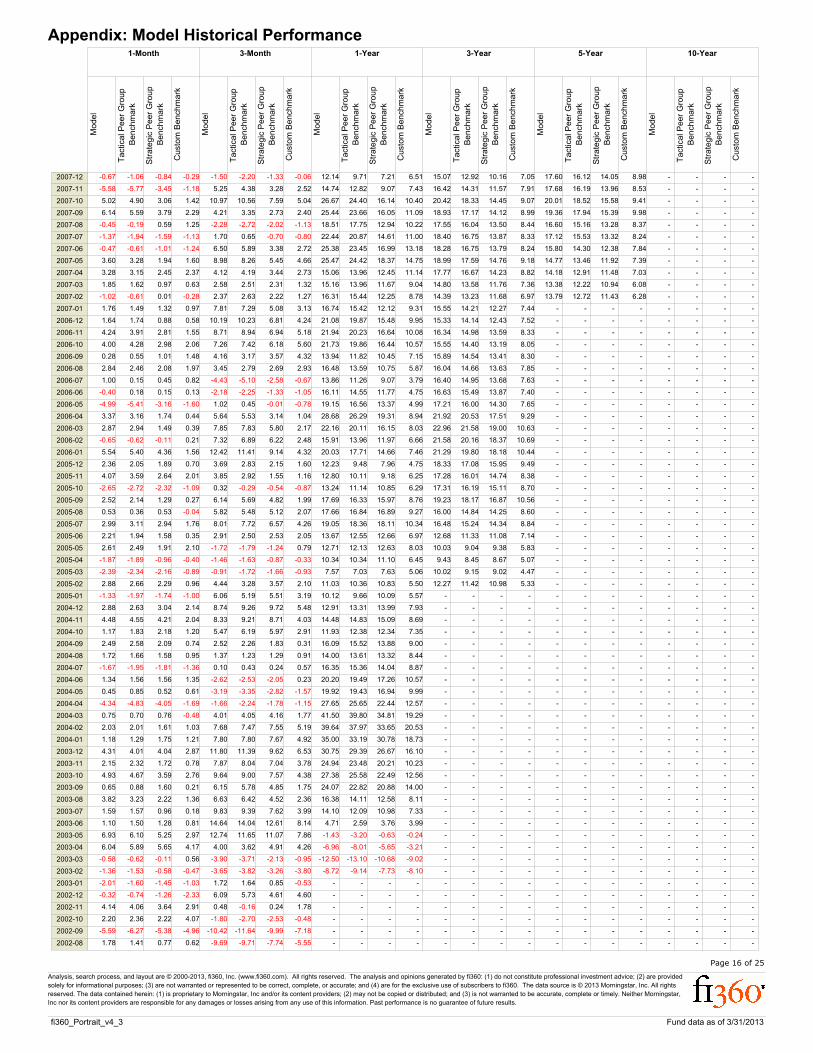
Appendix: Model Historical PerformanceAggressive
1-Month 3-Month 1-Year 3-Year 5-Year 10-Year
Mod
el
Tact
ica
l Peer
Gro
up
Bench
mark
Str
ate
gic
Peer
Gro
up
Ben
chm
ark
Cu
stom
Bench
mark
Mod
el
Tact
ica
l Peer
Gro
up
Bench
mark
Str
ate
gic
Peer
Gro
up
Ben
chm
ark
Cu
stom
Bench
mark
Mod
el
Tact
ica
l Peer
Gro
up
Bench
mark
Str
ate
gic
Peer
Gro
up
Ben
chm
ark
Cu
stom
Bench
mark
Mod
el
Tact
ica
l Peer
Gro
up
Bench
mark
Str
ate
gic
Peer
Gro
up
Ben
chm
ark
Cu
stom
Bench
mark
Mod
el
Tact
ica
l Peer
Gro
up
Bench
mark
Str
ate
gic
Peer
Gro
up
Ben
chm
ark
Cu
stom
Bench
mark
Mod
el
Tact
ica
l Peer
Gro
up
Bench
mark
Str
ate
gic
Peer
Gro
up
Ben
chm
ark
Cu
stom
Bench
mark
2013-03 1.62 1.73 1.32 1.99 4.52 4.92 3.80 5.32 9.14 8.97 8.22 8.11 9.72 8.22 8.51 9.17 4.98 3.48 5.19 6.72 10.78 9.21 9.22 7.56
2013-02 -0.42 -0.32 0.13 0.83 6.10 6.11 4.18 3.88 7.98 7.55 7.46 7.70 11.58 9.92 9.72 9.58 4.39 2.85 4.84 6.26 10.53 8.96 9.07 7.41
2013-01 3.29 3.46 2.32 2.42 7.71 7.26 4.83 3.40 12.36 11.86 9.94 9.25 12.57 10.93 10.30 9.96 4.55 2.91 4.69 5.82 10.43 8.83 8.99 7.27
2012-12 3.15 2.88 1.69 0.59 3.70 3.11 2.28 -0.09 16.78 15.45 11.96 9.40 9.71 8.00 8.54 8.64 2.61 0.97 3.37 4.87 9.85 8.28 8.58 6.90
2012-11 1.10 0.77 0.76 0.36 3.60 3.35 2.23 0.67 11.92 10.76 10.24 9.57 9.54 8.08 8.65 8.59 1.84 0.19 2.85 4.68 9.47 7.89 8.26 6.59
2012-10 -0.55 -0.54 -0.17 -1.03 4.48 4.96 2.86 1.56 8.96 7.99 7.86 9.22 10.99 9.58 9.65 9.75 0.45 -1.15 1.98 4.36 9.80 8.24 8.57 6.86
2012-09 3.05 3.13 1.64 1.35 6.04 6.22 4.07 3.70 21.82 20.85 15.46 16.44 10.07 8.71 9.09 9.83 1.56 -0.09 2.63 4.87 10.10 8.55 8.83 7.39
2012-08 1.96 2.33 1.38 1.25 6.76 7.14 4.96 4.32 5.45 4.08 6.48 10.72 11.34 9.71 10.12 10.21 2.16 0.39 3.06 5.07 9.14 7.52 8.05 6.71
2012-07 0.93 0.65 1.00 1.06 -3.48 -3.80 -1.12 0.07 -3.03 -5.18 0.71 7.20 11.93 10.05 10.75 10.54 1.67 -0.11 2.90 5.06 9.12 7.42 7.98 6.64
2012-06 3.74 4.02 2.51 1.95 -5.05 -5.17 -2.05 -0.93 -4.77 -6.94 -0.70 5.52 14.86 12.98 12.96 11.74 1.20 -0.63 2.37 4.61 8.26 6.57 7.26 6.21
2012-05 -7.82 -8.12 -4.49 -2.87 -7.98 -8.46 -3.87 -1.27 -9.74 -12.23 -4.29 2.73 13.12 11.11 12.10 11.05 0.37 -1.53 1.65 3.94 7.33 5.70 6.66 5.65
2012-04 -0.71 -0.78 0.04 0.05 3.45 3.29 3.10 3.96 -3.65 -6.28 -0.56 5.90 20.42 17.90 16.35 13.26 2.74 0.80 2.99 4.88 8.31 6.68 7.15 5.95
2012-03 0.54 0.41 0.61 1.60 11.84 11.16 7.39 6.59 0.90 -1.85 2.73 8.11 26.15 23.05 20.14 15.23 3.55 1.58 3.48 5.37 8.36 6.77 7.15 5.72
2012-02 3.62 3.68 2.43 2.28 9.97 9.28 6.87 5.68 2.12 -1.07 2.73 6.69 30.04 26.24 22.19 16.56 3.82 1.83 3.55 5.16 8.69 7.14 7.42 5.72
2012-01 7.35 6.79 4.20 2.57 4.45 3.55 2.85 3.37 1.19 -1.86 2.62 6.40 23.96 20.78 18.22 13.88 2.87 0.97 3.05 4.63 - - - -
2011-12 -1.14 -1.30 0.13 0.74 8.18 7.92 5.48 6.34 -5.82 -8.05 -0.70 5.01 17.24 14.52 14.02 11.35 1.78 -0.05 2.48 4.30 - - - -
2011-11 -1.58 -1.75 -1.42 0.04 -2.39 -2.88 -1.26 1.72 0.92 -0.91 3.56 7.40 20.69 17.72 16.28 11.71 2.34 0.56 2.63 4.27 - - - -
2011-10 11.18 11.30 6.86 5.51 -7.01 -7.84 -3.95 -0.32 1.57 -0.05 3.76 7.48 18.45 15.46 14.78 11.25 3.53 1.69 3.50 4.58 - - - -
2011-09 -10.80 -11.18 -6.27 -3.63 -17.10 -18.20 -10.49 -6.02 -4.92 -7.02 -0.27 4.45 4.56 2.46 5.80 5.91 2.15 0.37 2.73 3.89 - - - -
2011-08 -6.24 -6.77 -4.11 -1.97 -8.62 -9.65 -5.66 -3.21 16.84 14.54 13.63 13.15 4.34 2.53 4.99 5.58 4.57 2.89 4.28 4.97 - - - -
2011-07 -0.88 -1.22 -0.42 -0.52 -4.11 -4.92 -2.37 -1.14 21.31 19.32 16.34 13.02 5.99 4.20 6.14 6.74 6.53 4.86 5.59 5.80 - - - -
2011-06 -1.68 -1.89 -1.21 -0.75 0.60 0.02 1.33 1.50 31.45 29.92 24.02 18.11 5.38 3.77 5.81 6.73 6.93 5.14 5.78 6.08 - - - -
2011-05 -1.61 -1.90 -0.76 0.13 4.12 3.17 3.19 2.53 29.74 28.42 23.17 16.43 3.22 1.72 4.23 5.49 7.20 5.58 6.07 6.27 - - - -
2011-04 3.98 3.91 3.35 2.13 8.65 8.16 6.40 4.45 21.62 20.53 16.74 12.25 4.68 3.19 4.93 5.68 6.45 4.82 5.55 5.90 - - - -
2011-03 1.76 1.20 0.61 0.27 4.39 4.14 3.80 3.53 19.96 18.50 14.93 11.33 5.00 3.53 5.02 5.80 6.33 4.66 5.22 5.55 - - - -
2011-02 2.68 2.85 2.33 2.00 8.67 9.46 7.74 6.39 25.97 24.83 19.64 14.53 3.97 2.65 4.69 5.64 6.56 5.02 5.40 5.57 - - - -
2011-01 -0.09 0.05 0.83 1.23 4.84 5.47 3.99 4.42 25.46 24.35 18.96 14.39 3.19 1.69 3.68 4.52 5.86 4.30 4.89 5.20 - - - -
2010-12 5.93 6.37 4.43 3.03 9.22 9.13 5.94 5.77 20.07 18.68 15.03 11.62 1.13 -0.38 2.01 3.35 7.02 5.39 5.62 5.27 - - - -
2010-11 -0.94 -0.91 -1.23 0.11 13.02 12.25 8.34 7.17 16.39 15.03 12.35 8.82 -1.02 -2.75 0.27 2.23 6.29 4.52 5.10 4.79 - - - -
2010-10 4.08 3.53 2.72 2.55 11.06 10.02 7.70 4.83 23.53 21.92 17.82 12.61 -2.59 -4.37 -0.49 1.79 7.34 5.45 5.91 5.18 - - - -
2010-09 9.61 9.41 6.80 4.39 14.61 14.29 11.31 6.26 15.14 14.33 12.73 8.92 -2.30 -3.95 -0.38 1.41 5.92 4.15 4.85 4.42 - - - -
2010-08 -2.66 -2.88 -1.82 -2.07 1.46 1.30 2.26 -0.40 12.03 10.77 10.37 6.85 -3.34 -5.08 -1.32 0.73 4.51 2.72 3.75 3.58 - - - -
2010-07 7.41 7.56 6.16 3.95 -3.86 -3.95 -2.04 -1.82 19.22 17.80 15.95 11.49 -2.62 -4.21 -0.52 1.85 5.18 3.40 4.24 4.01 - - - -
2010-06 -2.96 -3.02 -1.89 -2.16 -8.19 -8.78 -6.10 -4.33 21.05 19.28 17.04 11.94 -5.34 -7.12 -3.00 0.17 4.30 2.53 3.60 3.57 - - - -
2010-05 -7.76 -7.92 -5.95 -3.47 1.09 0.29 0.23 0.86 23.63 21.69 19.50 14.48 -4.54 -6.35 -2.71 0.48 5.39 3.56 4.32 4.09 - - - -
2010-04 2.57 2.16 1.75 1.29 12.08 11.58 8.42 6.44 49.03 45.08 35.67 22.22 -0.77 -2.70 -0.07 2.20 7.66 5.80 6.01 5.27 - - - -
2010-03 6.86 6.61 4.74 3.15 4.48 4.30 3.90 3.81 65.87 60.22 46.88 27.13 -0.55 -2.39 0.16 2.57 6.71 4.95 5.44 4.91 - - - -
2010-02 2.26 2.45 1.74 1.88 0.40 0.87 1.18 1.09 70.95 62.92 48.43 29.62 -2.12 -3.93 -1.06 1.73 4.80 3.12 4.01 4.08 - - - -
2010-01 -4.38 -4.51 -2.50 -1.22 3.23 3.41 3.00 2.79 50.03 44.40 35.36 21.34 -3.18 -4.90 -1.62 1.00 4.93 3.16 4.13 3.89 - - - -
2009-12 2.68 3.10 1.99 0.45 4.73 5.13 3.82 3.21 42.53 37.63 29.79 17.78 -1.15 -2.95 -0.35 1.74 5.59 3.71 4.29 3.94 - - - -
2009-11 5.14 5.03 3.57 3.60 8.79 8.10 6.43 5.22 49.69 43.11 35.12 19.29 -1.49 -3.38 -0.72 1.79 5.63 3.61 4.50 4.29 - - - -
2009-10 -2.99 -2.92 -1.72 -0.82 7.18 6.30 5.99 3.79 32.45 26.32 23.70 13.77 -1.77 -3.73 -0.96 1.11 5.49 3.52 4.63 3.97 - - - -
2009-09 6.66 6.01 4.55 2.41 20.49 19.24 15.56 9.21 4.43 1.19 5.33 4.41 0.53 -1.41 0.59 2.08 6.38 4.51 5.45 4.39 - - - -
2009-08 3.59 3.29 3.14 2.18 11.96 11.29 10.72 6.72 -13.22 -15.03 -7.73 -2.65 -1.51 -3.13 -0.56 1.77 5.54 3.82 4.95 4.05 - - - -
2009-07 9.06 8.91 7.16 4.37 20.18 18.29 14.63 7.64 -17.66 -19.51 -11.35 -3.49 -1.75 -3.39 -0.90 1.70 5.16 3.50 4.63 3.80 - - - -
2009-06 -0.89 -1.06 0.18 0.07 25.80 22.53 17.83 8.65 -26.46 -27.88 -18.38 -8.04 -4.23 -6.05 -3.01 0.54 3.00 1.35 2.81 2.63 - - - -
2009-05 11.19 9.78 6.78 3.06 39.78 34.26 24.50 14.19 -31.44 -32.65 -23.07 -11.92 -4.07 -5.66 -3.02 0.56 3.46 1.88 3.10 2.89 - - - -
2009-04 14.16 12.82 10.15 5.35 12.82 11.06 8.18 5.67 -36.72 -37.17 -27.06 -13.98 -8.97 -10.23 -6.13 -0.98 1.38 0.16 1.86 2.40 - - - -
2009-03 10.13 8.41 5.84 5.17 -10.22 -10.41 -8.19 -3.83 -41.82 -41.55 -31.37 -16.31 -11.93 -12.87 -8.58 -2.55 -2.14 -3.19 -0.92 0.99 - - - -
2009-02 -10.26 -9.19 -7.22 -4.63 -12.09 -11.40 -7.89 -6.97 -47.80 -46.81 -35.40 -20.58 -13.91 -14.36 -9.85 -4.05 -3.87 -4.60 -1.89 -0.12 - - - -
2009-01 -9.16 -8.99 -6.51 -4.11 -8.86 -9.54 -5.87 -3.62 -41.62 -41.44 -30.78 -17.74 -10.95 -11.74 -7.61 -2.45 -1.37 -2.36 -0.09 1.04 - - - -
2008-12 7.84 7.21 6.19 1.74 -23.26 -22.70 -15.74 -8.50 -39.57 -39.46 -28.89 -16.04 -6.38 -7.32 -4.16 -0.56 0.78 -0.25 1.62 2.14 - - - -
2008-11 -6.97 -7.29 -5.18 -1.20 -36.93 -35.82 -27.32 -14.13 -44.34 -44.13 -33.60 -17.71 -8.00 -8.83 -5.47 -0.90 0.11 -0.85 1.20 2.36 - - - -
2008-10 -23.51 -22.23 -16.31 -8.97 -33.37 -32.27 -24.04 -11.96 -43.51 -43.21 -32.38 -17.69 -4.49 -5.39 -2.94 0.16 2.00 1.13 2.63 2.77 - - - -
2008-09 -11.37 -10.99 -8.41 -4.53 -15.15 -15.02 -10.45 -3.81 -22.43 -23.41 -16.73 -8.29 3.50 1.93 2.19 2.97 8.66 7.31 7.11 5.29 - - - -
2008-08 -1.71 -2.16 -0.91 1.31 -11.55 -11.79 -7.69 -3.44 -7.11 -9.14 -5.64 -1.75 8.64 6.71 5.68 4.66 11.46 10.04 9.35 6.32 - - - -
2008-07 -2.60 -2.42 -1.34 -0.56 -7.63 -7.66 -5.68 -4.06 -5.92 -7.31 -4.22 -1.80 9.46 7.62 6.19 4.20 12.68 11.22 10.03 6.33 - - - -
2008-06 -7.61 -7.60 -5.58 -4.16 -0.47 -0.69 -0.93 -1.12 -4.73 -6.85 -4.47 -2.37 11.52 9.62 7.70 5.00 13.64 12.12 10.54 6.48 - - - -
2008-05 2.64 2.41 1.24 0.65 6.43 6.03 4.54 2.97 2.62 0.20 0.15 0.60 15.33 13.27 10.36 6.62 15.70 14.24 12.10 7.57 - - - -
2008-04 4.95 4.95 3.64 2.49 4.07 3.51 2.66 1.04 3.59 1.05 0.84 1.54 15.32 13.29 10.60 7.13 16.65 15.06 12.97 8.06 - - - -
2008-03 -1.20 -1.35 -0.36 -0.19 -6.75 -7.20 -4.88 -3.51 1.94 -0.68 -0.32 1.42 12.77 10.78 8.94 6.11 16.90 15.26 13.41 8.41 - - - -
2008-02 0.37 -0.02 -0.59 -1.23 -6.25 -6.93 -5.33 -3.61 5.09 2.31 1.01 2.25 12.31 10.41 8.28 5.86 17.04 15.43 13.46 8.57 - - - -
2008-01 -5.96 -5.91 -3.97 -2.13 -11.80 -12.28 -8.06 -3.56 3.63 1.71 1.61 3.24 13.24 11.39 9.31 6.64 16.64 15.08 13.47 8.74 - - - -
Page 15 of 25
Fund data as of 3/31/2013
Analysis, search process, and layout are © 2000-2013, fi360, Inc. (www.fi360.com). All rights reserved. The analysis and opinions generated by fi360: (1) do not constitute professional investment advice; (2) are provided
solely for informational purposes; (3) are not warranted or represented to be correct, complete, or accurate; and (4) are for the exclusive use of subscribers to fi360. The data source is © 2013 Morningstar, Inc. All rights
reserved. The data contained herein: (1) is proprietary to Morningstar, Inc and/or its content providers; (2) may not be copied or distributed; and (3) is not warranted to be accurate, complete or timely. Neither Morningstar,
Inc nor its content providers are responsible for any damages or losses arising from any use of this information. Past performance is no guarantee of future results.
fi360_Portrait_v4_3
Appendix: Model Historical Performance1-Month 3-Month 1-Year 3-Year 5-Year 10-Year
Mode
l
Tact
ica
l Pe
er
Gro
up
Ben
chm
ark
Str
ate
gic
Pe
er
Gro
up
Ben
chm
ark
Cu
stom
Be
nch
mark
Mode
l
Tact
ica
l Pe
er
Gro
up
Ben
chm
ark
Str
ate
gic
Pe
er
Gro
up
Ben
chm
ark
Cu
stom
Be
nch
mark
Mode
l
Tact
ica
l Pe
er
Gro
up
Ben
chm
ark
Str
ate
gic
Pe
er
Gro
up
Ben
chm
ark
Cu
stom
Be
nch
mark
Mode
l
Tact
ica
l Pe
er
Gro
up
Ben
chm
ark
Str
ate
gic
Pe
er
Gro
up
Ben
chm
ark
Cu
stom
Be
nch
mark
Mode
l
Tact
ica
l Pe
er
Gro
up
Ben
chm
ark
Str
ate
gic
Pe
er
Gro
up
Ben
chm
ark
Cu
stom
Be
nch
mark
Mode
l
Tact
ica
l Pe
er
Gro
up
Ben
chm
ark
Str
ate
gic
Pe
er
Gro
up
Ben
chm
ark
Cu
stom
Be
nch
mark
2007-12 -0.67 -1.06 -0.84 -0.29 -1.50 -2.20 -1.33 -0.06 12.14 9.71 7.21 6.51 15.07 12.92 10.16 7.05 17.60 16.12 14.05 8.98 - - - -
2007-11 -5.58 -5.77 -3.45 -1.18 5.25 4.38 3.28 2.52 14.74 12.82 9.07 7.43 16.42 14.31 11.57 7.91 17.68 16.19 13.96 8.53 - - - -
2007-10 5.02 4.90 3.06 1.42 10.97 10.56 7.59 5.04 26.67 24.40 16.14 10.40 20.42 18.33 14.45 9.07 20.01 18.52 15.58 9.41 - - - -
2007-09 6.14 5.59 3.79 2.29 4.21 3.35 2.73 2.40 25.44 23.66 16.05 11.09 18.93 17.17 14.12 8.99 19.36 17.94 15.39 9.98 - - - -
2007-08 -0.45 -0.19 0.59 1.25 -2.28 -2.72 -2.02 -1.13 18.51 17.75 12.94 10.22 17.55 16.04 13.50 8.44 16.60 15.16 13.28 8.37 - - - -
2007-07 -1.37 -1.94 -1.59 -1.13 1.70 0.65 -0.70 -0.80 22.44 20.87 14.61 11.00 18.40 16.75 13.87 8.33 17.12 15.53 13.32 8.24 - - - -
2007-06 -0.47 -0.61 -1.01 -1.24 6.50 5.89 3.38 2.72 25.38 23.45 16.99 13.18 18.28 16.75 13.79 8.24 15.80 14.30 12.38 7.84 - - - -
2007-05 3.60 3.28 1.94 1.60 8.98 8.26 5.45 4.66 25.47 24.42 18.37 14.75 18.99 17.59 14.76 9.18 14.77 13.46 11.92 7.39 - - - -
2007-04 3.28 3.15 2.45 2.37 4.12 4.19 3.44 2.73 15.06 13.96 12.45 11.14 17.77 16.67 14.23 8.82 14.18 12.91 11.48 7.03 - - - -
2007-03 1.85 1.62 0.97 0.63 2.58 2.51 2.31 1.32 15.16 13.96 11.67 9.04 14.80 13.58 11.76 7.36 13.38 12.22 10.94 6.08 - - - -
2007-02 -1.02 -0.61 0.01 -0.28 2.37 2.63 2.22 1.27 16.31 15.44 12.25 8.78 14.39 13.23 11.68 6.97 13.79 12.72 11.43 6.28 - - - -
2007-01 1.76 1.49 1.32 0.97 7.81 7.29 5.08 3.13 16.74 15.42 12.12 9.31 15.55 14.21 12.27 7.44 - - - - - - - -
2006-12 1.64 1.74 0.88 0.58 10.19 10.23 6.81 4.24 21.08 19.87 15.48 9.95 15.33 14.14 12.43 7.52 - - - - - - - -
2006-11 4.24 3.91 2.81 1.55 8.71 8.94 6.94 5.18 21.94 20.23 16.64 10.08 16.34 14.98 13.59 8.33 - - - - - - - -
2006-10 4.00 4.28 2.98 2.06 7.26 7.42 6.18 5.60 21.73 19.86 16.44 10.57 15.55 14.40 13.19 8.05 - - - - - - - -
2006-09 0.28 0.55 1.01 1.48 4.16 3.17 3.57 4.32 13.94 11.82 10.45 7.15 15.89 14.54 13.41 8.30 - - - - - - - -
2006-08 2.84 2.46 2.08 1.97 3.45 2.79 2.69 2.93 16.48 13.59 10.75 5.87 16.04 14.66 13.63 7.85 - - - - - - - -
2006-07 1.00 0.15 0.45 0.82 -4.43 -5.10 -2.58 -0.67 13.86 11.26 9.07 3.79 16.40 14.95 13.68 7.63 - - - - - - - -
2006-06 -0.40 0.18 0.15 0.13 -2.18 -2.25 -1.33 -1.05 16.11 14.55 11.77 4.75 16.63 15.49 13.87 7.40 - - - - - - - -
2006-05 -4.99 -5.41 -3.16 -1.60 1.02 0.45 -0.01 -0.78 19.15 16.56 13.37 4.99 17.21 16.00 14.30 7.65 - - - - - - - -
2006-04 3.37 3.16 1.74 0.44 5.64 5.53 3.14 1.04 28.68 26.29 19.31 8.94 21.92 20.53 17.51 9.29 - - - - - - - -
2006-03 2.87 2.94 1.49 0.39 7.85 7.83 5.80 2.17 22.16 20.11 16.15 8.03 22.96 21.58 19.00 10.63 - - - - - - - -
2006-02 -0.65 -0.62 -0.11 0.21 7.32 6.89 6.22 2.48 15.91 13.96 11.97 6.66 21.58 20.16 18.37 10.69 - - - - - - - -
2006-01 5.54 5.40 4.36 1.56 12.42 11.41 9.14 4.32 20.03 17.71 14.66 7.46 21.29 19.80 18.18 10.44 - - - - - - - -
2005-12 2.36 2.05 1.89 0.70 3.69 2.83 2.15 1.60 12.23 9.48 7.96 4.75 18.33 17.08 15.95 9.49 - - - - - - - -
2005-11 4.07 3.59 2.64 2.01 3.85 2.92 1.55 1.16 12.80 10.11 9.18 6.25 17.28 16.01 14.74 8.38 - - - - - - - -
2005-10 -2.65 -2.72 -2.32 -1.09 0.32 -0.29 -0.54 -0.87 13.24 11.14 10.85 6.29 17.31 16.19 15.11 8.70 - - - - - - - -
2005-09 2.52 2.14 1.29 0.27 6.14 5.69 4.82 1.99 17.69 16.33 15.97 8.76 19.23 18.17 16.87 10.56 - - - - - - - -
2005-08 0.53 0.36 0.53 -0.04 5.82 5.48 5.12 2.07 17.66 16.84 16.89 9.27 16.00 14.84 14.25 8.60 - - - - - - - -
2005-07 2.99 3.11 2.94 1.76 8.01 7.72 6.57 4.26 19.05 18.36 18.11 10.34 16.48 15.24 14.34 8.84 - - - - - - - -
2005-06 2.21 1.94 1.58 0.35 2.91 2.50 2.53 2.05 13.67 12.55 12.66 6.97 12.68 11.33 11.08 7.14 - - - - - - - -
2005-05 2.61 2.49 1.91 2.10 -1.72 -1.79 -1.24 0.79 12.71 12.13 12.63 8.03 10.03 9.04 9.38 5.83 - - - - - - - -
2005-04 -1.87 -1.89 -0.96 -0.40 -1.46 -1.63 -0.87 -0.33 10.34 10.34 11.10 6.45 9.43 8.45 8.67 5.07 - - - - - - - -
2005-03 -2.39 -2.34 -2.16 -0.89 -0.91 -1.72 -1.66 -0.93 7.57 7.03 7.63 5.06 10.02 9.15 9.02 4.47 - - - - - - - -
2005-02 2.88 2.66 2.29 0.96 4.44 3.28 3.57 2.10 11.03 10.36 10.83 5.50 12.27 11.42 10.98 5.33 - - - - - - - -
2005-01 -1.33 -1.97 -1.74 -1.00 6.06 5.19 5.51 3.19 10.12 9.66 10.09 5.57 - - - - - - - - - - - -
2004-12 2.88 2.63 3.04 2.14 8.74 9.26 9.72 5.48 12.91 13.31 13.99 7.93 - - - - - - - - - - - -
2004-11 4.48 4.55 4.21 2.04 8.33 9.21 8.71 4.03 14.48 14.83 15.09 8.69 - - - - - - - - - - - -
2004-10 1.17 1.83 2.18 1.20 5.47 6.19 5.97 2.91 11.93 12.38 12.34 7.35 - - - - - - - - - - - -
2004-09 2.49 2.58 2.09 0.74 2.52 2.26 1.83 0.31 16.09 15.52 13.88 9.00 - - - - - - - - - - - -
2004-08 1.72 1.66 1.58 0.95 1.37 1.23 1.29 0.91 14.00 13.61 13.32 8.44 - - - - - - - - - - - -
2004-07 -1.67 -1.95 -1.81 -1.36 0.10 0.43 0.24 0.57 16.35 15.36 14.04 8.87 - - - - - - - - - - - -
2004-06 1.34 1.56 1.56 1.35 -2.62 -2.53 -2.05 0.23 20.20 19.49 17.26 10.57 - - - - - - - - - - - -
2004-05 0.45 0.85 0.52 0.61 -3.19 -3.35 -2.82 -1.57 19.92 19.43 16.94 9.99 - - - - - - - - - - - -
2004-04 -4.34 -4.83 -4.05 -1.69 -1.66 -2.24 -1.78 -1.15 27.65 25.65 22.44 12.57 - - - - - - - - - - - -
2004-03 0.75 0.70 0.76 -0.48 4.01 4.05 4.16 1.77 41.50 39.80 34.81 19.29 - - - - - - - - - - - -
2004-02 2.03 2.01 1.61 1.03 7.68 7.47 7.55 5.19 39.64 37.97 33.65 20.53 - - - - - - - - - - - -
2004-01 1.18 1.29 1.75 1.21 7.80 7.80 7.67 4.92 35.00 33.19 30.78 18.73 - - - - - - - - - - - -
2003-12 4.31 4.01 4.04 2.87 11.80 11.39 9.62 6.53 30.75 29.39 26.67 16.10 - - - - - - - - - - - -
2003-11 2.15 2.32 1.72 0.78 7.87 8.04 7.04 3.78 24.94 23.48 20.21 10.23 - - - - - - - - - - - -
2003-10 4.93 4.67 3.59 2.76 9.64 9.00 7.57 4.38 27.38 25.58 22.49 12.56 - - - - - - - - - - - -
2003-09 0.65 0.88 1.60 0.21 6.15 5.78 4.85 1.75 24.07 22.82 20.88 14.00 - - - - - - - - - - - -
2003-08 3.82 3.23 2.22 1.36 6.63 6.42 4.52 2.36 16.38 14.11 12.58 8.11 - - - - - - - - - - - -
2003-07 1.59 1.57 0.96 0.18 9.83 9.39 7.62 3.99 14.10 12.09 10.98 7.33 - - - - - - - - - - - -
2003-06 1.10 1.50 1.28 0.81 14.64 14.04 12.61 8.14 4.71 2.59 3.76 3.99 - - - - - - - - - - - -
2003-05 6.93 6.10 5.25 2.97 12.74 11.65 11.07 7.86 -1.43 -3.20 -0.63 -0.24 - - - - - - - - - - - -
2003-04 6.04 5.89 5.65 4.17 4.00 3.62 4.91 4.26 -6.96 -8.01 -5.65 -3.21 - - - - - - - - - - - -
2003-03 -0.58 -0.62 -0.11 0.56 -3.90 -3.71 -2.13 -0.95 -12.50 -13.10 -10.68 -9.02 - - - - - - - - - - - -
2003-02 -1.36 -1.53 -0.58 -0.47 -3.65 -3.82 -3.26 -3.80 -8.72 -9.14 -7.73 -8.10 - - - - - - - - - - - -
2003-01 -2.01 -1.60 -1.45 -1.03 1.72 1.64 0.85 -0.53 - - - - - - - - - - - - - - - -
2002-12 -0.32 -0.74 -1.26 -2.33 6.09 5.73 4.61 4.60 - - - - - - - - - - - - - - - -
2002-11 4.14 4.06 3.64 2.91 0.48 -0.16 0.24 1.78 - - - - - - - - - - - - - - - -
2002-10 2.20 2.36 2.22 4.07 -1.80 -2.70 -2.53 -0.48 - - - - - - - - - - - - - - - -
2002-09 -5.59 -6.27 -5.38 -4.96 -10.42 -11.64 -9.99 -7.18 - - - - - - - - - - - - - - - -
2002-08 1.78 1.41 0.77 0.62 -9.69 -9.71 -7.74 -5.55 - - - - - - - - - - - - - - - -
Page 16 of 25
Fund data as of 3/31/2013
Analysis, search process, and layout are © 2000-2013, fi360, Inc. (www.fi360.com). All rights reserved. The analysis and opinions generated by fi360: (1) do not constitute professional investment advice; (2) are provided
solely for informational purposes; (3) are not warranted or represented to be correct, complete, or accurate; and (4) are for the exclusive use of subscribers to fi360. The data source is © 2013 Morningstar, Inc. All rights
reserved. The data contained herein: (1) is proprietary to Morningstar, Inc and/or its content providers; (2) may not be copied or distributed; and (3) is not warranted to be accurate, complete or timely. Neither Morningstar,
Inc nor its content providers are responsible for any damages or losses arising from any use of this information. Past performance is no guarantee of future results.
fi360_Portrait_v4_3

Appendix: Model Historical Performance1-Month 3-Month 1-Year 3-Year 5-Year 10-Year
Mode
l
Tact
ica
l Pe
er
Gro
up
Ben
chm
ark
Str
ate
gic
Pe
er
Gro
up
Ben
chm
ark
Cu
stom
Be
nch
mark
Mode
l
Tact
ica
l Pe
er
Gro
up
Ben
chm
ark
Str
ate
gic
Pe
er
Gro
up
Ben
chm
ark
Cu
stom
Be
nch
mark
Mode
l
Tact
ica
l Pe
er
Gro
up
Ben
chm
ark
Str
ate
gic
Pe
er
Gro
up
Ben
chm
ark
Cu
stom
Be
nch
mark
Mode
l
Tact
ica
l Pe
er
Gro
up
Ben
chm
ark
Str
ate
gic
Pe
er
Gro
up
Ben
chm
ark
Cu
stom
Be
nch
mark
Mode
l
Tact
ica
l Pe
er
Gro
up
Ben
chm
ark
Str
ate
gic
Pe
er
Gro
up
Ben
chm
ark
Cu
stom
Be
nch
mark
Mode
l
Tact
ica
l Pe
er
Gro
up
Ben
chm
ark
Str
ate
gic
Pe
er
Gro
up
Ben
chm
ark
Cu
stom
Be
nch
mark
2002-07 -6.77 -7.04 -5.60 -2.93 -10.44 -10.23 -8.51 -6.22 - - - - - - - - - - - - - - - -
2002-06 -4.82 -4.23 -3.01 -3.29 -4.19 -3.40 -3.07 -5.40 - - - - - - - - - - - - - - - -
2002-05 0.93 0.83 -0.07 -0.10 4.40 4.80 3.13 -0.63 - - - - - - - - - - - - - - - -
2002-04 -0.27 0.03 0.01 -2.08 - - - - - - - - - - - - - - - - - - - -
2002-03 3.71 3.91 3.19 1.58 - - - - - - - - - - - - - - - - - - - -
Page 17 of 25
Fund data as of 3/31/2013
Analysis, search process, and layout are © 2000-2013, fi360, Inc. (www.fi360.com). All rights reserved. The analysis and opinions generated by fi360: (1) do not constitute professional investment advice; (2) are provided
solely for informational purposes; (3) are not warranted or represented to be correct, complete, or accurate; and (4) are for the exclusive use of subscribers to fi360. The data source is © 2013 Morningstar, Inc. All rights
reserved. The data contained herein: (1) is proprietary to Morningstar, Inc and/or its content providers; (2) may not be copied or distributed; and (3) is not warranted to be accurate, complete or timely. Neither Morningstar,
Inc nor its content providers are responsible for any damages or losses arising from any use of this information. Past performance is no guarantee of future results.
fi360_Portrait_v4_3

Appendix: Model Historical Performance DisclosureInvestors should consider the investment objectives, risks, and charges and expenses of a fund carefully before investing. Prospectuses containing this
and other information about the fund are available by contacting your financial consultant. Please read the prospectus carefully before investing to make
sure that the fund is appropriate for your goals and risk tolerance. The performance information shown represents past performance and is not a
guarantee of future results. The investment return and principal value of an investment will fluctuate so that the shares, when redeemed, may be worth
more or less than their original cost. The performance information shown reflects performance without adjusting for sales charges. If adjusted for sales
charges, the load would reduce the performance quoted. Current performance may be lower or higher than the performance information shown. For
performance data current to the most recent month-end, please reference the Investment Company Contact Information section.
Model performance is calculated as follows:
- The starting date for the performance history is based off of the oldest model time period in the system.
- A weighted return is calculated for each month based upon the actual model investments and allocations stored for that period.
- If manual rebalancing is selected, the model will continue to grow each month until a new period allocation is specified within the system. At that point, it will
rebalance to the new allocation and repeat the process.
- If monthly, quarterly, semi-annual or annual rebalancing is selected, the model will continue to grow for the specified time period and then it will automatically
re-balance to the latest period allocation specified within the system. It will continue to repeat this process.
- If an investment does not have a return for a month, the weighted return for that month is calculated excluding the investment's assets.
- The individual monthly returns are then compounded to result in the corresponding annualized returns shown in this report.
Tactical Peer Group Benchmark performance is calculated as follows:
- Returns are reflective of the median manager's performance for each peer group utilized in the model.
- A weighted return is calculated for each month based upon the actual model investments and allocations utilized for that month.
- The same rebalancing schedule used in the model is applied to the tactical benchmark.
- If a peer group does not have a median return for a particular month, the assigned index return will be used instead.
- The individual monthly returns are then compounded to result in the corresponding annualized returns shown in this report.
Strategic Peer Group Benchmark performance is calculated as follows:
- If a strategic benchmark is assigned, the returns are reflective of the median manager's performance for each peer group utilized in the strategic model.
- A weighted return is calculated for each month based on the current strategic peer group allocations.
- The same rebalancing schedule used in the model is applied to the strategic benchmark.
- If a peer group does not have a median return for a particular month, the assigned index return will be used instead.
- The individual monthly returns are then compounded to result in the corresponding annualized returns shown in this report.
Custom Benchmark performance is calculated as follows:
- If a custom benchmark is assigned, the returns are reflective of the specified indices included in the benchmark.
- A weighted return is calculated for each month based on the current index allocations.
- The same rebalancing schedule used in the model is applied to the custom benchmark.
- If an index does not have a return for a particular month, it will be excluded from the calculations.
- The individual monthly returns are then compounded to result in the corresponding annualized returns shown in this report.
The performance of the tactical peer group benchmark, strategic peer group benchmark (if included), and custom benchmark (if included) are not an exact
representation of any particular investment, as you cannot invest directly in an indicies or peer group median that are used in the calculations.
Page 18 of 25
Fund data as of 3/31/2013
Analysis, search process, and layout are © 2000-2013, fi360, Inc. (www.fi360.com). All rights reserved. The analysis and opinions generated by fi360: (1) do not constitute professional investment advice; (2) are provided
solely for informational purposes; (3) are not warranted or represented to be correct, complete, or accurate; and (4) are for the exclusive use of subscribers to fi360. The data source is © 2013 Morningstar, Inc. All rights
reserved. The data contained herein: (1) is proprietary to Morningstar, Inc and/or its content providers; (2) may not be copied or distributed; and (3) is not warranted to be accurate, complete or timely. Neither Morningstar,
Inc nor its content providers are responsible for any damages or losses arising from any use of this information. Past performance is no guarantee of future results.
fi360_Portrait_v4_3
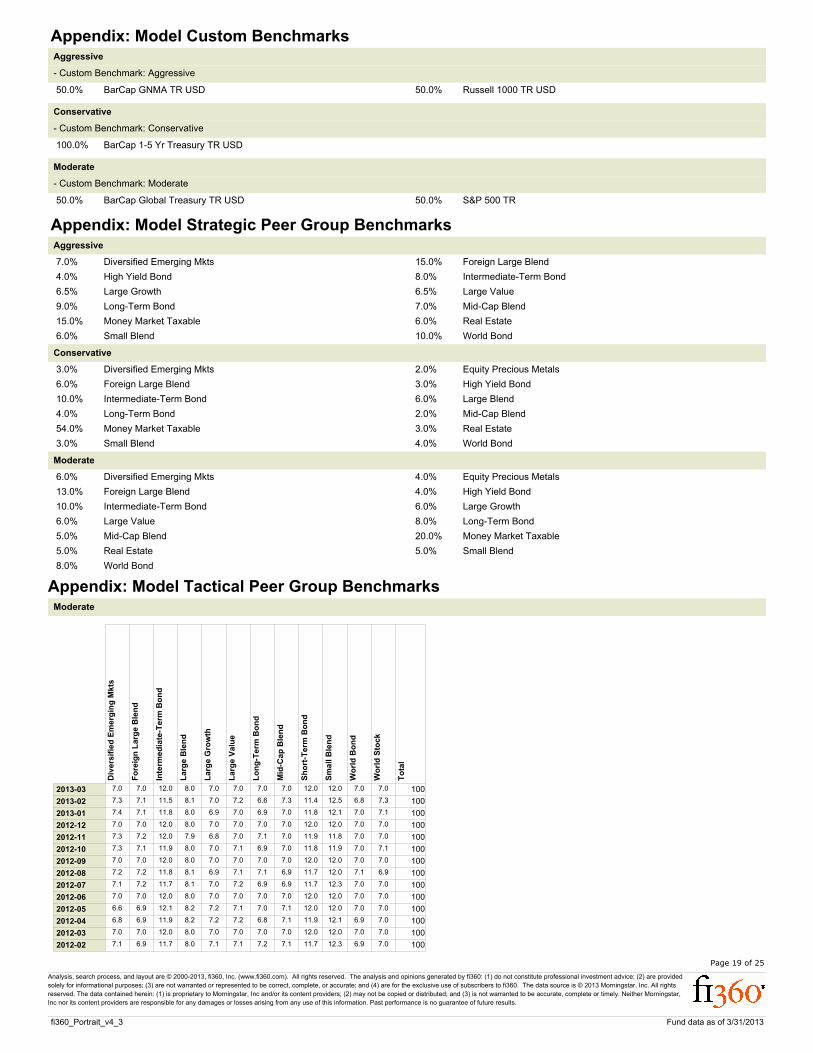
Appendix: Model Custom BenchmarksAggressive
- Custom Benchmark: Aggressive
BarCap GNMA TR USD 50.0% Russell 1000 TR USD 50.0%
Conservative
- Custom Benchmark: Conservative
BarCap 1-5 Yr Treasury TR USD 100.0%
Moderate
- Custom Benchmark: Moderate
BarCap Global Treasury TR USD 50.0% S&P 500 TR 50.0%
Appendix: Model Strategic Peer Group BenchmarksAggressive
Diversified Emerging Mkts 7.0% Foreign Large Blend 15.0%
High Yield Bond 4.0% Intermediate-Term Bond 8.0%
Large Growth 6.5% Large Value 6.5%
Long-Term Bond 9.0% Mid-Cap Blend 7.0%
Money Market Taxable 15.0% Real Estate 6.0%
Small Blend 6.0% World Bond 10.0%
Conservative
Diversified Emerging Mkts 3.0% Equity Precious Metals 2.0%
Foreign Large Blend 6.0% High Yield Bond 3.0%
Intermediate-Term Bond 10.0% Large Blend 6.0%
Long-Term Bond 4.0% Mid-Cap Blend 2.0%
Money Market Taxable 54.0% Real Estate 3.0%
Small Blend 3.0% World Bond 4.0%
Moderate
Diversified Emerging Mkts 6.0% Equity Precious Metals 4.0%
Foreign Large Blend 13.0% High Yield Bond 4.0%
Intermediate-Term Bond 10.0% Large Growth 6.0%
Large Value 6.0% Long-Term Bond 8.0%
Mid-Cap Blend 5.0% Money Market Taxable 20.0%
Real Estate 5.0% Small Blend 5.0%
World Bond 8.0%
Appendix: Model Tactical Peer Group BenchmarksModerate
Div
ers
ifie
d E
merg
ing
Mkts
Fo
reig
n L
arg
e B
len
d
Inte
rmed
iate
-Term
Bo
nd
Larg
e B
len
d
Larg
e G
row
th
Larg
e V
alu
e
Lo
ng
-Term
Bo
nd
Mid
-Cap
Ble
nd
Sh
ort
-Term
Bo
nd
Sm
all B
len
d
Wo
rld
Bo
nd
Wo
rld
Sto
ck
To
tal
2013-03 7.0 7.0 12.0 8.0 7.0 7.0 7.0 7.0 12.0 12.0 7.0 7.0 100
2013-02 7.3 7.1 11.5 8.1 7.0 7.2 6.6 7.3 11.4 12.5 6.8 7.3 100
2013-01 7.4 7.1 11.8 8.0 6.9 7.0 6.9 7.0 11.8 12.1 7.0 7.1 100
2012-12 7.0 7.0 12.0 8.0 7.0 7.0 7.0 7.0 12.0 12.0 7.0 7.0 100
2012-11 7.3 7.2 12.0 7.9 6.8 7.0 7.1 7.0 11.9 11.8 7.0 7.0 100
2012-10 7.3 7.1 11.9 8.0 7.0 7.1 6.9 7.0 11.8 11.9 7.0 7.1 100
2012-09 7.0 7.0 12.0 8.0 7.0 7.0 7.0 7.0 12.0 12.0 7.0 7.0 100
2012-08 7.2 7.2 11.8 8.1 6.9 7.1 7.1 6.9 11.7 12.0 7.1 6.9 100
2012-07 7.1 7.2 11.7 8.1 7.0 7.2 6.9 6.9 11.7 12.3 7.0 7.0 100
2012-06 7.0 7.0 12.0 8.0 7.0 7.0 7.0 7.0 12.0 12.0 7.0 7.0 100
2012-05 6.6 6.9 12.1 8.2 7.2 7.1 7.0 7.1 12.0 12.0 7.0 7.0 100
2012-04 6.8 6.9 11.9 8.2 7.2 7.2 6.8 7.1 11.9 12.1 6.9 7.0 100
2012-03 7.0 7.0 12.0 8.0 7.0 7.0 7.0 7.0 12.0 12.0 7.0 7.0 100
2012-02 7.1 6.9 11.7 8.0 7.1 7.1 7.2 7.1 11.7 12.3 6.9 7.0 100
Page 19 of 25
Fund data as of 3/31/2013
Analysis, search process, and layout are © 2000-2013, fi360, Inc. (www.fi360.com). All rights reserved. The analysis and opinions generated by fi360: (1) do not constitute professional investment advice; (2) are provided
solely for informational purposes; (3) are not warranted or represented to be correct, complete, or accurate; and (4) are for the exclusive use of subscribers to fi360. The data source is © 2013 Morningstar, Inc. All rights
reserved. The data contained herein: (1) is proprietary to Morningstar, Inc and/or its content providers; (2) may not be copied or distributed; and (3) is not warranted to be accurate, complete or timely. Neither Morningstar,
Inc nor its content providers are responsible for any damages or losses arising from any use of this information. Past performance is no guarantee of future results.
fi360_Portrait_v4_3

Appendix: Model Tactical Peer Group BenchmarksModerate
Div
ers
ifie
d E
merg
ing
Mkts
Fo
reig
n L
arg
e B
len
d
Inte
rmed
iate
-Term
Bo
nd
Larg
e B
len
d
Larg
e G
row
th
Larg
e V
alu
e
Lo
ng
-Term
Bo
nd
Mid
-Cap
Ble
nd
Sh
ort
-Term
Bo
nd
Sm
all B
len
d
Wo
rld
Bo
nd
Wo
rld
Sto
ck
To
tal
2012-01 6.8 6.8 12.1 8.1 6.9 7.2 7.3 7.0 12.1 12.0 7.0 6.9 100
2011-12 7.0 7.0 12.0 8.0 7.0 7.0 7.0 7.0 12.0 12.0 7.0 7.0 100
2011-11 6.6 6.8 12.0 8.2 7.1 7.2 7.3 7.1 11.9 12.4 6.7 6.9 100
2011-10 6.3 6.7 12.9 8.0 6.9 7.1 7.6 6.7 12.7 11.5 7.0 6.7 100
2011-09 7.0 7.0 12.0 8.0 7.0 7.0 7.0 7.0 12.0 12.0 7.0 7.0 100
2011-08 6.8 6.9 12.4 7.9 7.0 6.8 7.3 6.8 12.3 11.6 7.3 6.9 100
2011-07 6.9 7.0 12.1 8.0 7.0 6.9 7.0 7.0 12.2 12.0 7.1 6.9 100
2011-06 7.0 7.0 12.0 8.0 7.0 7.0 7.0 7.0 12.0 12.0 7.0 7.0 100
2011-05 7.2 7.1 11.7 7.9 6.9 6.9 6.9 7.1 11.7 12.2 7.1 7.2 100
2011-04 7.2 7.0 11.9 7.9 6.9 6.9 6.9 7.1 11.9 12.2 7.0 7.0 100
2011-03 7.0 7.0 12.0 8.0 7.0 7.0 7.0 7.0 12.0 12.0 7.0 7.0 100
2011-02 7.1 7.1 11.4 8.3 7.2 7.3 6.6 7.2 11.4 12.3 6.8 7.2 100
2011-01 7.3 7.1 11.4 8.2 7.1 7.2 6.7 7.1 11.5 12.2 6.9 7.3 100
2010-12 7.0 7.0 12.0 8.0 7.0 7.0 7.0 7.0 12.0 12.0 7.0 7.0 100
2010-11 7.3 7.3 11.1 8.3 7.4 6.9 6.4 7.4 11.1 12.7 6.8 7.4 100
2010-10 7.3 7.2 11.3 8.2 7.3 7.0 6.6 7.3 11.3 12.5 6.8 7.2 100
2010-09 7.0 7.0 12.0 8.0 7.0 7.0 7.0 7.0 12.0 12.0 7.0 7.0 100
2010-08 7.3 7.4 12.0 7.9 6.9 6.9 7.2 6.8 11.9 11.6 7.3 7.0 100
2010-07 7.1 7.1 12.4 7.8 6.8 6.9 7.4 6.7 12.4 11.5 7.3 6.9 100
2010-06 7.0 7.0 12.0 8.0 7.0 7.0 7.0 7.0 12.0 12.0 7.0 7.0 100
2010-05 7.1 6.9 11.6 8.1 7.1 7.0 6.8 7.4 11.4 12.7 6.7 7.2 100
2010-04 7.2 7.2 11.6 8.1 7.1 7.0 6.7 7.2 11.6 12.4 6.8 7.1 100
2010-03 7.0 7.0 12.0 8.0 7.0 7.0 7.0 7.0 12.0 12.0 7.0 7.0 100
2010-02 7.0 6.7 12.2 7.9 6.9 7.0 7.1 7.2 12.1 12.3 6.7 7.0 100
2010-01 7.2 6.9 11.7 8.0 7.1 7.0 6.8 7.3 11.7 12.5 6.6 7.2 100
2009-12 7.0 7.0 12.0 8.0 7.0 7.0 7.0 7.0 12.0 12.0 7.0 7.0 100
2009-11 7.3 7.1 12.1 8.0 7.0 6.9 7.2 6.9 11.9 11.7 7.1 6.9 100
2009-10 7.4 7.1 11.7 8.0 7.0 6.9 7.0 7.1 11.6 12.1 7.0 7.2 100
2009-09 7.0 7.0 12.0 8.0 7.0 7.0 7.0 7.0 12.0 12.0 7.0 7.0 100
2009-08 7.2 7.1 11.8 4.0 7.1 7.1 7.2 7.2 11.6 12.2 6.8 7.1 96
2009-07 6.9 6.8 12.2 4.0 7.1 6.9 7.3 7.0 12.0 11.9 7.0 7.0 96
2009-06 7.0 7.0 12.0 4.0 7.0 7.0 7.0 7.0 12.0 12.0 7.0 7.0 96
2009-05 8.1 7.1 10.7 4.1 7.1 7.1 6.2 7.5 10.7 14.4 6.4 7.3 97
2009-04 7.6 7.1 11.4 4.1 7.2 7.2 6.6 7.2 11.4 12.6 6.8 7.1 96
2009-03 7.0 7.0 12.0 4.0 7.0 7.0 7.0 7.0 12.0 12.0 7.0 7.0 96
2009-02 7.0 6.9 12.5 3.7 6.9 6.5 7.7 6.9 12.6 11.5 7.3 6.8 96
2009-01 7.1 7.2 11.7 3.9 6.8 6.8 7.4 7.0 11.8 12.3 7.2 7.0 96
2008-12 7.0 7.0 12.0 4.0 7.0 7.0 7.0 7.0 12.0 12.0 7.0 7.0 96
2008-11 5.5 6.2 13.8 3.8 6.5 7.3 6.9 6.1 14.3 10.6 7.7 6.2 95
2008-10 6.4 6.7 12.7 4.0 6.8 7.3 6.9 6.8 12.5 11.8 7.2 6.7 96
2008-09 7.0 7.0 12.0 4.0 7.0 7.0 7.0 7.0 12.0 12.0 7.0 7.0 96
2008-08 3.7 6.6 12.6 3.8 6.8 6.8 10.3 6.7 12.6 11.8 7.4 6.8 96
2008-07 3.8 6.8 12.5 3.8 6.9 6.6 10.4 6.8 12.5 11.5 7.3 6.9 96
2008-06 4.0 7.0 12.0 4.0 7.0 7.0 10.0 7.0 12.0 12.0 7.0 7.0 96
2008-05 4.1 7.1 11.8 4.1 7.3 7.2 9.8 7.3 11.6 12.2 6.8 7.0 96
2008-04 3.9 7.0 12.1 4.0 7.1 7.1 9.9 7.0 11.9 11.9 7.1 7.0 96
2008-03 4.0 7.0 12.0 4.0 7.0 7.0 10.0 7.0 12.0 12.0 7.0 7.0 96
2008-02 3.8 6.6 12.6 3.9 6.7 6.8 10.5 6.8 12.7 11.4 7.5 6.7 96
2008-01 4.0 6.9 12.0 4.0 7.2 6.8 10.1 7.0 12.1 11.9 7.0 7.1 96
2007-12 4.0 7.0 12.0 4.0 7.0 7.0 10.0 7.0 12.0 12.0 7.0 7.0 96
2007-11 8.1 7.4 11.5 4.0 7.2 6.5 6.8 6.9 11.6 11.7 7.0 7.4 96
2007-10 7.5 7.2 11.7 4.0 7.2 6.9 6.9 7.0 11.8 11.8 7.0 7.2 96
2007-09 7.0 7.0 12.0 4.0 7.0 7.0 7.0 7.0 12.0 12.0 7.0 7.0 96
2007-08 7.8 7.2 12.2 7.7 7.0 6.7 7.2 6.7 12.4 11.2 7.2 7.0 100
2007-07 7.4 7.1 12.0 7.9 6.9 6.9 7.0 6.9 12.1 11.8 7.0 7.0 100
2007-06 7.0 7.0 12.0 8.0 7.0 7.0 7.0 7.0 12.0 12.0 7.0 7.0 100
2007-05 7.3 7.2 11.6 8.1 7.1 7.1 6.8 7.0 11.6 12.1 7.0 7.2 100
2007-04 7.2 7.1 11.9 8.0 7.0 7.0 6.8 7.0 11.9 12.0 7.0 7.1 100
2007-03 7.0 7.0 12.0 8.0 7.0 7.0 7.0 7.0 12.0 12.0 7.0 7.0 100
2007-02 7.2 7.1 11.7 8.1 7.1 7.1 6.8 7.1 11.7 12.2 6.8 7.2 100
Page 20 of 25
Fund data as of 3/31/2013
Analysis, search process, and layout are © 2000-2013, fi360, Inc. (www.fi360.com). All rights reserved. The analysis and opinions generated by fi360: (1) do not constitute professional investment advice; (2) are provided
solely for informational purposes; (3) are not warranted or represented to be correct, complete, or accurate; and (4) are for the exclusive use of subscribers to fi360. The data source is © 2013 Morningstar, Inc. All rights
reserved. The data contained herein: (1) is proprietary to Morningstar, Inc and/or its content providers; (2) may not be copied or distributed; and (3) is not warranted to be accurate, complete or timely. Neither Morningstar,
Inc nor its content providers are responsible for any damages or losses arising from any use of this information. Past performance is no guarantee of future results.
fi360_Portrait_v4_3

Appendix: Model Tactical Peer Group BenchmarksModerate
Div
ers
ifie
d E
merg
ing
Mkts
Fo
reig
n L
arg
e B
len
d
Inte
rmed
iate
-Term
Bo
nd
Larg
e B
len
d
Larg
e G
row
th
Larg
e V
alu
e
Lo
ng
-Term
Bo
nd
Mid
-Cap
Ble
nd
Sh
ort
-Term
Bo
nd
Sm
all B
len
d
Wo
rld
Bo
nd
Wo
rld
Sto
ck
To
tal
2007-01 7.3 7.2 11.8 8.1 6.9 7.1 6.9 6.9 11.9 11.9 6.9 7.1 100
2006-12 7.0 7.0 12.0 8.0 7.0 7.0 7.0 7.0 12.0 12.0 7.0 7.0 100
2006-11 7.1 6.9 11.7 8.1 7.2 7.1 6.9 7.0 11.6 12.3 6.9 7.1 100
2006-10 7.0 6.9 12.0 8.1 7.2 7.1 7.0 7.0 11.9 12.0 6.9 7.0 100
2006-09 7.0 7.0 12.0 8.0 7.0 7.0 7.0 7.0 12.0 12.0 7.0 7.0 100
Conservative
Div
ers
ifie
d E
merg
ing
Mkts
Eq
uit
y P
recio
us M
eta
ls
Fo
reig
n L
arg
e B
len
d
Inte
rmed
iate
-Term
Bo
nd
Larg
e B
len
d
Larg
e G
row
th
Larg
e V
alu
e
Lo
ng
-Term
Bo
nd
Mid
-Cap
Ble
nd
Mo
dera
te A
llo
cati
on
Mo
ney M
ark
et
Taxab
le
Real E
sta
te
Sm
all B
len
d
Wo
rld
Bo
nd
To
tal
2013-03 2.0 0.0 0.0 6.0 6.0 2.0 1.0 4.0 2.0 13.0 54.0 3.0 3.0 4.0 100
2013-02 2.1 2.6 10.5 5.9 6.3 2.1 1.1 3.9 2.2 0.0 53.1 3.1 3.3 3.9 100
2013-01 2.1 2.9 10.2 6.0 6.0 2.0 1.0 4.0 2.0 0.0 53.6 3.1 3.1 4.0 100
2012-12 2.0 3.0 10.0 6.0 6.0 2.0 1.0 4.0 2.0 0.0 54.0 3.0 3.0 4.0 100
2012-11 2.1 3.3 10.3 6.0 6.0 1.9 1.0 4.1 2.0 0.0 53.5 2.9 3.0 4.0 100
2012-10 2.1 3.4 10.2 6.0 6.1 2.0 1.0 4.0 2.0 0.0 53.3 2.9 3.1 4.0 100
2012-09 2.0 3.0 10.0 6.0 6.0 2.0 1.0 4.0 2.0 0.0 54.0 3.0 3.0 4.0 100
2012-08 2.1 3.0 10.5 6.0 6.2 2.0 1.0 4.1 2.0 0.0 53.0 3.2 3.0 4.0 100
2012-07 2.0 3.0 10.4 5.9 6.1 2.0 1.0 4.0 2.0 0.0 53.3 3.1 3.1 4.0 100
2012-06 2.0 3.0 10.0 6.0 6.0 2.0 1.0 4.0 2.0 0.0 54.0 3.0 3.0 4.0 100
2012-05 2.9 1.7 6.0 10.1 6.2 2.1 1.0 4.0 2.0 0.0 53.9 3.3 3.0 4.0 100
2012-04 2.9 1.8 6.0 10.0 6.2 2.1 1.0 4.0 2.0 0.0 53.9 3.1 3.1 4.0 100
2012-03 3.0 2.0 6.0 10.0 6.0 2.0 1.0 4.0 2.0 0.0 54.0 3.0 3.0 4.0 100
2012-02 3.2 1.9 6.1 10.0 6.2 2.1 1.0 4.1 2.1 0.0 52.8 3.4 3.1 4.0 100
2012-01 2.9 1.7 5.9 10.1 6.1 2.0 1.0 4.1 2.0 0.0 54.0 3.2 3.0 4.1 100
2011-12 3.0 2.0 6.0 10.0 6.0 2.0 1.0 4.0 2.0 0.0 54.0 3.0 3.0 4.0 100
2011-11 2.9 1.8 5.9 10.1 6.1 2.1 1.0 4.1 2.0 0.0 54.0 3.1 3.1 4.0 100
2011-10 2.7 1.8 5.5 10.3 5.7 1.9 1.0 4.1 1.8 0.0 55.7 2.8 2.7 4.1 100
2011-09 3.0 2.0 6.0 10.0 6.0 2.0 1.0 4.0 2.0 0.0 54.0 3.0 3.0 4.0 100
2011-08 2.9 2.0 5.8 10.1 5.8 2.0 1.0 4.1 1.9 0.0 54.3 3.1 2.9 4.1 100
2011-07 3.0 1.9 6.0 10.0 5.9 2.0 1.0 4.0 2.0 0.0 54.4 2.9 3.0 4.0 100
2011-06 3.0 2.0 6.0 10.0 6.0 2.0 1.0 4.0 2.0 0.0 54.0 3.0 3.0 4.0 100
2011-05 3.3 2.1 6.2 10.0 6.1 2.0 1.0 4.0 2.1 0.0 53.0 3.2 3.1 4.0 100
2011-04 3.2 2.0 6.0 10.0 6.0 2.0 1.0 4.0 2.0 0.0 53.8 3.0 3.1 4.0 100
2011-03 3.0 2.0 6.0 10.0 6.0 2.0 1.0 4.0 2.0 0.0 54.0 3.0 3.0 4.0 100
2011-02 3.0 1.8 6.3 9.9 6.4 2.1 1.1 4.0 2.1 0.0 53.1 3.1 3.1 3.9 100
2011-01 3.1 2.1 6.3 9.8 6.3 2.1 1.1 3.9 2.1 0.0 53.1 3.0 3.2 3.9 100
2010-12 3.0 2.0 6.0 10.0 6.0 2.0 1.0 4.0 2.0 0.0 54.0 3.0 3.0 4.0 100
2010-11 3.3 2.1 6.6 9.7 6.6 2.2 1.0 3.9 2.2 0.0 51.8 3.3 3.4 3.9 100
2010-10 3.2 2.1 6.4 9.8 6.4 2.2 1.0 4.0 2.2 0.0 52.5 3.1 3.3 3.9 100
2010-09 3.0 2.0 6.0 10.0 6.0 2.0 1.0 4.0 2.0 0.0 54.0 3.0 3.0 4.0 100
2010-08 3.2 2.0 6.4 10.1 6.0 2.0 1.0 4.1 2.0 0.0 53.2 3.1 2.9 4.1 100
2010-07 3.0 2.1 6.0 10.2 5.7 1.9 1.0 4.1 1.9 0.0 54.4 2.9 2.8 4.1 100
2010-06 3.0 2.0 6.0 10.0 6.0 2.0 1.0 4.0 2.0 0.0 54.0 3.0 3.0 4.0 100
2010-05 3.2 2.2 6.1 9.9 6.3 2.1 1.0 4.0 2.2 0.0 52.2 3.6 3.3 4.0 100
2010-04 3.2 2.0 6.3 9.9 6.2 2.1 1.0 4.0 2.1 0.0 52.9 3.3 3.2 4.0 100
2010-03 3.0 2.0 6.0 10.0 6.0 2.0 1.0 4.0 2.0 0.0 54.0 3.0 3.0 4.0 100
2010-02 2.9 1.7 5.8 10.2 5.9 2.0 1.0 4.2 2.1 0.0 54.2 3.0 3.1 4.1 100
2010-01 3.0 1.9 6.0 9.9 6.1 2.1 1.0 4.0 2.1 0.0 53.6 3.1 3.2 4.0 100
2009-12 3.0 2.0 6.0 10.0 6.0 2.0 1.0 4.0 2.0 0.0 54.0 3.0 3.0 4.0 100
Page 21 of 25
Fund data as of 3/31/2013
Analysis, search process, and layout are © 2000-2013, fi360, Inc. (www.fi360.com). All rights reserved. The analysis and opinions generated by fi360: (1) do not constitute professional investment advice; (2) are provided
solely for informational purposes; (3) are not warranted or represented to be correct, complete, or accurate; and (4) are for the exclusive use of subscribers to fi360. The data source is © 2013 Morningstar, Inc. All rights
reserved. The data contained herein: (1) is proprietary to Morningstar, Inc and/or its content providers; (2) may not be copied or distributed; and (3) is not warranted to be accurate, complete or timely. Neither Morningstar,
Inc nor its content providers are responsible for any damages or losses arising from any use of this information. Past performance is no guarantee of future results.
fi360_Portrait_v4_3

Appendix: Model Tactical Peer Group BenchmarksConservative
Div
ers
ifie
d E
merg
ing
Mkts
Eq
uit
y P
recio
us M
eta
ls
Fo
reig
n L
arg
e B
len
d
Inte
rmed
iate
-Term
Bo
nd
Larg
e B
len
d
Larg
e G
row
th
Larg
e V
alu
e
Lo
ng
-Term
Bo
nd
Mid
-Cap
Ble
nd
Mo
dera
te A
llo
cati
on
Mo
ney M
ark
et
Taxab
le
Real E
sta
te
Sm
all B
len
d
Wo
rld
Bo
nd
To
tal
2009-11 3.2 2.1 6.1 10.1 6.0 2.0 1.0 4.1 2.0 0.0 53.2 3.2 2.9 4.1 100
2009-10 3.2 2.2 6.2 10.0 6.1 2.0 1.0 4.0 2.1 0.0 52.8 3.2 3.1 4.0 100
2009-09 3.0 2.0 6.0 10.0 6.0 2.0 1.0 4.0 2.0 0.0 54.0 3.0 3.0 4.0 100
2009-08 3.2 1.8 6.3 10.2 6.2 2.1 1.0 4.3 2.1 0.0 52.3 3.2 3.3 4.1 100
2009-07 2.9 1.8 5.9 10.2 6.0 2.0 1.0 4.2 2.0 0.0 54.0 3.0 3.1 4.1 100
2009-06 3.0 2.0 6.0 10.0 6.0 2.0 1.0 4.0 2.0 0.0 54.0 3.0 3.0 4.0 100
2009-05 3.8 1.9 6.6 9.6 6.5 2.2 1.1 4.0 2.3 0.0 50.2 4.1 3.7 4.0 100
2009-04 3.4 2.2 6.3 9.8 6.3 2.1 1.1 3.9 2.1 0.0 52.5 3.2 3.2 4.0 100
2009-03 3.0 2.0 6.0 10.0 6.0 2.0 1.0 4.0 2.0 0.0 54.0 3.0 3.0 4.0 100
2009-02 2.9 2.4 5.8 10.3 5.6 1.9 0.9 4.3 1.9 0.0 53.8 3.1 2.8 4.1 100
2009-01 3.1 2.4 6.3 9.9 5.9 2.0 1.0 4.2 2.0 0.0 52.5 3.7 3.1 4.0 100
2008-12 3.0 2.0 6.0 10.0 6.0 2.0 1.0 4.0 2.0 0.0 54.0 3.0 3.0 4.0 100
2008-11 2.0 1.3 4.8 10.4 5.2 1.7 0.9 3.4 1.6 0.0 60.7 1.8 2.4 3.9 100
2008-10 2.6 1.9 5.5 10.1 5.7 1.9 1.0 3.7 1.9 0.0 56.1 2.9 2.9 3.9 100
2008-09 3.0 2.0 6.0 10.0 6.0 2.0 1.0 4.0 2.0 0.0 54.0 3.0 3.0 4.0 100
2008-08 2.6 1.9 5.5 10.2 5.7 1.9 1.0 3.9 1.9 0.0 55.7 2.8 3.0 4.1 100
2008-07 2.8 2.1 5.7 10.2 5.7 1.9 0.9 4.0 1.9 0.0 55.3 2.8 2.9 4.0 100
2008-06 3.0 2.0 6.0 10.0 6.0 2.0 1.0 4.0 2.0 0.0 54.0 3.0 3.0 4.0 100
2008-05 3.1 1.7 6.1 9.9 6.2 2.1 1.0 3.9 2.1 0.0 53.6 3.3 3.1 4.0 100
2008-04 2.9 1.8 6.0 10.0 6.0 2.0 1.0 3.9 2.0 0.0 54.3 3.2 3.0 4.0 100
2008-03 3.0 2.0 6.0 10.0 6.0 2.0 1.0 4.0 2.0 0.0 54.0 3.0 3.0 4.0 100
2008-02 2.8 2.3 5.5 10.3 5.6 1.9 1.0 4.0 1.9 0.0 54.9 3.0 2.9 4.1 100
2008-01 3.0 2.0 5.9 10.0 6.0 2.0 1.0 4.0 2.0 0.0 54.2 2.8 3.0 4.0 100
2007-12 3.0 2.0 6.0 10.0 6.0 2.0 1.0 4.0 2.0 0.0 54.0 3.0 3.0 4.0 100
2007-11 3.6 2.7 6.5 9.8 6.2 2.1 1.0 3.9 2.0 0.0 52.3 3.1 2.9 4.0 100
2007-10 3.3 2.4 6.3 9.9 6.1 2.1 1.0 4.0 2.0 0.0 53.0 3.1 2.9 4.0 100
2007-09 3.0 2.0 6.0 10.0 6.0 2.0 1.0 4.0 2.0 0.0 54.0 3.0 3.0 4.0 100
2007-08 3.2 2.1 6.1 10.1 5.7 2.0 0.9 4.0 1.9 0.0 54.7 2.5 2.8 4.0 100
2007-07 3.1 2.0 6.1 10.0 5.9 2.0 1.0 4.0 2.0 0.0 54.4 2.7 3.0 4.0 100
2007-06 3.0 2.0 6.0 10.0 6.0 2.0 1.0 4.0 2.0 0.0 54.0 3.0 3.0 4.0 100
2007-05 3.2 2.0 6.3 9.9 6.3 2.1 1.0 3.9 2.1 0.0 53.4 2.9 3.0 4.0 100
2007-04 3.1 2.0 6.1 10.0 6.0 2.0 1.0 4.0 2.0 0.0 53.9 2.9 3.0 4.0 100
2007-03 3.0 2.0 6.0 10.0 6.0 2.0 1.0 4.0 2.0 0.0 54.0 3.0 3.0 4.0 100
2007-02 3.1 1.9 6.2 9.8 6.1 2.0 1.0 3.9 2.0 0.0 53.8 3.0 3.1 4.0 100
2007-01 3.1 1.9 6.2 9.9 6.1 2.0 1.0 4.0 2.0 0.0 54.0 2.8 3.0 4.0 100
2006-12 3.0 2.0 6.0 10.0 6.0 2.0 1.0 4.0 2.0 0.0 54.0 3.0 3.0 4.0 100
2006-11 3.0 1.9 6.1 10.0 6.2 2.1 1.0 4.0 2.1 0.0 53.4 3.2 3.1 4.0 100
2006-10 3.0 1.8 6.0 10.0 6.1 2.1 1.0 4.0 2.0 0.0 53.9 3.0 3.0 4.0 100
2006-09 3.0 2.0 6.0 10.0 6.0 2.0 1.0 4.0 2.0 0.0 54.0 3.0 3.0 4.0 100
2006-08 2.9 2.0 6.0 10.1 5.9 2.0 1.0 4.0 1.9 0.0 53.9 3.3 2.9 4.1 100
2006-07 2.9 2.0 6.0 10.0 6.0 2.0 1.0 4.0 2.0 0.0 54.0 3.2 3.0 4.0 100
2006-06 3.0 2.0 6.0 10.0 6.0 2.0 1.0 4.0 2.0 0.0 54.0 3.0 3.0 4.0 100
2006-05 3.2 2.5 6.4 9.7 6.1 2.0 1.0 3.8 2.1 0.0 53.6 2.9 3.1 3.8 100
2006-04 3.0 2.2 6.1 9.9 6.0 2.0 1.0 3.9 2.0 0.0 53.9 3.0 3.1 3.9 100
2006-03 3.0 2.0 6.0 10.0 6.0 2.0 1.0 4.0 2.0 0.0 54.0 3.0 3.0 4.0 100
2006-02 3.5 2.6 6.5 9.8 6.0 2.0 1.0 3.9 2.1 0.0 52.6 3.2 3.1 4.0 100
2006-01 3.2 2.2 6.2 10.0 5.9 2.0 1.0 4.0 2.0 0.0 53.5 3.0 3.0 4.0 100
2005-12 3.0 2.0 6.0 10.0 6.0 2.0 1.0 4.0 2.0 0.0 54.0 3.0 3.0 4.0 100
2005-11 3.1 2.2 6.1 9.8 6.0 2.0 1.0 3.8 2.0 0.0 54.3 2.9 2.9 4.0 100
2005-10 3.3 2.4 6.2 9.8 6.0 2.0 1.0 3.9 2.0 0.0 53.6 3.0 3.0 4.0 100
2005-09 3.0 2.0 6.0 10.0 6.0 2.0 1.0 4.0 2.0 0.0 54.0 3.0 3.0 4.0 100
2005-08 3.2 2.1 6.2 9.8 6.1 2.0 1.0 3.9 2.1 0.0 53.1 3.2 3.2 4.0 100
2005-07 3.0 2.2 6.0 10.0 5.9 2.0 1.0 4.0 2.0 0.0 53.6 3.1 3.1 4.0 100
2005-06 3.0 2.0 6.0 10.0 6.0 2.0 1.0 4.0 2.0 0.0 54.0 3.0 3.0 4.0 100
2005-05 2.7 1.7 5.8 10.1 5.9 2.0 1.0 4.1 1.9 0.0 54.8 3.2 2.8 4.1 100
2005-04 2.8 1.9 5.9 10.0 6.0 2.0 1.0 4.0 2.0 0.0 54.5 3.0 3.0 4.0 100
2005-03 3.0 2.0 6.0 10.0 6.0 2.0 1.0 4.0 2.0 0.0 54.0 3.0 3.0 4.0 100
Aggressive
Page 22 of 25
Fund data as of 3/31/2013
Analysis, search process, and layout are © 2000-2013, fi360, Inc. (www.fi360.com). All rights reserved. The analysis and opinions generated by fi360: (1) do not constitute professional investment advice; (2) are provided
solely for informational purposes; (3) are not warranted or represented to be correct, complete, or accurate; and (4) are for the exclusive use of subscribers to fi360. The data source is © 2013 Morningstar, Inc. All rights
reserved. The data contained herein: (1) is proprietary to Morningstar, Inc and/or its content providers; (2) may not be copied or distributed; and (3) is not warranted to be accurate, complete or timely. Neither Morningstar,
Inc nor its content providers are responsible for any damages or losses arising from any use of this information. Past performance is no guarantee of future results.
fi360_Portrait_v4_3

Appendix: Model Tactical Peer Group BenchmarksAggressive
Div
ers
ifie
d E
merg
ing
Mkts
Eq
uit
y P
recio
us M
eta
ls
Fo
reig
n L
arg
e B
len
d
Inte
rmed
iate
-Term
Bo
nd
Larg
e B
len
d
Larg
e V
alu
e
Lo
ng
-Term
Bo
nd
Mid
-Cap
Ble
nd
Mo
ney M
ark
et
Taxab
le
Real E
sta
te
Sm
all B
len
d
Sm
all V
alu
e
Wo
rld
Bo
nd
To
tal
2013-03 15.0 6.0 20.0 0.0 15.0 0.0 5.0 8.0 5.0 12.0 10.0 0.0 4.0 100
2013-02 18.9 3.3 25.4 0.0 14.0 0.0 1.9 10.3 0.9 7.9 14.6 0.0 2.8 100
2013-01 19.4 3.7 25.2 0.0 13.7 0.0 1.9 9.9 1.0 8.0 14.3 0.0 2.9 100
2012-12 19.0 4.0 25.0 0.0 14.0 0.0 2.0 10.0 1.0 8.0 14.0 0.0 3.0 100
2012-11 19.3 4.3 25.3 0.0 13.7 0.0 2.0 9.9 1.0 7.7 13.8 0.0 3.0 100
2012-10 19.3 4.4 25.0 0.0 13.9 0.0 2.0 9.9 1.0 7.7 14.0 0.0 2.9 100
2012-09 19.0 4.0 25.0 0.0 14.0 0.0 2.0 10.0 1.0 8.0 14.0 0.0 3.0 100
2012-08 19.1 3.9 25.4 0.0 14.1 0.0 2.0 9.7 1.0 8.3 13.7 0.0 2.9 100
2012-07 19.0 3.9 25.5 0.0 13.9 0.0 2.0 9.8 1.0 8.1 14.0 0.0 2.9 100
2012-06 19.0 4.0 25.0 0.0 14.0 0.0 2.0 10.0 1.0 8.0 14.0 0.0 3.0 100
2012-05 18.4 3.4 24.7 0.0 14.4 0.0 2.0 10.2 1.0 8.8 14.1 0.0 3.0 100
2012-04 18.5 3.6 24.9 0.0 14.4 0.0 2.0 10.1 1.0 8.3 14.3 0.0 3.0 100
2012-03 19.0 4.0 25.0 0.0 14.0 0.0 2.0 10.0 1.0 8.0 14.0 0.0 3.0 100
2012-02 19.3 3.6 24.5 0.0 14.0 0.0 2.0 10.0 0.9 8.7 14.1 0.0 2.9 100
2012-01 18.6 3.5 24.7 0.0 14.3 0.0 2.1 10.1 1.0 8.5 14.2 0.0 3.1 100
2011-12 19.0 4.0 25.0 0.0 14.0 0.0 2.0 10.0 1.0 8.0 14.0 0.0 3.0 100
2011-11 18.3 3.7 24.6 0.0 14.4 0.0 2.1 10.3 1.0 8.4 14.4 0.0 3.0 100
2011-10 18.2 3.9 24.9 0.0 14.5 0.0 2.2 10.0 1.1 8.0 13.9 0.0 3.3 100
2011-09 19.0 4.0 25.0 0.0 14.0 0.0 2.0 10.0 1.0 8.0 14.0 0.0 3.0 100
2011-08 19.0 4.1 24.9 0.0 13.8 0.0 2.1 9.7 1.0 8.5 13.8 0.0 3.1 100
2011-07 19.2 3.9 25.0 0.0 14.0 0.0 2.0 10.0 1.0 7.9 14.0 0.0 3.0 100
2011-06 19.0 4.0 25.0 0.0 14.0 0.0 2.0 10.0 1.0 8.0 14.0 0.0 3.0 100
2011-05 19.9 4.0 24.7 0.0 13.7 0.0 1.9 9.9 1.0 8.2 13.9 0.0 2.9 100
2011-04 19.9 3.9 24.4 0.0 13.8 0.0 2.0 10.1 1.0 7.8 14.2 0.0 2.9 100
2011-03 19.0 4.0 25.0 0.0 14.0 0.0 2.0 10.0 1.0 8.0 14.0 0.0 3.0 100
2011-02 18.4 3.5 25.8 0.0 14.3 0.0 1.9 10.3 0.9 7.9 14.1 0.0 2.8 100
2011-01 19.0 3.9 25.4 0.0 14.1 0.0 1.9 10.1 0.9 7.7 14.1 0.0 2.8 100
2010-12 19.0 4.0 25.0 0.0 14.0 0.0 2.0 10.0 1.0 8.0 14.0 0.0 3.0 100
2010-11 19.2 3.8 25.1 0.0 14.0 0.0 1.8 10.1 0.9 8.0 14.5 0.0 2.7 100
2010-10 19.2 3.9 25.1 0.0 13.9 0.0 1.9 10.2 0.9 7.7 14.5 0.0 2.8 100
2010-09 19.0 4.0 25.0 0.0 14.0 0.0 2.0 10.0 1.0 8.0 14.0 0.0 3.0 100
2010-08 19.7 3.8 26.0 0.0 13.6 0.0 2.0 9.6 1.0 8.1 13.2 0.0 3.0 100
2010-07 19.4 4.3 25.5 0.0 13.7 0.0 2.1 9.6 1.0 8.0 13.3 0.0 3.1 100
2010-06 19.0 4.0 25.0 0.0 14.0 0.0 2.0 10.0 1.0 8.0 14.0 0.0 3.0 100
2010-05 18.8 4.2 23.9 0.0 13.7 0.0 1.9 10.2 0.9 8.9 14.6 0.0 2.8 100
2010-04 19.2 3.8 24.9 0.0 13.9 0.0 1.9 10.0 0.9 8.3 14.2 0.0 2.8 100
2010-03 19.0 4.0 25.0 0.0 14.0 0.0 2.0 10.0 1.0 8.0 14.0 0.0 3.0 100
2010-02 18.6 3.4 24.4 0.0 14.0 0.0 2.1 10.5 1.0 8.2 14.7 0.0 3.1 100
2010-01 18.9 3.7 24.6 0.0 13.9 0.0 2.0 10.4 1.0 8.1 14.6 0.0 2.9 100
2009-12 19.0 4.0 25.0 0.0 14.0 0.0 2.0 10.0 1.0 8.0 14.0 0.0 3.0 100
2009-11 19.8 4.2 24.9 0.0 13.7 0.0 2.0 9.8 1.0 8.3 13.4 0.0 3.0 100
2009-10 19.6 4.2 24.8 0.0 13.6 0.0 1.9 9.9 0.9 8.2 13.9 0.0 2.9 100
2009-09 19.0 4.0 25.0 0.0 14.0 0.0 2.0 10.0 1.0 8.0 14.0 0.0 3.0 100
2009-08 19.1 3.5 24.8 0.0 13.9 0.0 2.1 10.1 0.9 8.1 14.7 0.0 2.9 100
2009-07 18.8 3.6 24.8 0.0 14.1 0.0 2.1 10.1 1.0 8.0 14.5 0.0 3.1 100
2009-06 19.0 4.0 25.0 0.0 14.0 0.0 2.0 10.0 1.0 8.0 14.0 0.0 3.0 100
2009-05 20.6 3.2 24.1 0.0 13.1 0.0 1.7 10.0 0.8 9.2 14.6 0.0 2.6 100
2009-04 20.0 4.1 24.7 0.0 13.7 0.0 1.8 9.9 0.9 8.1 14.0 0.0 2.8 100
2009-03 19.0 4.0 25.0 0.0 14.0 0.0 2.0 10.0 1.0 8.0 14.0 0.0 3.0 100
2009-02 18.9 5.0 24.3 0.0 13.4 0.0 2.2 10.0 1.0 8.6 13.5 0.0 3.2 100
2009-01 19.0 4.6 24.9 0.0 13.1 0.0 2.0 9.7 0.9 9.3 13.6 0.0 2.9 100
2008-12 19.0 4.0 25.0 0.0 14.0 0.0 2.0 10.0 1.0 8.0 14.0 0.0 3.0 100
2008-11 16.8 3.4 24.9 0.0 15.9 0.0 2.2 10.3 1.5 6.3 14.9 0.0 3.8 100
2008-10 17.8 4.1 24.4 0.0 14.4 0.0 2.0 10.1 1.1 8.4 14.6 0.0 3.2 100
2008-09 19.0 4.0 25.0 0.0 14.0 0.0 2.0 10.0 1.0 8.0 14.0 0.0 3.0 100
2008-08 17.5 4.1 24.4 0.0 14.3 0.0 2.1 10.1 1.1 8.2 14.9 0.0 3.3 100
2008-07 18.5 4.5 24.7 0.0 14.1 0.0 2.1 10.1 1.1 7.8 14.1 0.0 3.2 100
2008-06 19.0 4.0 25.0 0.0 14.0 0.0 2.0 10.0 1.0 8.0 14.0 0.0 3.0 100
2008-05 18.8 3.2 25.4 0.0 14.1 0.0 1.9 10.3 1.0 8.5 13.9 0.0 2.9 100
2008-04 18.2 3.7 25.2 0.0 14.1 0.0 2.0 10.0 1.0 8.6 14.2 0.0 3.0 100
Page 23 of 25
Fund data as of 3/31/2013
Analysis, search process, and layout are © 2000-2013, fi360, Inc. (www.fi360.com). All rights reserved. The analysis and opinions generated by fi360: (1) do not constitute professional investment advice; (2) are provided
solely for informational purposes; (3) are not warranted or represented to be correct, complete, or accurate; and (4) are for the exclusive use of subscribers to fi360. The data source is © 2013 Morningstar, Inc. All rights
reserved. The data contained herein: (1) is proprietary to Morningstar, Inc and/or its content providers; (2) may not be copied or distributed; and (3) is not warranted to be accurate, complete or timely. Neither Morningstar,
Inc nor its content providers are responsible for any damages or losses arising from any use of this information. Past performance is no guarantee of future results.
fi360_Portrait_v4_3

Appendix: Model Tactical Peer Group BenchmarksAggressive
Div
ers
ifie
d E
merg
ing
Mkts
Eq
uit
y P
recio
us M
eta
ls
Fo
reig
n L
arg
e B
len
d
Inte
rmed
iate
-Term
Bo
nd
Larg
e B
len
d
Larg
e V
alu
e
Lo
ng
-Term
Bo
nd
Mid
-Cap
Ble
nd
Mo
ney M
ark
et
Taxab
le
Real E
sta
te
Sm
all B
len
d
Sm
all V
alu
e
Wo
rld
Bo
nd
To
tal
2008-03 19.0 4.0 25.0 0.0 14.0 0.0 2.0 10.0 1.0 8.0 14.0 0.0 3.0 100
2008-02 18.5 4.8 24.1 0.0 14.1 0.0 2.1 10.0 1.1 8.0 0.0 14.1 3.3 100
2008-01 19.3 4.1 24.8 0.0 14.1 0.0 2.0 10.0 1.0 7.6 0.0 14.0 3.0 100
2007-12 19.0 4.0 25.0 0.0 14.0 0.0 2.0 10.0 1.0 8.0 0.0 14.0 3.0 100
2007-11 21.3 5.0 24.7 0.0 13.3 0.0 1.8 9.5 0.9 7.7 0.0 13.0 2.8 100
2007-10 19.9 4.6 25.0 0.0 13.8 0.0 1.9 9.7 1.0 7.9 0.0 13.4 2.9 100
2007-09 19.0 4.0 25.0 0.0 14.0 0.0 2.0 10.0 1.0 8.0 0.0 14.0 3.0 100
2007-08 20.8 4.2 25.2 0.0 13.9 0.0 2.0 9.5 1.0 6.8 0.0 13.5 3.1 100
2007-07 19.6 4.0 25.4 0.0 13.9 0.0 2.0 9.8 1.0 7.3 0.0 14.1 3.0 100
2007-06 19.0 4.0 25.0 0.0 14.0 0.0 2.0 10.0 1.0 8.0 0.0 14.0 3.0 100
2007-05 19.5 3.8 25.2 0.0 14.2 0.0 1.9 9.9 1.0 7.4 0.0 14.2 2.9 100
2007-04 19.4 3.9 25.0 0.0 13.9 0.0 2.0 10.0 1.0 7.6 0.0 14.3 3.0 100
2007-03 19.0 4.0 25.0 0.0 14.0 0.0 2.0 10.0 1.0 8.0 0.0 14.0 3.0 100
2007-02 19.1 3.7 25.3 0.0 13.9 0.0 1.9 10.0 1.0 8.3 0.0 13.9 2.9 100
2007-01 19.5 3.8 25.3 0.0 13.9 0.0 2.0 9.8 1.0 7.8 0.0 14.0 3.0 100
2006-12 19.0 4.0 25.0 0.0 14.0 0.0 2.0 10.0 1.0 8.0 0.0 14.0 3.0 100
2006-11 18.8 3.7 25.0 0.0 14.2 0.0 2.0 10.0 1.0 8.4 0.0 14.1 3.0 100
2006-10 18.9 3.6 25.1 0.0 14.3 0.0 2.0 10.0 1.0 8.2 14.0 0.0 3.0 100
2006-09 19.0 4.0 25.0 0.0 14.0 0.0 2.0 10.0 1.0 8.0 14.0 0.0 3.0 100
2006-08 18.7 4.0 25.2 0.0 14.0 0.0 2.0 9.7 1.0 8.7 13.7 0.0 3.1 100
2006-07 18.6 4.0 25.1 0.0 14.0 0.0 2.0 10.0 1.0 8.5 13.8 0.0 3.0 100
2006-06 19.0 4.0 25.0 0.0 14.0 0.0 2.0 10.0 1.0 8.0 14.0 0.0 3.0 100
2006-05 19.4 4.7 25.3 0.0 13.8 0.0 1.8 9.8 1.0 7.7 14.0 0.0 2.7 100
2006-04 18.7 4.3 25.0 0.0 13.9 0.0 1.9 10.0 1.0 8.2 14.3 0.0 2.8 100
2006-03 19.0 4.0 25.0 0.0 14.0 0.0 2.0 10.0 1.0 8.0 14.0 0.0 3.0 100
2006-02 11.1 6.3 10.5 14.0 24.0 0.0 4.7 9.9 0.0 4.9 9.9 0.0 4.7 100
2006-01 10.5 5.5 10.3 14.8 24.5 0.0 5.0 9.8 0.0 4.9 9.8 0.0 5.0 100
2005-12 10.0 5.0 10.0 15.0 25.0 0.0 5.0 10.0 0.0 5.0 10.0 0.0 5.0 100
2005-11 10.3 5.5 10.2 14.8 25.1 0.0 4.8 9.9 0.0 4.9 9.7 0.0 5.0 100
2005-10 10.7 5.8 10.2 14.5 24.7 0.0 4.8 9.8 0.0 4.9 9.8 0.0 4.9 100
2005-09 10.0 5.0 10.0 15.0 25.0 0.0 5.0 10.0 0.0 5.0 10.0 0.0 5.0 100
2005-08 10.3 5.1 10.1 14.3 24.5 0.0 4.7 10.2 0.0 5.4 10.6 0.0 4.8 100
2005-07 10.0 5.4 9.9 14.8 24.5 0.0 5.0 10.0 0.0 5.2 10.4 0.0 5.0 100
2005-06 10.0 5.0 10.0 15.0 25.0 0.0 5.0 10.0 0.0 5.0 10.0 0.0 5.0 100
2005-05 9.4 4.5 9.8 15.7 25.2 0.0 5.3 9.9 0.0 5.4 9.7 0.0 5.2 100
2005-04 9.4 4.9 9.9 15.2 25.3 0.0 5.1 10.1 0.0 5.1 10.0 0.0 5.0 100
2005-03 10.0 5.0 10.0 15.0 25.0 0.0 5.0 10.0 0.0 5.0 10.0 0.0 5.0 100
2005-02 10.5 4.4 10.1 15.0 25.2 0.0 5.1 10.0 0.0 4.8 9.9 0.0 5.1 100
2005-01 10.3 4.5 10.1 14.7 25.2 0.0 5.0 10.1 0.0 5.1 10.0 0.0 5.0 100
2004-12 10.0 5.0 10.0 15.0 25.0 0.0 5.0 10.0 0.0 5.0 10.0 0.0 5.0 100
2004-11 10.4 5.5 10.1 14.7 0.0 24.3 4.9 10.1 0.0 5.1 10.0 0.0 4.9 100
2004-10 10.3 5.4 10.0 14.7 0.0 24.7 4.9 10.0 0.0 4.9 10.1 0.0 4.9 100
2004-09 10.0 5.0 10.0 15.0 0.0 25.0 5.0 10.0 0.0 5.0 10.0 0.0 5.0 100
2004-08 9.7 4.7 10.0 15.3 0.0 25.1 5.1 9.8 0.0 5.2 10.1 0.0 5.1 100
2004-07 9.7 4.8 10.1 14.9 0.0 25.3 5.0 10.1 0.0 5.1 10.3 0.0 4.9 100
2004-06 10.0 5.0 10.0 15.0 0.0 25.0 5.0 10.0 0.0 5.0 10.0 0.0 5.0 100
2004-05 9.6 4.3 10.4 15.3 0.0 25.3 5.0 10.1 0.0 4.8 10.2 0.0 5.0 100
2004-04 10.1 5.2 10.1 15.0 0.0 24.3 5.0 10.0 0.0 5.2 10.1 0.0 5.0 100
2004-03 10.0 5.0 10.0 15.0 0.0 25.0 5.0 10.0 0.0 5.0 10.0 0.0 5.0 100
2004-02 10.6 4.3 10.3 14.5 0.0 25.6 4.9 9.8 0.0 5.0 10.1 0.0 4.9 100
2004-01 10.4 4.8 10.3 14.5 0.0 25.7 4.9 9.7 0.0 5.0 9.9 0.0 4.9 100
2003-12 10.0 5.0 10.0 15.0 0.0 25.0 5.0 10.0 0.0 5.0 10.0 0.0 5.0 100
2003-11 10.3 5.7 10.3 14.6 0.0 24.5 4.9 10.0 0.0 5.0 9.8 0.0 4.9 100
2003-10 10.0 5.2 10.2 15.3 0.0 24.4 5.2 9.8 0.0 5.1 9.6 0.0 5.2 100
2003-09 10.0 5.0 10.0 15.0 0.0 25.0 5.0 10.0 0.0 5.0 10.0 0.0 5.0 100
2003-08 10.9 5.3 10.0 14.3 0.0 24.7 4.5 10.2 0.0 5.2 10.4 0.0 4.6 100
2003-07 10.4 5.1 10.0 14.9 0.0 24.7 4.9 10.0 0.0 5.0 10.0 0.0 4.9 100
2003-06 10.0 5.0 10.0 15.0 0.0 25.0 5.0 10.0 0.0 5.0 10.0 0.0 5.0 100
2003-05 9.9 4.4 10.2 14.5 0.0 25.5 4.8 10.2 0.0 5.1 10.3 0.0 5.1 100
2003-04 9.7 4.7 10.0 15.1 0.0 24.9 5.0 10.1 0.0 5.2 10.2 0.0 5.1 100
Page 24 of 25
Fund data as of 3/31/2013
Analysis, search process, and layout are © 2000-2013, fi360, Inc. (www.fi360.com). All rights reserved. The analysis and opinions generated by fi360: (1) do not constitute professional investment advice; (2) are provided
solely for informational purposes; (3) are not warranted or represented to be correct, complete, or accurate; and (4) are for the exclusive use of subscribers to fi360. The data source is © 2013 Morningstar, Inc. All rights
reserved. The data contained herein: (1) is proprietary to Morningstar, Inc and/or its content providers; (2) may not be copied or distributed; and (3) is not warranted to be accurate, complete or timely. Neither Morningstar,
Inc nor its content providers are responsible for any damages or losses arising from any use of this information. Past performance is no guarantee of future results.
fi360_Portrait_v4_3

Appendix: Model Tactical Peer Group BenchmarksAggressive
Div
ers
ifie
d E
merg
ing
Mkts
Eq
uit
y P
recio
us M
eta
ls
Fo
reig
n L
arg
e B
len
d
Inte
rmed
iate
-Term
Bo
nd
Larg
e B
len
d
Larg
e V
alu
e
Lo
ng
-Term
Bo
nd
Mid
-Cap
Ble
nd
Mo
ney M
ark
et
Taxab
le
Real E
sta
te
Sm
all B
len
d
Sm
all V
alu
e
Wo
rld
Bo
nd
To
tal
2003-03 10.0 5.0 10.0 15.0 0.0 25.0 5.0 10.0 0.0 5.0 10.0 0.0 5.0 100
2003-02 9.9 6.5 9.5 15.8 0.0 23.8 5.3 9.5 0.0 5.1 9.4 0.0 5.2 100
2003-01 9.8 6.3 9.8 15.4 0.0 24.2 5.2 9.6 0.0 5.1 9.5 0.0 5.2 100
2002-12 10.0 5.0 10.0 15.0 0.0 25.0 5.0 10.0 0.0 5.0 10.0 0.0 5.0 100
2002-11 9.7 4.8 10.0 15.4 0.0 24.9 5.2 9.9 0.0 4.8 10.2 0.0 5.2 100
2002-10 9.4 5.3 9.8 16.0 0.0 24.1 5.5 9.7 0.0 5.1 9.9 0.0 5.3 100
2002-09 10.0 5.0 10.0 15.0 0.0 25.0 5.0 10.0 0.0 5.0 10.0 0.0 5.0 100
2002-08 9.5 4.1 9.9 16.6 0.0 24.0 5.8 9.4 0.0 5.5 9.6 0.0 5.5 100
2002-07 9.7 4.6 10.1 15.6 0.0 24.4 5.3 9.7 0.0 5.4 10.0 0.0 5.1 100
2002-06 10.0 5.0 10.0 15.0 0.0 25.0 5.0 10.0 0.0 5.0 10.0 0.0 5.0 100
2002-05 10.1 5.7 10.3 14.5 0.0 24.0 4.8 10.3 0.0 5.2 10.2 0.0 4.8 100
2002-04 10.2 5.3 10.1 14.4 0.0 25.0 4.7 10.3 0.0 5.1 10.3 0.0 4.7 100
2002-03 10.0 5.0 10.0 15.0 0.0 25.0 5.0 10.0 0.0 5.0 10.0 0.0 5.0 100
Page 25 of 25
Fund data as of 3/31/2013
Analysis, search process, and layout are © 2000-2013, fi360, Inc. (www.fi360.com). All rights reserved. The analysis and opinions generated by fi360: (1) do not constitute professional investment advice; (2) are provided
solely for informational purposes; (3) are not warranted or represented to be correct, complete, or accurate; and (4) are for the exclusive use of subscribers to fi360. The data source is © 2013 Morningstar, Inc. All rights
reserved. The data contained herein: (1) is proprietary to Morningstar, Inc and/or its content providers; (2) may not be copied or distributed; and (3) is not warranted to be accurate, complete or timely. Neither Morningstar,
Inc nor its content providers are responsible for any damages or losses arising from any use of this information. Past performance is no guarantee of future results.
fi360_Portrait_v4_3