Embed Size (px)
Citation preview

1
Models for the assessment of seismic vulnerability of old masonry buildings. Case
study of a “placa” building.
Pedro Gil Vasques Pombo1
1M. Sc. Student, Instituto Superior Técnico, Av. Rovisco Pais, 1, 1049-001 Lisbon, Portugal;
ABSTRACT: In this document the main methods for the assessment of the seismic vulnerability of old
masonry buildings are briefly referred. Then, a “placa” building was modeled in software 3Muri/TreMuri
and nonlinear static analyses were performed aiming to assess its seismic performance. Some values
were set to materials’ mechanical properties and it was called as the reference case. For these values,
the dynamic characteristics of the building were analyzed and its seismic behavior (the capacity curve
and the damage distribution of two selected walls) were assessed. A sensibility study about the
influence of material’s mechanical properties in the seismic performance was carried out, taking into
account some changes for the properties of three types of masonry materials that belong to the
building. The influence of flexural behavior of the wooden floors in the structural seismic performance
was assessed. Finally, a comparison between capacity curves analytically derived and those
suggested by HAZUS was carried out.
KEY-WORDS: Seismic vulnerability, capacity curves, non-linear static analysis, masonry buildings
1. INTRODUCTION
To mitigate and prevent losses caused by an earthquake, seismic risk assessment should be carried
out. To assess the seismic risk of the building stock of an urban centre like the one that exists in
Lisbon, methods that allows assessing seismic vulnerability plays an essential role. In old south
european cities, the building stock is filled with many old masonry buildings. Lisbon has the so-called
“placa” building, a type of old masonry buildings which was studied in this work.
2. METHODS FOR THE SEISMIC VULNERABILITY ASSESSEMENT
Some approaches aiming to gather the methods for the assessment of seismic vulnerability into
different groups has been developed. These approaches assemble methods that share the same
characteristics. A most important criterion of distinguishing these approaches for old masonry
buildings, is whether the methods based on post-earthquake damage observation and expert
judgment or the ones based in mechanical models. In this work one of the approaches was selected; it
is the one that is divided into three groups, as shown in figure 1: empirical, analytical and hybrid.
2
Figure 1 – Different groups of methods for the seismic vulnerability assessment
Reference is made to the most important methods for the assessment of seismic vulnerability of old
masonry buildings: a capacity spectrum-based method, HAZUS (FEMA, 2013), a fully displacement-
based method, MeBaSe (Restrepo-Veléz, 2003), two collapse mechanism-based method, VULNUS
(Bernardini et al., 1990) and FaMIVE (D’Ayala and Speranza, 2002; D’Ayala, 2005) and an empirical
method proposed by Vicente (2008). From the above mentioned methods, capacity curves for
unreinforced masonry buildings (URM) suggested by HAZUS were chosen to perform a comparison
with capacity curves derived analytically using Tremuri (Lagomarsino et al., 2012), as shown in section
3.6.
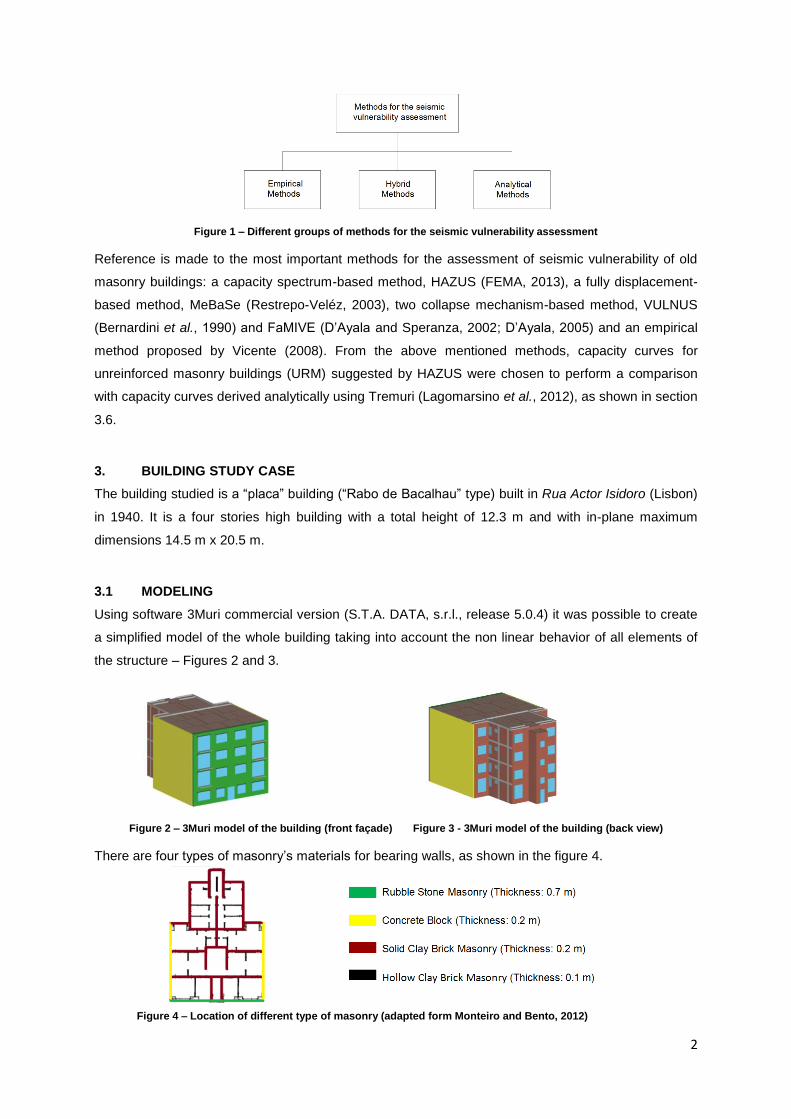
3. BUILDING STUDY CASE
The building studied is a “placa” building (“Rabo de Bacalhau” type) built in Rua Actor Isidoro (Lisbon)
in 1940. It is a four stories high building with a total height of 12.3 m and with in-plane maximum
dimensions 14.5 m x 20.5 m.
3.1 MODELING
Using software 3Muri commercial version (S.T.A. DATA, s.r.l., release 5.0.4) it was possible to create
a simplified model of the whole building taking into account the non linear behavior of all elements of
the structure – Figures 2 and 3.
Figure 2 – 3Muri model of the building (front façade) Figure 3 - 3Muri model of the building (back view)
There are four types of masonry’s materials for bearing walls, as shown in the figure 4.
Figure 4 – Location of different type of masonry (adapted form Monteiro and Bento, 2012)
3
Table 1 shows the values of the mechanical properties of the masonry materials for reference case.
These values were defined by Milosevic et al. (2014).
Table 1 – Mechanical and geometrical properties of masonry materials for the numerical model (adapted from Milosevic et al., 2014)
Mechanical and geometrical properties
Thickness (m)
Young Modulus, E
(GPa)
Shear Modulus,
(GPa)
Comp.
Strength, (MPa)
Shear Strength,
(MPa)
Specific
Weight, (kN/m
3)
Rubble Stone Masonry 0,70 2,00 0,58
(0,44) 3,2 0,065 21,0
Concrete Block Masonry 0,20 2,00 0,74
(0,56) 3,7 0,210 14,0
Solid Clay Brick Masonry
0,20 1,5
(1,13) 0,50
(0,38) 3,2 0,076 18,0
Hollow Clay Brick Masonry
0,10 1,20
(0,90) 0,40
(0,30) 2,4 0,060 12,0
Note: for parameters that have more than a value, the one which is used on the model is the one between brackets
The building has two types of floors (concrete slab and wooden floor) and there is a reinforced
concrete frame in the back. Table 2 depicts the values of loads considered in the model and Table 3
the concrete and steel classes adopted. More details of geometrical properties and modeling
techniques can be found in Pombo (2014).
3.2 DYNAMIC CHARACTERISTICS OF THE BUILDING FOR REFERENCE CASE
The building’s dynamic characteristics for the reference case were assessed (Table 4). The first mode
of vibration is the fundamental translational mode in X direction, the second mode is the torsional
mode and the third one is the fundamental translational mode in Y direction.
Table 4 – Dynamic characteristics of the building (reference case)
Mode of Vibration
1st
2nd
3rd
T (s) 0.34 0.46 0.243
f (Hz) 2.94 4.064 4.114
Mass X (%) 71.80 13.20 3.97E-05
Mass Y (%) 1.74E-05 7.64E-04 85.28
3.3 CAPACITY CURVES FOR REFERENCE CASE
Using TreMuri research version (Lagomarsino et al., 2012), non-linear analyses were carried out and
capacity curves were derived, for the reference case. Those capacity curves were shaped as bilinear
capacity curves, as shown in figure 5. The building has higher seismic resistance in Y direction rather
Reinforced Concrete
Concrete Class C16/20
Steel Class A235
Gravity loads G (Variable loads Q) (kN/m
2)
Concrete slab Wooden floor
Floors 1.3 (2.0) 3.0 (2.0)
Staircase 1.3 (4.0) 3.0 (4.5)
Roof 1.9 (0.4)
Balcony 3.0 (2.0)
Table 2 - Loads for modeling floors (adapted form Milosevic et al., 2014)
Table 3 –Concrete and steel classes

4
than in X direction. Furthermore when applied a triangular load pattern (for both directions) the
building has a higher ductility.
Figure 5 – Bilinear capacity curves (SDOF) for reference case
3.4 PARAMETRIC STUDY
A parametric study was carried out aiming to analyze the influence of the mechanical properties
values of the material in the seismic performance. Besides the reference case, six other cases were
considered by changing the values of materials’ mechanical properties for three types of masonry. It
was considered two cases for each material, an upper bound and a lower bound.
Table 5 - Acronyms that allows the identification of each case considered
Case Acronym
Rubble Stone Masonry Upper Bound
RS_UB
Rubble Stone Masonry Lower Bound
RS_LB
Concrete Block Masonry Upper Bound
CB_UB
Concrete Block Masonry Lower Bound
CB_LB
Solid Clay Brick Masonry Upper Bound SCB_UB
Solid Clay Brick Masonry Lower Bound SCB_LB
Each case uses exactly the same values set for the reference case (table 1) for every masonry
materials except for the material in case. For those, the values set are depicted in table 6, 7 and 8.
The values for both upper and lower bound are the maximum and minimum values suggested in
Italian Code (NTC, 2008) respectively, for each material.
For example, for RS_UB case the values for materials’ mechanical properties are the same as those
set in the reference case except the values for rubble stone masonry, which uses the values set in the
left side of table 6.
Table 6 – Values for both upper and lower bound case for rubble stone masonry
RS_UB Case RS_LB Case
Material Young
Modulus, E (MPa)
Shear Modulus, G (MPa)
Comp. Strength, fm (N/cm
2)
Shear Strength,
τ0 (N/cm2)
Young Modulus, E (MPa)
Shear Modulus, G (MPa)
Comp. Strength, fm (N/cm
2)
Shear Strength,
τ0 (N/cm2)
Rubble Stone Masonry
1980 660 380 7,4 1500 500 260 5,6

5
Table 7 – Values for both upper and lower bound case for concrete block
CB_UB Case CB_LB Case
Material Young
Modulus, E (MPa)
Shear Modulus, G (MPa)
Comp. Strength, fm (N/cm
2)
Shear Strength,
τ0 (N/cm2)
Young Modulus, E (MPa)
Shear Modulus, G (MPa)
Comp. Strength, fm (N/cm
2)
Shear Strength,
τ0 (N/cm2)
Concrete Block Masonry
3520 880 440 24,0 2400 600 300 18,0
Table 8 – Values for both upper and lower bound case for concrete block
SCB_UB Case SCB_LB Case
Material Young
Modulus, E (MPa)
Shear Modulus, G (MPa)
Comp. Strength, fm (N/cm
2)
Shear Strength,
τ0 (N/cm2)
Young Modulus, E (MPa)
Shear Modulus, G (MPa)
Comp. Strength, fm (N/cm
2)
Shear Strength,
τ0 (N/cm2)
Solid Clay Brick Masonry
1800 600 400 9,2 1200 400 240 6,0
3.4.1 CAPACITY CURVES AND SEISMIC PERFORMANCE
Bilinear capacity curves were derived to each case and the seismic performance were assessed.
Figure 6 – Bilinear capacity curves (SDOF) for each cases for uniform load pattern X direction
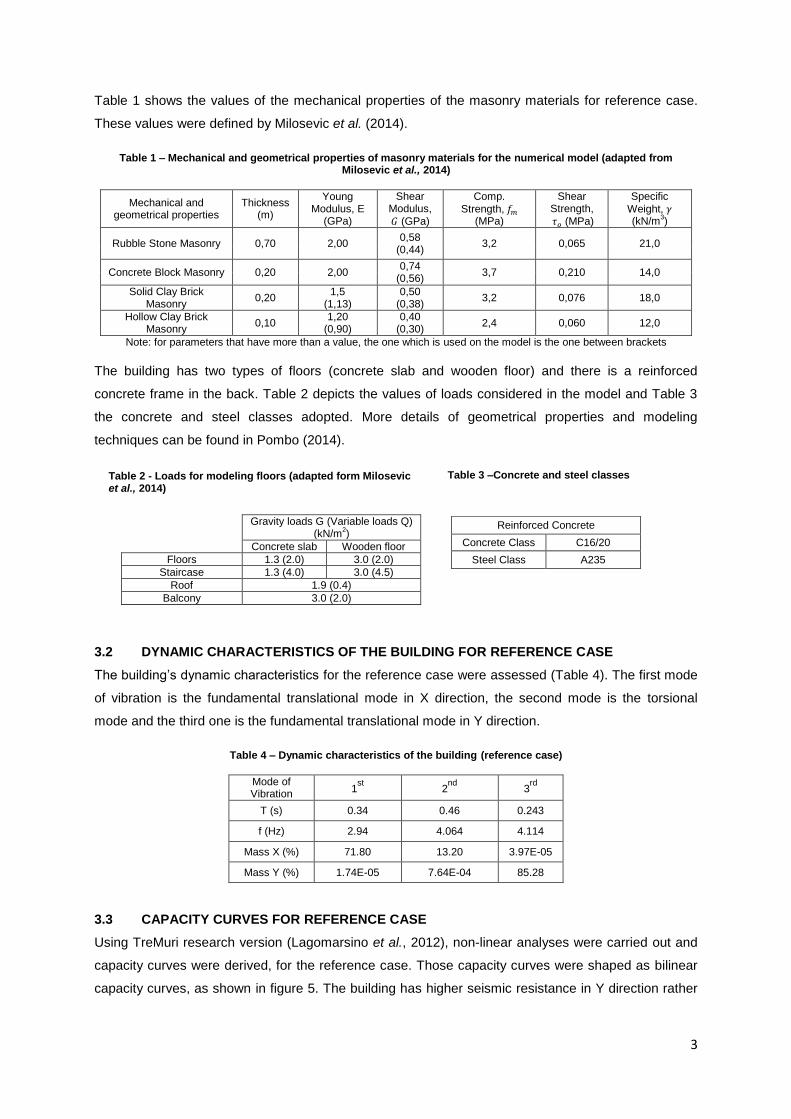
In table 9, 10, 11 and 12 the highest variation of capacity curves’ parameters between each case and
the reference case are presented.
Table 9 – Highest variation for capacity curve properties between reference and the other cases (Uniform load pattern X direction)
T* (s) µ* Fy* (kN) De* (m) Du* (m) Seism Type 1
Seism Type 2
Value for Reference Case
0.40 2.15 1369.31 0.0091 0.0196 0.0297 0.0157
Case which varies the most
SCB_UB SCB_UB RS_UB SCB_UB CB_UB SCB_UB SCB_UB
Value 0.36 2.57 1423.98 0.0076 0.0186 0.0257 0.0141
Variation (%) 10.0 19.6 4.0 17.0 4.8 13.1 9.9
6
Table 10 – Highest variation for capacity curve properties between reference and the other cases (Uniform load pattern Y direction)
T* (s) µ* Fy* (kN) De* (m) Du* (m) Seism Type 1
Seism Type 2
Value for Reference Case
0,26 2,05 2778,37 0,0075 0,0153 0,0127 0,0103
Case which varies the most
SCB_UB CB_UB SCB_LB SCB_UB CB_UB SCB_UB SCB_UB
Value 0.23 2.87 2651.60 0.0058 0.0182 0.0100 0.0084
Variation (%) 13.2 40.4 4.6 22.6 18.5 21.8 18.7
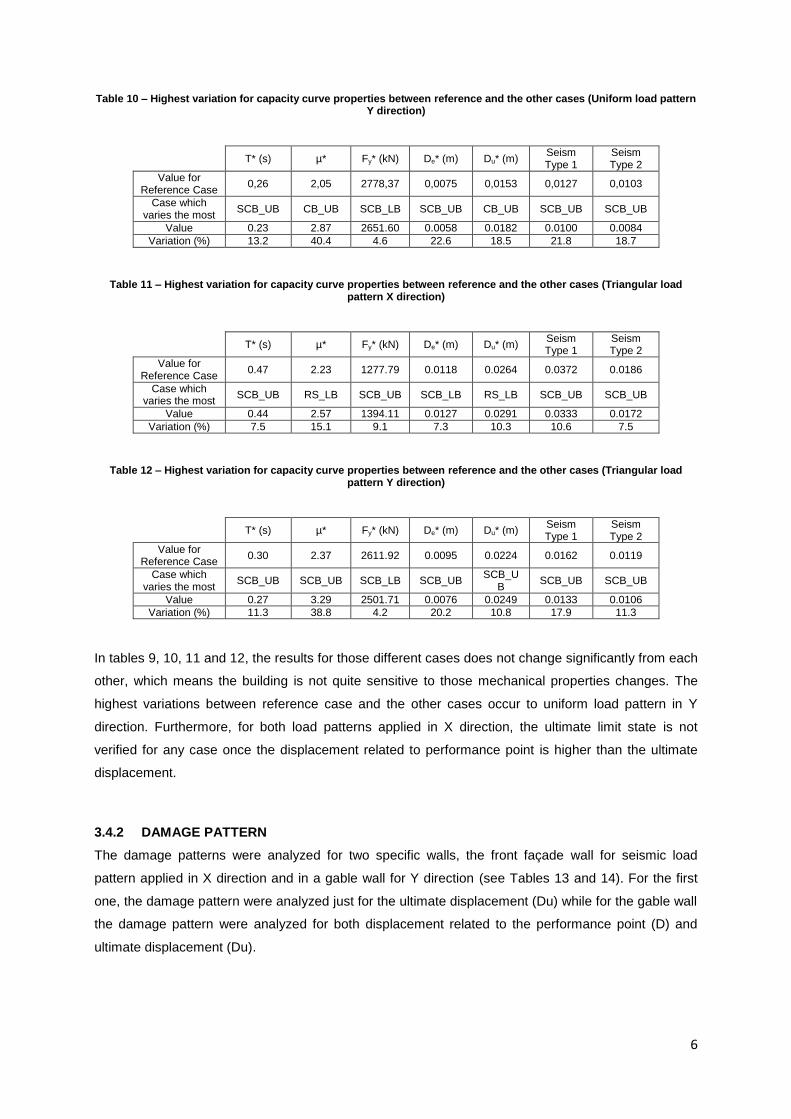
Table 11 – Highest variation for capacity curve properties between reference and the other cases (Triangular load pattern X direction)
T* (s) µ* Fy* (kN) De* (m) Du* (m) Seism Type 1
Seism Type 2
Value for Reference Case
0.47 2.23 1277.79 0.0118 0.0264 0.0372 0.0186
Case which varies the most
SCB_UB RS_LB SCB_UB SCB_LB RS_LB SCB_UB SCB_UB
Value 0.44 2.57 1394.11 0.0127 0.0291 0.0333 0.0172
Variation (%) 7.5 15.1 9.1 7.3 10.3 10.6 7.5
Table 12 – Highest variation for capacity curve properties between reference and the other cases (Triangular load pattern Y direction)
T* (s) µ* Fy* (kN) De* (m) Du* (m) Seism Type 1
Seism Type 2
Value for Reference Case
0.30 2.37 2611.92 0.0095 0.0224 0.0162 0.0119
Case which varies the most
SCB_UB SCB_UB SCB_LB SCB_UB SCB_U
B SCB_UB SCB_UB
Value 0.27 3.29 2501.71 0.0076 0.0249 0.0133 0.0106
Variation (%) 11.3 38.8 4.2 20.2 10.8 17.9 11.3
In tables 9, 10, 11 and 12, the results for those different cases does not change significantly from each
other, which means the building is not quite sensitive to those mechanical properties changes. The
highest variations between reference case and the other cases occur to uniform load pattern in Y
direction. Furthermore, for both load patterns applied in X direction, the ultimate limit state is not
verified for any case once the displacement related to performance point is higher than the ultimate
displacement.
3.4.2 DAMAGE PATTERN
The damage patterns were analyzed for two specific walls, the front façade wall for seismic load
pattern applied in X direction and in a gable wall for Y direction (see Tables 13 and 14). For the first
one, the damage pattern were analyzed just for the ultimate displacement (Du) while for the gable wall
the damage pattern were analyzed for both displacement related to the performance point (D) and
ultimate displacement (Du).
7
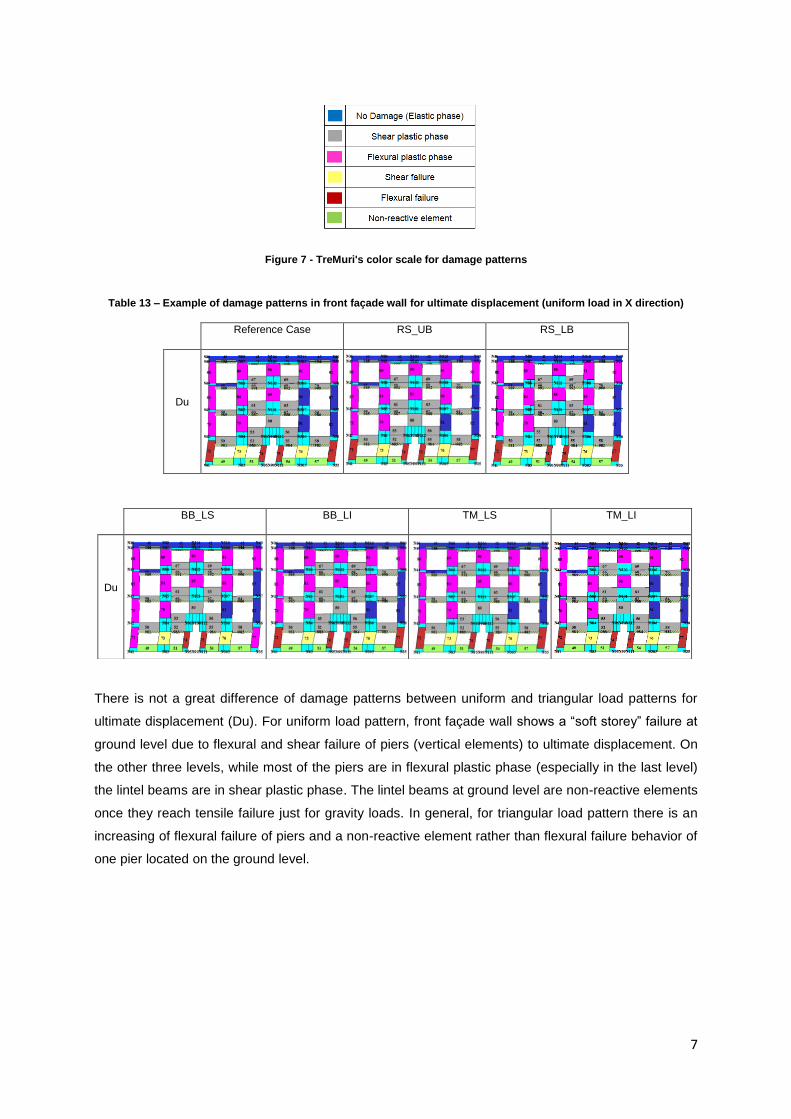
Figure 7 - TreMuri's color scale for damage patterns
Table 13 – Example of damage patterns in front façade wall for ultimate displacement (uniform load in X direction)
Reference Case RS_UB RS_LB
Du
There is not a great difference of damage patterns between uniform and triangular load patterns for
ultimate displacement (Du). For uniform load pattern, front façade wall shows a “soft storey” failure at
ground level due to flexural and shear failure of piers (vertical elements) to ultimate displacement. On
the other three levels, while most of the piers are in flexural plastic phase (especially in the last level)
the lintel beams are in shear plastic phase. The lintel beams at ground level are non-reactive elements
once they reach tensile failure just for gravity loads. In general, for triangular load pattern there is an
increasing of flexural failure of piers and a non-reactive element rather than flexural failure behavior of
one pier located on the ground level.
BB_LS BB_LI TM_LS TM_LI
Du
8
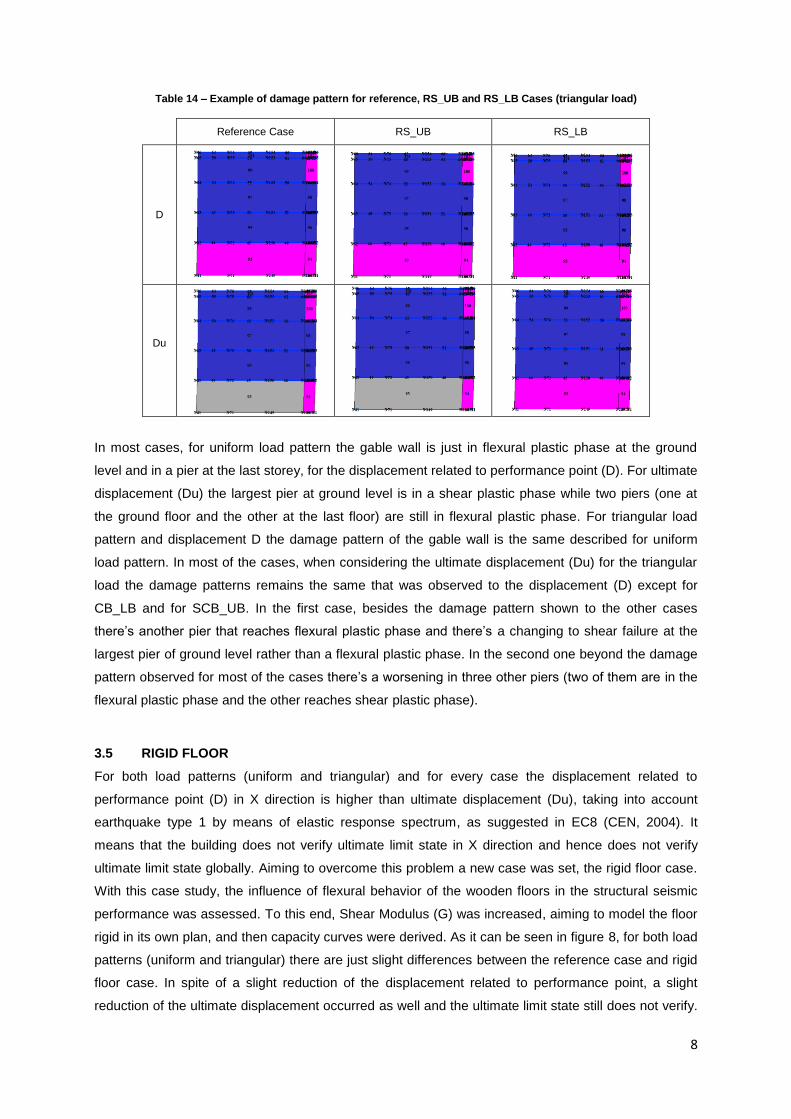
Table 14 – Example of damage pattern for reference, RS_UB and RS_LB Cases (triangular load)
Reference Case RS_UB RS_LB
D
Du
In most cases, for uniform load pattern the gable wall is just in flexural plastic phase at the ground
level and in a pier at the last storey, for the displacement related to performance point (D). For ultimate
displacement (Du) the largest pier at ground level is in a shear plastic phase while two piers (one at
the ground floor and the other at the last floor) are still in flexural plastic phase. For triangular load
pattern and displacement D the damage pattern of the gable wall is the same described for uniform
load pattern. In most of the cases, when considering the ultimate displacement (Du) for the triangular
load the damage patterns remains the same that was observed to the displacement (D) except for
CB_LB and for SCB_UB. In the first case, besides the damage pattern shown to the other cases
there’s another pier that reaches flexural plastic phase and there’s a changing to shear failure at the
largest pier of ground level rather than a flexural plastic phase. In the second one beyond the damage
pattern observed for most of the cases there’s a worsening in three other piers (two of them are in the
flexural plastic phase and the other reaches shear plastic phase).
3.5 RIGID FLOOR
For both load patterns (uniform and triangular) and for every case the displacement related to
performance point (D) in X direction is higher than ultimate displacement (Du), taking into account
earthquake type 1 by means of elastic response spectrum, as suggested in EC8 (CEN, 2004). It
means that the building does not verify ultimate limit state in X direction and hence does not verify
ultimate limit state globally. Aiming to overcome this problem a new case was set, the rigid floor case.
With this case study, the influence of flexural behavior of the wooden floors in the structural seismic
performance was assessed. To this end, Shear Modulus (G) was increased, aiming to model the floor
rigid in its own plan, and then capacity curves were derived. As it can be seen in figure 8, for both load
patterns (uniform and triangular) there are just slight differences between the reference case and rigid
floor case. In spite of a slight reduction of the displacement related to performance point, a slight
reduction of the ultimate displacement occurred as well and the ultimate limit state still does not verify.

9
In fact, the results obtained to this new case show that this building is not very sensitive to the floor
behavior.
Figure 8 – Capacity curves (MDOF) for both Reference and Rigid floor cases in X direction
3.6 COMPARISON OF CAPACITY CURVES
Finally, a comparison between capacity curves analytically derived and those suggested by HAZUS
was carried out. As shown in figures 9, 10, 11 and 12, capacity curves suggested by HAZUS for
URMM fit better to the X direction (both uniform and triangular load) analytical derived capacity curves.
On the other hand, capacity curves suggested by HAZUS for URML are more appropriate to the Y
direction (both uniform and triangular load) analytical derived capacity curves. Also, this comparison
shows that Hazus methodology considers that Unreinforced Masonry Buildings has much more
ductility than analytically derived curves reveals to have for this type of old masonry building.
Figure 9 – Bilinear capacity curves X direction uniform load (SDOF)
Figure 10 – Bilinear capacity curves Y direction uniform load (SDOF)
Figure 11 – Bilinear capacity curves X direction triangular load (SDOF)
Figure 12 – Bilinear capacity curves Y direction triangular load (SDOF)

10
4. CONCLUSIONS
The non-linear analyses performed show the building does not verify the ultimate state limit for
earthquake type 1 (as suggested by EC8) in X direction for any case study (neither for the first seven
cases nor for rigid floor case) and for both load pattern. It means the building is globally unsafe for
ultimate state limit.
The building shows neither much sensitive to the changing of the values of materials’ mechanical
properties nor for the case of rigid floor in place of wooden floor.
HAZUS method considers that URM buildings have much more ductility than the analytically derived
curves reveals to have. The capacity curves for the studied building analytically derived in X and Y
direction fit better to URMM and URML capacity curves suggested by HAZUS, respectively.
5. REFERENCES
Bernardini, A., Gori, R. and Modena, C. (1990). “An Application of Coupled Analytical Models and
Experiential Knowledge for Seismic Vulnerability Analyses of Masonry Buildings”, in: Engineering
Aspects of Earthquake Phenomena (ed. A. Koridze), Omega Scientific, Vol. 3, pp. 161-180, Oxon,
U.K.
CEN (2004). “Eurocode 8: Design of structures for earthquake resistance - Part 1: General rules,
seismic actions and rules for buildings”, European Committee for Standartization, Bruxels, Belgium.
D'Ayala, D. (2005). "Force and Displacement Based Vulnerability Assessment for Traditional
Buildings". Bulletin of Earthquake Engineering. Vol. 3, No. 3, pp. 235-265.
D'Ayala, D. e Speranza, E. (2002). "An integrated procedure for the assessment of seismic
vulnerability of historic buildings". em: 12th European Conference on Earthquake Engineering, paper
No. 561.
FEMA (2013). “HAZUS-MH 2.1 Technical Manual”, Federal Emergency Management Agency,
Washington, DC, U.S.A.
Lagomarsino, S., Penna, A., Galasco, A. e Cattari, S. (2012). TREMURI program: Seismic Analyses of
3D Masonry Buildings, Release 2.0. University of Genova, Italy.
Milosevic, J., Bento, R. e Cattari, S. (2014). “Seismic assessmnet of a “Placa” building in Lisbon”,
Second European Conference of Earthquake engineering and seismology, Istambul, Turkey.
Monteiro, M. and Bento, R. (2012). “Seismic Assessment of a ’Placa Building”, ICIST Report, DTC nº
20/2012.
NTC (Norme Tecniche per le Costruzioni) (2008). “Italian Technical Code. Decreto Ministeriale
14/1/2008 Official Bulletin No. 29 of February 2008”, (in Italian).
11
Pombo, P. G. V. (2014). “Modelos para a avaliação de vulnerabilidade sísmica de edifícios antigos de
Alvenaria. Aplicação de um modelo a um edifício de “placa”.”, MSc. Dissertation, Instituto Superior
Técnico, University of Lisbon, Lisbon (in Portuguese).
Restrepo-Veléz, L.F. (2003). “A simplified Mechanics-Based Procedure for the Seismic Risk
Assessment of Unreinforced Masonry Buildings”, PhD Thesis, European School for Advanced Studies
in Reduction of Seismic Risk (Rose School), Pavia, Italy.
S.T.A. DATA (2012). 3Muri Program, Release 5.0.4 (www.3muri.com).
Vicente, R. (2008). “Estratégias e Metodologias para intervenções de reabilitação urbana – Avaliação
da vulnerabilidade e do risco sísmico do edificado da Baixa de Coimbra”, PhD Thesis, Universidade
de Aveiro, Portugal (in Portuguese).