Embed Size (px)
Citation preview
Paper 86
2019 Pacific Conference on Earthquake Engineering and Annual NZSEE Conference 1
Development of seismic vulnerability curves of key building types in the Philippines
E.A.J. Tingatinga, B.M. Pacheco, J.Y. Hernandez Jr., M.C. Pascua, L.R.E.
Tan, R.M. Suiza, W.L. Mata, R.E.U. Longalong, U.P. Ignacio Jr., & F.J.
Germar Institute of Civil Engineering, University of the Philippines Diliman, Quezon City, Philippines.
ABSTRACT
In this paper, vulnerability curves of key building types in the Philippines are developed and
presented. Vulnerability curves, expressed as damage ratio versus Modified Mercalli Intensity
(MMI) scale, for each building type are derived using computational, empirical, and/or heuristic
methods. In the computational method, nonlinear static pushover of each building model was
carried out and the capacity spectrum method was used to compute the fragility curves and then the
vulnerability curves are derived from assumed damage ratios. Empirical vulnerability curves are
derived using available data on damage to buildings compiled from field surveys and reports after
past earthquakes. Heuristic vulnerability curves are derived by processing opinion of structural
engineers in the Philippines on the possible damage to buildings when subjected to different
earthquake intensities. For most building types made from reinforced concrete and steel,
computational curves are recommended while for building types made of wood, masonry, and/or
light materials, empirical or heuristic curves are recommended. The set of vulnerability curves
proposed represents a coherent set of damage functions across structural types, construction
material, number of floors, and age of construction.
1 INTRODUCTION
The Philippines, because of its geographic location, is very prone to earthquakes and to reduce and manage
risk of future earthquakes, vulnerability functions or curves associated with the existing buildings are needed.
Vulnerability curves depend on a number of parameters such as geometry, structural type, number of stories,
construction material, quality of construction, etc. Since there are as many types and configurations as there
Paper 86 – Development of seismic vulnerability curves of key building types in the Philippines
2019 Pacific Conference on Earthquake Engineering and Annual NZSEE Conference 2
are number of actual buildings, comprehensive risk assessment can only be performed by grouping buildings
into standard types to reduce the number of calculations in estimating losses.
Recent developments on building classification for earthquake loss estimation in the Philippines were
initiated by the Philippine Institute of Volcanology and Seismology (PHIVOLCS) to enhance the capability
of their software called Rapid Earthquake Damage Assessment System or REDAS (Pacheco et.al. 2011). In
order to produce seismic hazard maps and loss estimate maps after a potentially damaging earthquake,
REDAS needs vulnerability curves of buildings in the study area. The building stock must therefore be
created using different methods and then grouped using an adopted building classification system.
The vulnerability curves of key building types may be derived using four approaches: computational,
empirical, heuristic, and hybrid approach. Computational approach utilizes simulations of the response of a
population of buildings subjected to demand earthquakes. The empirical approach relies on available post-
earthquake data and the heuristic approach relies on experts’ opinion on the structural response. Any
combination of the aforementioned approaches is referred to as hybrid (Pacheco et.al. 2011).
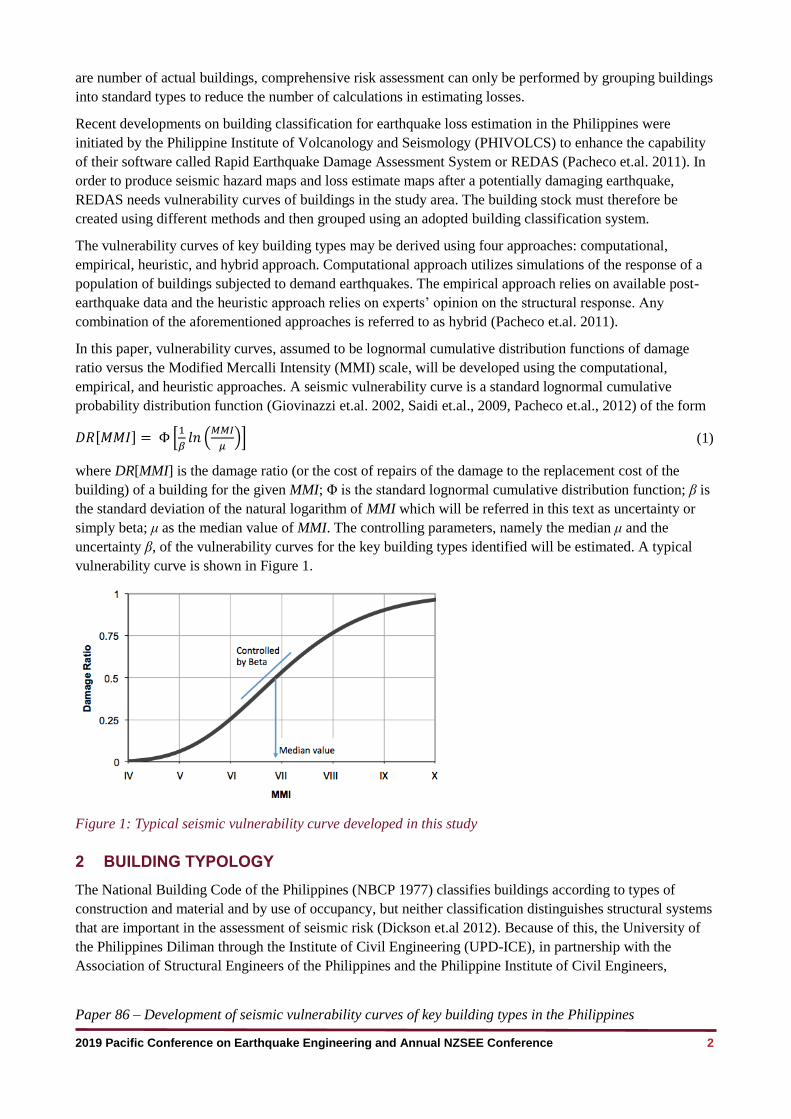
In this paper, vulnerability curves, assumed to be lognormal cumulative distribution functions of damage
ratio versus the Modified Mercalli Intensity (MMI) scale, will be developed using the computational,
empirical, and heuristic approaches. A seismic vulnerability curve is a standard lognormal cumulative
probability distribution function (Giovinazzi et.al. 2002, Saidi et.al., 2009, Pacheco et.al., 2012) of the form
𝐷𝑅[𝑀𝑀𝐼] = Φ [1
𝛽𝑙𝑛 (
𝑀𝑀𝐼
𝜇)] (1)
where DR[MMI] is the damage ratio (or the cost of repairs of the damage to the replacement cost of the
building) of a building for the given MMI; Φ is the standard lognormal cumulative distribution function; β is
the standard deviation of the natural logarithm of MMI which will be referred in this text as uncertainty or
simply beta; μ as the median value of MMI. The controlling parameters, namely the median μ and the
uncertainty β, of the vulnerability curves for the key building types identified will be estimated. A typical
vulnerability curve is shown in Figure 1.
Figure 1: Typical seismic vulnerability curve developed in this study
2 BUILDING TYPOLOGY
The National Building Code of the Philippines (NBCP 1977) classifies buildings according to types of
construction and material and by use of occupancy, but neither classification distinguishes structural systems
that are important in the assessment of seismic risk (Dickson et.al 2012). Because of this, the University of
the Philippines Diliman through the Institute of Civil Engineering (UPD-ICE), in partnership with the
Association of Structural Engineers of the Philippines and the Philippine Institute of Civil Engineers,
Paper 86 – Development of seismic vulnerability curves of key building types in the Philippines
2019 Pacific Conference on Earthquake Engineering and Annual NZSEE Conference 3
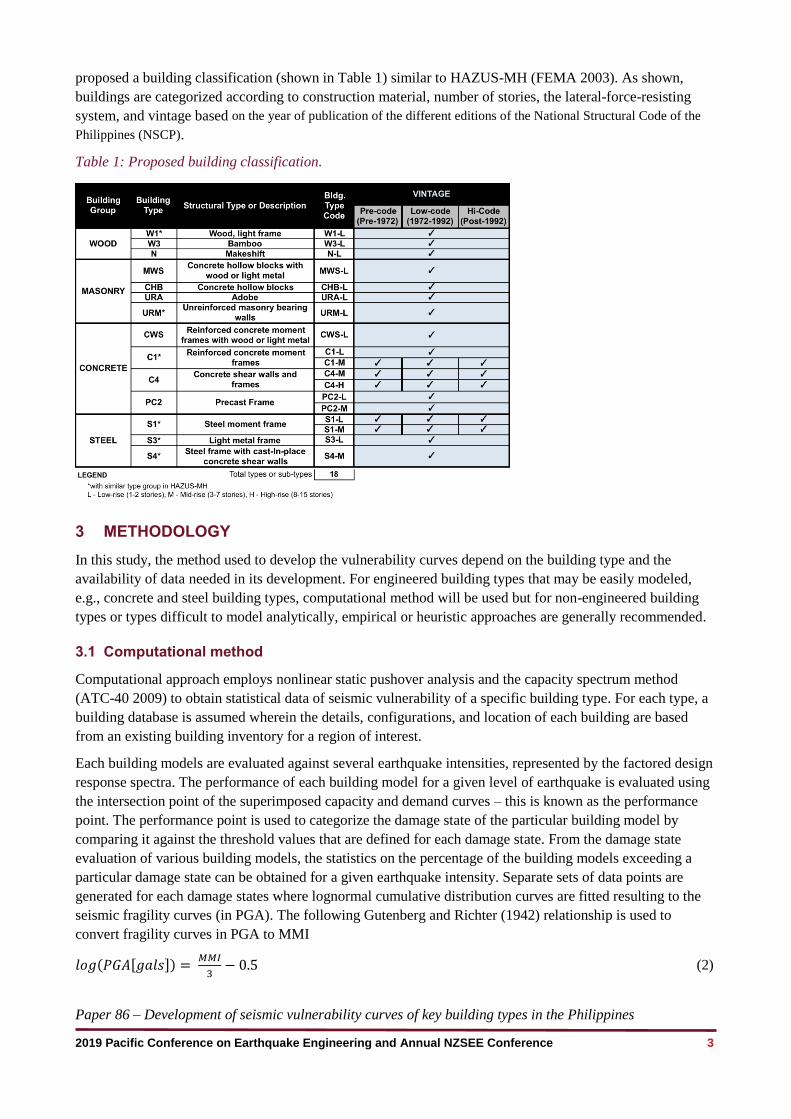
proposed a building classification (shown in Table 1) similar to HAZUS-MH (FEMA 2003). As shown,
buildings are categorized according to construction material, number of stories, the lateral-force-resisting
system, and vintage based on the year of publication of the different editions of the National Structural Code of the
Philippines (NSCP).
Table 1: Proposed building classification.
3 METHODOLOGY
In this study, the method used to develop the vulnerability curves depend on the building type and the
availability of data needed in its development. For engineered building types that may be easily modeled,
e.g., concrete and steel building types, computational method will be used but for non-engineered building
types or types difficult to model analytically, empirical or heuristic approaches are generally recommended.
3.1 Computational method
Computational approach employs nonlinear static pushover analysis and the capacity spectrum method
(ATC-40 2009) to obtain statistical data of seismic vulnerability of a specific building type. For each type, a
building database is assumed wherein the details, configurations, and location of each building are based
from an existing building inventory for a region of interest.
Each building models are evaluated against several earthquake intensities, represented by the factored design
response spectra. The performance of each building model for a given level of earthquake is evaluated using
the intersection point of the superimposed capacity and demand curves – this is known as the performance
point. The performance point is used to categorize the damage state of the particular building model by
comparing it against the threshold values that are defined for each damage state. From the damage state
evaluation of various building models, the statistics on the percentage of the building models exceeding a
particular damage state can be obtained for a given earthquake intensity. Separate sets of data points are
generated for each damage states where lognormal cumulative distribution curves are fitted resulting to the
seismic fragility curves (in PGA). The following Gutenberg and Richter (1942) relationship is used to
convert fragility curves in PGA to MMI
𝑙𝑜𝑔(𝑃𝐺𝐴[𝑔𝑎𝑙𝑠]) = 𝑀𝑀𝐼
3− 0.5 (2)
Paper 86 – Development of seismic vulnerability curves of key building types in the Philippines
2019 Pacific Conference on Earthquake Engineering and Annual NZSEE Conference 4
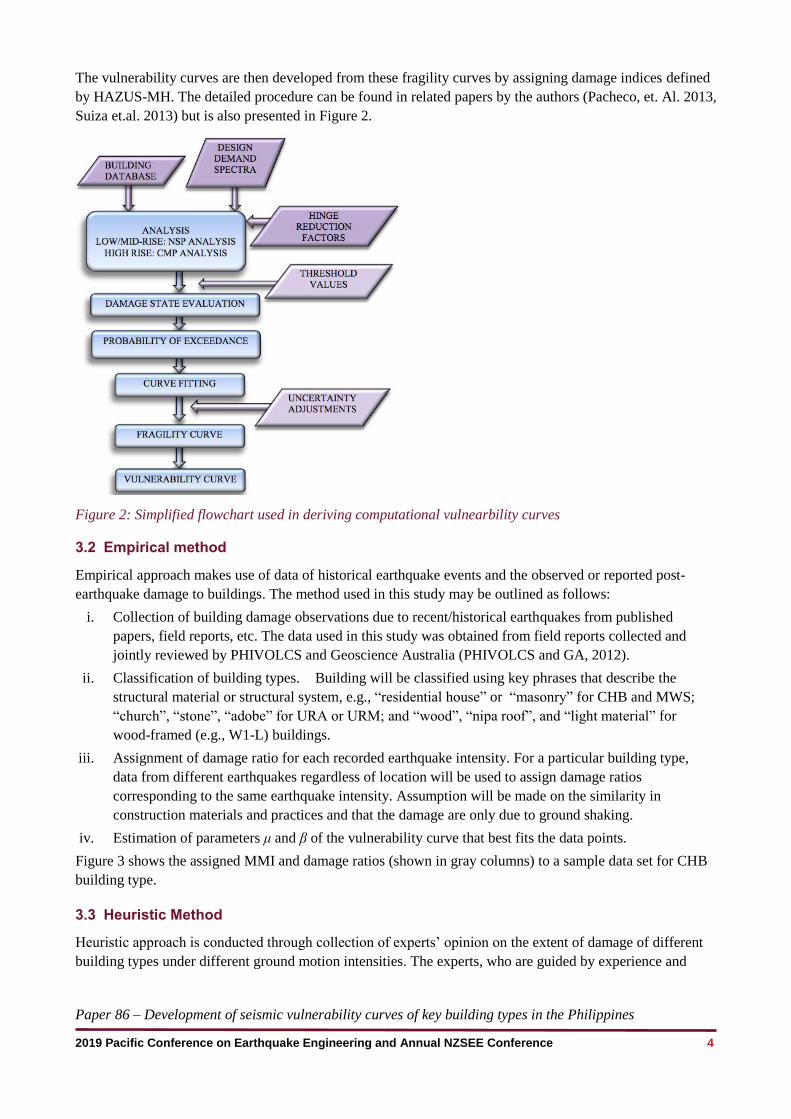
The vulnerability curves are then developed from these fragility curves by assigning damage indices defined
by HAZUS-MH. The detailed procedure can be found in related papers by the authors (Pacheco, et. Al. 2013,
Suiza et.al. 2013) but is also presented in Figure 2.
Figure 2: Simplified flowchart used in deriving computational vulnearbility curves
3.2 Empirical method
Empirical approach makes use of data of historical earthquake events and the observed or reported post-
earthquake damage to buildings. The method used in this study may be outlined as follows:
i. Collection of building damage observations due to recent/historical earthquakes from published
papers, field reports, etc. The data used in this study was obtained from field reports collected and
jointly reviewed by PHIVOLCS and Geoscience Australia (PHIVOLCS and GA, 2012).
ii. Classification of building types. Building will be classified using key phrases that describe the
structural material or structural system, e.g., “residential house” or “masonry” for CHB and MWS;
“church”, “stone”, “adobe” for URA or URM; and “wood”, “nipa roof”, and “light material” for
wood-framed (e.g., W1-L) buildings.
iii. Assignment of damage ratio for each recorded earthquake intensity. For a particular building type,
data from different earthquakes regardless of location will be used to assign damage ratios
corresponding to the same earthquake intensity. Assumption will be made on the similarity in
construction materials and practices and that the damage are only due to ground shaking.
iv. Estimation of parameters μ and β of the vulnerability curve that best fits the data points.
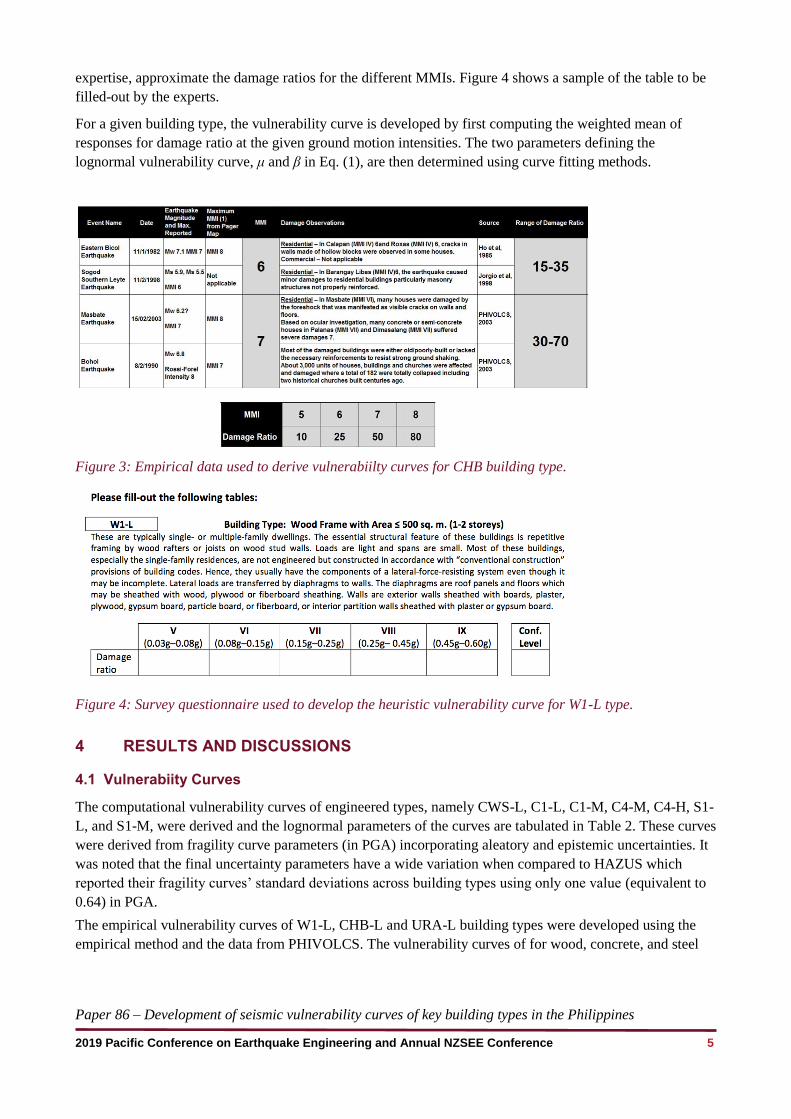
Figure 3 shows the assigned MMI and damage ratios (shown in gray columns) to a sample data set for CHB
building type.
3.3 Heuristic Method
Heuristic approach is conducted through collection of experts’ opinion on the extent of damage of different
building types under different ground motion intensities. The experts, who are guided by experience and
Paper 86 – Development of seismic vulnerability curves of key building types in the Philippines
2019 Pacific Conference on Earthquake Engineering and Annual NZSEE Conference 5
expertise, approximate the damage ratios for the different MMIs. Figure 4 shows a sample of the table to be
filled-out by the experts.
For a given building type, the vulnerability curve is developed by first computing the weighted mean of
responses for damage ratio at the given ground motion intensities. The two parameters defining the
lognormal vulnerability curve, μ and β in Eq. (1), are then determined using curve fitting methods.
Figure 3: Empirical data used to derive vulnerabiilty curves for CHB building type.
Figure 4: Survey questionnaire used to develop the heuristic vulnerability curve for W1-L type.
4 RESULTS AND DISCUSSIONS
4.1 Vulnerabiity Curves
The computational vulnerability curves of engineered types, namely CWS-L, C1-L, C1-M, C4-M, C4-H, S1-
L, and S1-M, were derived and the lognormal parameters of the curves are tabulated in Table 2. These curves
were derived from fragility curve parameters (in PGA) incorporating aleatory and epistemic uncertainties. It
was noted that the final uncertainty parameters have a wide variation when compared to HAZUS which
reported their fragility curves’ standard deviations across building types using only one value (equivalent to
0.64) in PGA.
The empirical vulnerability curves of W1-L, CHB-L and URA-L building types were developed using the
empirical method and the data from PHIVOLCS. The vulnerability curves of for wood, concrete, and steel
Paper 86 – Development of seismic vulnerability curves of key building types in the Philippines
2019 Pacific Conference on Earthquake Engineering and Annual NZSEE Conference 6
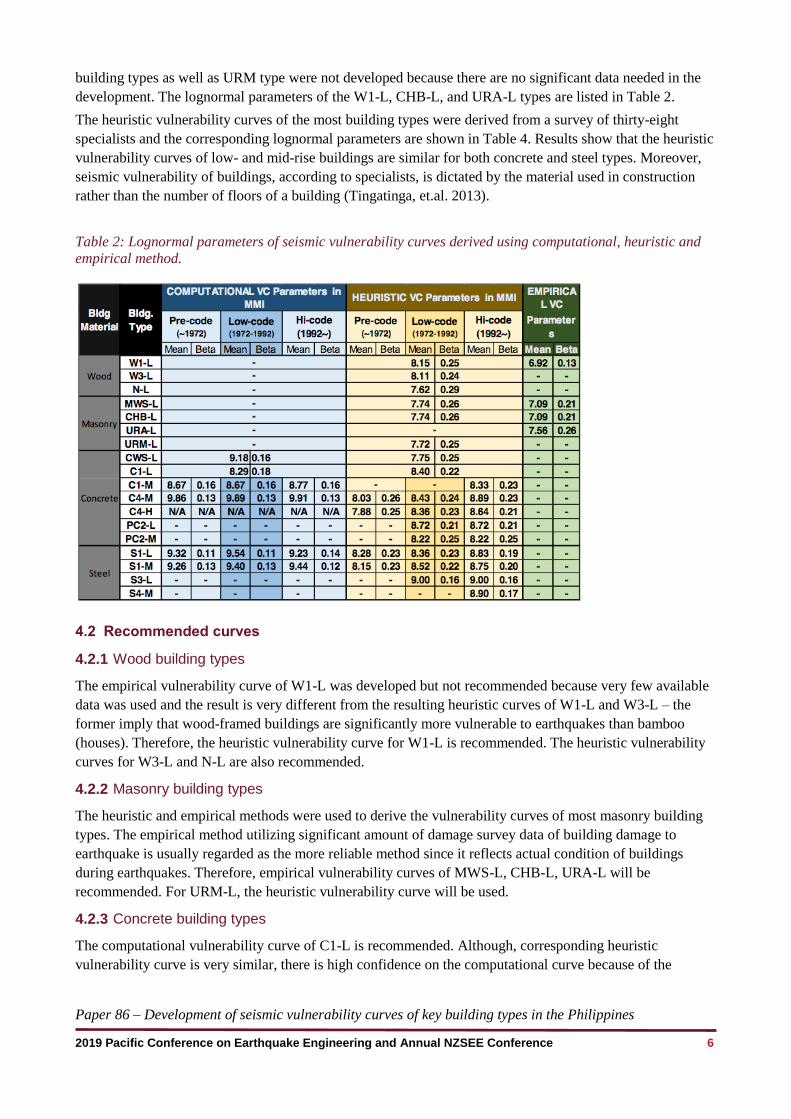
building types as well as URM type were not developed because there are no significant data needed in the
development. The lognormal parameters of the W1-L, CHB-L, and URA-L types are listed in Table 2.
The heuristic vulnerability curves of the most building types were derived from a survey of thirty-eight
specialists and the corresponding lognormal parameters are shown in Table 4. Results show that the heuristic
vulnerability curves of low- and mid-rise buildings are similar for both concrete and steel types. Moreover,
seismic vulnerability of buildings, according to specialists, is dictated by the material used in construction
rather than the number of floors of a building (Tingatinga, et.al. 2013).
Table 2: Lognormal parameters of seismic vulnerability curves derived using computational, heuristic and
empirical method.
4.2 Recommended curves
4.2.1 Wood building types
The empirical vulnerability curve of W1-L was developed but not recommended because very few available
data was used and the result is very different from the resulting heuristic curves of W1-L and W3-L – the
former imply that wood-framed buildings are significantly more vulnerable to earthquakes than bamboo
(houses). Therefore, the heuristic vulnerability curve for W1-L is recommended. The heuristic vulnerability
curves for W3-L and N-L are also recommended.
4.2.2 Masonry building types
The heuristic and empirical methods were used to derive the vulnerability curves of most masonry building
types. The empirical method utilizing significant amount of damage survey data of building damage to
earthquake is usually regarded as the more reliable method since it reflects actual condition of buildings
during earthquakes. Therefore, empirical vulnerability curves of MWS-L, CHB-L, URA-L will be
recommended. For URM-L, the heuristic vulnerability curve will be used.
4.2.3 Concrete building types
The computational vulnerability curve of C1-L is recommended. Although, corresponding heuristic
vulnerability curve is very similar, there is high confidence on the computational curve because of the
Paper 86 – Development of seismic vulnerability curves of key building types in the Philippines
2019 Pacific Conference on Earthquake Engineering and Annual NZSEE Conference 7
significant variations (total of 62) of building models used in the computation. The computational
vulnerability curve of CWS-L is also recommended since CWS-L is expected to be more resilient (due to
lighter materials used in the second floor) to earthquakes when compared with C1-L. The heuristic curve
implies a building as vulnerable as CHB-L or URM-L and even to a makeshift structure. For C1-M, the
(low-code) computational vulnerability curve is also recommended. Although, computations resulted to very
similar parameters, the low-code lognormal parameters will be used and recommended. The corresponding
heuristic vulnerability curve implies that C1-M buildings are as vulnerable as C1-L buildings, a trend that is
not expected since medium-rise buildings, i.e., 3-7 stories, require stricter design requirements. For C4-M
and C4-H, the heuristic vulnerability curves are recommended. The lognormal parameters of C4-M across
different vintages are more consistent and are more reasonable when compared with C1-M, a building type
with the same height. For PC2-L and PC2-M, the heuristic curves are recommended.
4.2.4 Steel building types
The computational vulnerability curves for S1-L suggest trends that are not expected of the three vintages of
this building type. Therefore, the heuristic vulnerability curves of S1-L are recommended. For S1-M, the
computational vulnerability curves are recommended instead of the heuristic curve because it is consistent
across vintages and with the result of S1-L. For S3-L and S4-M, heuristic curves were developed and
recommended.
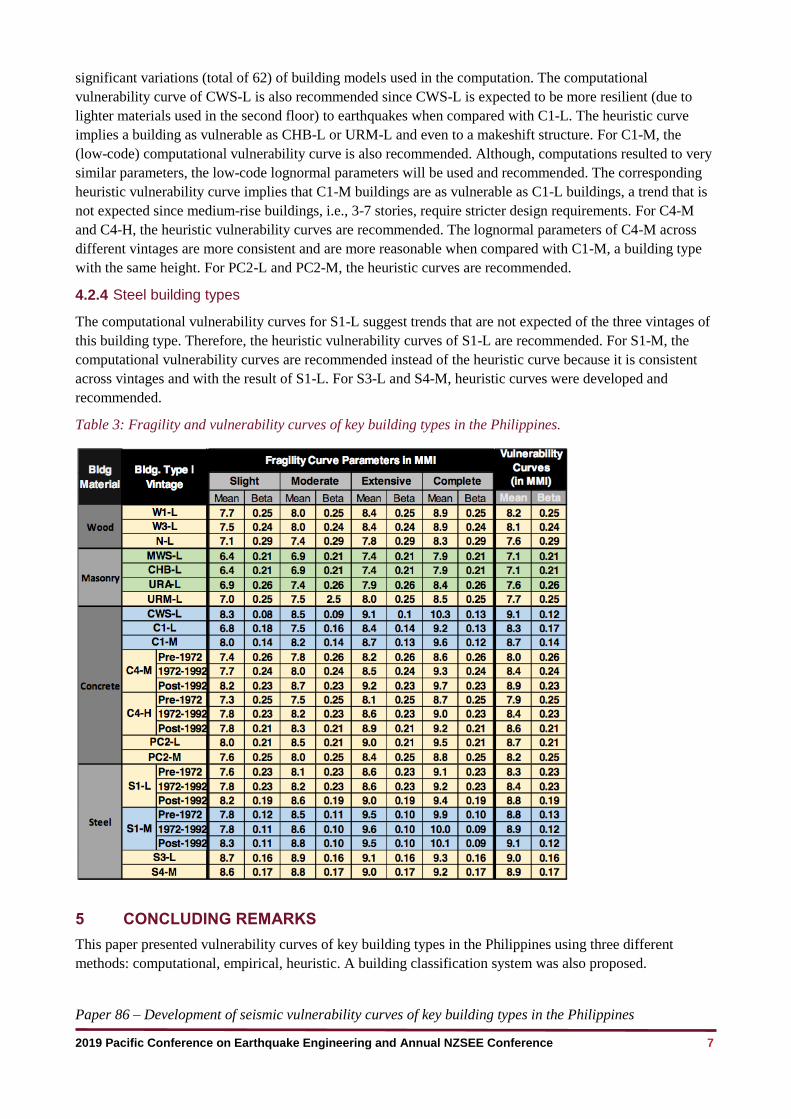
Table 3: Fragility and vulnerability curves of key building types in the Philippines.
5 CONCLUDING REMARKS
This paper presented vulnerability curves of key building types in the Philippines using three different
methods: computational, empirical, heuristic. A building classification system was also proposed.
Paper 86 – Development of seismic vulnerability curves of key building types in the Philippines
2019 Pacific Conference on Earthquake Engineering and Annual NZSEE Conference 8
The computational vulnerability curves were derived using nonlinear static pushover analysis and the
capacity spectrum for concrete and steel building types. The method allowed distinction between different
levels of damage on buildings thus allowing also the development of fragility curves. The empirical and
heuristic approaches, proposed in this study, develop the vulnerability curves of the key building types from
the available damage reports and survey of specialists, respectively.
The set of vulnerability curves proposed and listed in Table 3 represents a coherent set of damage functions
across structural types, construction material, number of floors, and age of construction. The corresponding
lognormal parameters of the fragility curves were also computed and reported. These curves are the first
generation of building vulnerability functions developed for the Philippines by the Filipino engineers. We
recognize that these functions require an iterative approach so that the functions derived using any of the
three methods are similar or cross-validate one another. The computational method may be improved by
better analytical modeling and results that are validated with experiments. The empirical vulnerability curves
should be updated when additional data or a better set of damage report (e.g., report that does not focus on
severely damaged structures and has better description of the overall building exposure) becomes available.
The heuristic vulnerability curves, as well as the method, will continue to evolve as the knowledge of the
behaviour of Philippine buildings in response to ground shaking is better understood.
6 REFERENCES
NBCP. 1972. National Building Code of the Philippines, Presidential Decree 1096, Republic of the Philippines, 1977.
FEMA. 2003. Multi-Hazard Loss Estimation Methodology Earthquake Model. Washington, D.C.: Department of Homeland Security and Federal Emergency Management Agency.
Dickson, E., Baker, J., Hoornweg, D. & Tiwari, A. 2012. Urban Risk Assessments: Understanding Disaster and Climate Risk in Cities, The World Bank, Washington D.C.
Applied Technology Council. 1996. ATC-40 Seismic Evaluation and Retrofit of Concrete Buildings, California: Seismic Safety Commission.
Saedi, A., Deck, O. & Verdel, T. 2009. Development of building vulnerability functions in subsidence regions from empirical methods, Engineering Structures, Vol 31 2275-2286.
Pacheco, B.M., Hernandez Jr., H., Ignacio Jr., U., Tingatinga, E.A.J., Tan, L.R., Pascua, M.C., Suiza, R.M., Longalong, R.E., Mata, W. & Zarco, M.H. 2011. Development of earthquake vulnerability curves for key building types in Iloilo City, Proc. PICE National Conference, Cagayan De Oro, Nov. 2011.
PHIVOLCS & Geoscience Australia. 2012. Review of Historical Philippines Earthquake Events and Building Consequences, November 2012.
Suiza, R.M., Pacheco, B.M., Tingatinga, E.A.J., Hernandez, J., Ulpiano, I., Germar, F., Pascua, M.C., Tan, L.R., Longalong, R.E., Mata, M. & Zarco, M.A. 2013. Development of Fragility Curves of Mid-rise Reinforced Concrete Moment Resisting Frame Structures in the Greater Metro Manila Area, Philippines, Proc, 10th International Conference on Urban Earthquake Engineering, 1-2 March 2013. Tokyo, Japan.
Tingatinga, E.A.J., Pacheco, B., Hernandez, J., Ignacio, U., Germar, F., Longalong, R.E., Mata, W., Pascua, M.C., Suiza, R. & Tan, L.R. 2013. Development of Heuristic Seismic Vulnerability Curves of Key Building Types in the Philippines, Proc. 10th International Conference on Urban Earthquake Engineering, 1-2 March 2013. Tokyo, Japan.
Acknowledgment. The authors would like to acknowledge the support from the Australian Agency for
International Development (AusAID) through the Greater Metro Manila Area – Risk Analysis Project
between the Philippine Institute of Volcanology and Seismology (PHIVOLCS-DOST), the Philippine
Atmospheric Geophysical and Astronomical Services Administration (PAGASA-DOST), Geoscience
Australia (GA).