Embed Size (px)
Citation preview

Submit Manuscript | http://medcraveonline.com
Abbreviations: DSM, dual stage model; CLT, classical lami-nation theory; APM, arrhenius prediction model; PBM, phani and bose model; LPM, life prediction methodology
IntroductionComposites offer a wide range of characteristics proper for many
design requirements due to their advantages of stiffness and strength to weight ratio as well as their chemical resistance. Problems with composites start with their exposure in extreme environments. Depending on the enhancement of the matrices via different inclusions and fillers, these materials exhibit advanced properties. Different methodologies have already been used to develop not only simple combinations of matrix and fibers, but also efficient combinations of various nano filler-functionalized polymers.1–2 All these harsh environmental conditions (which may be a combination of thermal, hygroscopic, chemical and oxidative environment) lead to ageing, which can be combined with the mechanical/operational loading. Currently, there is very little understanding of the ageing mechanisms of composites compared to the widely understood corrosion performance of metals.3 During long-term ageing most of the design properties of composites such as stiffness and strength are significantly reduced.4–7
When a specific application is contemplated, the designer should know not only the reference mechanical characteristics such as strength and stiffness, but also to know how the material will behave during its service life and what changes are likely to happen
to the composite under long term exposure service environment. The variation of composite properties when exposed to harsh environments in the presence of mechanical loading, are still not well characterised. It may lead to degradation of material’s stiffness and strength by the development of matrix cracks, deterioration of fibre/matrix interface, and this process is accompanied by decrease of glass transition temperature (Tg) and ultimately the material failing to meet its design allowable after certain time.7 There are physical changes, reversible, chemical changes, irreversible8 and mechanical ageing, which expresses the durability of the material in the imposed mechanical loads during service time. The degradation mechanisms act synergistically, accelerating the ageing processes. For this reason there is a need for a deeper understanding of the degradation of composite properties during given operating ageing so as to predict the mechanical properties at any given time.9
Primarily, SD Speake et al.10 had tried to create a method in order to predict the changes of mechanical properties in laminates as a consequence of prolonged immersion in water. These changes were found to be function of the absorbed moisture.10 In S. Kajorncheappunnganet al.11 studied the effects of the environmental ageing on the durability of glass/epoxy composites. He was focused on the major factors that influenced the degradation of glass/epoxy composites.11 In JR Reeder et al.12 had developed a prediction methodology of long-term strength degradation of thermoplastic composites using time-temperature superposition.12 In P. Surathi et al.13 tried to investigate the reduction of moduli and strengths
MOJ Poly Sci. 2017;1(2):41‒52. 41© 2017 Kelverkloglou et al. This is an open access article distributed under the terms of the Creative Commons Attribution License, which permits unrestricted use, distribution, and build upon your work non-commercially.
Models for combined diffusion and moduli degradation analysis of glass reinforced cyanate ester composites structures
Volume 1 Issue 2 - 2017
Panagiota Kelverkloglou, Stavros Tsantzalis, Vassilis KostopoulosDepartment of Mechanical Engineering & Aeronautics, University of Patras, Greece
Correspondence: Vassilis Kostopoulos, Department of Mechanical Engineering & Aeronautics, University of Patras Campus, Rio, Achaia 26500, Greece, Tel 00302610969441, Email [email protected] Received: March 02, 2017 | Published: May 05, 2017
Abstract
The need to develop methodologies for life prediction of glass fibre reinforced polymers (GFRPs) has rapidly increased with the use of composites in many different industries. Currently, there is very little understanding of the ageing mechanisms in composites. It is important to develop a detailed through the thickness degradation analysis due to ageing, so as to predict its effect on the lifetime of composite structures. In the first part of this study an effort has been made to model the moisture absorption, the concentration of the absorbed fluid, and the reduction of mechanical properties, especially elastic moduli and strength in the through the thickness direction of a GFRP structure. The water absorption behavior of woven glass fibre reinforced cyanate ester composites used in the plenum of the air conditioning pack of aircraft’s environmental control system has been modeled. The combined models describe the diffusion procedure primarily at material level and continuously at structure level. The amount of the absorbed moisture can be crucial for the mechanical behavior of the structure. Therefore, there is a need for a better understanding of the evolution of mechanical properties during ageing. The whole procedure utilizes the results of the diffusion model for the calculation of the degradation of the moduli during the water uptake process. Predictive models have been proposed, by considering different sections throughout the thickness and provide a solid background for modeling the long term behavior of a structure under consideration exposed at different temperature and different time period.
Keywords: moisture absorption, ageing process of composites, moduli degradation, modelling of ageing process
MOJ Polymer Science
Research Article Open Access

Models for combined diffusion and moduli degradation analysis of glass reinforced cyanate ester composites structures
42Copyright:
©2017 Kelverkloglou et al.
Citation: Kostopoulos V, Kelverkloglou P, Tsantzalis S. Models for combined diffusion and moduli degradation analysis of glass reinforced cyanate ester composites structures. MOJ Poly Sci. 2017;1(2):41‒52. DOI: 10.15406/mojps.2017.01.00007
according to moisture absorption measurements.13 In G. Carra et al.14 tried to estimate the reduction of mechanical properties of pultruded glass fibre reinforced polymer composites due to their exposure in combined environmental agents.14 In Duncan Bruce et al.15 were focused on measurement and modelling of permeation and diffusion in polymers and their effort was used to supplement experimental measurements, improving understanding and enabling extrapolation of behaviour over time scales and in large components that are not experimentally convenient.15
In N. Guernazi et al.16 are focused on the durability of fiber reinforced polymer composites of aircraft structure in hydrothermal conditioning.16 It is important at this point to mention that a classic approach to predict the behaviour of a specific characteristic of the material is the use of the Arrhenius Prediction Methodology which is totally correlated with the temperature. However, an Arrhenius curve cannot be drawn for the modulus because of the initial increase in modulus in the early exposure times, thus invalidating this method unless the different mechanisms are separated.17 The main purpose of the present study is to develop predictive models via empirical equations that will use the moisture absorption percentages and will give accurate prediction of moduli degradation. This information that can be used in life estimation methodologies that could be applied further on the structure. In this analysis, the basic calculations have been made, taking into account the reduction of the mechanical properties of the cyanate ester composite layers based on available experimental data and their correlation to the reduction of the moduli of the composite. The used data comes from the case of an aircraft air-conditioning plenum. All the data used in the present analysis has been already published elsewhere.18,19 All the proposed procedures are part of a developed application written in Python programming language that works for the general estimation of service life of composite components.
The objectives of this study are to create a methodology that could improve the procedures of life prediction via simple experimental techniques. Ageing processes require duration of time and dedication with the exact days of the measurements. Using accelerated ageing methodologies and analyzing the results with the appropriate models, can lead to an accurate estimation of the residual mechanical properties of the exposed materials. A restriction that cannot be neglected is the fact that the experiments that are used as inputs need to be designed for a range of temperatures with at least four different ones and with a quite expanded range of time intervals.
Materials and methodsMaterials and structure
For the purpose of this study, experimental data based comes from the work of Fiamegkou et al.18 and Kollia et al.19 have been used. In these works the authors investigated the effect of hydrothermal ageing on the mechanical and thermo-mechanical properties of glass fiber reinforced cyanate-ester composites, material that is used for the construction of plenum, one of the most basic parts of the environmental control system of aircrafts. The experimental procedure followed is analytically described in. The cyanate ester matrix composites have been increasingly used for applications in operational environments of high temperature in combination with moisture presence. These materials are parts of the family of thermosets and have characteristics that are very efficient for many applications in different sectors. As matrix materials they perform good physical, electrical, thermal and processing properties.19,20
The composite materials system that was investigated by Fiamegkou et al.18 and Kollia et al.19 and used in the current study is the commercial prepreg system of PN901-G201-45 obtained by Gurit (Switzerland). It has a reinforcement phase of woven fabric of E-glass filament yarn 390g/m2, 2/2 twill pre-impregnated with phenylene (C6H4) cyanate ester resin PN901. The glass reinforced cyanate esters were prepared in-house using autoclave technique. The curing cycle followed is the one suggested by the manufacturer and a post curing treatment of the plates for 24h at 120°C was also applied. Each plate has an average thickness of 2.6mm and it is made out of 8 plies stacked in a symmetric way having such orientation that the plate’s length direction coincided with the weft direction of the 2/2 twill weave. It is important to mention here that besides the thickness that has been tested for material characterization, in the real structure different thicknesses has been used for the manufacturing of the plenum.19 ASTM D5229/2004 was used for the moisture absorption tests, ISO 527-4 for the tensile tests and EN ISO 2563 for the ILSS tests. The experimental data are based on the test conditions given in Table 1. The pre-mentioned experimental data have been extensively analyzed via Scanning Electron Microscopy published in the work of Fiamegkou et al. and Kelverkloglou et al. including also more properties that can be tested as tensile strength, tensile modulus, flexural strength and flexural modulus.19–20
Methodology
The method used in the current study is based on two distinguished steps. First step is the analytical calculation of the percentage of moisture absorption of the structure (Mt% Structure) at given operation environment, based on the experimental data. Second step is the calculation of the moduli degradation (E1, E2, G12) according to the calculated moisture absorption and the results of different mechanical tests. Predictive models have been proposed based on the interpolation of the available data for different temperatures than those of the tests and on time extrapolation for the long run exposure.
Diffusion analysis part: Modelling of the water diffusion in the through the thickness direction of the material is critical. The flow chart shown in Figure 1 describes the diffusion analysis process of the material that is being tested. The analysis is firstly given at lamina level and is followed by the analysis at laminate level, covering that way both the levels of material and structure. This flow chart inclu-des all the necessary steps in order to conclude to accurate results of the moisture absorption percentage in the case of a structure. For the thickness of the test specimen two approaches are used for modelling, the Fickian diffusion model and the Dual Stage Model (DSM).20 For more accurate results that could be applied at every material thick-ness, normalization through the thickness procedure will be applied. This approach permits for the calculation of moisture absorption at every layer in the thickness direction, which is different based on the position of the layer and the source of hydrothermal exposure. Thus, the application can calculate the final percentage of moisture absorp-tion, at every layer of the material, for given operating conditions. The flow chart of Figure 1 represents the detailed analysis of every step.
In order to model the moisture absorption in the through the thi-ckness direction of the material, basic input data are the mass absorp-tion measurements at different test temperatures. In general, a set of 6 different temperatures are used for these kinds of accelerated ageing tests. Based on these results the algorithm provides information that is needed for the calculation of diffusion coefficient at every temperatu-re (linear region) and the moisture saturation percentage (at the end of exposure period), defined as M∞%. In the present case, for the four ex-

Models for combined diffusion and moduli degradation analysis of glass reinforced cyanate ester composites structures
43Copyright:
©2017 Kelverkloglou et al.
Citation: Kostopoulos V, Kelverkloglou P, Tsantzalis S. Models for combined diffusion and moduli degradation analysis of glass reinforced cyanate ester composites structures. MOJ Poly Sci. 2017;1(2):41‒52. DOI: 10.15406/mojps.2017.01.00007
perimental temperatures, four diffusion coefficients D1, D2, D3, D4 and four moisture absorption saturation values M∞1, M∞2, M∞3 and M∞4 can be calculated. This theoretical approach is based on Fickian diffu-sion model.20,21 The equations used in this approach are given below:
As described by Fickian diffusion model Mt is:
( )it iM G M M Mm= − + Equation (1)
( )
( )
2
222 1
2 2
81
2 10
Dtn
heG
nn
π
π
−+
∞
= − ∑+= Equation (2)
Where:
D : is diffusion coefficient in the direction normal to the surface
h :is the thickness of the specimen
Since dry specimens were used in the moisture uptake experiments,
the theoretical calculations of t
M at any time assuming Fickian diffusion are given by:
( )
( )
2 22
2 2
2 181
2 10t m
DtnheM M
nn
π
π
−+
∞ = − ∑
+= Equation (3)
The experimental which is a result of the immersion experiments in deionized water is given by:
( )100i
t
w wM
w−
= Equation (4)
where:
tM : is percentage of moisture gain at time t
w : Dry weight of the specimen
iw : Weight of specimen after immersion in water at time t
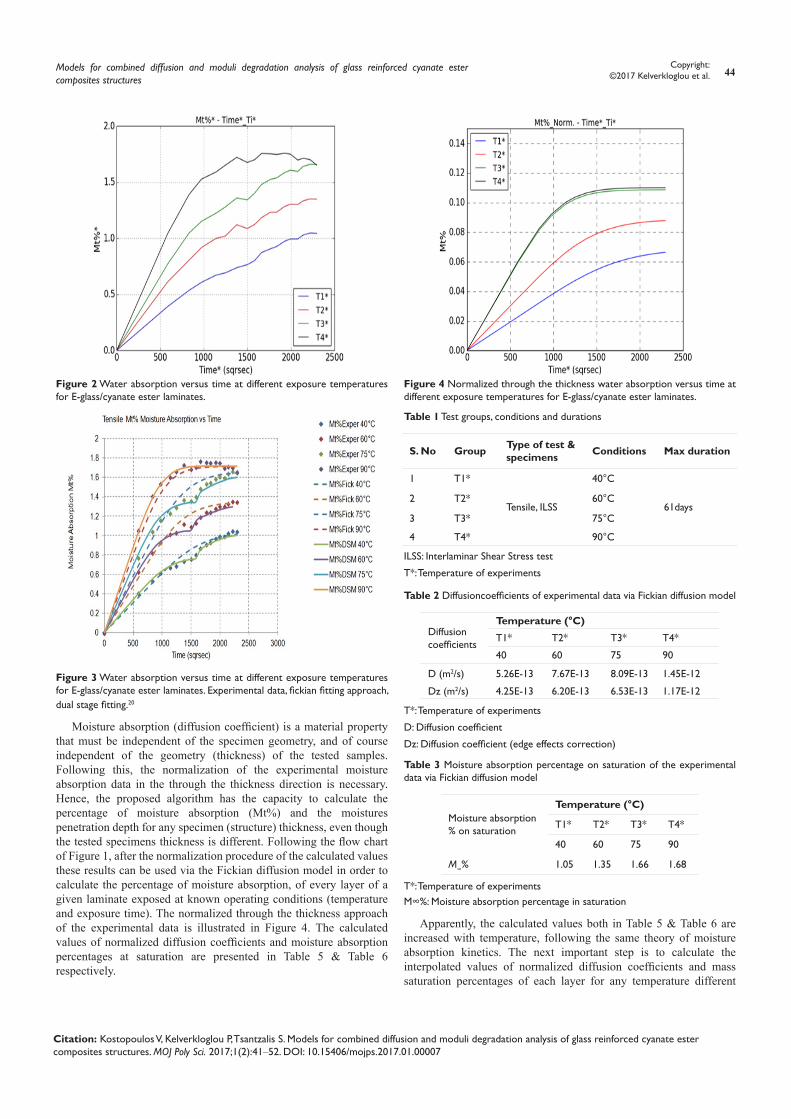
The calculated values of diffusion coefficients and moisture absorption percentages at saturation are given in Table 2 & Table 3 respectively. In the case of diffusion coefficients the appropriate edge effect correction has been already incorporated in the results of Dz given in Table 2.13 & Figure 2 provides the moisture/water absorption versus time at different exposure temperature for E-glass/cyanate ester laminates. Obviously, both the diffusion coefficients and the moisture absorption percentages at saturation are increased with the temperature, something that is expected according to moisture absorption kinetics theory.21
This first theoretical approach that is being discussed here is based primarily on the work of Kelverkloglou et al.,20 who after the theoretical diffusion analysis of the experimental data with the Fickian diffusion model mentioned before, had shown that a new approach with a dual stage diffusion model (DSM) can provide more accurate results in comparison to the Fickian diffusion model approach. Figure 3 represents the results of the dual stage model and in Table 4 the diffusion coefficients that are calculated from the DSM are presented.20 Again, in this case, the diffusion coefficients of both stages are increased versus the temperature as it is expected.
Figure 1 Flow chart of diffusion analysis.
Models for combined diffusion and moduli degradation analysis of glass reinforced cyanate ester composites structures
44Copyright:
©2017 Kelverkloglou et al.
Citation: Kostopoulos V, Kelverkloglou P, Tsantzalis S. Models for combined diffusion and moduli degradation analysis of glass reinforced cyanate ester composites structures. MOJ Poly Sci. 2017;1(2):41‒52. DOI: 10.15406/mojps.2017.01.00007
Figure 2 Water absorption versus time at different exposure temperatures for E-glass/cyanate ester laminates.
Figure 3 Water absorption versus time at different exposure temperatures for E-glass/cyanate ester laminates. Experimental data, fickian fitting approach, dual stage fitting.20
Moisture absorption (diffusion coefficient) is a material property that must be independent of the specimen geometry, and of course independent of the geometry (thickness) of the tested samples. Following this, the normalization of the experimental moisture absorption data in the through the thickness direction is necessary. Hence, the proposed algorithm has the capacity to calculate the percentage of moisture absorption (Mt%) and the moistures penetration depth for any specimen (structure) thickness, even though the tested specimens thickness is different. Following the flow chart of Figure 1, after the normalization procedure of the calculated values these results can be used via the Fickian diffusion model in order to calculate the percentage of moisture absorption, of every layer of a given laminate exposed at known operating conditions (temperature and exposure time). The normalized through the thickness approach of the experimental data is illustrated in Figure 4. The calculated values of normalized diffusion coefficients and moisture absorption percentages at saturation are presented in Table 5 & Table 6 respectively.
Figure 4 Normalized through the thickness water absorption versus time at different exposure temperatures for E-glass/cyanate ester laminates.
Table 1 Test groups, conditions and durations
S. No Group Type of test & specimens Conditions Max duration
1 T1*
Tensile, ILSS
40°C
61days2 T2* 60°C
3 T3* 75°C
4 T4* 90°C
ILSS: Interlaminar Shear Stress test
T*: Temperature of experiments
Table 2 Diffusioncoefficients of experimental data via Fickian diffusion model
Diffusion coefficients
Temperature (°C)
T1* T2* T3* T4*
40 60 75 90
D (m2/s) 5.26E-13 7.67E-13 8.09E-13 1.45E-12
Dz (m2/s) 4.25E-13 6.20E-13 6.53E-13 1.17E-12
T*: Temperature of experiments
D: Diffusion coefficient
Dz: Diffusion coefficient (edge effects correction)
Table 3 Moisture absorption percentage on saturation of the experimental data via Fickian diffusion model
Moisture absorption % on saturation
Temperature (°C)
T1* T2* T3* T4*
40 60 75 90
M∞% 1.05 1.35 1.66 1.68
T*: Temperature of experimentsM∞%: Moisture absorption percentage in saturation
Apparently, the calculated values both in Table 5 & Table 6 are increased with temperature, following the same theory of moisture absorption kinetics. The next important step is to calculate the interpolated values of normalized diffusion coefficients and mass saturation percentages of each layer for any temperature different

Models for combined diffusion and moduli degradation analysis of glass reinforced cyanate ester composites structures
45Copyright:
©2017 Kelverkloglou et al.
Citation: Kostopoulos V, Kelverkloglou P, Tsantzalis S. Models for combined diffusion and moduli degradation analysis of glass reinforced cyanate ester composites structures. MOJ Poly Sci. 2017;1(2):41‒52. DOI: 10.15406/mojps.2017.01.00007
from the experimental ones (interpolation). This is being done through the Arrhenius Plot. The key factor that mainly affects the diffusion coefficient and the moisture absorption percentage at saturation is the temperature. The diffusion coefficient describes the rate of diffusion of particles, depending on the particle size, viscosity and temperature. Diffusion coefficient is a function of absolute temperature and has been shown to increase increasing temperature. Thus, the diffusion coefficient is the measure of mobility of the diffusing species. The diffusion coefficient is related to temperature with the following equation:
0
Ea
RTeD D
−
= Equation (5)
where:
0D is the temperature dependent pre-exponential (m2/s)
aE is the activation energy for diffusion (J/mol)
R is the gas constant (8.31J/mol K)
T is the absolute temperature (K)
Table 4 Diffusion coefficients of experimental data via dual stage model20
Diffusion coefficients
Temperature (°C)
T1* T2* T3* T4*
40 60 75 90
D1 (m2/s) 9.93E-13 1.35E-12 1.35E-12 1.35E-12
D2(m2/s) 4.26E-13 3.82E-13 3.82E-13 3.24E-13
T*: Temperature of experiments
D: Diffusion coefficient
Dz: Diffusion coefficient (edge effects correction)
Table 5 Normalized diffusion coefficients based on experimental data.
Diffusion coefficients
Temperature (°C)
T1* T2* T3* T4*
40 60 75 90
D (m2/s)norm 4.20E-13 6.13E-13 6.47E-13 1.15E-12
Dz (m2/s) norm 4.09E-13 5.97E-13 6.30E-13 1.12E-12
T*: Temperature of experiments
D: Diffusion coefficient
Dz: Diffusion coefficient (edge effects correction)
norm: Normalized
Table 6 Normalized moisture absorption percentage at saturation based on the experimental data.
Moisture absorption % on saturation
Temperature (°C)
T1* T2* T3* T4*
40 60 75 90
M∞%norm 0.1372 0.1769 0.2173 0.2202
T*: Temperature of experimentsM∞%: Moisture absorption percentage in saturationnorm: Normalized
Figure 5 Graph of lnD vs. 1/T which has slope of Ea/2.3R and intercept of lnD0.
22
The equation was defined by Arrhenius in 1899 and is applicable to determination of any reaction rate based on a temperature driven process. Because the relationship is exponential, a small change in temperature or activation energy causes a large change in the rate of diffusion.19 The above equation can be rewritten as:
0
1aElnD lnD
R T = − Equation (6)
So the activation energy is calculated by the equation below:
1 20
1 2
1 2.32 1 1a
a
E lnD lnDlnD lnD ER T
T T
− = − = − − Equation (7)
The approach, which is proposed here, is described by a general equation that connects the reduction of modulus with temperature and time.
( )Modulus f T,t= Equation (8)
where:
T: operational temperature
t : operational time
More analytically the proposed form of the equation is:
( ) ( )Modulus aT b t cT d= + + + Equation (9)
Where:
T: operational temperature
t : operational time
a,c: slopes coefficients from regression analysis
b,d: intercepts coefficients from regression analysis

Models for combined diffusion and moduli degradation analysis of glass reinforced cyanate ester composites structures
46Copyright:
©2017 Kelverkloglou et al.
Citation: Kostopoulos V, Kelverkloglou P, Tsantzalis S. Models for combined diffusion and moduli degradation analysis of glass reinforced cyanate ester composites structures. MOJ Poly Sci. 2017;1(2):41‒52. DOI: 10.15406/mojps.2017.01.00007
Figure 6 Evolution of Mt %Layer for the same elevated temperature.
Figures 9-11 represent the degradation of mechanical properties (moduli) versus exposure time for the four different exposure temperatures, measured directly from the experiments (dot symbols) and their predictions coming from the application of the proposed model (solid lines) for the same exposure time intervals and temperature. Based on the experimental results it is obvious that the mechanical moduli are degraded as a function of exposure time and the degradation is more intensive increasing exposure temperature. At extreme ageing conditions, at the temperature of 90°C (T4*), the monitored reduction of all the moduli during the initial stage of exposure is the highest one, since at this extreme environment phenomena such as leaching and hydrolysis are activated, and they
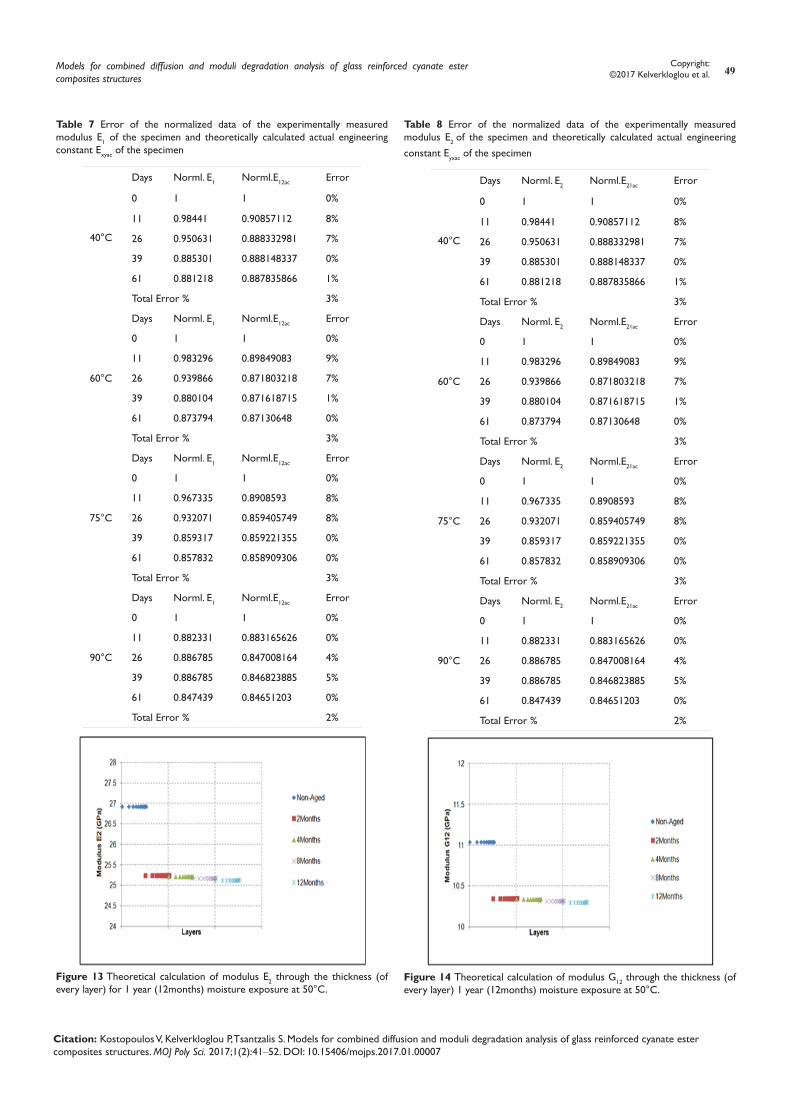
have a detrimental effect on the integrity of the material, resulting to permanent and non-reversible deterioration. The reported exposure temperatures of the plots presented in Figures 9-11 are the ones used for the experiments and are given in Table 1. Table 7-9 present the deviation (error) between the normalized experimental results of the moduli (E1, E2 and G12) and analytically calculated actual engineering constants (E12ac, E21ac, G12ac) of the same specimens. It is observed that the proposed methodology for the analytical calculation of modulus degradation due to hydrothermal exposure is quite accurate (maximum error 4% in this case study) and provides a solid tool for long-term predictions.
Models for combined diffusion and moduli degradation analysis of glass reinforced cyanate ester composites structures
47Copyright:
©2017 Kelverkloglou et al.
Citation: Kostopoulos V, Kelverkloglou P, Tsantzalis S. Models for combined diffusion and moduli degradation analysis of glass reinforced cyanate ester composites structures. MOJ Poly Sci. 2017;1(2):41‒52. DOI: 10.15406/mojps.2017.01.00007
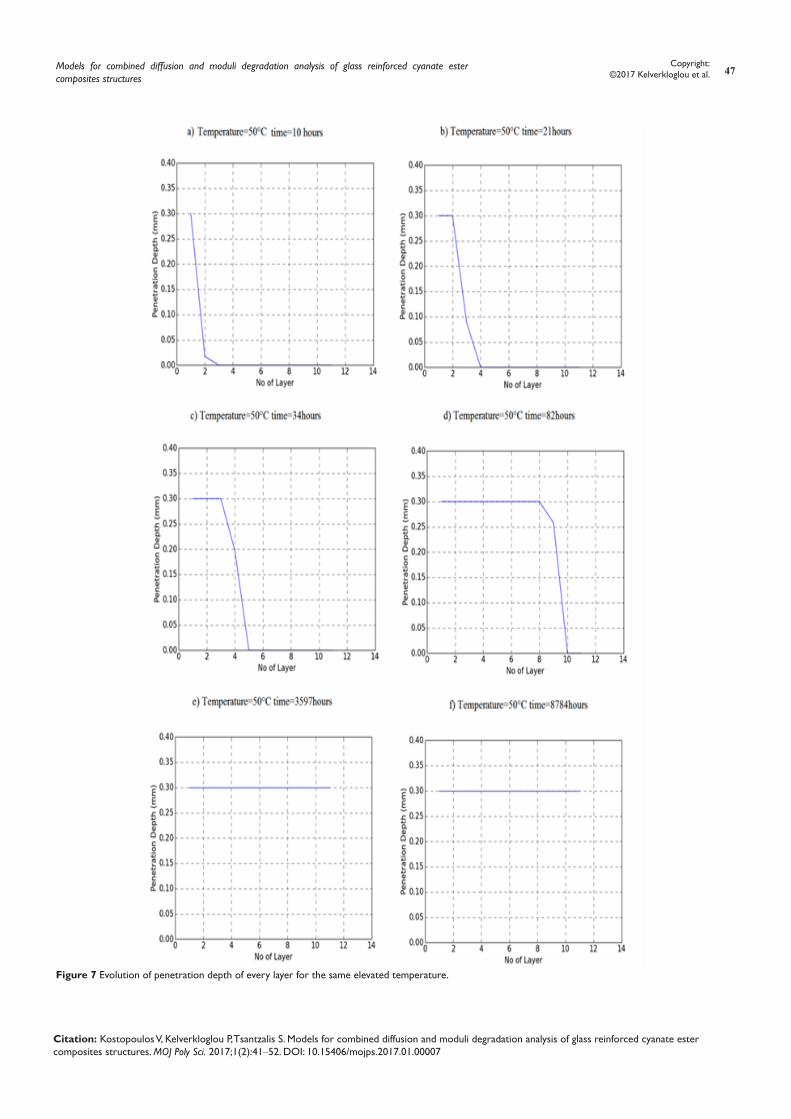
Figure 7 Evolution of penetration depth of every layer for the same elevated temperature.
Models for combined diffusion and moduli degradation analysis of glass reinforced cyanate ester composites structures
48Copyright:
©2017 Kelverkloglou et al.
Citation: Kostopoulos V, Kelverkloglou P, Tsantzalis S. Models for combined diffusion and moduli degradation analysis of glass reinforced cyanate ester composites structures. MOJ Poly Sci. 2017;1(2):41‒52. DOI: 10.15406/mojps.2017.01.00007
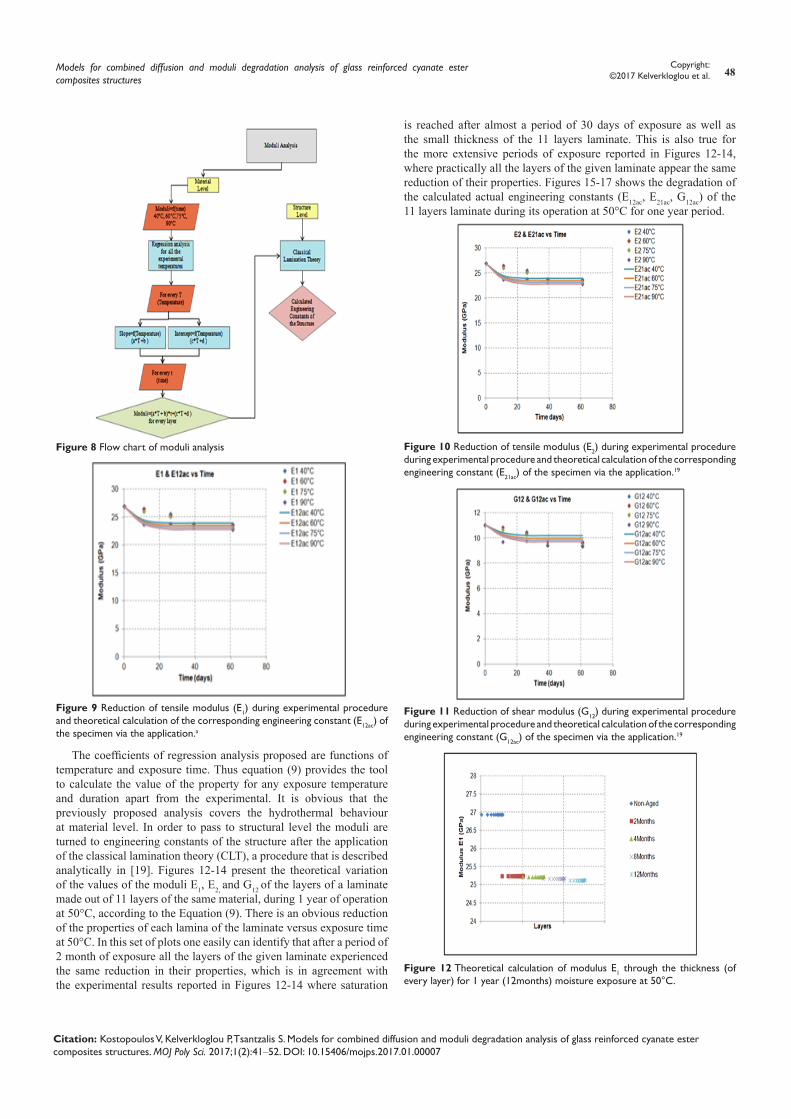
Figure 8 Flow chart of moduli analysis
Figure 9 Reduction of tensile modulus (E1) during experimental procedure and theoretical calculation of the corresponding engineering constant (E12ac) of the specimen via the application.a
The coefficients of regression analysis proposed are functions of temperature and exposure time. Thus equation (9) provides the tool to calculate the value of the property for any exposure temperature and duration apart from the experimental. It is obvious that the previously proposed analysis covers the hydrothermal behaviour at material level. In order to pass to structural level the moduli are turned to engineering constants of the structure after the application of the classical lamination theory (CLT), a procedure that is described analytically in [19]. Figures 12-14 present the theoretical variation of the values of the moduli E1, E2, and G12 of the layers of a laminate made out of 11 layers of the same material, during 1 year of operation at 50°C, according to the Equation (9). There is an obvious reduction of the properties of each lamina of the laminate versus exposure time at 50°C. In this set of plots one easily can identify that after a period of 2 month of exposure all the layers of the given laminate experienced the same reduction in their properties, which is in agreement with the experimental results reported in Figures 12-14 where saturation
is reached after almost a period of 30 days of exposure as well as the small thickness of the 11 layers laminate. This is also true for the more extensive periods of exposure reported in Figures 12-14, where practically all the layers of the given laminate appear the same reduction of their properties. Figures 15-17 shows the degradation of the calculated actual engineering constants (E12ac, E21ac, G12ac) of the 11 layers laminate during its operation at 50°C for one year period.
Figure 10 Reduction of tensile modulus (E2) during experimental procedure during experimental procedure and theoretical calculation of the corresponding engineering constant (E21ac) of the specimen via the application.19
Figure 11 Reduction of shear modulus (G12) during experimental procedure during experimental procedure and theoretical calculation of the corresponding engineering constant (G12ac) of the specimen via the application.19
Figure 12 Theoretical calculation of modulus E1 through the thickness (of every layer) for 1 year (12months) moisture exposure at 50°C.
Models for combined diffusion and moduli degradation analysis of glass reinforced cyanate ester composites structures
49Copyright:
©2017 Kelverkloglou et al.
Citation: Kostopoulos V, Kelverkloglou P, Tsantzalis S. Models for combined diffusion and moduli degradation analysis of glass reinforced cyanate ester composites structures. MOJ Poly Sci. 2017;1(2):41‒52. DOI: 10.15406/mojps.2017.01.00007
Table 7 Error of the normalized data of the experimentally measured modulus E1 of the specimen and theoretically calculated actual engineering constant Exyac of the specimen
40°C
Days Norml. E1 Norml.E12ac Error
0 1 1 0%
11 0.98441 0.90857112 8%
26 0.950631 0.888332981 7%
39 0.885301 0.888148337 0%
61 0.881218 0.887835866 1%
Total Error % 3%
60°C
Days Norml. E1 Norml.E12ac Error
0 1 1 0%
11 0.983296 0.89849083 9%
26 0.939866 0.871803218 7%
39 0.880104 0.871618715 1%
61 0.873794 0.87130648 0%
Total Error % 3%
75°C
Days Norml. E1 Norml.E12ac Error
0 1 1 0%
11 0.967335 0.8908593 8%
26 0.932071 0.859405749 8%
39 0.859317 0.859221355 0%
61 0.857832 0.858909306 0%
Total Error % 3%
90°C
Days Norml. E1 Norml.E12ac Error
0 1 1 0%
11 0.882331 0.883165626 0%
26 0.886785 0.847008164 4%
39 0.886785 0.846823885 5%
61 0.847439 0.84651203 0%
Total Error % 2%
Figure 13 Theoretical calculation of modulus E2 through the thickness (of every layer) for 1 year (12months) moisture exposure at 50°C.
Table 8 Error of the normalized data of the experimentally measured modulus E2 of the specimen and theoretically calculated actual engineering constant Eyxac of the specimen
40°C
Days Norml. E2 Norml.E21ac Error
0 1 1 0%
11 0.98441 0.90857112 8%
26 0.950631 0.888332981 7%
39 0.885301 0.888148337 0%
61 0.881218 0.887835866 1%
Total Error % 3%
60°C
Days Norml. E2 Norml.E21ac Error
0 1 1 0%
11 0.983296 0.89849083 9%
26 0.939866 0.871803218 7%
39 0.880104 0.871618715 1%
61 0.873794 0.87130648 0%
Total Error % 3%
75°C
Days Norml. E2 Norml.E21ac Error
0 1 1 0%
11 0.967335 0.8908593 8%
26 0.932071 0.859405749 8%
39 0.859317 0.859221355 0%
61 0.857832 0.858909306 0%
Total Error % 3%
90°C
Days Norml. E2 Norml.E21ac Error
0 1 1 0%
11 0.882331 0.883165626 0%
26 0.886785 0.847008164 4%
39 0.886785 0.846823885 5%
61 0.847439 0.84651203 0%
Total Error % 2%
Figure 14 Theoretical calculation of modulus G12 through the thickness (of every layer) 1 year (12months) moisture exposure at 50°C.

Models for combined diffusion and moduli degradation analysis of glass reinforced cyanate ester composites structures
50Copyright:
©2017 Kelverkloglou et al.
Citation: Kostopoulos V, Kelverkloglou P, Tsantzalis S. Models for combined diffusion and moduli degradation analysis of glass reinforced cyanate ester composites structures. MOJ Poly Sci. 2017;1(2):41‒52. DOI: 10.15406/mojps.2017.01.00007
Table 9 Error of the normalized data of the experimentally measured modulus G12 of the specimen and theoretically calculated actual engineering constant Gxyac of the specimen
40°C
Days Norml. G12 Norml.G12ac Error
0 1 1 0%
11 0.984601449 0.945020487 4%
26 0.951086957 0.924088357 3%
39 0.885869565 0.923896515 4%
61 0.88134058 0.923571861 5%
Total Error % 3%
60°C
Days Norml. G12 Norml.G12ac Error
0 1 1 0%
11 0.983695652 0.934479716 5%
26 0.940217391 0.906800944 4%
39 0.880434783 0.906609313 3%
61 0.874094203 0.906285017 4%
Total Error % 3%
75°C
Days Norml. G12 Norml.G12ac Error
0 1 1 0%
11 0.967391304 0.926499148 4%
26 0.932065217 0.893835229 4%
39 0.859601449 0.893643762 4%
61 0.857789855 0.893319743 4%
Total Error % 3%
90°C
Days Norml. G12 Norml.G12ac Error
0 1 1 0%
11 0.882246377 0.918453228 4%
26 0.886775362 0.880869393 1%
39 0.855978261 0.880678095 3%
61 0.847826087 0.880354362 4%
Total Error % 2%
Figure 15 Theoretical calculation of actual engineering constant Exyac of the specimen (laminate) 1 year (12months) moisture exposure at 50°C.
Figure 16 Theoretical calculation of actual engineering constant Eyxac of the specimen (laminate) 1 year (12months) moisture exposure at 50°C.
Figure 17 Theoretical calculation of actual engineering constant Gxyac of the specimen (laminate) 1 year (12months) moisture exposure at 50°C.
Results and discussionThe experimental results of mass of deionized water uptake versus
time for given material specimens, even in their normalized form, are shown that at lower temperature, the initial high absorption rate region is extended to longer compared to higher temperatures, although the absorption rate is lower at lower temperature. Thus, the time period needed for the specimen to reach the saturation level is higher at lower exposure temperature. The theoretical approach, which is based on the moisture absorption of every layer, gives an approach of the total moisture absorption percentage and penetration depth for the structure in the through the thickness direction. This result is a cumulative process that includes the moisture absorption percentage of every layer. Furthermore, the degradation of the moduli due to moisture absorption it is a known phenomenon, that is material depended and must be quantified. In order to reduce the necessary expensive experimental procedures for covering this critical design issue, it is needed to establish validated prediction models for reducing the amount of the required experiments.
In the literature, there are analytical predictive models for the

Models for combined diffusion and moduli degradation analysis of glass reinforced cyanate ester composites structures
51Copyright:
©2017 Kelverkloglou et al.
Citation: Kostopoulos V, Kelverkloglou P, Tsantzalis S. Models for combined diffusion and moduli degradation analysis of glass reinforced cyanate ester composites structures. MOJ Poly Sci. 2017;1(2):41‒52. DOI: 10.15406/mojps.2017.01.00007
degradation of the mechanical properties of composite laminates as function water absorption, and two of the most known and frequently used are the Arrhenius Prediction Model (APM), and Phani and Bose Model (PBM).13 The proposed here predictive methodology, based on the Equation (9), is named Life Prediction Methodology (LPM). An effort has been done here in order to compare the predictions made by the LPM against the two pre-mentioned analytical models, APM and PBM.
Two different comparison methodologies/approaches have been followed.
The first approach is to compare the analytical results of the LPM, APM PBM, based on the experimental data used in this work. Table 10 presents the calculated difference between the experimental data (Exper) and all the above mentioned prediction models.
Table 10 1st Approach: Error percentages between experimental data and prediction methodologies
Tensile modulus 1st approach
Average Errors% 40°C
Exper-APM Exper-PBM Exper-LPM
2% 3% 1%
Average Errors% 60°C
Exper-APM Exper-PBM Exper-LPM
2% 3% 2%
Average Errors% 75°C
Exper-APM Exper-PBM Exper-LPM
2.39% 3.24% 1.71%
Average Errors% 90°C
Exper-APM Exper-PBM Exper-LPM
1% 1% 3%
Exper: Experimental
APM: Experimental
PBM: Phani and Bose Model
LPM: Life Prediction Methodology
The second approach compares again the analytical results of the LPM, APM PBM, but based on the experimental data coming from the work of Karbhari Vistasp et al.13 Table 11 shows also the calculated differences between the experimental data (Exper) of13 and all the above mentioned prediction models. The pre-mentioned experimental results are already published in their work13 In both comparison cases, the proposed approach of LPM provides the best convergence between experimental and analytical predictions given the lower difference/percentage error in the comparison between model predictions and experimental results. Besides this, the Arrhenius Prediction Model follows in the accuracy of predictions and the Phani and Bose Model provides the worst predictions for the set of data used in this comparison.
Table 11 2nd Approach: Error percentages between experimental data and prediction methodologies
Tensile Modulus 2nd Approach
Average Errors% 40°C
Exper-APM Exper-PBM Exper-LPM
4% 2% 1%
Average Errors% 60°C
Exper-APM Exper-PBM Exper-LPM
5% 2% 1%
Average Errors% 75°C
Exper-APM Exper-PBM Exper-LPM
5.80% 2.09% 1.61%
Average Errors% 90°C
Exper-APM Exper-PBM Exper-LPM
2% 10% 2%
Exper: Experimental
APM: Experimental
PBM: Phani and Bose Model
LPM: Life Prediction Methodology
Conclusion Several samples of 2x2 twill woven glass reinforced cyanate ester
composites were used for mass absorption and moduli degradation studies. The classic Fickian model was applied for the fitting of the actual experimental results. The moisture absorption and the penetration depth of moisture in the through the thickness direction of the samples were calculated, based on the experimental results and the calculated diffusion coefficients in the through the thickness direction.
Moisture absorption leads to modulus degradation. A model for the calculations of the moduli reduction was proposed, which takes in to account both exposure temperature and exposure duration and it is based on experimental results for the composite material under investigation. It was found that the modulus reduction rate versus time of exposure is higher when the exposure temperature increases. The proposed methodology stands for material (layer) level, however it is easily can be expanded at laminate level by using CLT.
AcknowledgementsNone.
Conflict of interestThe author declares no conflict of interest.
References1. Raghava Reddy K, Lee KP, Lee Y, et al. Facile synthesis of conduc-
ting polymer-metal hybrid nanocomposite by in situ chemical oxidative polymerization with negatively charged metal nanoparticles. Materials Letters. 2008;62:1815–1818.
2. Raghava Reddy K, Lee KP, Lee Y, et al, Facile synthesis of hollow spheres of sulfonated polyanilines. Polymer Journal. 2006;38(4):349–354.

Models for combined diffusion and moduli degradation analysis of glass reinforced cyanate ester composites structures
52Copyright:
©2017 Kelverkloglou et al.
Citation: Kostopoulos V, Kelverkloglou P, Tsantzalis S. Models for combined diffusion and moduli degradation analysis of glass reinforced cyanate ester composites structures. MOJ Poly Sci. 2017;1(2):41‒52. DOI: 10.15406/mojps.2017.01.00007
3. Mercier J, Bunsell A, Castaing P, et al. Characterisation and modelling of aging of composites. Composites Part A: Applied science and manu-facturing. 2008;39:428–438.
4. Bradshaw RD, Brinson LC. Physical aging in polymers and polymer composites: An analysis and method for time-aging time superposition. Polymer Engineering & Science. 1997;37(1):31–44.
5. Assaleh TA. Ultimate elastic wall stress envelopes for (GRE) pipes. Me-chanical & systems engineering, United Kingdom; 2011.
6. Maxwell AS, Dean G, Sims GD. Review of accelerated ageing methods and lifetime prediction techniques for polymeric materials. NPL Report; 2005.
7. Oliveira BF, Creus GJ. An analytical numerical framework for the study of ageing in fibre reinforced polymer composites. Composite Structures. 2004;65(3-4):443–457.
8. Kelverkloglou P, Martin R, Kostopoulos V, et al. Life estimation meth-odologies for glass reinforced polymer composite pipes used in the oil & gas industry. Composites Week Conference, Belgium: University of Patras; 2013.
9. Leveque D, Schieffer A, Mavel A, et al. Analysis of how thermal ag-ing affects the long-term mechanical behavior and strength of polymer matrix composites. Composites Science and Technology. 2005;65(3-4):395–401.
10. Pritchard G, Speake SD. The use of water absorption kinetic data to predict laminate property changes. Composites. 1987;18(3).
11. Kajorncheappunngam S. The effects of environmental aging on the du-rability of glass/epoxy composites. Pro Quest Dissertations and Theses. 1999;62(1):229.
12. Reeder JR. Prediction of long-term strength of thermoplastic compo-sites using time-temperature superposition. Hampton, Virginia, USA: Langley Research Center; 2002.
13. Surathi P, Karbhari V. Hygrothermal effects on durability and moistu-re kinetics of fiber-reinforced polymer composites. Structural Systems, USA: Research Project; 2006.
14. Carra G, Carvelli V. Ageing of pultruded glass fibre reinforced poly-mer composites exposed to combined environmental agents. Composite Structures. 2013;108:1019–1026.
15. Duncan Br, Urquhart J, Roberts S. Review of measurement and mo-delling of permeation and diffusion in polymers. Teddington Middlesex, UK: National Physical Laboratory; 2005. p. 1–73.
16. Guermazi N, Tarjem AB, Ksouri I, et al. On the durability of FRP com-posites for aircraft structures in hygrothermal conditioning. Composites Part B. 2015;85:294–304.
17. Boukhoulda FB, Guillaumat L, Lataillade JL, et al. Aging-impact cou-pling based analysis upon glass/polyester composite material in hygro-thermal environment. Materials & Design. 2011;32(7):4080–4087.
18. Fiamegkou E, Vavouliotis A, Kostopoulos V. The effect of thermo-oxi-dative aging on carbon fiber reinforced cyanate ester composites. Jour-nal of Composite Materials. 2015;49(26):3241–3250.
19. Kollia E, Loutas Th, Fiamegkou E, et al. Degradation behavior of glass fiber reinforced cyanate ester composites under hydrothermal ageing. Polymer Degradation and Stability. 2015;121:200–207.
20. Kelverkloglou P, Kollia E, Vavouliotis A, et al. Description of anoma-lous water absorption behaviour of woven glass reinforced cyanate ester composites. Plastic and Polymer Technology. 2016;4:92–106.
21. Martin Rod. Ageing of composites. 1st ed. Cambridge, USA: Woodhead Publishing; 2008.
22. Guedes RM. Lifetime predictions of polymer matrix composites under constant or monotonic load. Composites Part A: Applied Science and Manufacturing. 2006;37(5):703–715.