Embed Size (px)
Citation preview
Models - 1
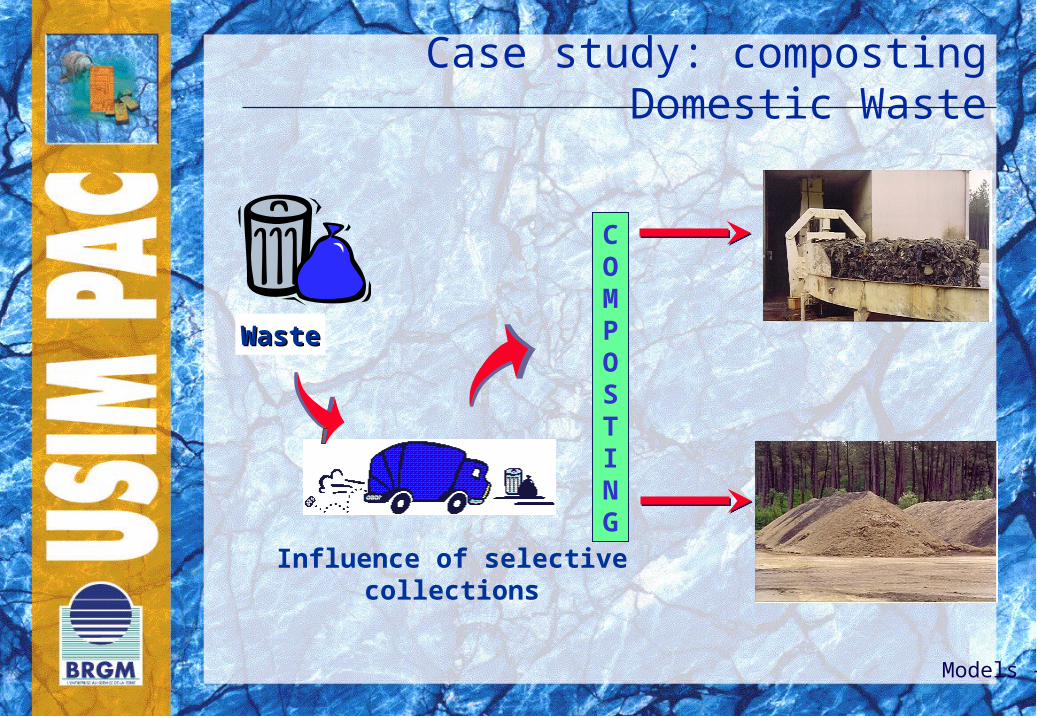
WasteWaste
Influence of selective collections
COMPOSTING
Case study: composting Domestic Waste

Models - 2
Summary
Available data and simulation objective phase model
Simulation of selective collections Influence on the composition of residual waste
Simulation of Bio Reactor BRS Influence of selective collections on the composition of fermented waste
Models - 3
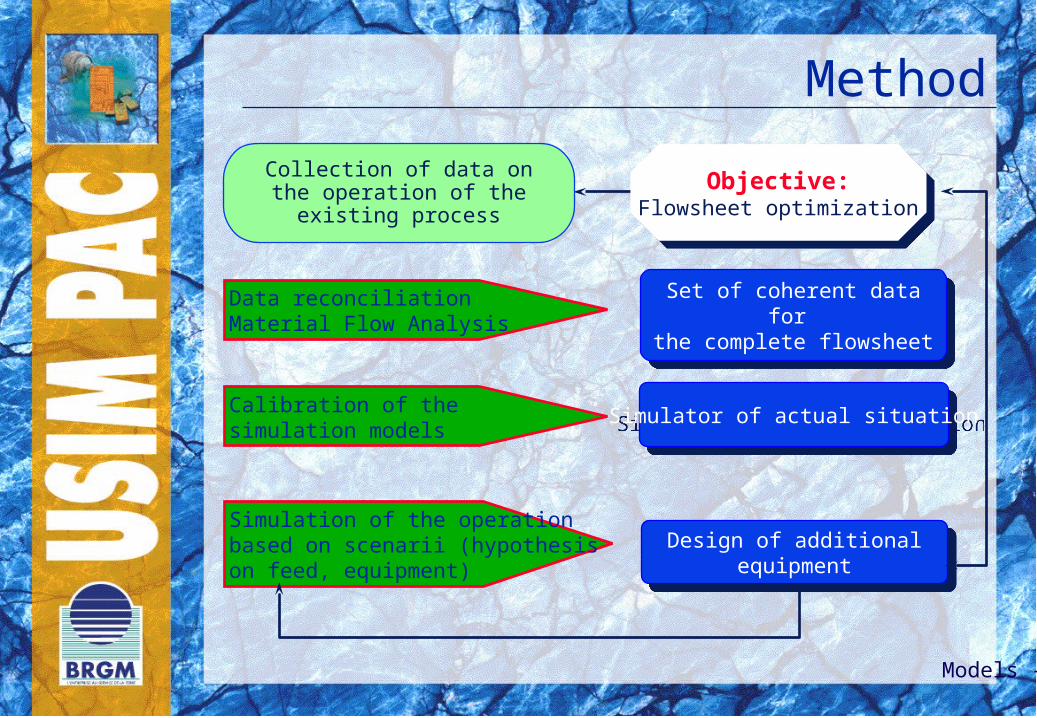
Method
Collection of data on the operation of the existing process
Data reconciliationMaterial Flow Analysis
Set of coherent data for the complete flowsheet
Set of coherent data for the complete flowsheet
Calibration of thesimulation models
Simulation of the operation based on scenarii (hypothesis on feed, equipment)
Objective:Flowsheet optimization
Objective:Flowsheet optimization
Simulator of actual situationSimulator of actual situation
Design of additionalequipment
Design of additionalequipment

Models - 4
Composting plant
Iron
BalisticsCompost
Losses
Bales
< 150 mm
> 150 mmDW
Composting plant
Bio Reactor
> 18 mm
< 18 mm
Overband
Press
Balisticseparator
SelectiveCollections
Compoststandard
Models - 5
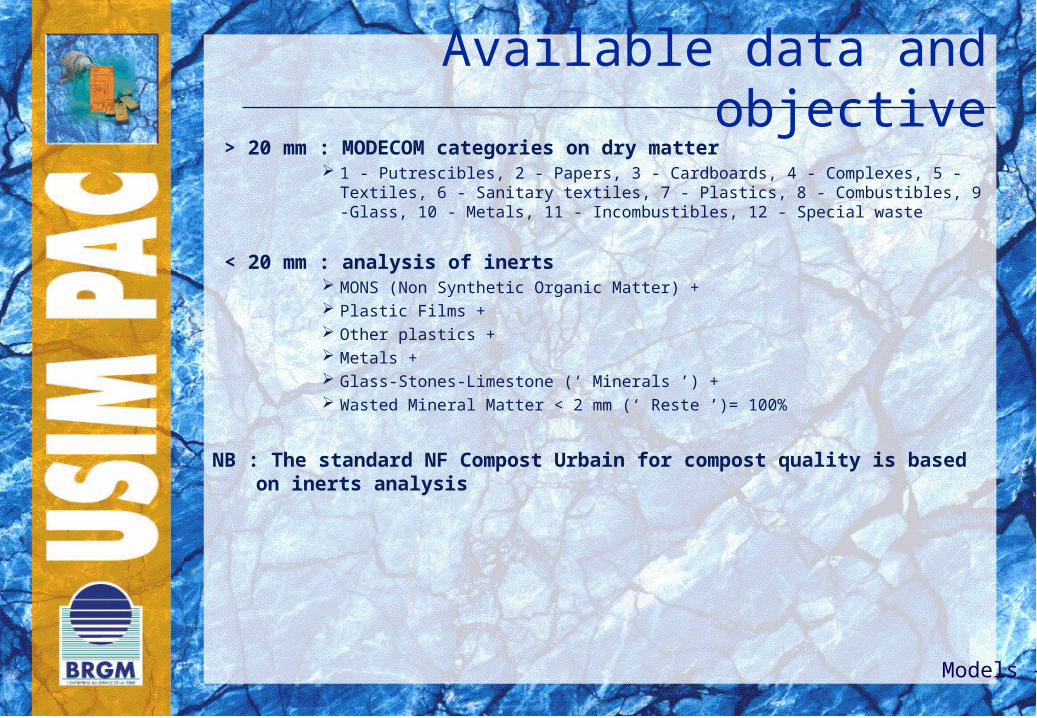
Available data and objective > 20 mm : MODECOM categories on dry matter
1 - Putrescibles, 2 - Papers, 3 - Cardboards, 4 - Complexes, 5 -Textiles, 6 - Sanitary textiles, 7 - Plastics, 8 - Combustibles, 9 -Glass, 10 - Metals, 11 - Incombustibles, 12 - Special waste
< 20 mm : analysis of inerts MONS (Non Synthetic Organic Matter) + Plastic Films + Other plastics + Metals + Glass-Stones-Limestone (‘ Minerals ’) + Wasted Mineral Matter < 2 mm (‘ Reste ’)= 100%
NB : The standard NF Compost Urbain for compost quality is based on inerts analysis

Models - 6
Modelling the matter
Available data Marque NFCompost quality
Flowrate
Size distribution
MODECOM Categories > 100 mm100-20 mm< 20 mm
Inerts Analysis> 100 mm100-20 mm< 20 mm
Heavy Metals per MODECOM categories
Heavy Metals per category of inerts
Models - 7
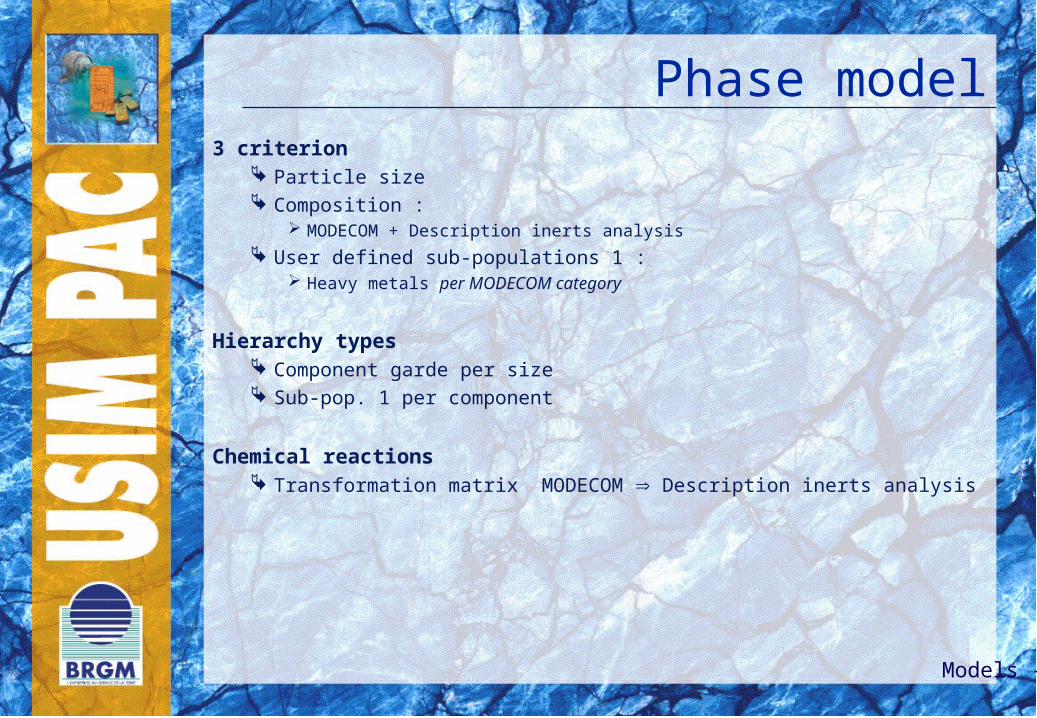
Phase model3 criterion
Particle size Composition :
MODECOM + Description inerts analysis
User defined sub-populations 1 : Heavy metals per MODECOM category
Hierarchy types Component garde per size Sub-pop. 1 per component
Chemical reactions Transformation matrix MODECOM Description inerts analysis
Models - 8
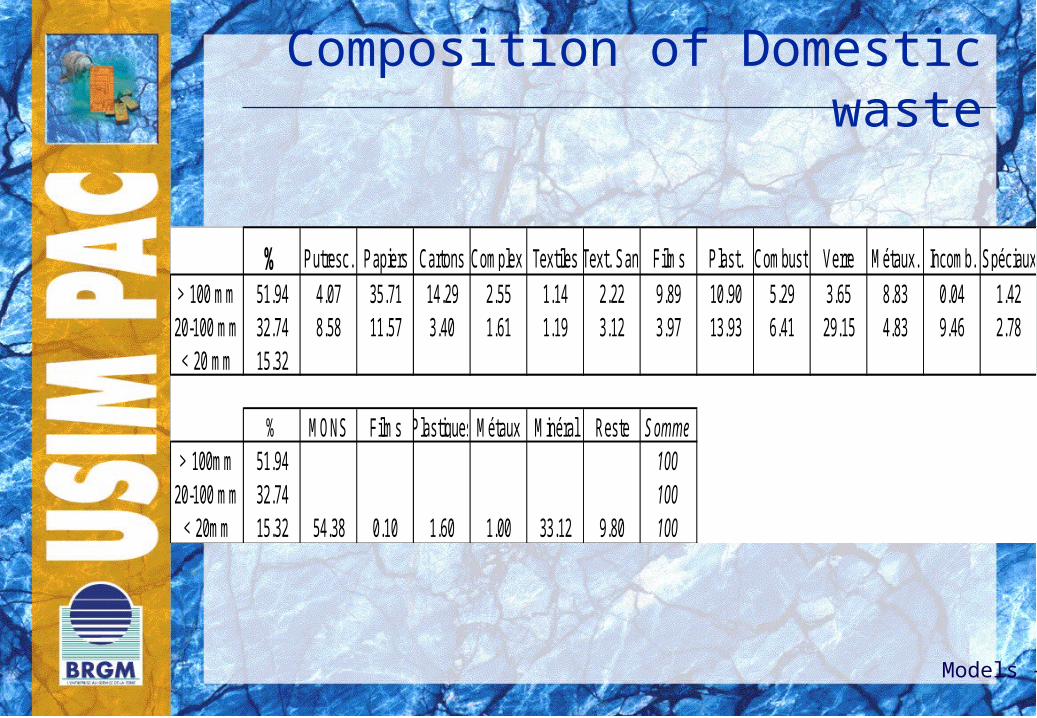
Composition of Domestic waste
% Putresc. Papiers Cartons Complex. Textiles Text. San. Films Plast. Combust. Verre Métaux. Incomb. Spéciaux> 100 mm 51.94 4.07 35.71 14.29 2.55 1.14 2.22 9.89 10.90 5.29 3.65 8.83 0.04 1.4220-100 mm 32.74 8.58 11.57 3.40 1.61 1.19 3.12 3.97 13.93 6.41 29.15 4.83 9.46 2.78
< 20 mm 15.32
% MONS Films Plastiques Métaux Minéral Reste Somme> 100mm 51.94 100
20-100 mm 32.74 100< 20mm 15.32 54.38 0.10 1.60 1.00 33.12 9.80 100

Models - 9
Metals in categories
Cadmium Chrome Cuivre Mercure Nickel Plomb Zincppm ppm ppm ppm ppm ppm ppm
Putrescibles 0.20 56.00 37.00 0.10 0.00 0.00 57.00Papiers 0.06 43.45 43.79 0.03 8.83 5.74 28.17Cartons 0.92 43.82 40.81 0.10 0.00 4.72 105.67Complexes 0.09 48.96 48.89 0.05 0.00 0.00 24.62Textiles 0.20 76.00 63.00 0.00 11.00 18.00 171.00Textiles sanitaires 0.27 65.26 10.33 0.04 0.00 12.62 677.82Films 0.20 42.00 101.00 0.00 14.00 37.00 116.00Autres plastiques 1.14 26.16 1470.50 0.00 6.18 187.78 131.89Combustibles non classés 3.97 621.10 25.98 0.09 0.00 35.31 183.83Verre 0.24 535.61 9.37 0.00 11.25 66.00 29.25Métaux ttx 0.01 408.06 149.89 0.00 143.15 51.07 54.04Incombustibles non classés 0.20 55.00 23.00 0.00 13.00 193.00 37.00Déchets spéciaux 0.40 269.08 201.33 0.05 99.68 111.29 22605.14
Models - 10
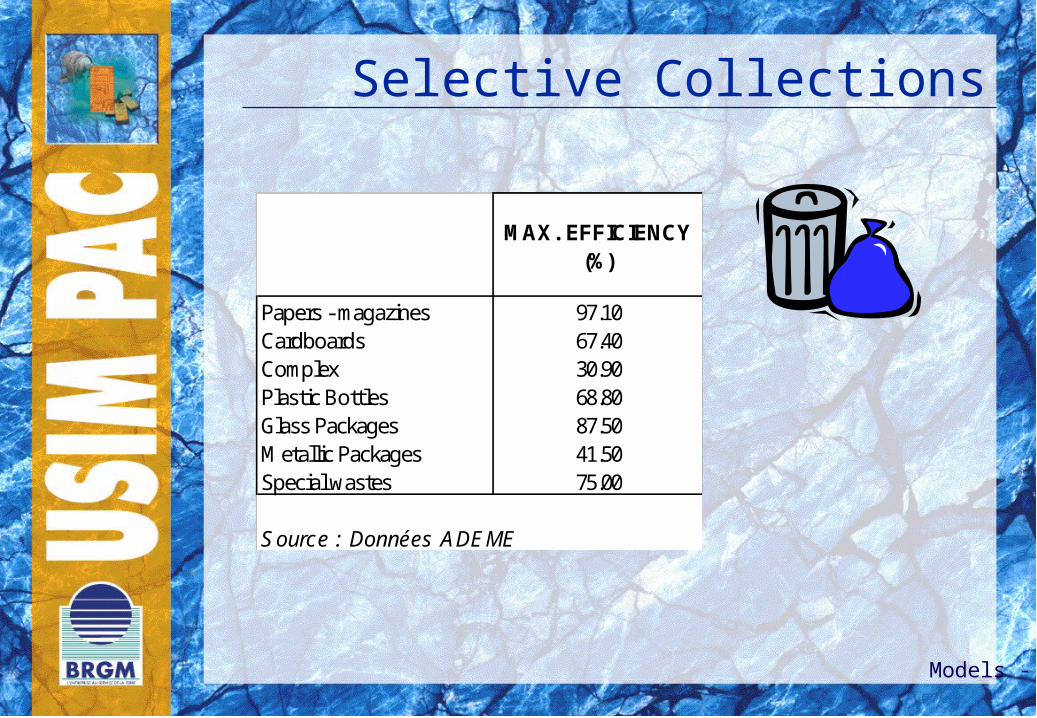
MAX. EFFICIENCY(%)
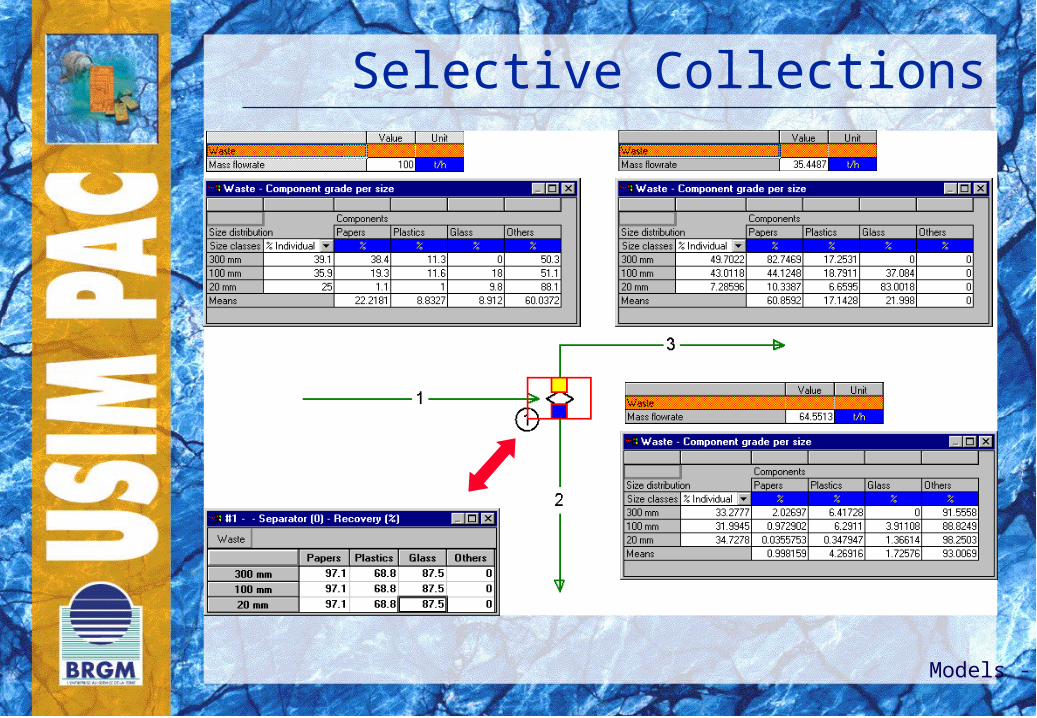
Papers - magazines 97.10Cardboards 67.40Complex 30.90Plastic Bottles 68.80Glass Packages 87.50Metallic Packages 41.50Special wastes 75.00
Source : Données ADEME
Selective Collections
Models - 11
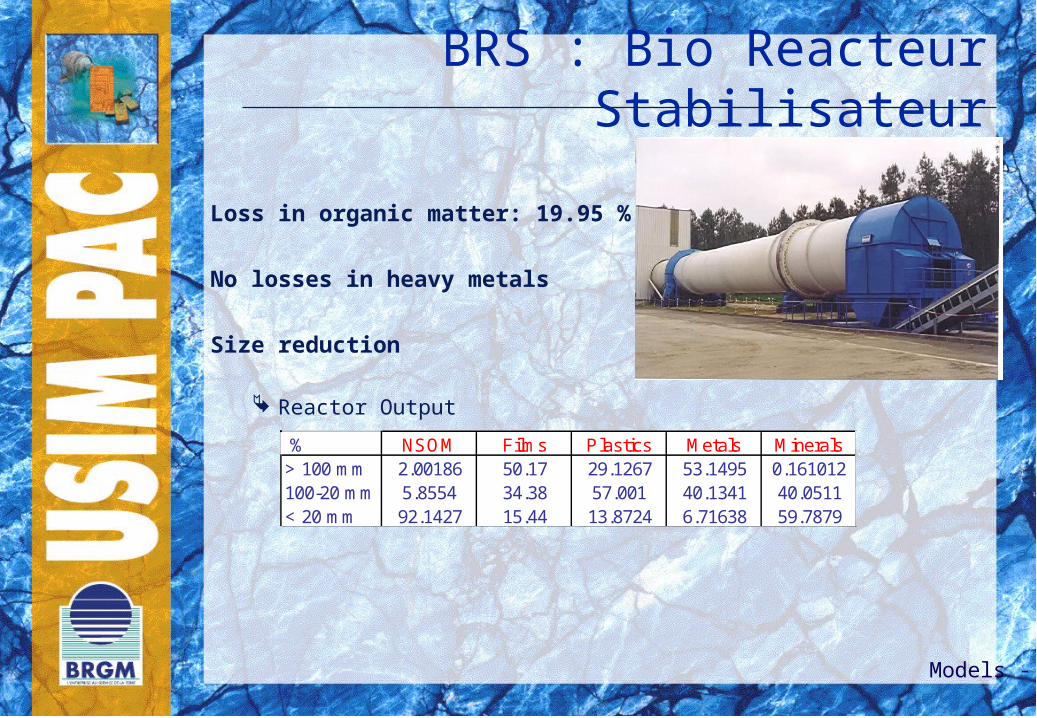
% NSOM Films Plastics Metals Minerals> 100 mm 2.00186 50.17 29.1267 53.1495 0.161012100-20 mm 5.8554 34.38 57.001 40.1341 40.0511< 20 mm 92.1427 15.44 13.8724 6.71638 59.7879
BRS : Bio Reacteur Stabilisateur
Loss in organic matter: 19.95 %
No losses in heavy metals
Size reduction
Reactor Output
Models - 12
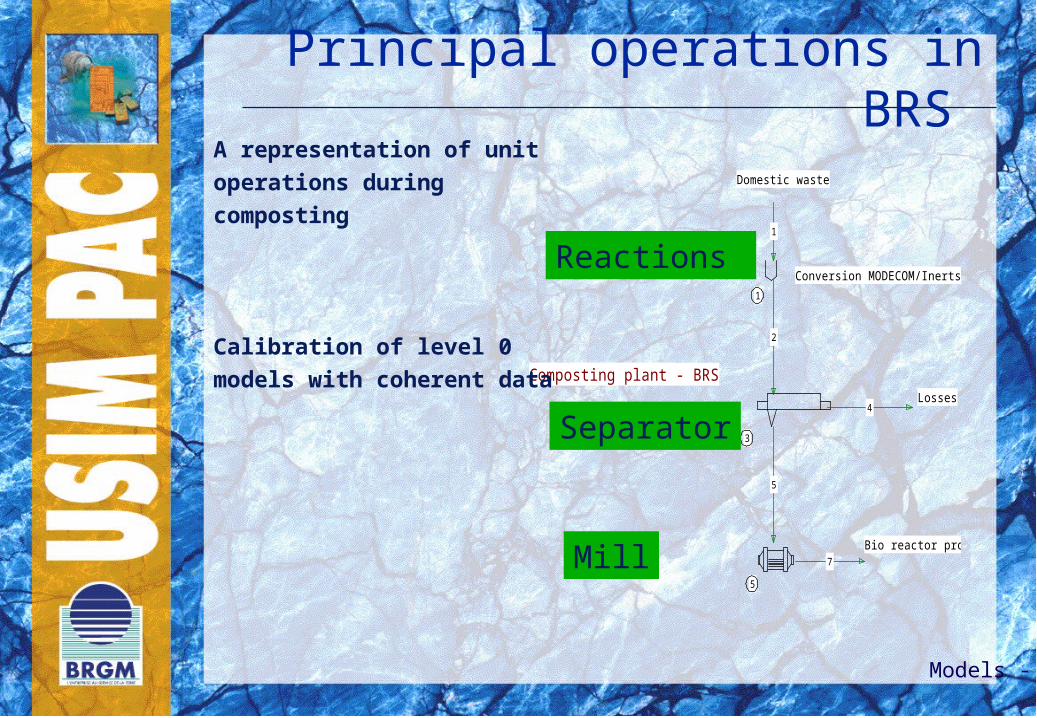
Principal operations in BRS
Losses
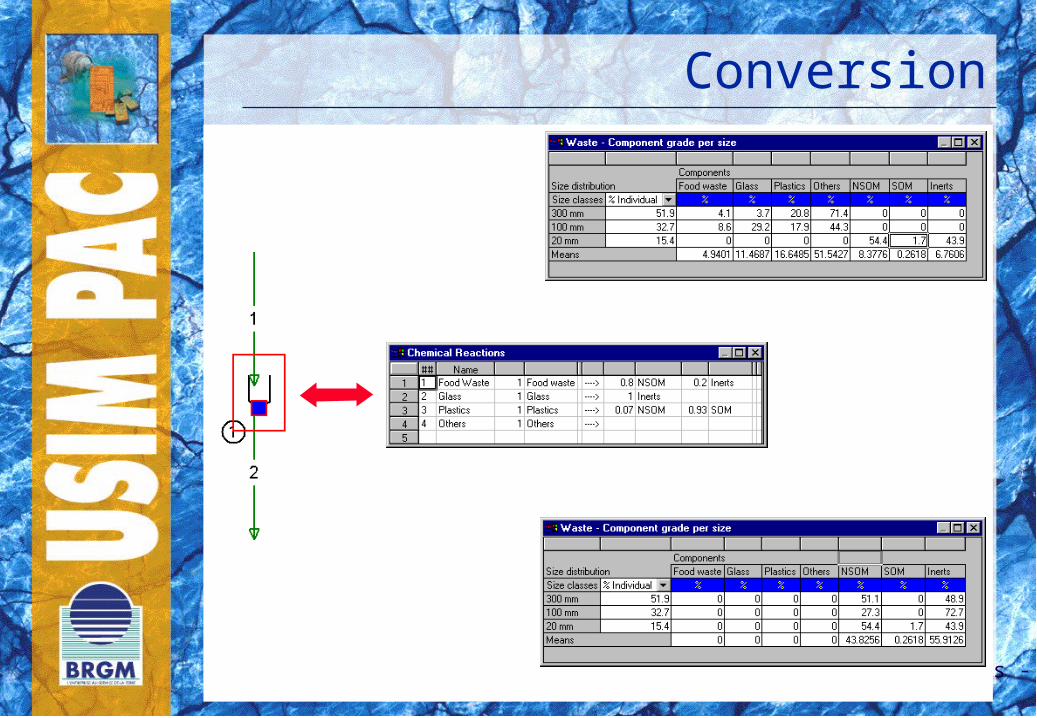
Conversion MODECOM/Inerts
Bio reactor product
Domestic waste
Composting plant - BRS
1
3
5
1
2
4
5
7
A representation of unit
operations during
composting
Calibration of level 0
models with coherent data
Reactions
Separator
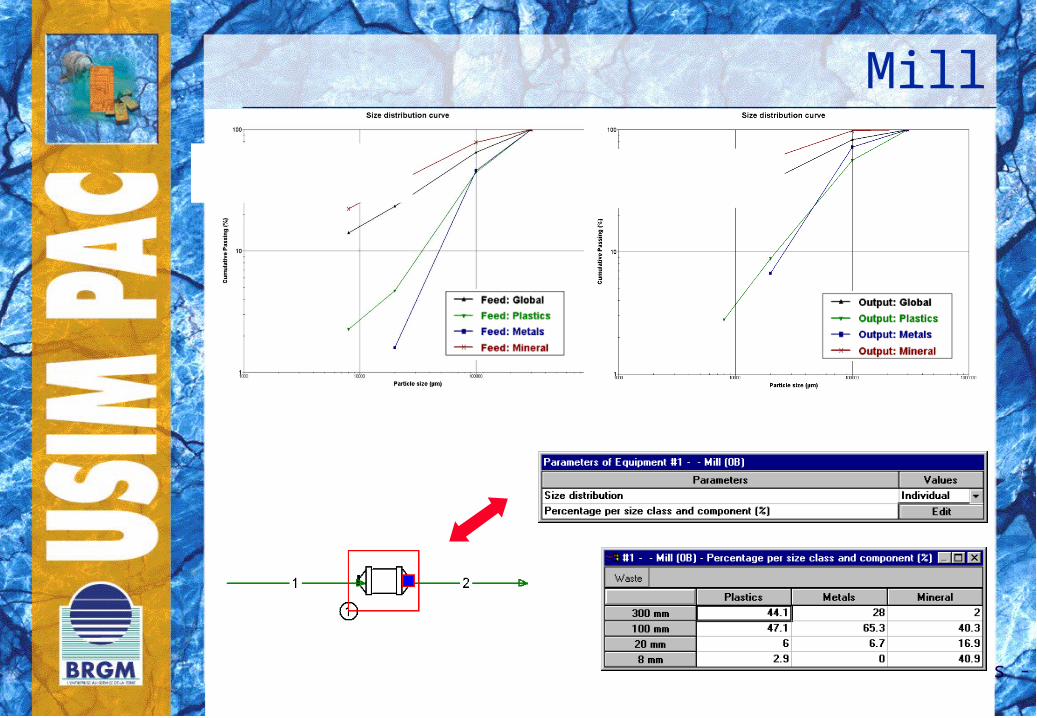
Mill
Models - 13
Conversion

Models - 14
Composting
Models - 15
Mill
Models - 16
Selective Collections
Models - 17
Without SelectiveCollection
With SelectiveCollection
Other standardCERAFEL
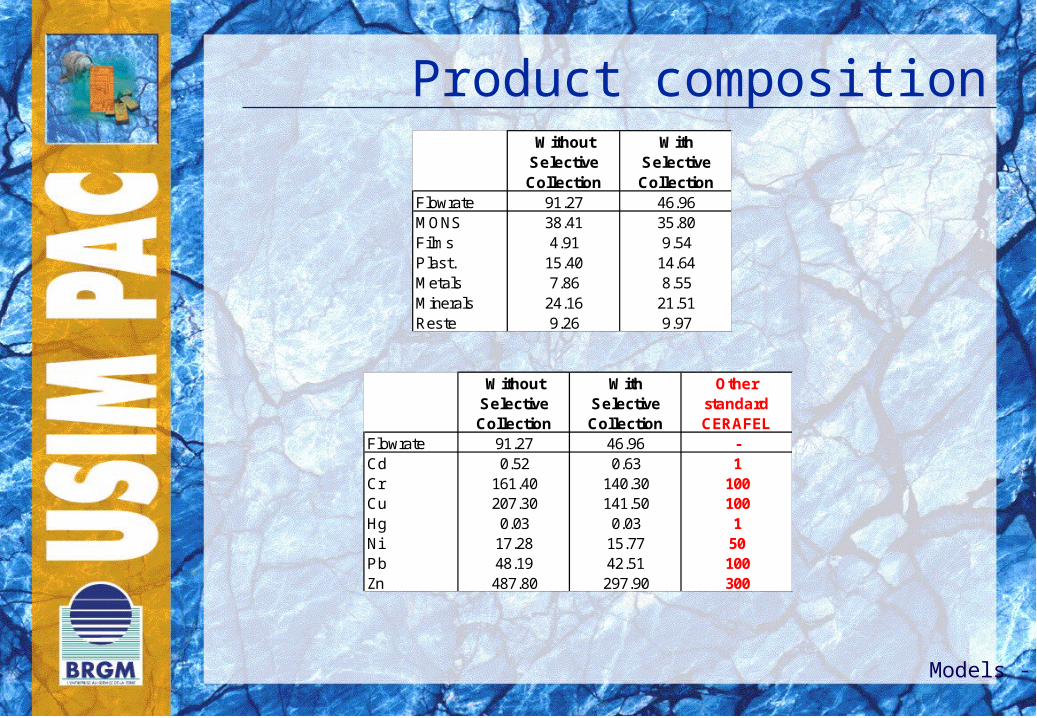
Flowrate 91.27 46.96 -Cd 0.52 0.63 1Cr 161.40 140.30 100Cu 207.30 141.50 100Hg 0.03 0.03 1Ni 17.28 15.77 50Pb 48.19 42.51 100Zn 487.80 297.90 300
Without Selective Collection
With SelectiveCollection
Flowrate 91.27 46.96MONS 38.41 35.80Films 4.91 9.54Plast. 15.40 14.64Metals 7.86 8.55Minerals 24.16 21.51Reste 9.26 9.97
Product composition
Models - 18
Conclusion
Level 0 models allow to reach the objective of simulation
But, simulation results should be compared to reality to estimate their precision (non predictive simulation)
If validated models of level 1, 2 or 3 have been used, results should have been more reliable