Embed Size (px)
DESCRIPTION
Modelling the effect of increasing pCO 2 on pelagic aragonite production and dissolution. Reidun Gangst ø 1,2. 1. Laboratoire des Sciences du Climat et de l'Environnement (LSCE), France 2. Climate and Environmental Physics, Physics Institute, University of Bern, Switzerland. - PowerPoint PPT Presentation
Citation preview

Modelling the effect of increasing pCO2 onpelagic aragonite production and dissolution
1. Laboratoire des Sciences du Climat et de l'Environnement (LSCE), France2. Climate and Environmental Physics, Physics Institute, University of Bern, Switzerland
Reidun Gangstø1,2
3rd CARBOOCEAN annual meeting Bremen 2007
Marion Gehlen1, Birgit Schneider1, Laurent Bopp1, Fortunat Joos2 and Olivier Aumont (LOCEAN)

Ocean Acidification
The surface water in the Southern Ocean may be undersaturated with respect to ARAGONITE within this century (Orr et al., 2005)
Pteropod: Limacina helicina (AWI)
Aragonite saturation state, Δ[CO32-]a (μmol/kg)
CO2 + H2O + CO32- <-> 2 HCO3
-
Calcification (Ω>1) / dissolution (Ω<1):
Ca2+ + CO32- <-> CaCO3
CO32-
CO32-
satc/a
Calcite/aragonite saturation state:
Ωc/a ≈
Ω>1: supersaturation, Ω<1: undersaturation

Questions:
• What role does aragonite play in the total CaCO3 budget?
• How much will future changes in saturation state affect the pelagic production and dissolution of aragonite?

Implementing aragonite in the marine biogeochemical model PISCES
aragonite
CaCO3 production:• calcifying plankton is not
included as a distinct
functional type
• calcification is assigned to:
1. nanophytoplankton = calcite
2. mesozooplankton = aragonite
• aragonite: 1/3 of total CaCO3
Literature: 10-50%
e.g. Berner (1977), Berger (1978), Berner &
Honjo (1981), Betzer et al. (1984), Fabry
(1989, 1990), Fabry and Deuser (1991),
Fischer et al. (1996)
calcite
Aumont and Bopp (2006), Gehlen et al. (2007)
PO43-
Diatoms
Micro-zoo
P.O.M
D.O.M
Si
IronNano-phyto
Meso-zoo
NO3-
NH4+
Small Ones Big Ones
CaCO3

CaCO3 dependency on saturation state Ω
nDISS Ω)(1k=R
(PIC/POC)max=0.8, Kmax=0.4
based on experiments with E. huxleyi (Delille et al., 2005; Zondervan et al., 2002)
1. Calcification, Ω>1: 2. Dissolution, 0<Ω<1:
k=10.9 day-1, n=1
derived from sediment trap data (Gehlen et al., 1999; 2006; Dittert et al., 2005)
1)(ΩK
1)(Ω )
POC
PIC ( =
POC
PIC
maxmax
Gehlen et al., 2007PIC = particulate inorganic carbonPOC = particulate organic carbon

Aragonite production
Production (mgC/m2/d) averaged over depth
Average modelled aragonite production:2.4 mgC/m2/d

The CaCO3 budget
*1) Lee (2001), *2) Berelson et al. (2007), *4) Sarmiento et al. (2002),
*4) Feely et al. (2004), *5) Gehlen et al. (2007)
gross CaCO3 production
net CaCO3 production
*1) *2)
Literature(all fluxes are in PgC/yr)
1.27 0.87 0.5 - 1.6
1.31 0.79
0.32 0.30.31lower boundary flux *4)
CAL ARAG
*4)
100 mCaCO3 export flux
0.63 0.60.56*3)
CaCO3 dissolution 0.550.48 0.5 ± 0.2
CAL: calcite only *5)
ARAG: calcite +aragonite

CaCO3 dissolution
* Feely et al. (2004)
60% of pelagic diss.depth < 2000 m
58% of pelagic diss.depth < 2000 m
38% of pelagic diss.depth < 2000 m
0.23
0.32
2 km
0.18
0.30
Including aragonite in the PISCES model improves
the vertical distribution of CaCO3 dissolution
PISCES: calcite only
PISCES: both calcite and aragonite
CaCO3 dissolution (μmolCkg-1y-1)
(Gehlen et al., 2007)
CaCO3 dissolution(PgC/yr)
*

Experimental setup: Transient experiments
+
Run 1:• Increasing pCO2 over 240 years from 1860 to 2100 (historical development and A2 scenario)• calcification and dissolution dependent on saturation state• no climate change• offline simulation (NEMO/PISCES)
Run 2:• control run without additional CO2-forcing
Year2000
HistoricalpCO2
A2-scenario
Controlrun

Changes in surface ocean Ω with increasing pCO2
Year 1860
Ωcalcite (0-100m) Ωaragonite (0-100m)
Ωa=1Ωc=1 Year 2100
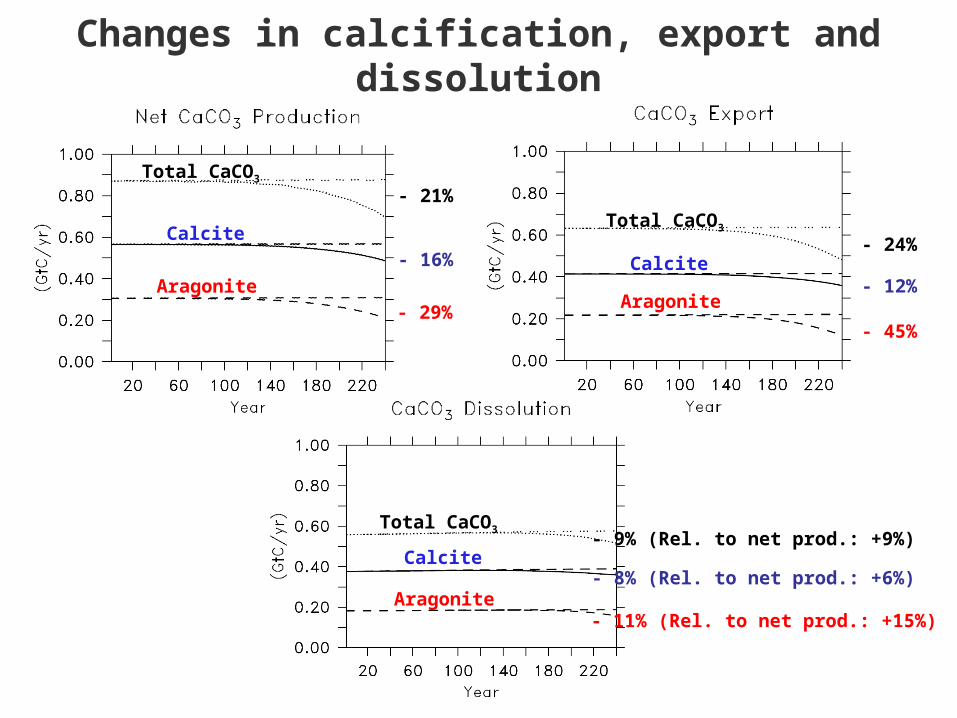
- 29%
- 16%
- 21%Total CaCO3
Calcite
Aragonite
- 45%
- 12%
- 24%Total CaCO3
Calcite
Aragonite
Total CaCO3
Calcite
Aragonite- 11% (Rel. to net prod.: +15%)
- 8% (Rel. to net prod.: +6%)
- 9% (Rel. to net prod.: +9%)
Changes in calcification, export and dissolution

Conclusions 1: Initial state
• With aragonite implemented in the PISCES model:
- The modelled aragonite production correspond quite well to available literature estimates
- Total CaCO3 production, export and dissolution fit observations
- The implementation of aragonite to PISCES improves the vertical distribution of pelagic dissolution
- The dissolution of aragonite potentially contributes significantly to shallow water dissolution
- The role of aragonite in the global carbonate budget needs to be assessed
- More data is needed!

Conclusions 2: Transient Experiments
• Under an A2 scenario:
- Ω in the surface water strongly decreases
- Aragonite production is reduced by almost 1/3, export by almost 1/2
- The reduction in total CaCO3 production and export is > 20%
- Pelagic CaCO3 dissolution slightly decreases due to less available material, but increases relative to the production
- The response of pteropods to changes in carbonate chemistry needs to be investigated
• Future project:
- Further analyses of scenarios including climate change
- Sensitivity studies with the recently coupled Bern3D-PISCES model
3rd CARBOOCEAN annual meeting Bremen 2007 – [email protected]


The calcium carbonate (CaCO3) system
Ocean acidification
Calciteproduction
Calcitedissolution
Aragoniteproduction
Aragonitedissolution
[CO2 ] + H2O + [CO32-] <-> 2 [HCO3
- ]