Embed Size (px)
Citation preview
Modelling Needs and Resources of Older People to 2030 (MAP2030)
In the UK the number of people over state pension age is projected to rise by about 50% in the next 25 years. The number aged 80 and over, where care needs are greatest, is set to more than double. The financial, family, social and health resources of the older population have substantial implications for the well-being of those concerned and for public policy, but consistent projections of their likely future circumstances are lacking. This ESRC-funded project funded as part of the New Dynamics of Ageing (NDA) programme which is based at a number of institutions and includes demographers, epidemiologists, social policy specialists, economists and epidemiologists. Key issues investigated include how trends in mortality and morbidity will evolve, and if the extra years of life will be lived in good health; the consequences of increased family fragility on the availability of informal sources of care and for older people's social participation; and the willingness and ability of people to save for their old age. Statistical analyses is used increase our understanding of trends in the relationships between the determinants of needs and resources: mortality, disease and disability; household/family formation and kinship; family support and the availability and need for informal care; the accumulation and distribution of income and assets in later life, and how they differ between socio-economic and income groups. The project uses simulation models to project up to 2030 the numbers, family circumstances, income, pensions, savings and care needs (formal and informal), the key determinants of the resources and needs of older people. Special attention is given to the inter-relationships between care needs (and their determinants) and economic resources in later life, and to the affordability, and distribution of costs and benefits, since for the first time, long-term care and pensions policy options may be analysed together - including co-payments systems for long-term care, and proposals in the Pensions Commission Report and the Social Care Green Paper of 2009. For further details, see http://www.lse.ac.uk/collections/MAP2030/ Applicants: Michael Murphy1 Adelina Comas-Herrera2, Chris Curry3 , Emily Grundy4, Ruth Hancock5, Carol Jagger6, Derek King2, James Lindesay7, Juliette Malley2, Linda Pickard2, and Raphael Wittenberg2 1 London School of Economics and Political Science 2 Personal Social Services Research Unit (PSSRU) at the London School of Economics (LSE) 3 Pensions Policy Institute 4 London School of Hygiene and Tropical Medicine 5 University of East Anglia 6 University of Newcastle; 7 University of Leicester
MAP2030 17 June 2010 Murphy & Di Cesare 1
Modelling Ageing Populations to 2030 (MAP2030)
Introduction and the trends in number of older people to 2030
Mike Murphy & Mariachiara Di CesareLSE
Prepared for MAP2030 Final Conference, LSE 17th June 2010
Some Recent Initiatives
Royal Commission on Long-Term Care Wanless IWanless IIPensions CommissionFree personal care in ScotlandGreen Paper on LTCWhite Paper on LTCNew Government, 2010 …
MAP2030 17 June 2010 Murphy & Di Cesare 2
To produce high quality analysis to inform public debate and development of future long-term care and pensions policy up to 2030 by:
• projecting the numbers, disability status, family circumstances, income, savings and care needs of older people
• assessing the affordability and distribution of costs and benefits of combined policy options for pensions and long-term care
• accounting for links between care needs and economic resources in later life
MAP2030 Programme Objectives
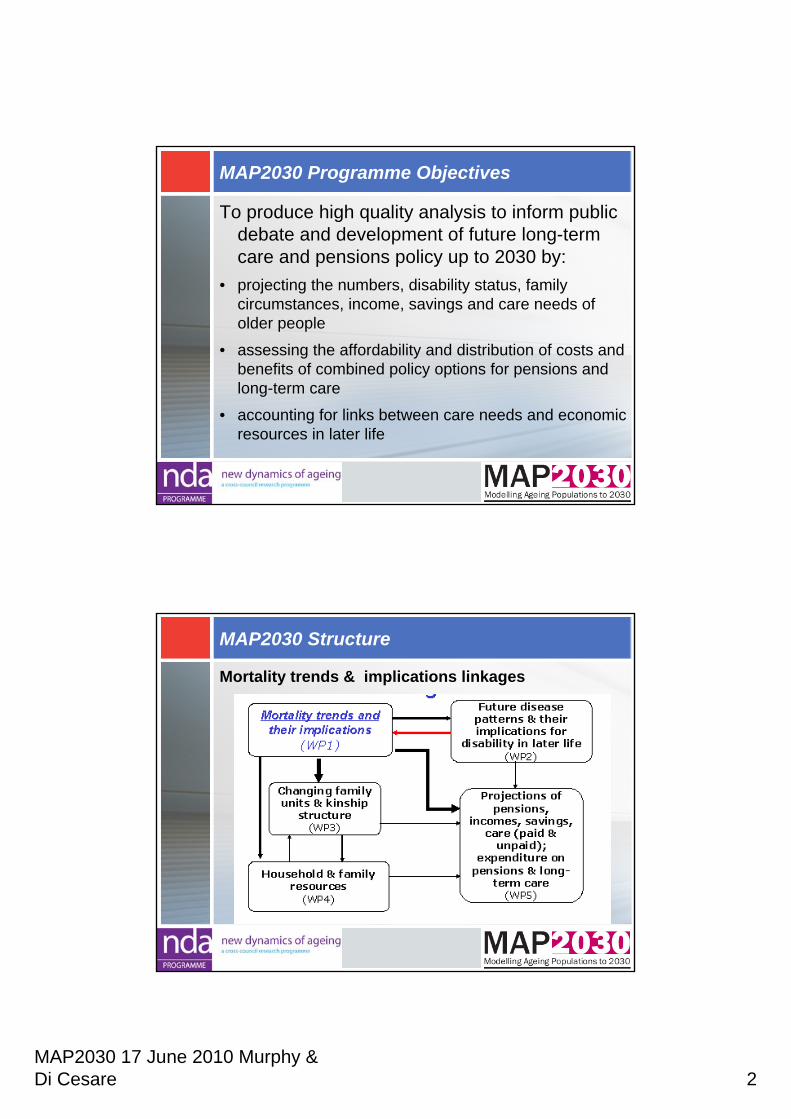
MAP2030 Structure
Mortality trends & implications linkages
MAP2030 17 June 2010 Murphy & Di Cesare 3
Methods
•an integrated programme of new statistical analysis and modelling
•building on pre-existing models
•sensitivity testing to key trends
•scenarios on key unknowns
The Applicants
Mike Murphy LSE & Raphael Wittenberg, Adelina Comas-Herrera, Linda Pickard, Derek King, Juliette Malley, PSSRUCarol Jagger & James Lindesay, Newcastle & LeicesterEmily Grundy, LSHTMRuth Hancock, East Anglia & EssexChris Curry, PPIPlusDepartment for Work and PensionsThanks also to researchers who worked on the project
MAP2030 17 June 2010 Murphy & Di Cesare 4
Future needs and resources of the older population: domains and interactions• accumulation and distribution of income & assets• ability to meet care costs• how trends in mortality and morbidity will evolve & will
the extra years of life will be lived in good health?• the consequences of family change for the availability
of informal care & social participation• availability and need for informal & formal care• how these domains:
– are inter-related– differ between socio-economic and income groups– influence, and are influenced by policy
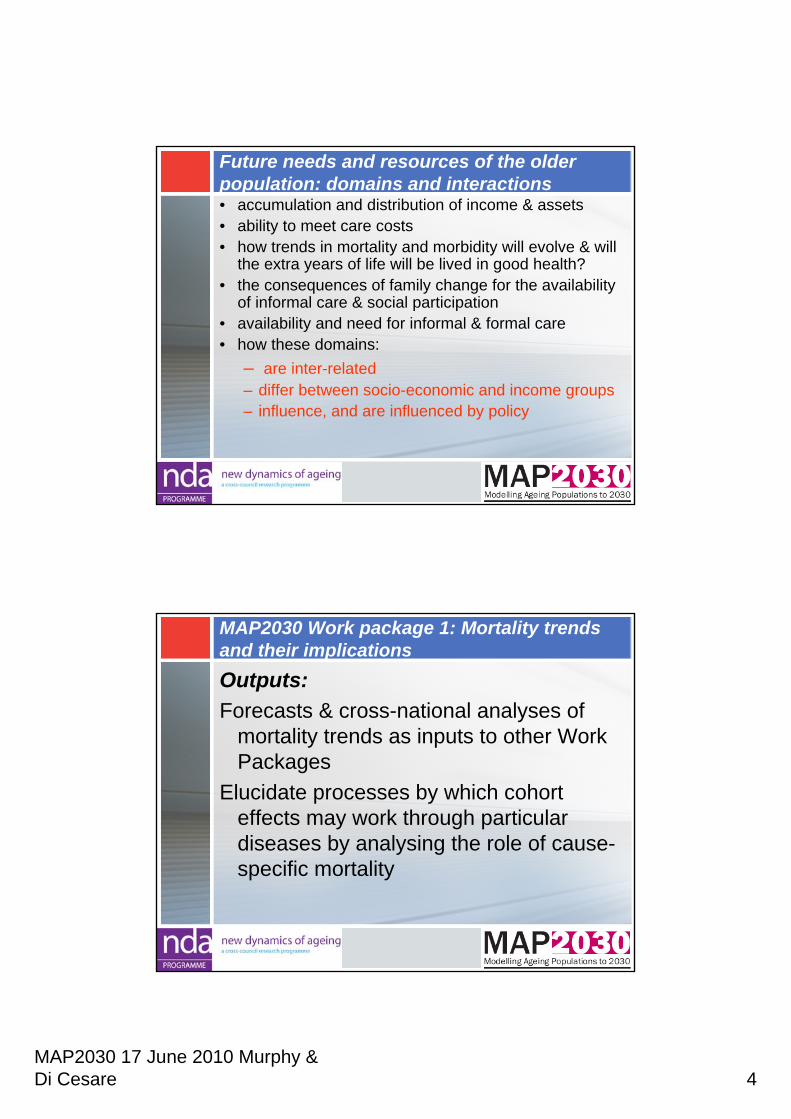
MAP2030 Work package 1: Mortality trends and their implicationsOutputs:Forecasts & cross-national analyses of
mortality trends as inputs to other Work Packages
Elucidate processes by which cohort effects may work through particular diseases by analysing the role of cause-specific mortality
MAP2030 17 June 2010 Murphy & Di Cesare 5
In the next 25 years (2006-2031)
Total UK expected population growth approx 10.3 million1.2 million more children (0-19)3.0 million more ‘working age’ (20-64)6.2 million more older people (65 & over)
– of which 2.8 million 80 & over
Based on Office for National Statistics 2008-based projections (http://www.gad.gov.uk/) – Note higher than EU
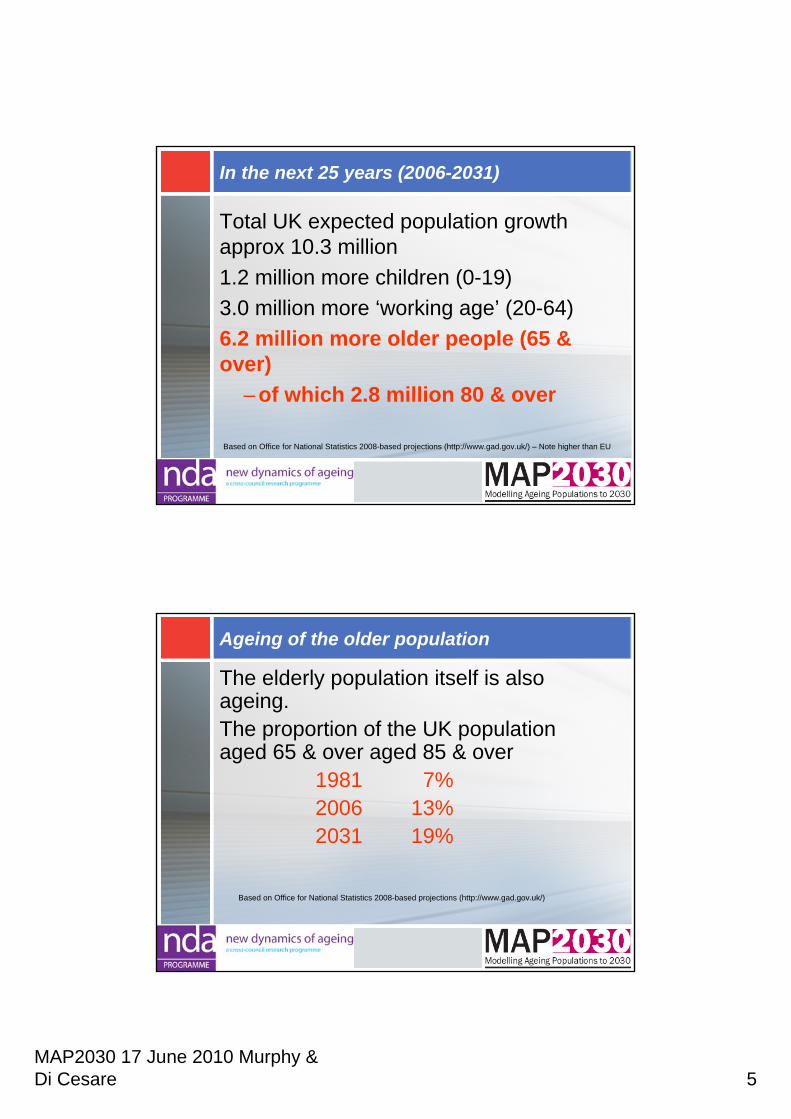
Ageing of the older population
The elderly population itself is also ageing. The proportion of the UK population aged 65 & over aged 85 & over
1981 7%2006 13%2031 19%
Based on Office for National Statistics 2008-based projections (http://www.gad.gov.uk/)
MAP2030 17 June 2010 Murphy & Di Cesare 6
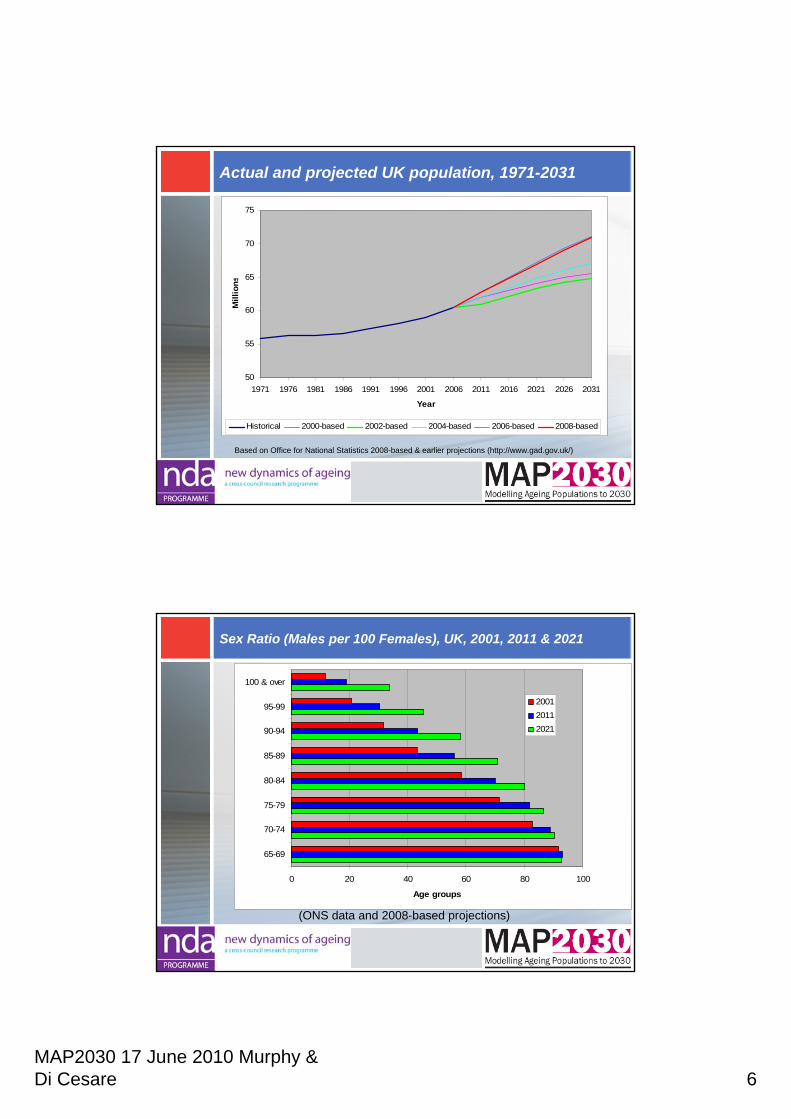
Actual and projected UK population, 1971-2031
50
55
60
65
70
75
1971 1976 1981 1986 1991 1996 2001 2006 2011 2016 2021 2026 2031
Year
Mill
ions
Historical 2000-based 2002-based 2004-based 2006-based 2008-based
Based on Office for National Statistics 2008-based & earlier projections (http://www.gad.gov.uk/)
Sex Ratio (Males per 100 Females), UK, 2001, 2011 & 2021
0 20 40 60 80 100
65-69
70-74
75-79
80-84
85-89
90-94
95-99
100 & over
Age groups
200120112021
(ONS data and 2008-based projections)
MAP2030 17 June 2010 Murphy & Di Cesare 7
Mortality drives numbers of older people so what may happen to death rates at old ages?
•The Present– Substantial improvement recently– Sex differentials are declining
•The Future– Continuation of trends?– Accuracy of predictions?
•Implications
The choices
“There is the possibility of lower incidences of cancer, heart disease and strokes through changes in lifestyle and medical advances
On the other hand some demographers believe that … a law of diminishing returns will apply to death rate reductions at advanced ages”
(Office for National Statistics, 2008, National Population Projections 2006-based Series PP2 No 26, ed. Helen Bray, p. 33)
MAP2030 17 June 2010 Murphy & Di Cesare 8
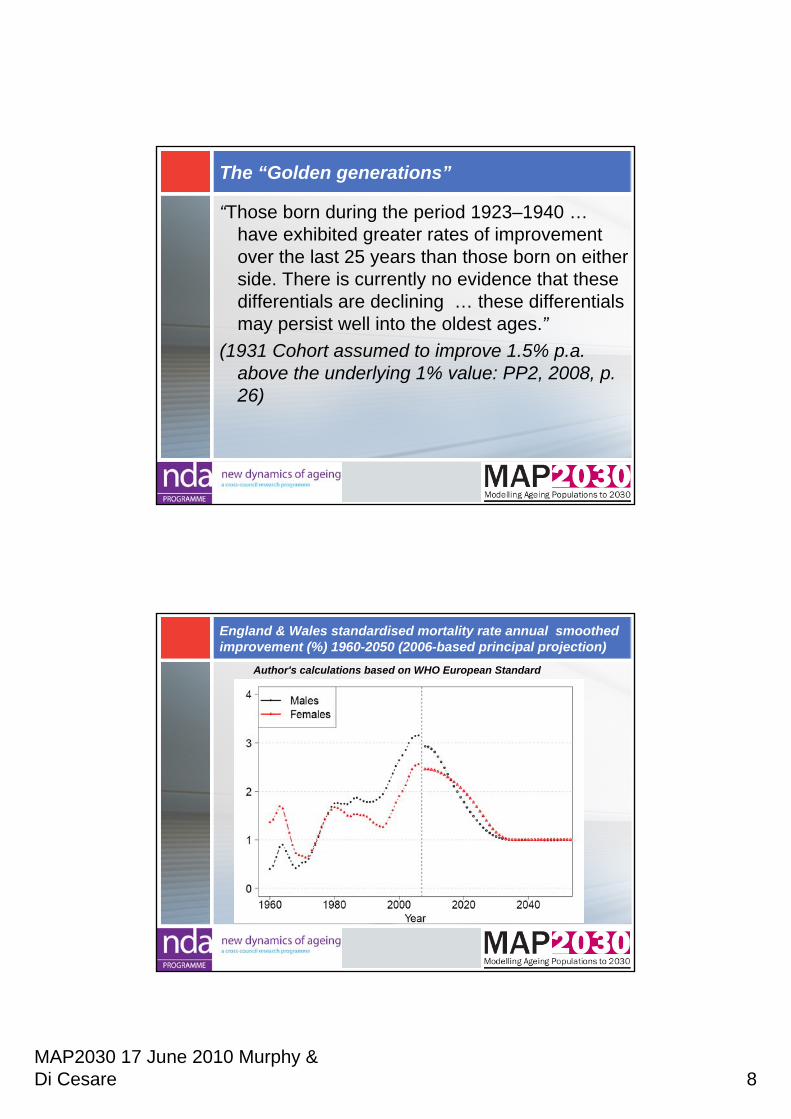
The “Golden generations”
“Those born during the period 1923–1940 …have exhibited greater rates of improvement over the last 25 years than those born on either side. There is currently no evidence that these differentials are declining … these differentials may persist well into the oldest ages.”
(1931 Cohort assumed to improve 1.5% p.a. above the underlying 1% value: PP2, 2008, p. 26)
England & Wales standardised mortality rate annual smoothed improvement (%) 1960-2050 (2006-based principal projection)
Author's calculations based on WHO European Standard
MAP2030 17 June 2010 Murphy & Di Cesare 9
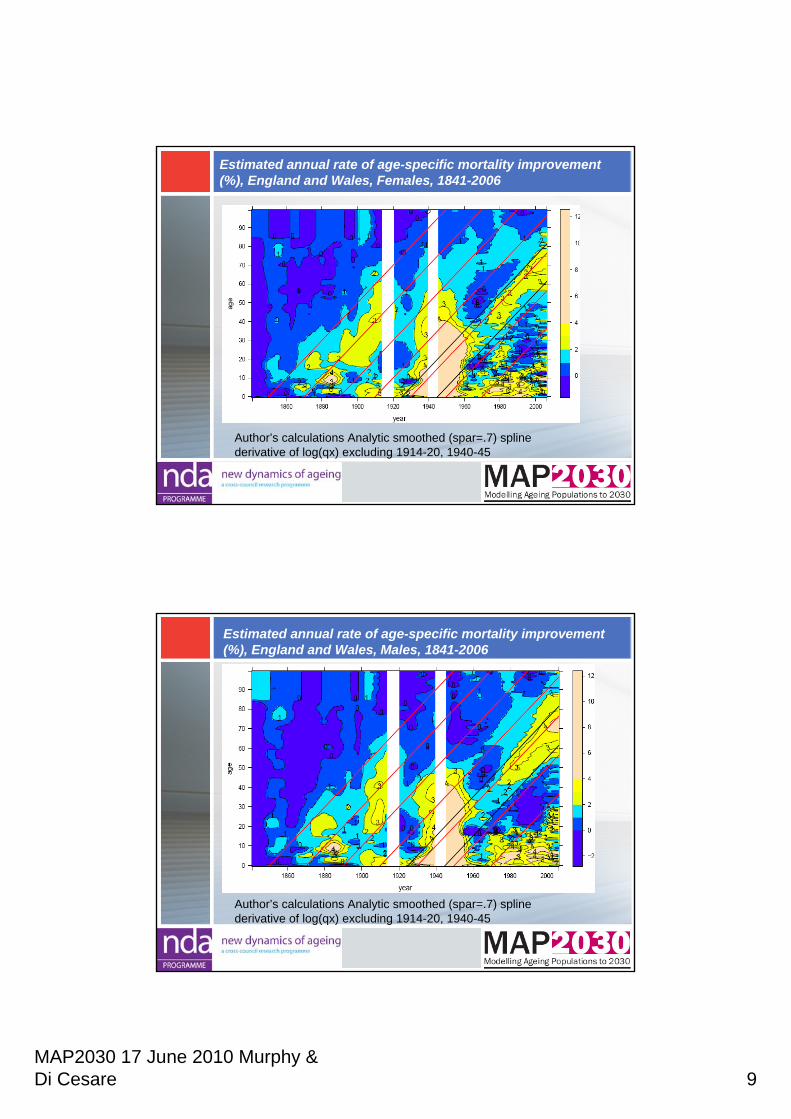
Estimated annual rate of age-specific mortality improvement (%), England and Wales, Females, 1841-2006
Author’s calculations Analytic smoothed (spar=.7) spline derivative of log(qx) excluding 1914-20, 1940-45
Estimated annual rate of age-specific mortality improvement (%), England and Wales, Males, 1841-2006
Author’s calculations Analytic smoothed (spar=.7) spline derivative of log(qx) excluding 1914-20, 1940-45
MAP2030 17 June 2010 Murphy & Di Cesare 10
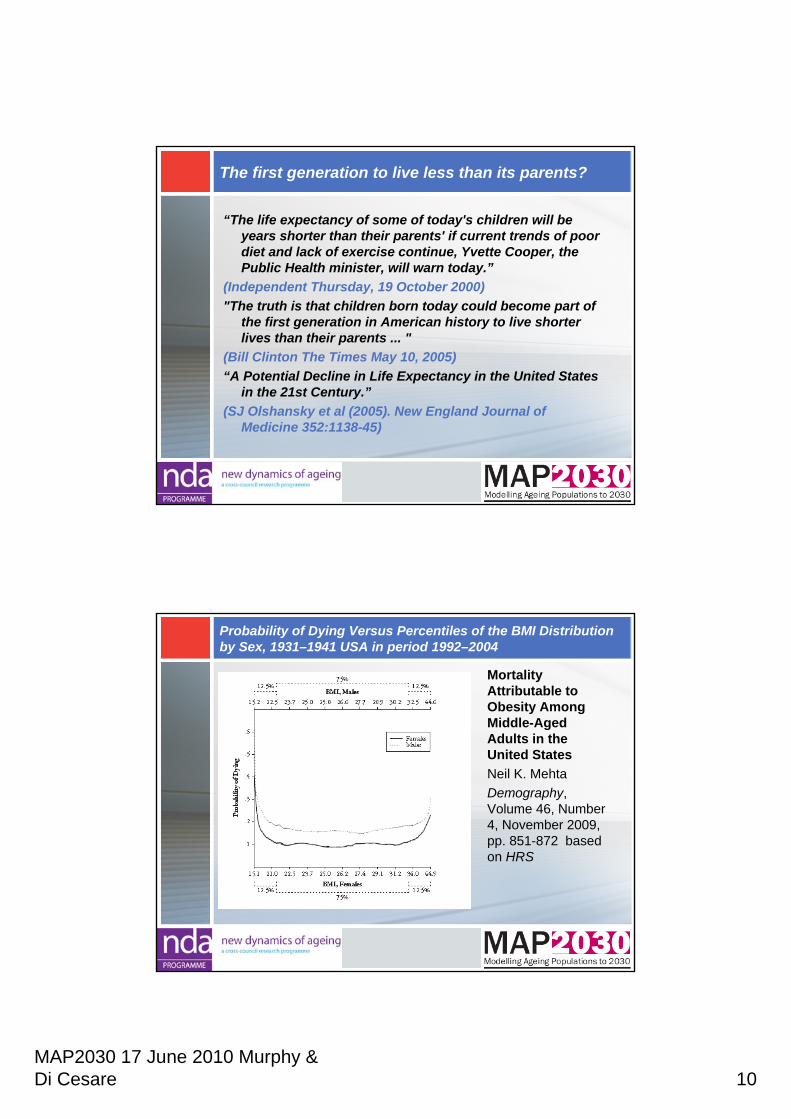
The first generation to live less than its parents?
“The life expectancy of some of today's children will be years shorter than their parents' if current trends of poor diet and lack of exercise continue, Yvette Cooper, the Public Health minister, will warn today.”
(Independent Thursday, 19 October 2000)"The truth is that children born today could become part of
the first generation in American history to live shorter lives than their parents ... "
(Bill Clinton The Times May 10, 2005)“A Potential Decline in Life Expectancy in the United States
in the 21st Century.”(SJ Olshansky et al (2005). New England Journal of
Medicine 352:1138-45)
Probability of Dying Versus Percentiles of the BMI Distribution by Sex, 1931–1941 USA in period 1992–2004
Mortality Attributable to Obesity Among Middle-Aged Adults in the United StatesNeil K. MehtaDemography, Volume 46, Number 4, November 2009, pp. 851-872 based on HRS
MAP2030 17 June 2010 Murphy & Di Cesare 11
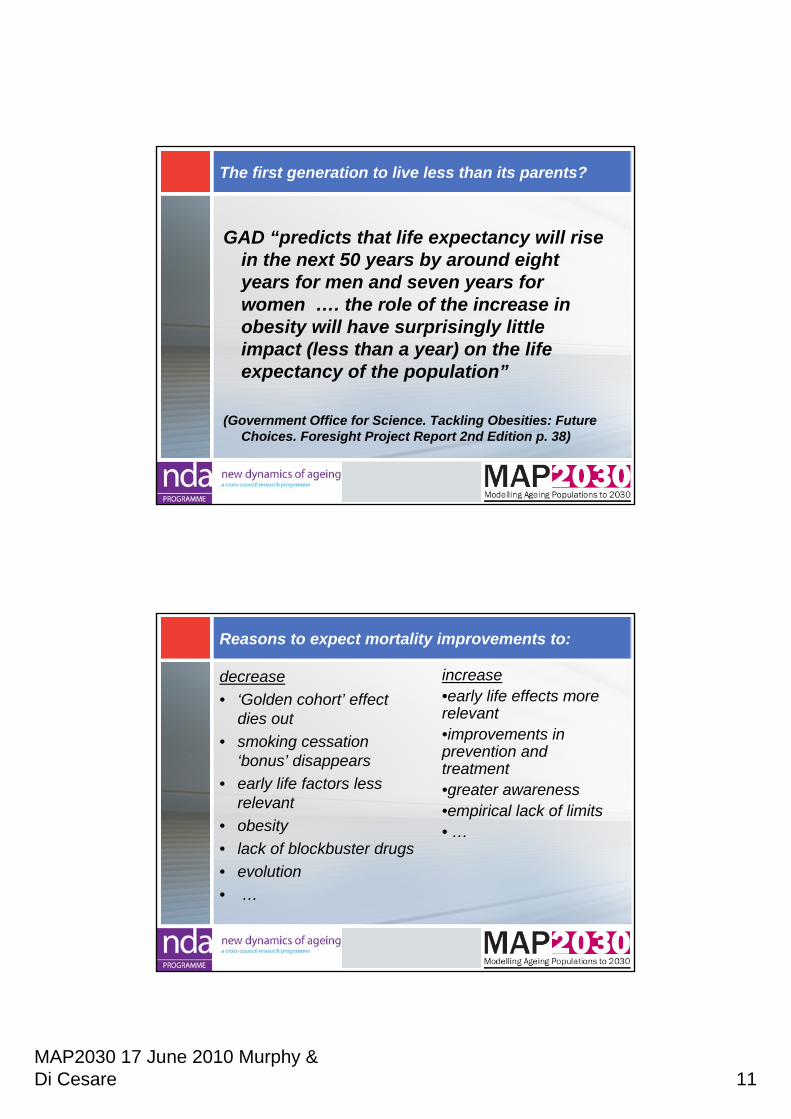
The first generation to live less than its parents?
GAD “predicts that life expectancy will rise in the next 50 years by around eight years for men and seven years for women …. the role of the increase in obesity will have surprisingly little impact (less than a year) on the life expectancy of the population”
(Government Office for Science. Tackling Obesities: Future Choices. Foresight Project Report 2nd Edition p. 38)
Reasons to expect mortality improvements to:
increase•early life effects more relevant•improvements in prevention and treatment•greater awareness•empirical lack of limits • …
decrease• ‘Golden cohort’ effect
dies out• smoking cessation
‘bonus’ disappears• early life factors less
relevant• obesity• lack of blockbuster drugs• evolution• …
MAP2030 17 June 2010 Murphy & Di Cesare 12
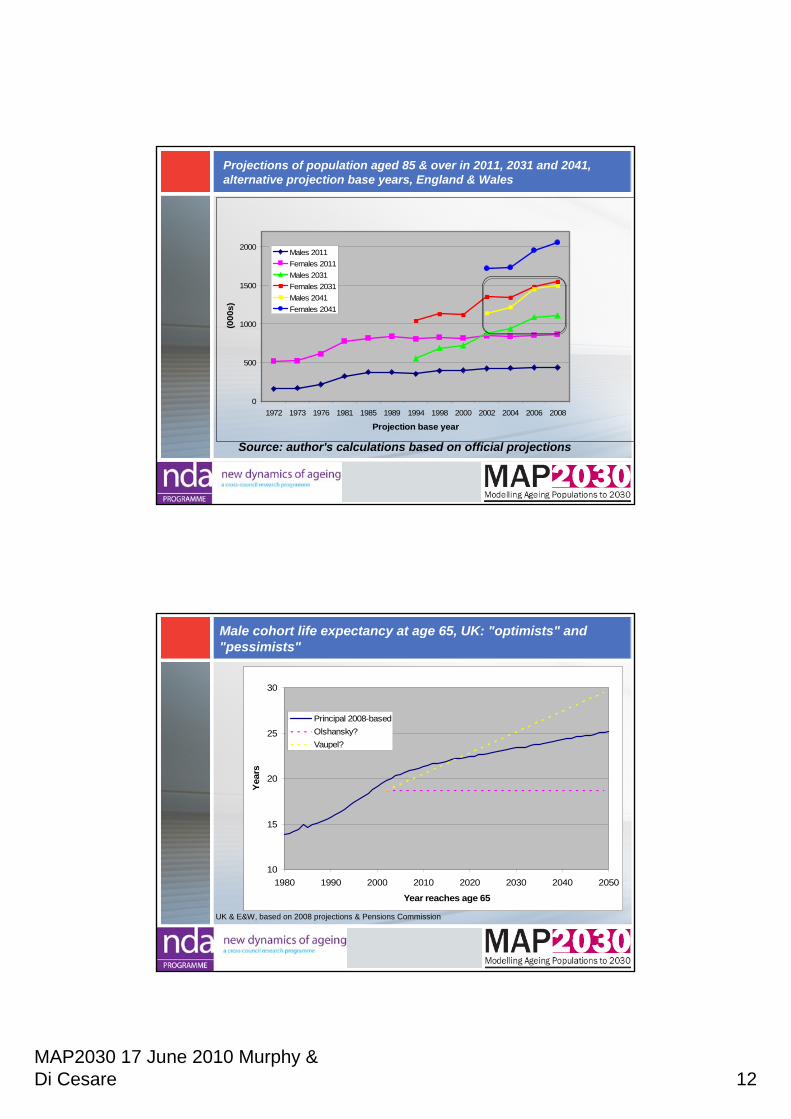
Projections of population aged 85 & over in 2011, 2031 and 2041,alternative projection base years, England & Wales
Source: author's calculations based on official projections
0
500
1000
1500
2000
1972 1973 1976 1981 1985 1989 1994 1998 2000 2002 2004 2006 2008
Projection base year
(000
s)
Males 2011Females 2011Males 2031Females 2031Males 2041Females 2041
Male cohort life expectancy at age 65, UK: "optimists" and "pessimists"
10
15
20
25
30
1980 1990 2000 2010 2020 2030 2040 2050
Year reaches age 65
Year
s
Principal 2008-basedOlshansky?Vaupel?
UK & E&W, based on 2008 projections & Pensions Commission
MAP2030 17 June 2010 Murphy & Di Cesare 13
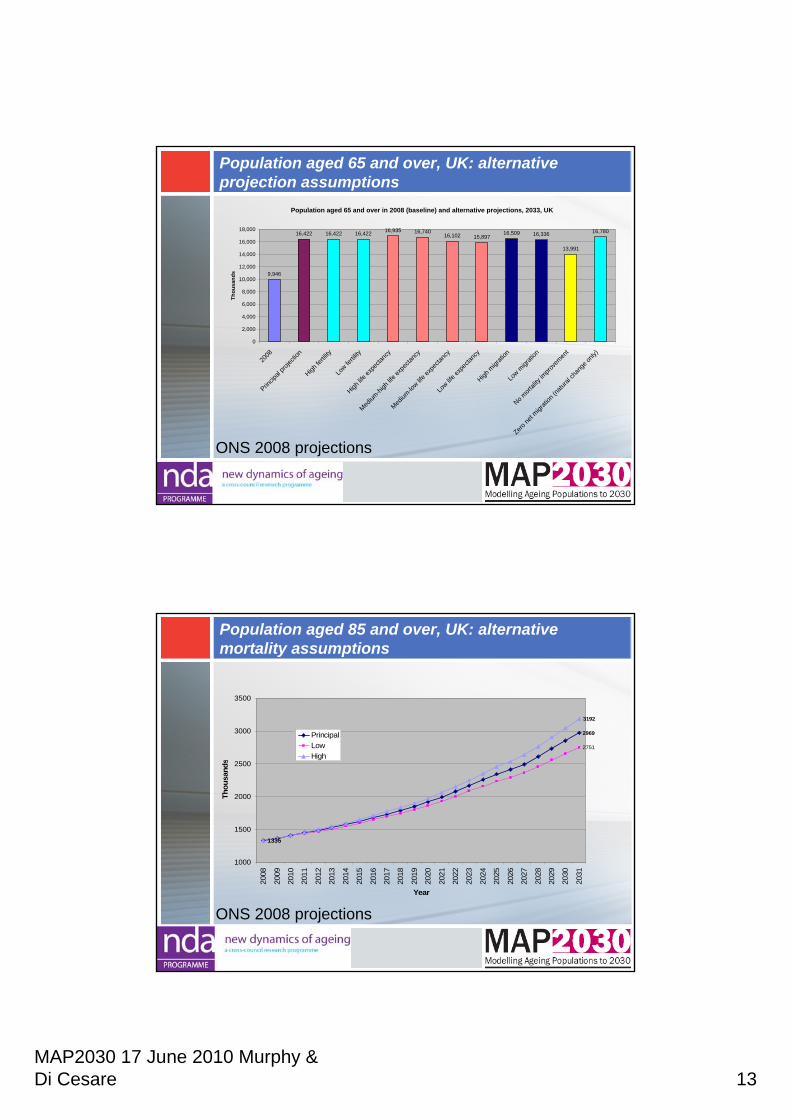
Population aged 65 and over, UK: alternative projection assumptions
ONS 2008 projections
Population aged 65 and over in 2008 (baseline) and alternative projections, 2033, UK
9,946
16,422 16,422 16,422 16,935 16,74016,102 15,897
16,509 16,336
13,991
16,780
0
2,000
4,000
6,000
8,000
10,000
12,000
14,000
16,000
18,000
2008
Princip
al pro
jectio
n
High fe
rtility
Low fe
rtility
High lif
e exp
ectan
cy
Medium
-high
life e
xpec
tancy
Medium
-low lif
e exp
ectan
cy
Low lif
e exp
ectan
cy
High m
igrati
on
Low m
igrati
on
No mort
ality
impro
vemen
t
Zero ne
t migr
ation
(natu
ral ch
ange
only)
Thou
sand
s
Population aged 85 and over, UK: alternative mortality assumptions
ONS 2008 projections
2969
2751
1335
3192
1000
1500
2000
2500
3000
3500
2008
2009
2010
2011
2012
2013
2014
2015
2016
2017
2018
2019
2020
2021
2022
2023
2024
2025
2026
2027
2028
2029
2030
2031
Year
Thou
sand
s
PrincipalLowHigh
MAP2030 17 June 2010 Murphy & Di Cesare 14
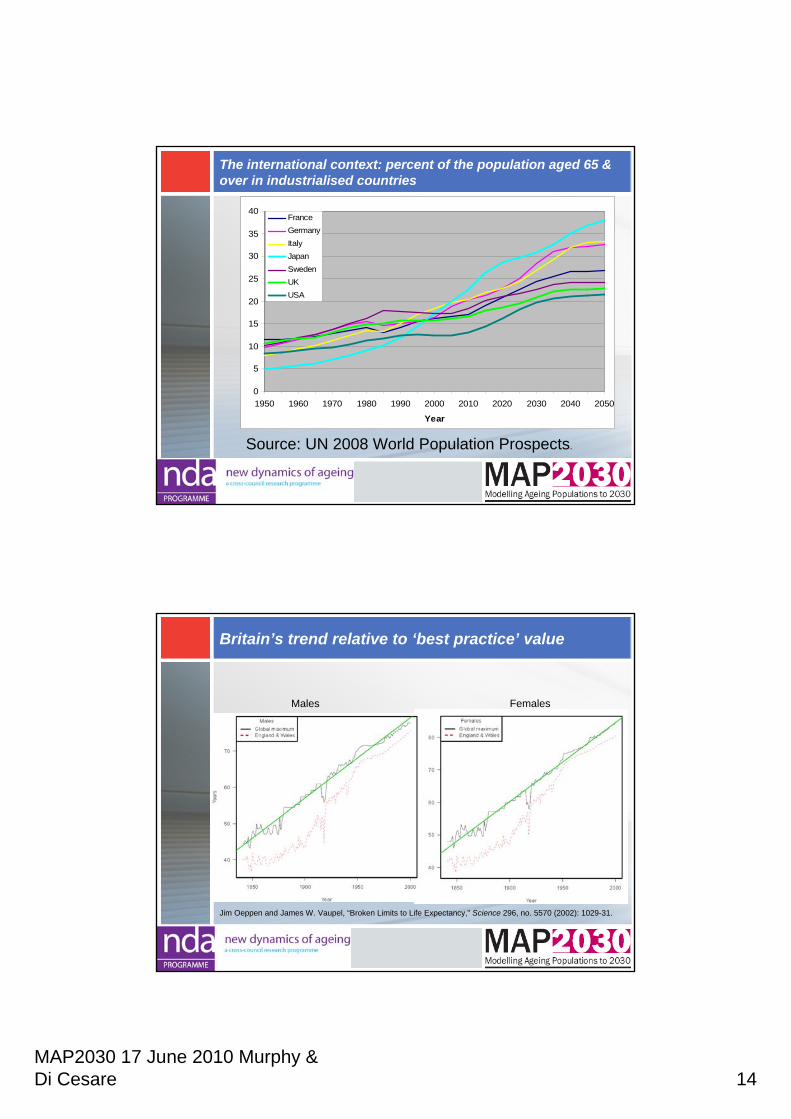
The international context: percent of the population aged 65 & over in industrialised countries
0
5
10
15
20
25
30
35
40
1950 1960 1970 1980 1990 2000 2010 2020 2030 2040 2050
Year
FranceGermanyItalyJapanSwedenUKUSA
Source: UN 2008 World Population Prospects.
Britain’s trend relative to ‘best practice’ value
Jim Oeppen and James W. Vaupel, “Broken Limits to Life Expectancy,” Science 296, no. 5570 (2002): 1029-31.
FemalesMales
MAP2030 17 June 2010 Murphy & Di Cesare 15
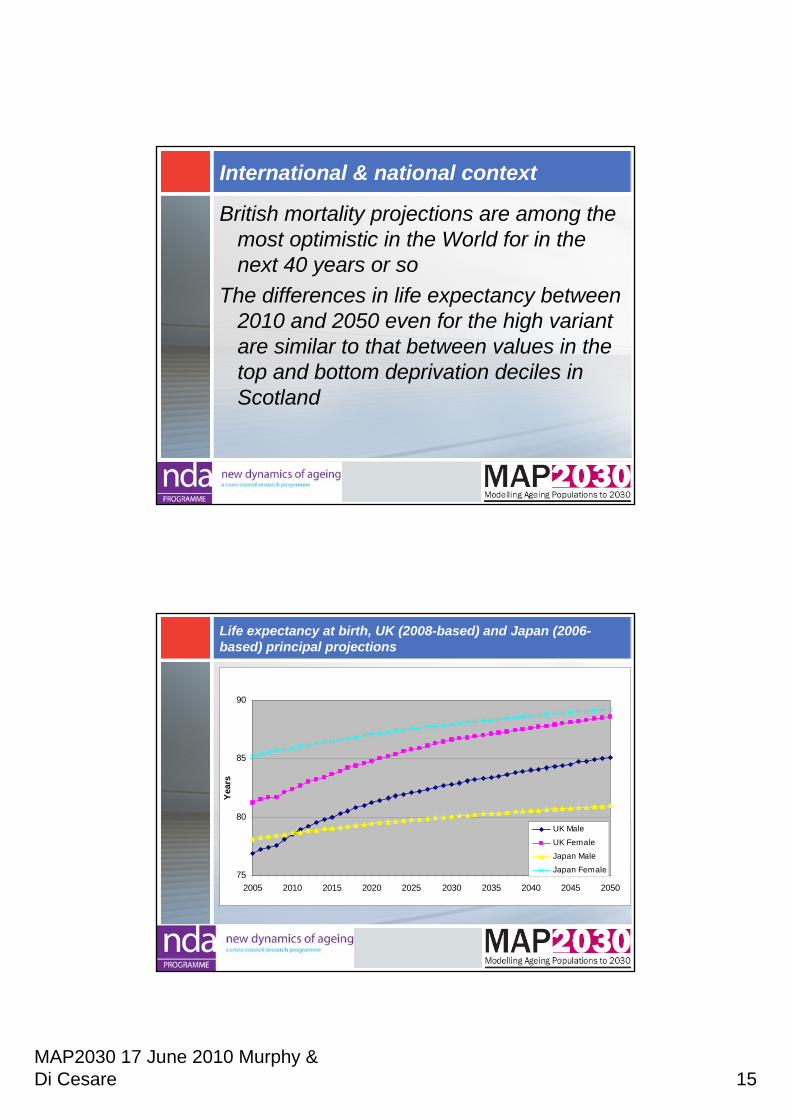
International & national context
British mortality projections are among the most optimistic in the World for in the next 40 years or so
The differences in life expectancy between 2010 and 2050 even for the high variant are similar to that between values in the top and bottom deprivation deciles in Scotland
Life expectancy at birth, UK (2008-based) and Japan (2006-based) principal projections
75
80
85
90
2005 2010 2015 2020 2025 2030 2035 2040 2045 2050
Year
s
UK Male
UK FemaleJapan MaleJapan Female
MAP2030 17 June 2010 Murphy & Di Cesare 16
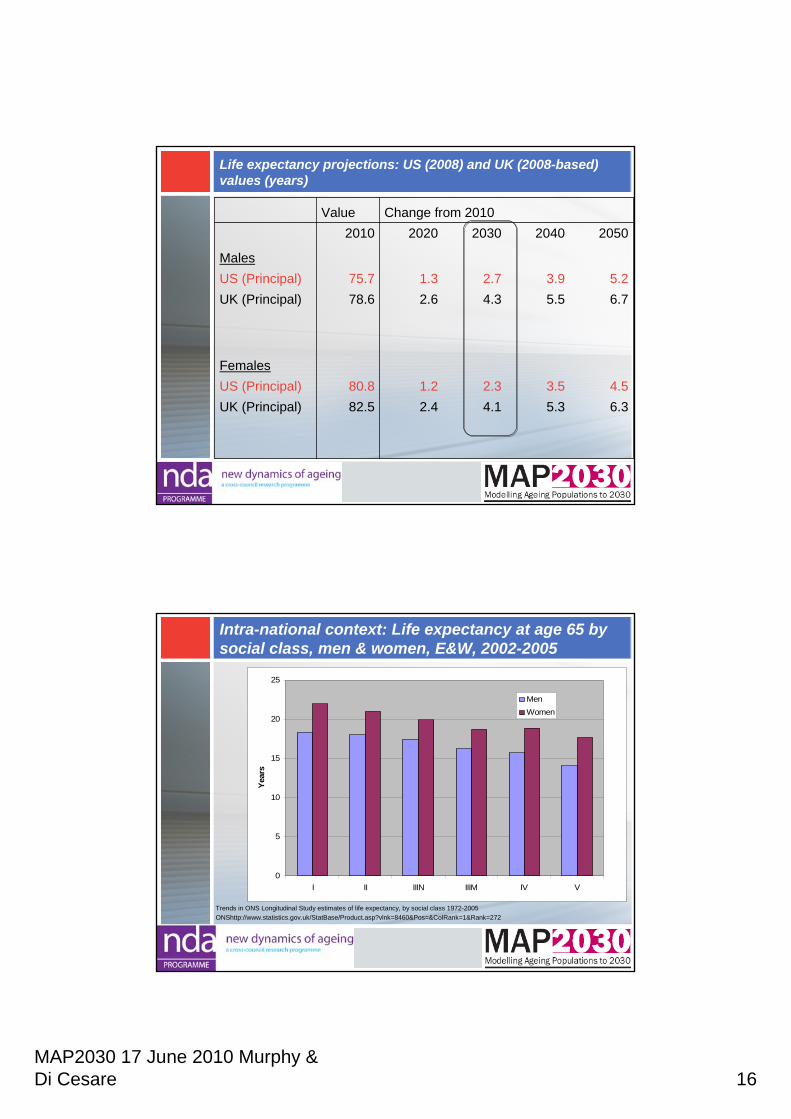
Life expectancy projections: US (2008) and UK (2008-based) values (years)
6.35.34.12.482.5UK (Principal)4.53.52.31.280.8US (Principal)
Females
6.75.54.32.678.6UK (Principal)5.23.92.71.375.7US (Principal)
Males
20502040203020202010Change from 2010 Value
Intra-national context: Life expectancy at age 65 by social class, men & women, E&W, 2002-2005
0
5
10
15
20
25
I II IIIN IIIM IV V
Year
s
MenWomen
Trends in ONS Longitudinal Study estimates of life expectancy, by social class 1972-2005 ONShttp://www.statistics.gov.uk/StatBase/Product.asp?vlnk=8460&Pos=&ColRank=1&Rank=272
MAP2030 17 June 2010 Murphy & Di Cesare 17
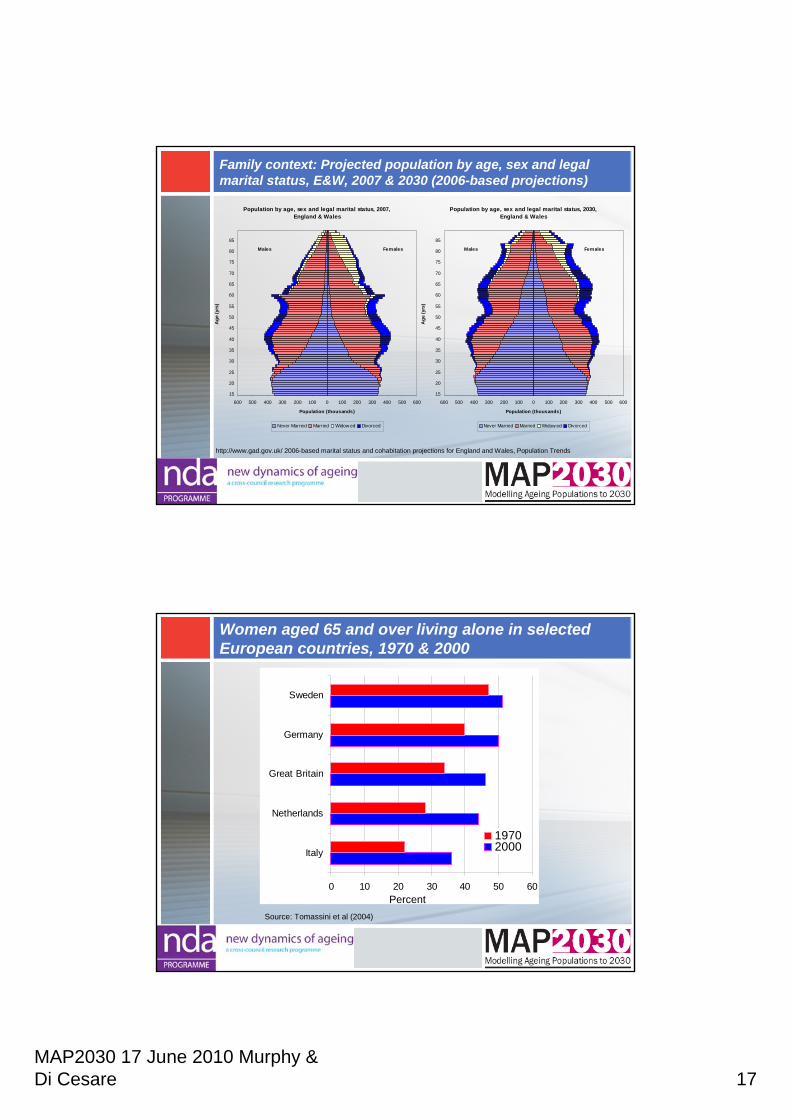
Family context: Projected population by age, sex and legal marital status, E&W, 2007 & 2030 (2006-based projections)
Population by age, sex and legal marital status, 2007, England & Wales
600 500 400 300 200 100 0 100 200 300 400 500 600
15
20
25
30
35
40
45
50
55
60
65
70
75
80
85
Age
(yrs
)
Population (thousands)
Never Married Married Widow ed Divorced
Males Females
Population by age, sex and legal marital status, 2030,England & Wales
600 500 400 300 200 100 0 100 200 300 400 500 600
15
20
25
30
35
40
45
50
55
60
65
70
75
80
85
Age
(yrs
)
Population (thousands)
Never Married Married Widow ed Divorced
Males Females
http://www.gad.gov.uk/ 2006-based marital status and cohabitation projections for England and Wales, Population Trends
Women aged 65 and over living alone in selected European countries, 1970 & 2000
0 10 20 30 40 50 60
Italy
Netherlands
Great Britain
Germany
Sweden
19702000
Source: Tomassini et al (2004)
Percent
MAP2030 17 June 2010 Murphy & Di Cesare 18
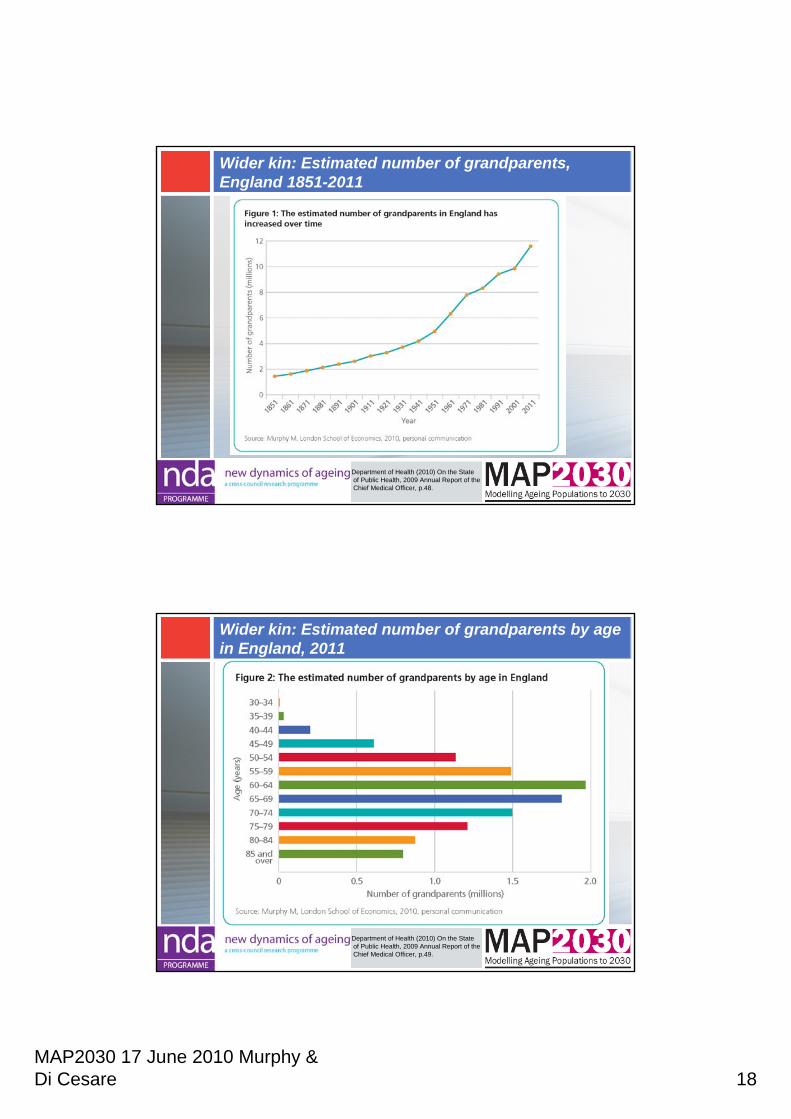
Wider kin: Estimated number of grandparents, England 1851-2011
Department of Health (2010) On the Stateof Public Health, 2009 Annual Report of theChief Medical Officer, p.48.
Wider kin: Estimated number of grandparents by age in England, 2011
Department of Health (2010) On the Stateof Public Health, 2009 Annual Report of theChief Medical Officer, p.49.
MAP2030 17th June 2010 Jagger, Matthews & Lindesay 1
Carol Jagger (Newcastle)Ruth Matthews, James Lindesay (Leicester)
MAP2030 End of Project Conference 17 June 2010
Compression of disability?Morbidity and disability in
older people to 2030
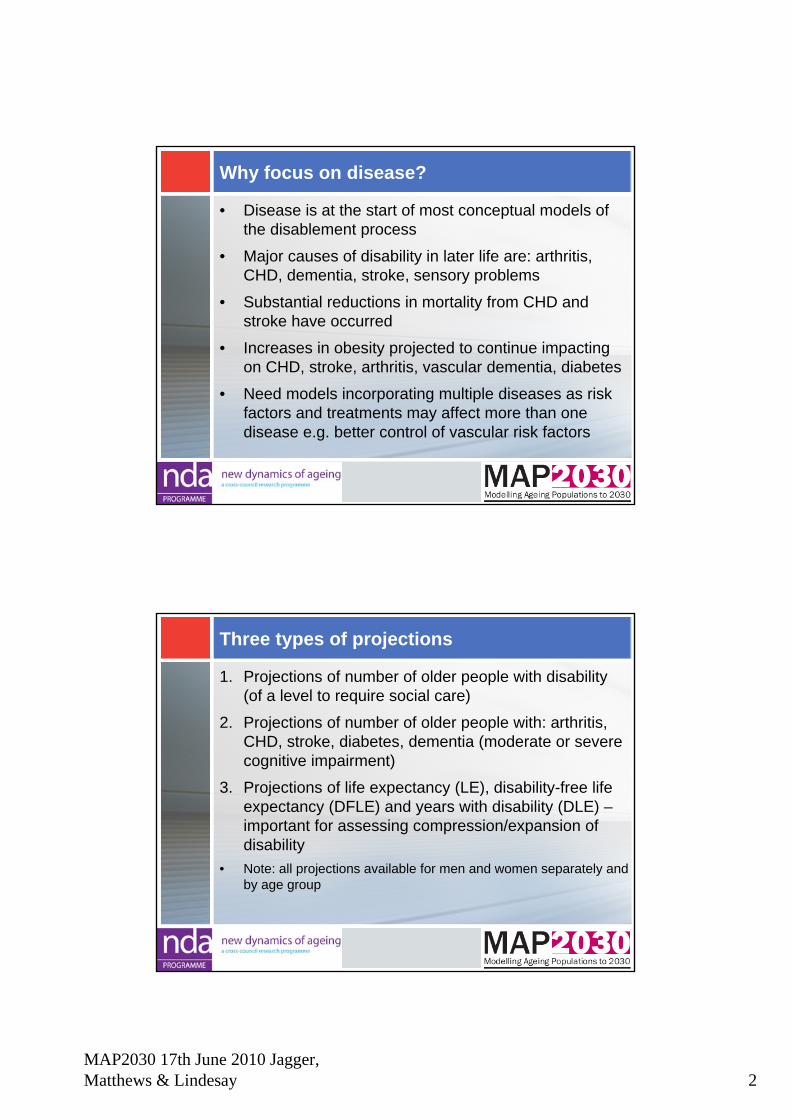
Future patterns of disease
• Projections of future need for health and social care have generally assumed constant age-specific prevalence of disability
• This neglects the considerable temporal changes that have occurred in a number of major disabling diseases
• Workpackage 2 is looking at the future pattern of disabling diseases and the implications for the numbers of older people with disability and disability-free life expectancy (DFLE) to 2030
• The SIMPOPGENDER model builds on previous one developed for Wanless Review of Social Care and results feed into Workpackage 5
MAP2030 17th June 2010 Jagger, Matthews & Lindesay 2
Why focus on disease?
• Disease is at the start of most conceptual models of the disablement process
• Major causes of disability in later life are: arthritis, CHD, dementia, stroke, sensory problems
• Substantial reductions in mortality from CHD and stroke have occurred
• Increases in obesity projected to continue impacting on CHD, stroke, arthritis, vascular dementia, diabetes
• Need models incorporating multiple diseases as risk factors and treatments may affect more than one disease e.g. better control of vascular risk factors
Three types of projections
1. Projections of number of older people with disability (of a level to require social care)
2. Projections of number of older people with: arthritis, CHD, stroke, diabetes, dementia (moderate or severe cognitive impairment)
3. Projections of life expectancy (LE), disability-free life expectancy (DFLE) and years with disability (DLE) –important for assessing compression/expansion of disability
• Note: all projections available for men and women separately andby age group
MAP2030 17th June 2010 Jagger, Matthews & Lindesay 3
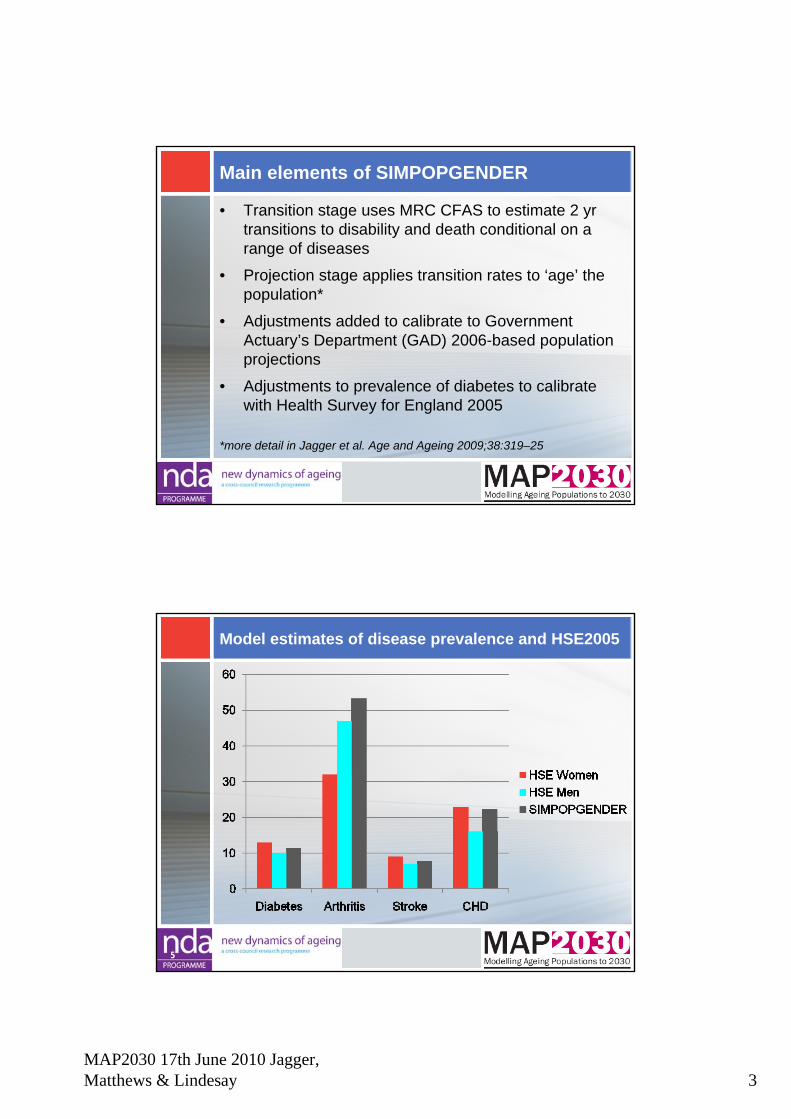
Main elements of SIMPOPGENDER
• Transition stage uses MRC CFAS to estimate 2 yr transitions to disability and death conditional on a range of diseases
• Projection stage applies transition rates to ‘age’ the population*
• Adjustments added to calibrate to Government Actuary’s Department (GAD) 2006-based population projections
• Adjustments to prevalence of diabetes to calibrate with Health Survey for England 2005
*more detail in Jagger et al. Age and Ageing 2009;38:319–25
Model estimates of disease prevalence and HSE2005
5
MAP2030 17th June 2010 Jagger, Matthews & Lindesay 4
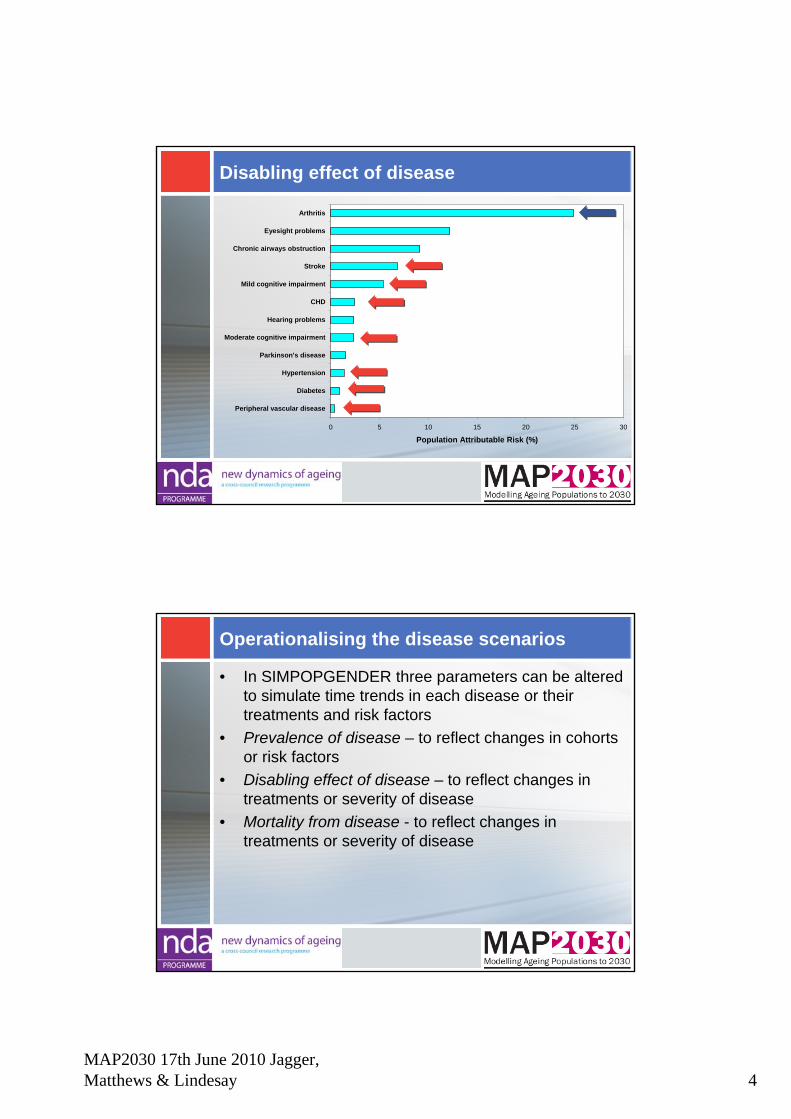
Disabling effect of disease
0 5 10 15 20 25 30
Peripheral vascular disease
Diabetes
Hypertension
Parkinson's disease
Moderate cognitive impairment
Hearing problems
CHD
Mild cognitive impairment
Stroke
Chronic airways obstruction
Eyesight problems
Arthritis
Population Attributable Risk (%)
Operationalising the disease scenarios
• In SIMPOPGENDER three parameters can be altered to simulate time trends in each disease or their treatments and risk factors
• Prevalence of disease – to reflect changes in cohorts or risk factors
• Disabling effect of disease – to reflect changes in treatments or severity of disease
• Mortality from disease - to reflect changes in treatments or severity of disease
MAP2030 17th June 2010 Jagger, Matthews & Lindesay 5
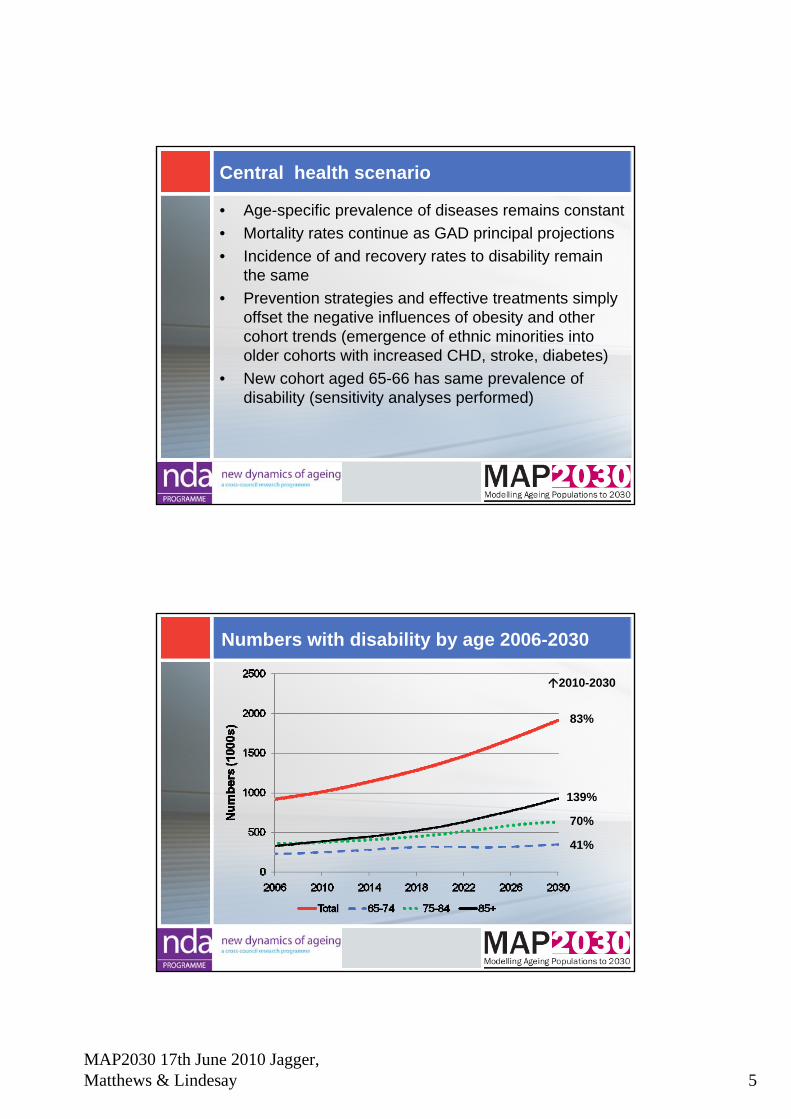
Central health scenario
• Age-specific prevalence of diseases remains constant• Mortality rates continue as GAD principal projections• Incidence of and recovery rates to disability remain
the same• Prevention strategies and effective treatments simply
offset the negative influences of obesity and other cohort trends (emergence of ethnic minorities into older cohorts with increased CHD, stroke, diabetes)
• New cohort aged 65-66 has same prevalence of disability (sensitivity analyses performed)
Numbers with disability by age 2006-2030
2010-2030
83%
139%
70%
41%
MAP2030 17th June 2010 Jagger, Matthews & Lindesay 6
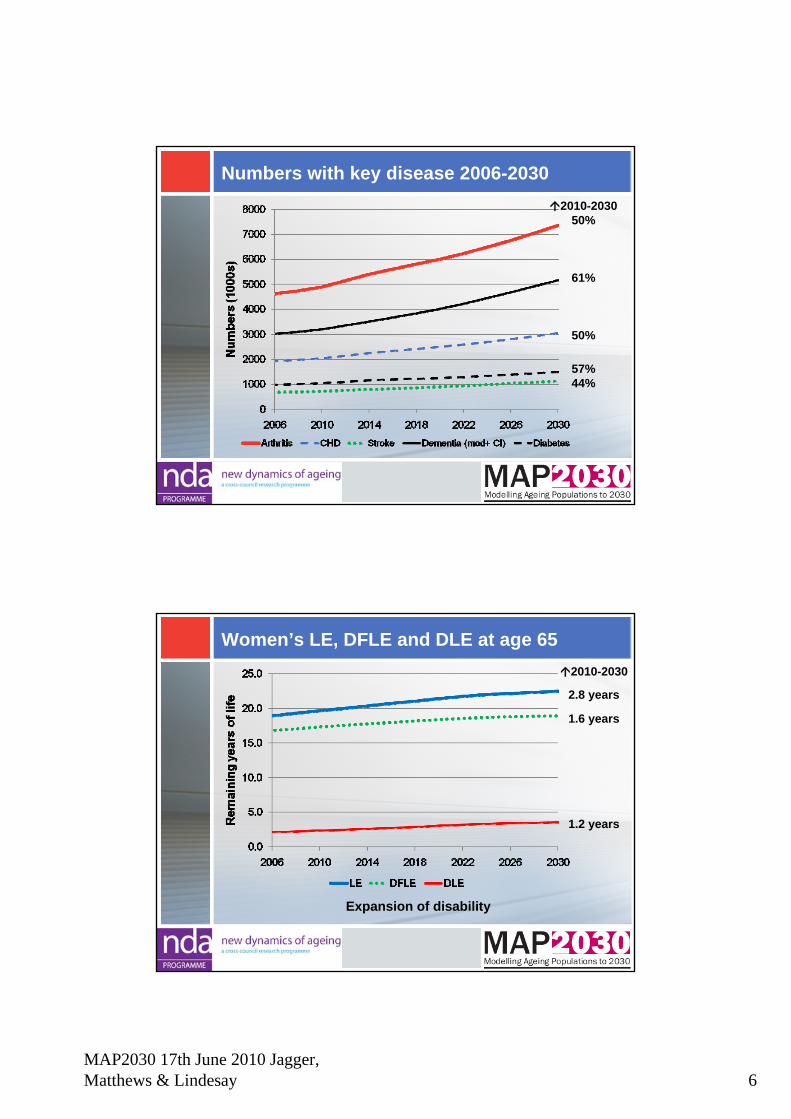
Numbers with key disease 2006-20302010-2030
50%
61%
50%
57%44%
Women’s LE, DFLE and DLE at age 652010-2030
2.8 years
1.6 years
1.2 years
Expansion of disability
MAP2030 17th June 2010 Jagger, Matthews & Lindesay 7
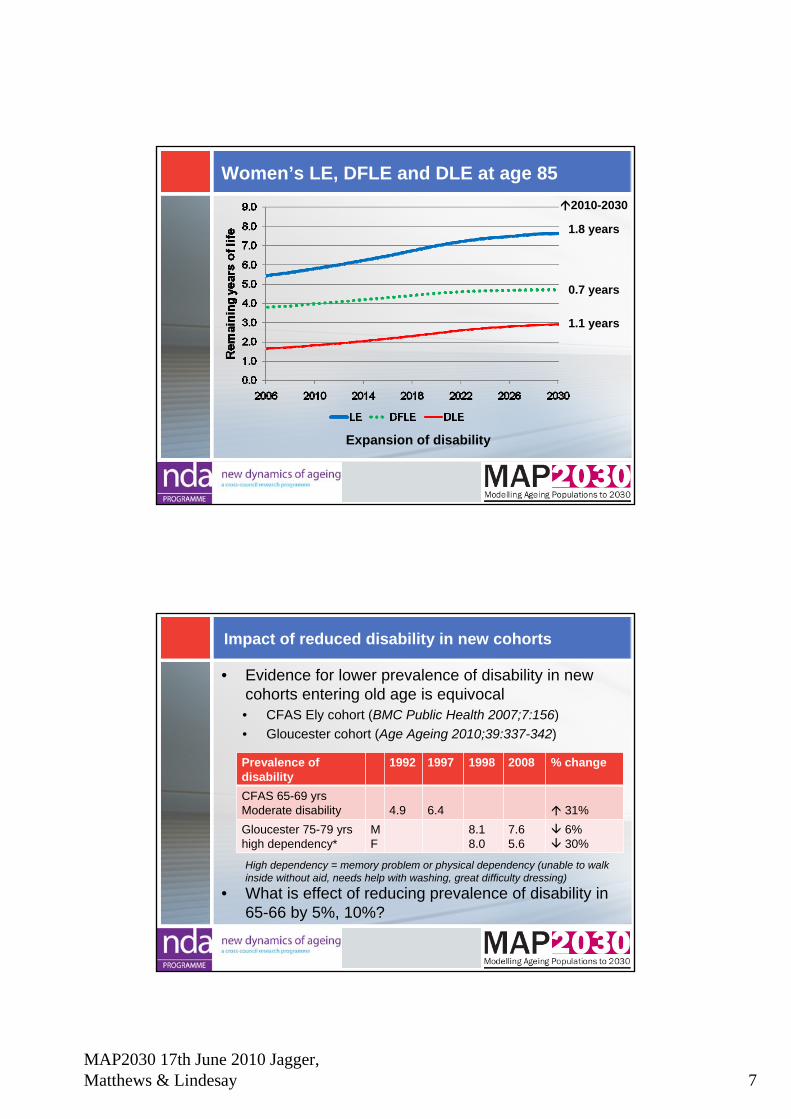
Women’s LE, DFLE and DLE at age 85 2010-2030
1.8 years
0.7 years
1.1 years
Expansion of disability
Impact of reduced disability in new cohorts
• Evidence for lower prevalence of disability in new cohorts entering old age is equivocal• CFAS Ely cohort (BMC Public Health 2007;7:156)• Gloucester cohort (Age Ageing 2010;39:337-342)
Prevalence of disability
1992 1997 1998 2008 % change
CFAS 65-69 yrsModerate disability 4.9 6.4 31%Gloucester 75-79 yrs high dependency*
MF
8.18.0
7.65.6
6%30%
• What is effect of reducing prevalence of disability in 65-66 by 5%, 10%?
High dependency = memory problem or physical dependency (unable to walk inside without aid, needs help with washing, great difficulty dressing)
MAP2030 17th June 2010 Jagger, Matthews & Lindesay 8
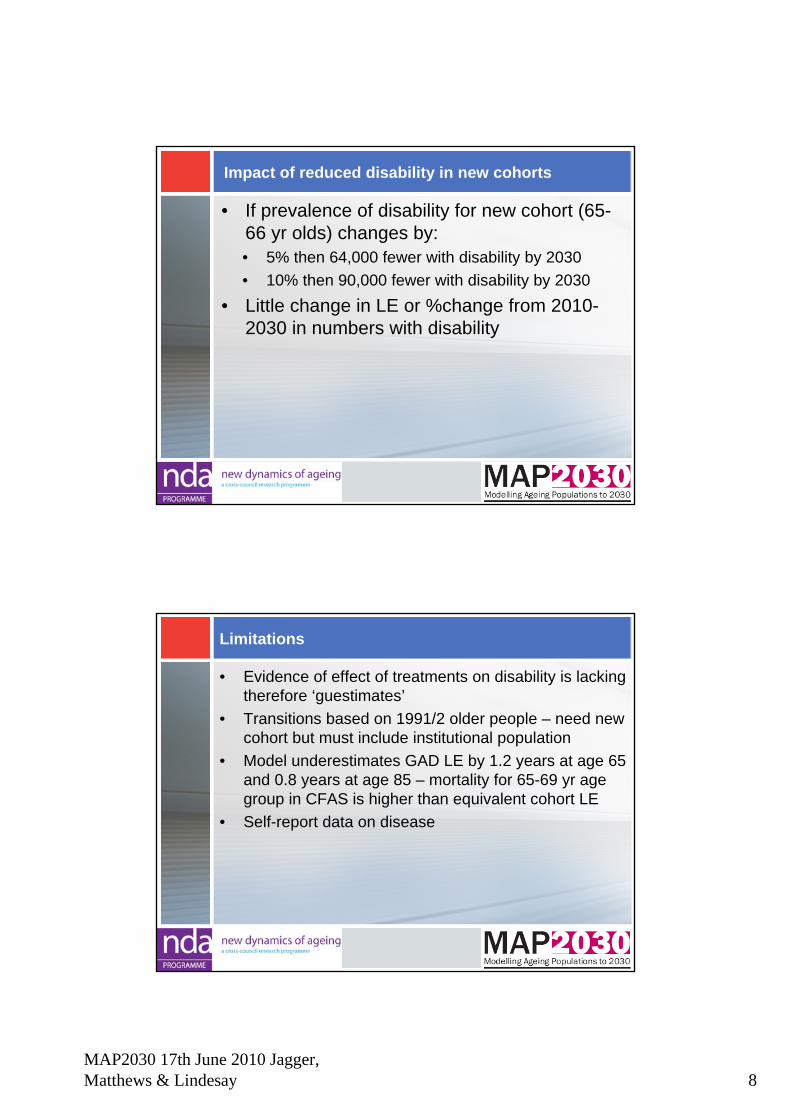
Impact of reduced disability in new cohorts
• If prevalence of disability for new cohort (65-66 yr olds) changes by:• 5% then 64,000 fewer with disability by 2030• 10% then 90,000 fewer with disability by 2030
• Little change in LE or %change from 2010-2030 in numbers with disability
Limitations
• Evidence of effect of treatments on disability is lacking therefore ‘guestimates’
• Transitions based on 1991/2 older people – need new cohort but must include institutional population
• Model underestimates GAD LE by 1.2 years at age 65 and 0.8 years at age 85 – mortality for 65-69 yr age group in CFAS is higher than equivalent cohort LE
• Self-report data on disease
MAP2030 17th June 2010 Jagger, Matthews & Lindesay 9
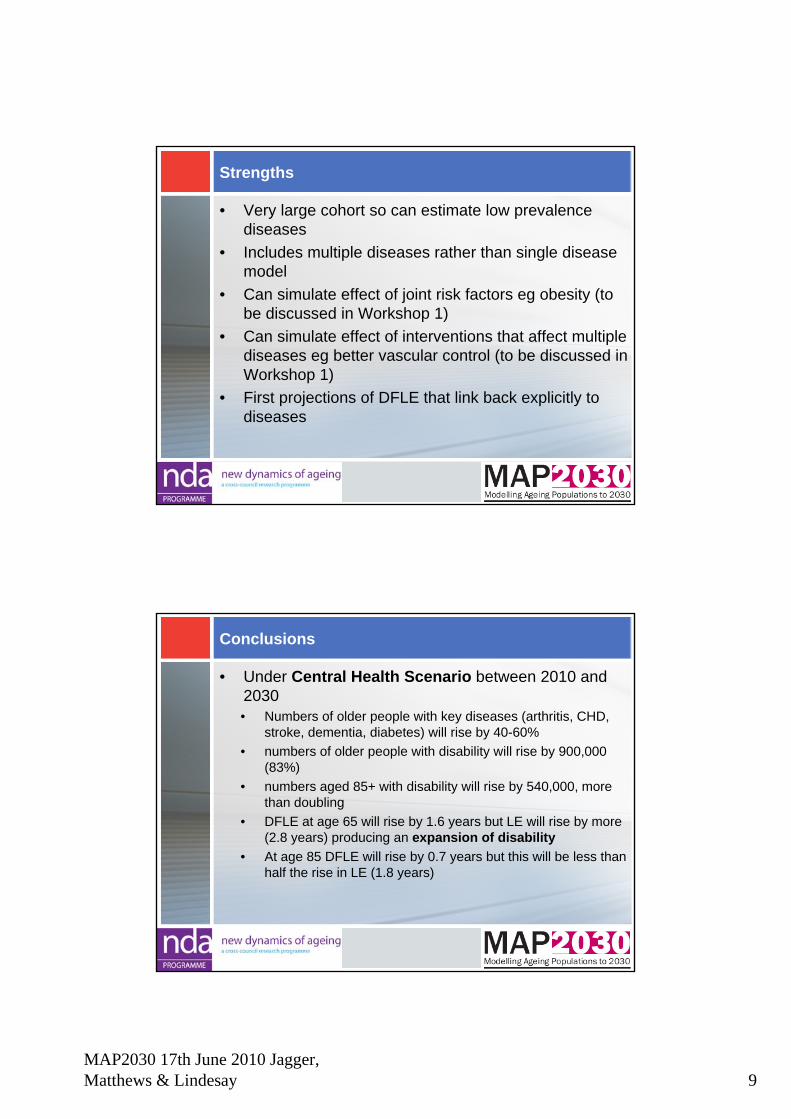
Strengths
• Very large cohort so can estimate low prevalence diseases
• Includes multiple diseases rather than single disease model
• Can simulate effect of joint risk factors eg obesity (to be discussed in Workshop 1)
• Can simulate effect of interventions that affect multiple diseases eg better vascular control (to be discussed in Workshop 1)
• First projections of DFLE that link back explicitly to diseases
Conclusions
• Under Central Health Scenario between 2010 and 2030 • Numbers of older people with key diseases (arthritis, CHD,
stroke, dementia, diabetes) will rise by 40-60% • numbers of older people with disability will rise by 900,000
(83%)• numbers aged 85+ with disability will rise by 540,000, more
than doubling• DFLE at age 65 will rise by 1.6 years but LE will rise by more
(2.8 years) producing an expansion of disability • At age 85 DFLE will rise by 0.7 years but this will be less than
half the rise in LE (1.8 years)

MAP2030 17th June 2010 Jagger, Matthews & Lindesay 10
Carol Jagger (Newcastle)[email protected]
Ruth Matthews, James Lindesay (Leicester)
Compression of disability?Morbidity and disability in
older people to 2030
Relationship between LE, DFLE and DLE
• Whether DFLE is increasing faster or slower than LE is a key concern for the future
• If the number of years spent with disability (DLE) is reducing (as DFLE is increasing faster than LE) this is an absolute compression of disability
• If the number of years spent with disability (DLE) is increasing (as DFLE is not increasing as fast as LE) this is an absolute expansion of disability
• If the proportion of remaining years free of disability (%DFLE/LE) is increasing this is an relative compression of disability

MAP2030 17th June 2010 Wittenberg, Hancock & Curry et al. 1
Raphael Wittenberg, Juliette Malley, Adelina Comas-Herrera, Derek King & Linda Pickard (PSSRU)
Ruth Hancock & Marcello Morciano (UEA)
Chris Curry, John Adams & Sean James (PPI)
MAP2030 End of Project Conference17 June 2010
Long-term Care and Pensions
Outline of presentation
Links with other work packagesPolicy contextMethodsCurrent funding system: base case assumptions and
aggregate projections; effects of alternative assumptions on life expectancy, disability, household composition and informal care; MAP2030 scenario
LTC funding options: description and rationale; effects on individuals; aggregate effects; effects of alternative assumptions on life expectancy; combined pensions and LTC projections including MAP2030 scenario
Conclusions
MAP2030 17th June 2010 Wittenberg, Hancock & Curry et al. 2
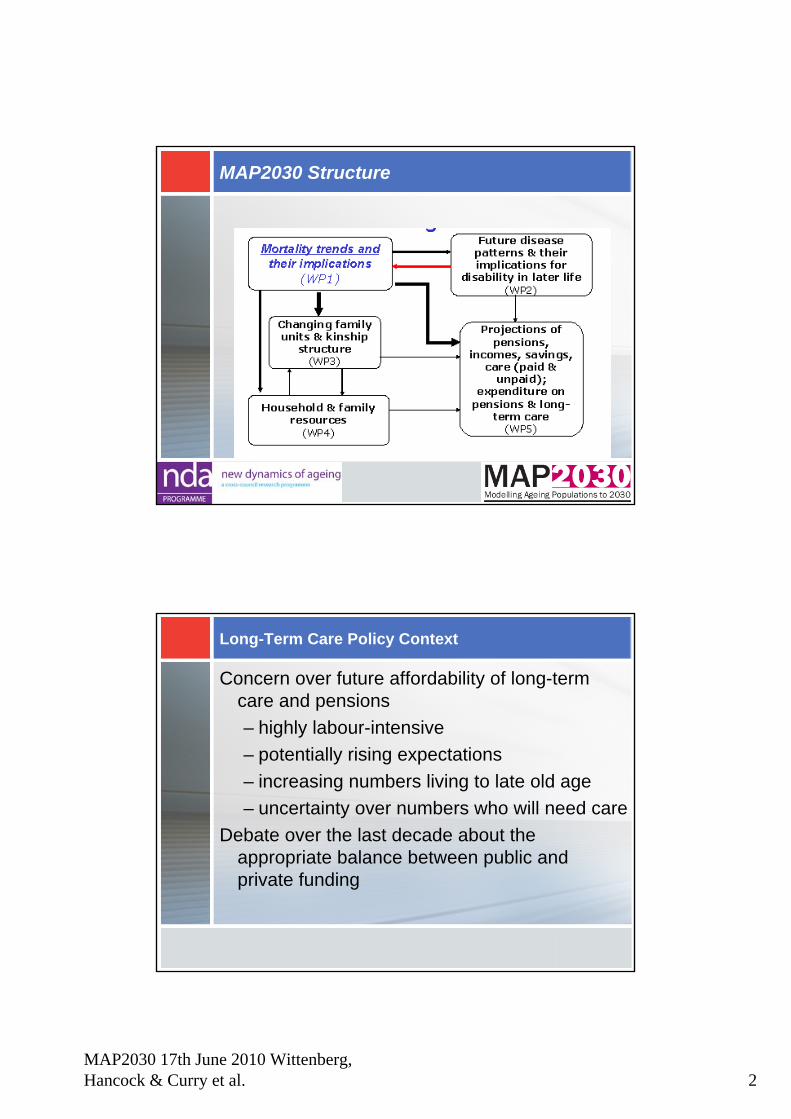
MAP2030 Structure
Long-Term Care Policy Context
Concern over future affordability of long-term care and pensions– highly labour-intensive– potentially rising expectations – increasing numbers living to late old age– uncertainty over numbers who will need care
Debate over the last decade about the appropriate balance between public and private funding
MAP2030 17th June 2010 Wittenberg, Hancock & Curry et al. 3
Long-Term Care Financing System in the UK
Health care free of charge at point of use throughout UK
Nursing care in nursing homes now also free throughout the UK
Personal care free in Scotland but subject to user charges in rest of the UK
Hotel costs in care homes and domestic help subject to charges throughout UK
Disability (cash) benefits are not subject to means test, throughout the UK
Policy Agenda under the New Government
The new Government’s Coalition Agreement includes commitments to:
• hold a review to set the date at which the state pension age starts to rise to 66; and
• establish a commission on long-term care which will consider a range of ideas, including both a voluntary insurance scheme to protect the assets of those who go into residential care and a partnership scheme.
MAP2030 17th June 2010 Wittenberg, Hancock & Curry et al. 4
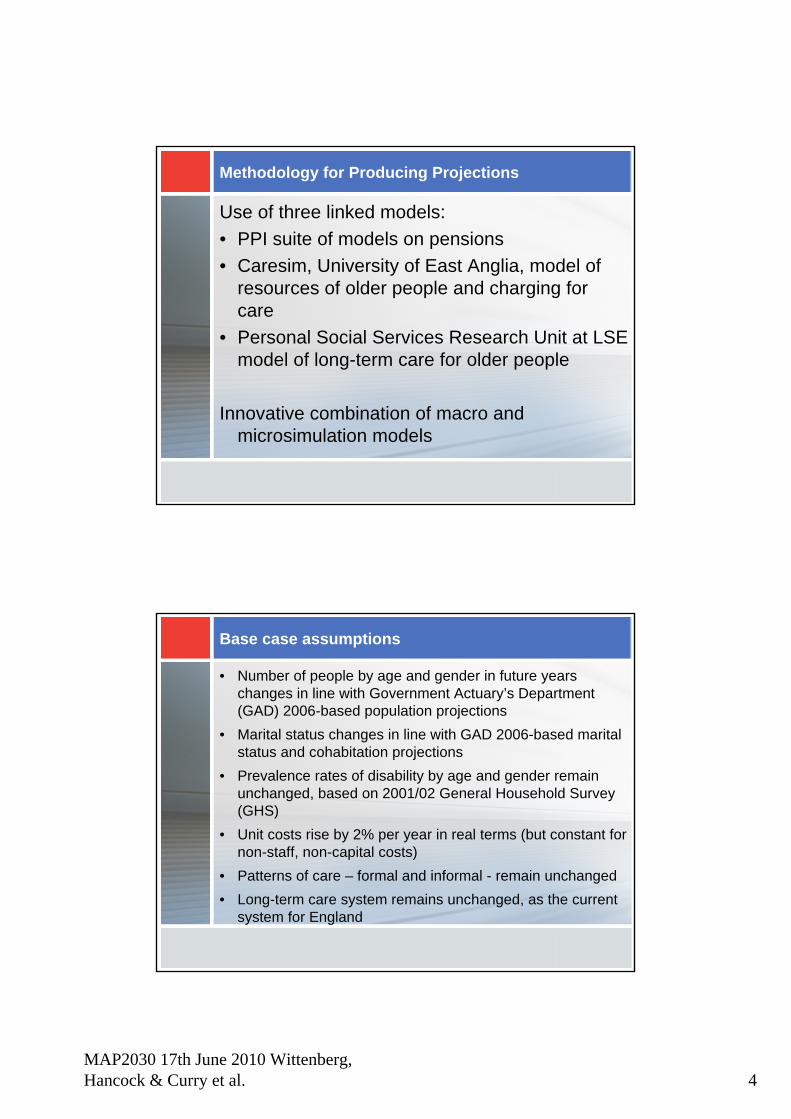
Methodology for Producing Projections
Use of three linked models:• PPI suite of models on pensions• Caresim, University of East Anglia, model of
resources of older people and charging for care
• Personal Social Services Research Unit at LSE model of long-term care for older people
Innovative combination of macro and microsimulation models
Base case assumptions
• Number of people by age and gender in future years changes in line with Government Actuary’s Department (GAD) 2006-based population projections
• Marital status changes in line with GAD 2006-based marital status and cohabitation projections
• Prevalence rates of disability by age and gender remain unchanged, based on 2001/02 General Household Survey (GHS)
• Unit costs rise by 2% per year in real terms (but constant for non-staff, non-capital costs)
• Patterns of care – formal and informal - remain unchanged• Long-term care system remains unchanged, as the current
system for England
MAP2030 17th June 2010 Wittenberg, Hancock & Curry et al. 5
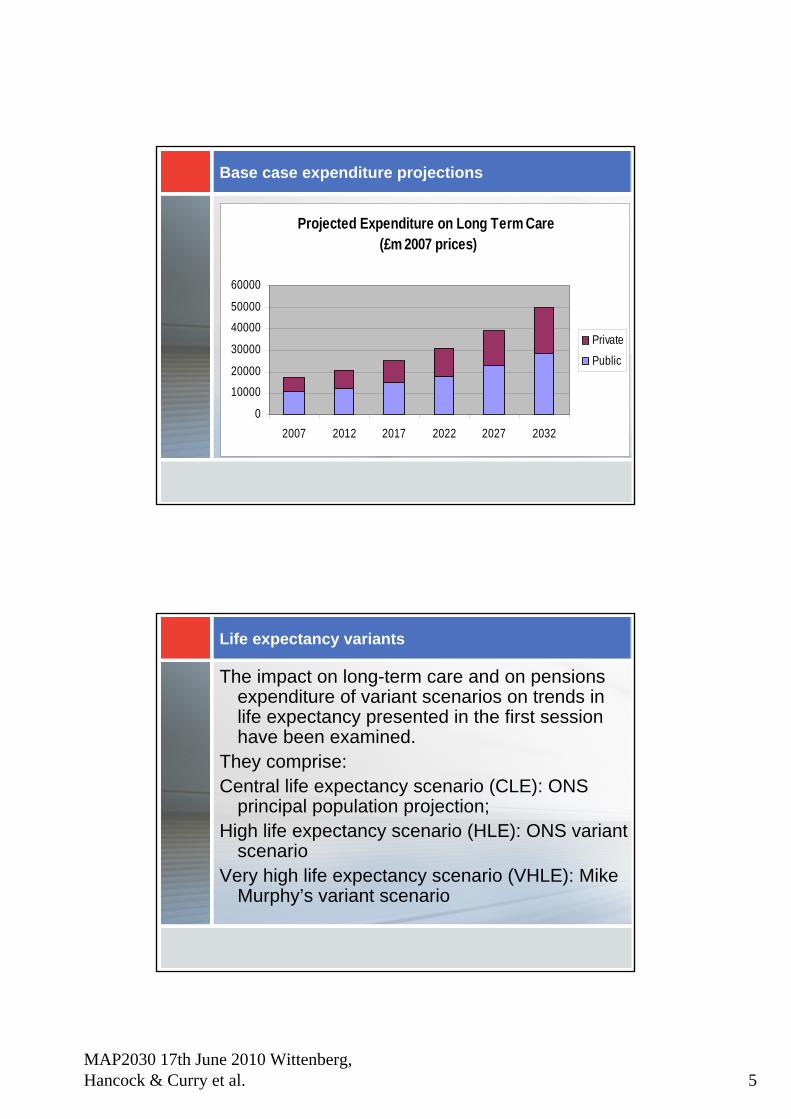
Base case expenditure projections
Projected Expenditure on Long Term Care (£m 2007 prices)
0
10000
20000
30000
40000
50000
60000
2007 2012 2017 2022 2027 2032
Private
Public
Life expectancy variants
The impact on long-term care and on pensions expenditure of variant scenarios on trends in life expectancy presented in the first session have been examined.
They comprise:Central life expectancy scenario (CLE): ONS
principal population projection;High life expectancy scenario (HLE): ONS variant
scenarioVery high life expectancy scenario (VHLE): Mike
Murphy’s variant scenario
MAP2030 17th June 2010 Wittenberg, Hancock & Curry et al. 6
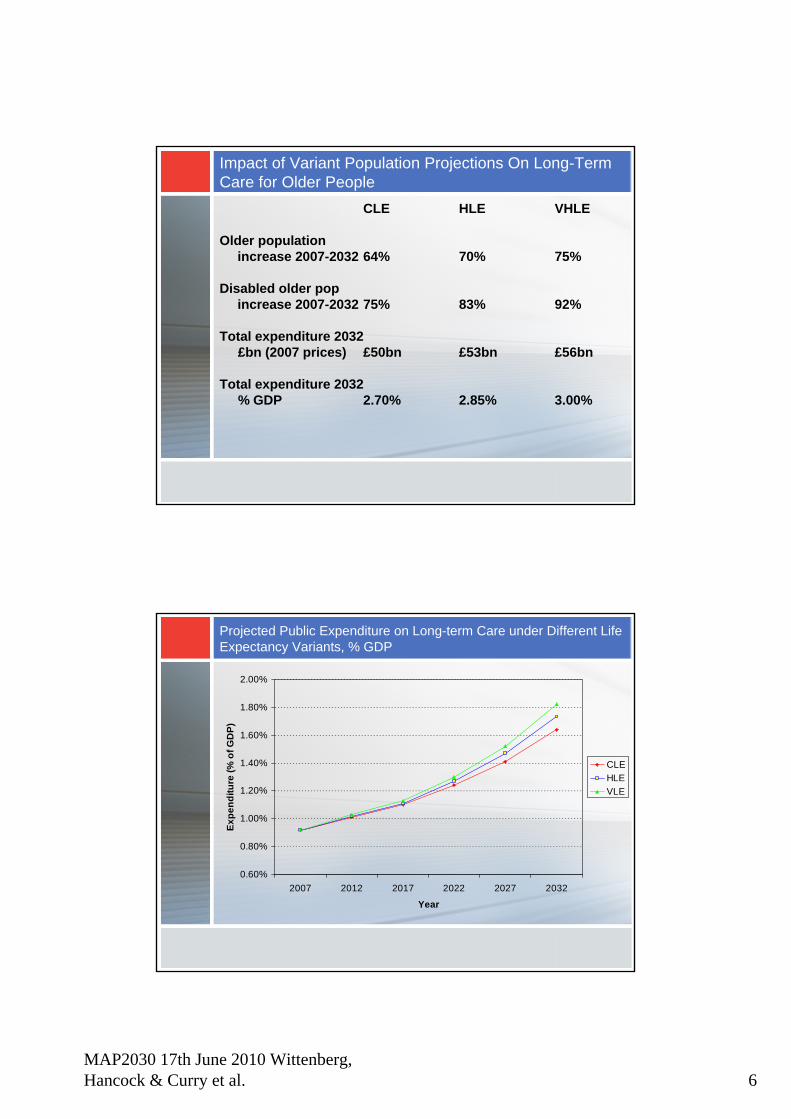
Impact of Variant Population Projections On Long-Term Care for Older People
CLE HLE VHLE
Older population increase 2007-2032 64% 70% 75%
Disabled older pop increase 2007-2032 75% 83% 92%
Total expenditure 2032 £bn (2007 prices) £50bn £53bn £56bn
Total expenditure 2032 % GDP 2.70% 2.85% 3.00%
Projected Public Expenditure on Long-term Care under Different Life Expectancy Variants, % GDP
0.60%
0.80%
1.00%
1.20%
1.40%
1.60%
1.80%
2.00%
2007 2012 2017 2022 2027 2032
Year
Expe
nditu
re (%
of G
DP)
CLEHLEVLE
MAP2030 17th June 2010 Wittenberg, Hancock & Curry et al. 7
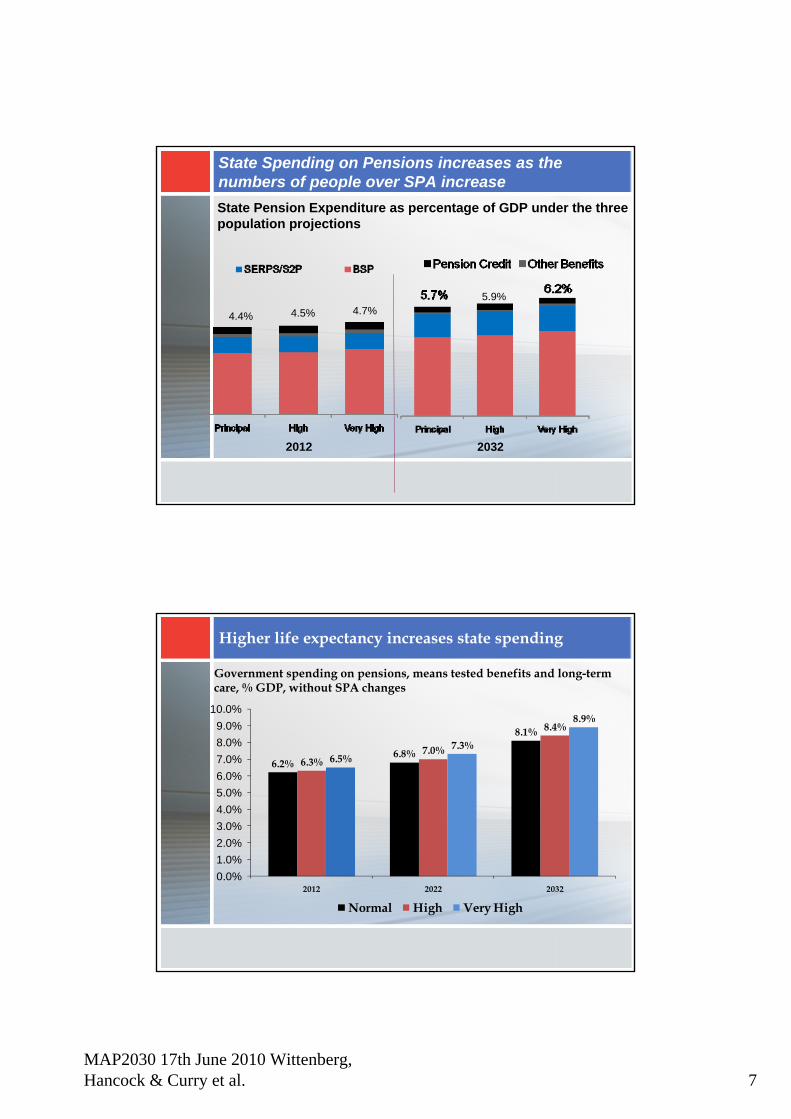
State Spending on Pensions increases as the numbers of people over SPA increaseState Pension Expenditure as percentage of GDP under the three population projections
4.4% 4.5% 4.7%
2012
5.9%
2032
Higher life expectancy increases state spending
Government spending on pensions, means tested benefits and long-term care, % GDP, without SPA changes
6.2%6.8%
8.1%
6.3%7.0%
8.4%
6.5%7.3%
8.9%
0.0%1.0%2.0%3.0%4.0%5.0%6.0%7.0%8.0%9.0%
10.0%
2012 2022 2032
Normal High Very High
MAP2030 17th June 2010 Wittenberg, Hancock & Curry et al. 8
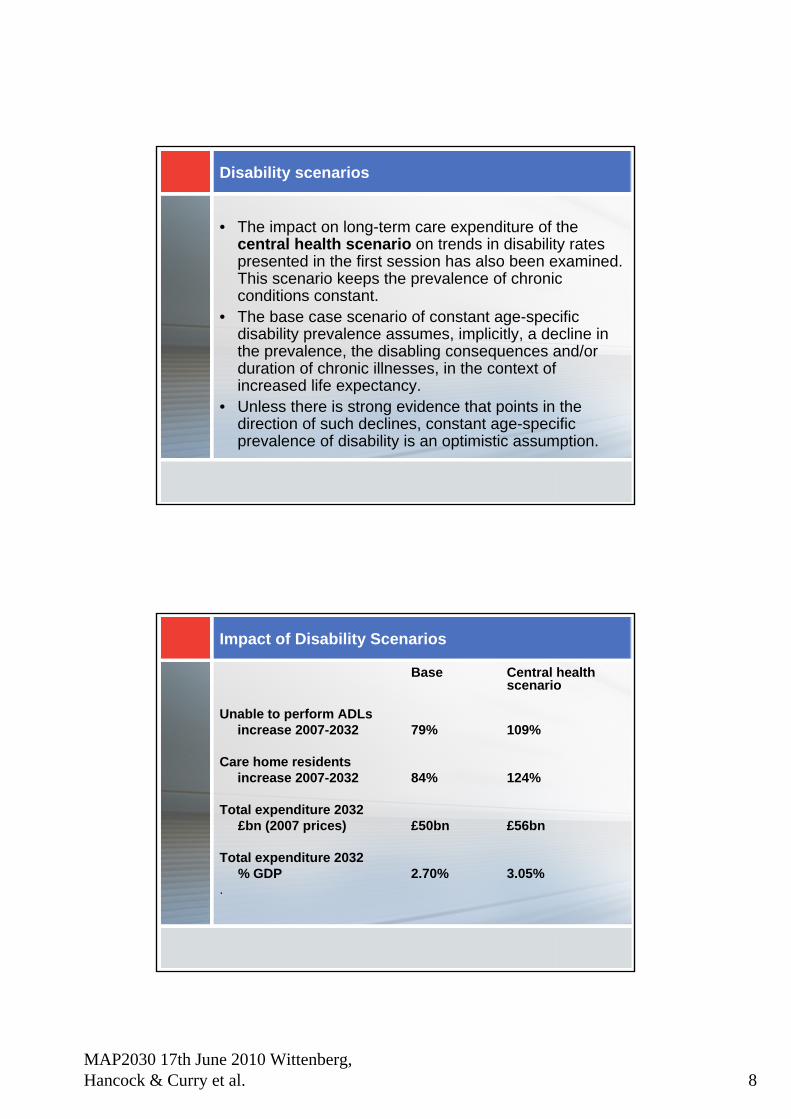
Disability scenarios
• The impact on long-term care expenditure of the central health scenario on trends in disability rates presented in the first session has also been examined. This scenario keeps the prevalence of chronic conditions constant.
• The base case scenario of constant age-specific disability prevalence assumes, implicitly, a decline in the prevalence, the disabling consequences and/or duration of chronic illnesses, in the context of increased life expectancy.
• Unless there is strong evidence that points in the direction of such declines, constant age-specific prevalence of disability is an optimistic assumption.
Impact of Disability Scenarios
Base Central health scenario
Unable to perform ADLsincrease 2007-2032 79% 109%
Care home residentsincrease 2007-2032 84% 124%
Total expenditure 2032 £bn (2007 prices) £50bn £56bn
Total expenditure 2032 % GDP 2.70% 3.05%
.
MAP2030 17th June 2010 Wittenberg, Hancock & Curry et al. 9
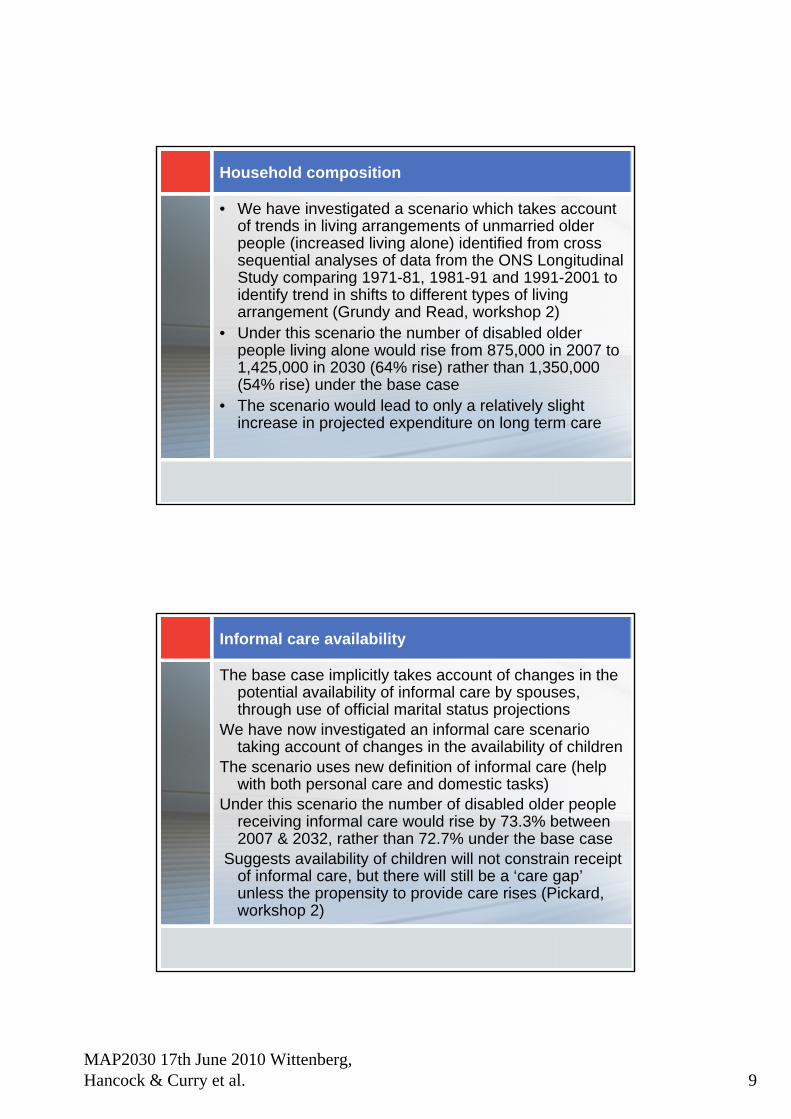
Household composition
• We have investigated a scenario which takes account of trends in living arrangements of unmarried older people (increased living alone) identified from cross sequential analyses of data from the ONS Longitudinal Study comparing 1971-81, 1981-91 and 1991-2001 to identify trend in shifts to different types of living arrangement (Grundy and Read, workshop 2)
• Under this scenario the number of disabled older people living alone would rise from 875,000 in 2007 to 1,425,000 in 2030 (64% rise) rather than 1,350,000 (54% rise) under the base case
• The scenario would lead to only a relatively slight increase in projected expenditure on long term care
Informal care availability
The base case implicitly takes account of changes in the potential availability of informal care by spouses, through use of official marital status projections
We have now investigated an informal care scenario taking account of changes in the availability of children
The scenario uses new definition of informal care (help with both personal care and domestic tasks)
Under this scenario the number of disabled older people receiving informal care would rise by 73.3% between 2007 & 2032, rather than 72.7% under the base case
Suggests availability of children will not constrain receipt of informal care, but there will still be a ‘care gap’unless the propensity to provide care rises (Pickard, workshop 2)
MAP2030 17th June 2010 Wittenberg, Hancock & Curry et al. 10
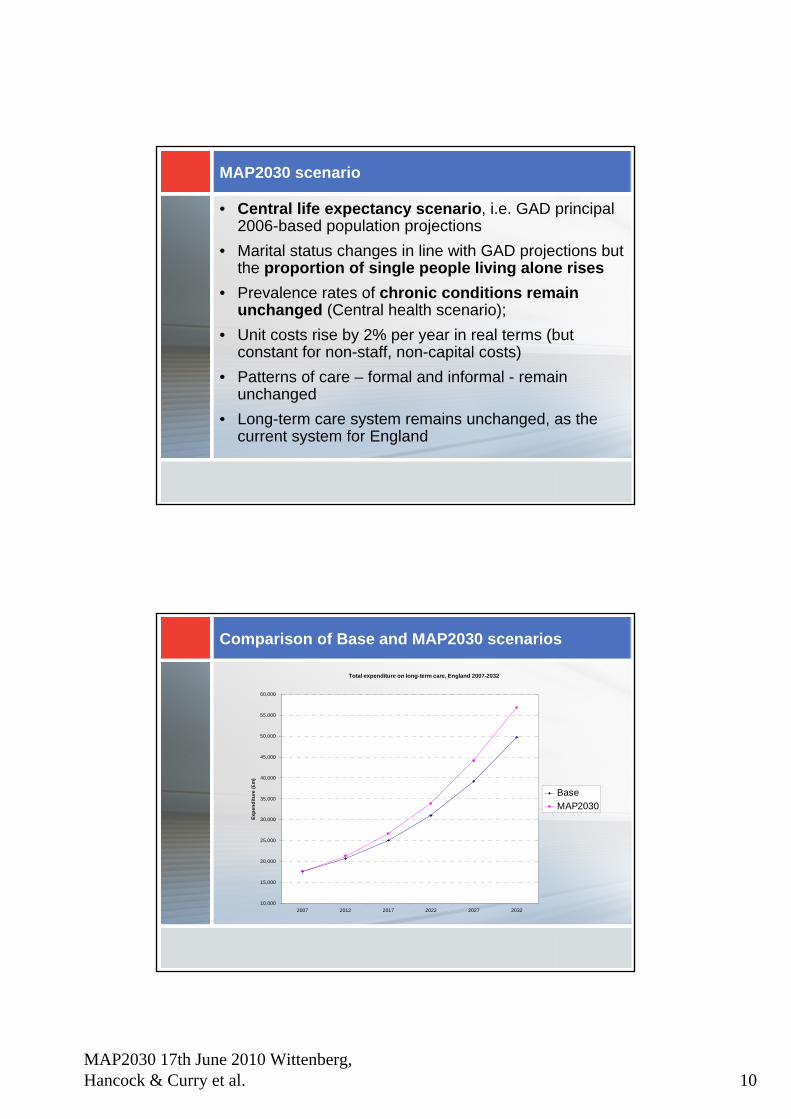
MAP2030 scenario
• Central life expectancy scenario, i.e. GAD principal 2006-based population projections
• Marital status changes in line with GAD projections but the proportion of single people living alone rises
• Prevalence rates of chronic conditions remain unchanged (Central health scenario);
• Unit costs rise by 2% per year in real terms (but constant for non-staff, non-capital costs)
• Patterns of care – formal and informal - remain unchanged
• Long-term care system remains unchanged, as the current system for England
Comparison of Base and MAP2030 scenarios
Total expenditure on long-term care, England 2007-2032
10,000
15,000
20,000
25,000
30,000
35,000
40,000
45,000
50,000
55,000
60,000
2007 2012 2017 2022 2027 2032
Expe
nditu
re (£
m)
BaseMAP2030
MAP2030 17th June 2010 Wittenberg, Hancock & Curry et al. 11
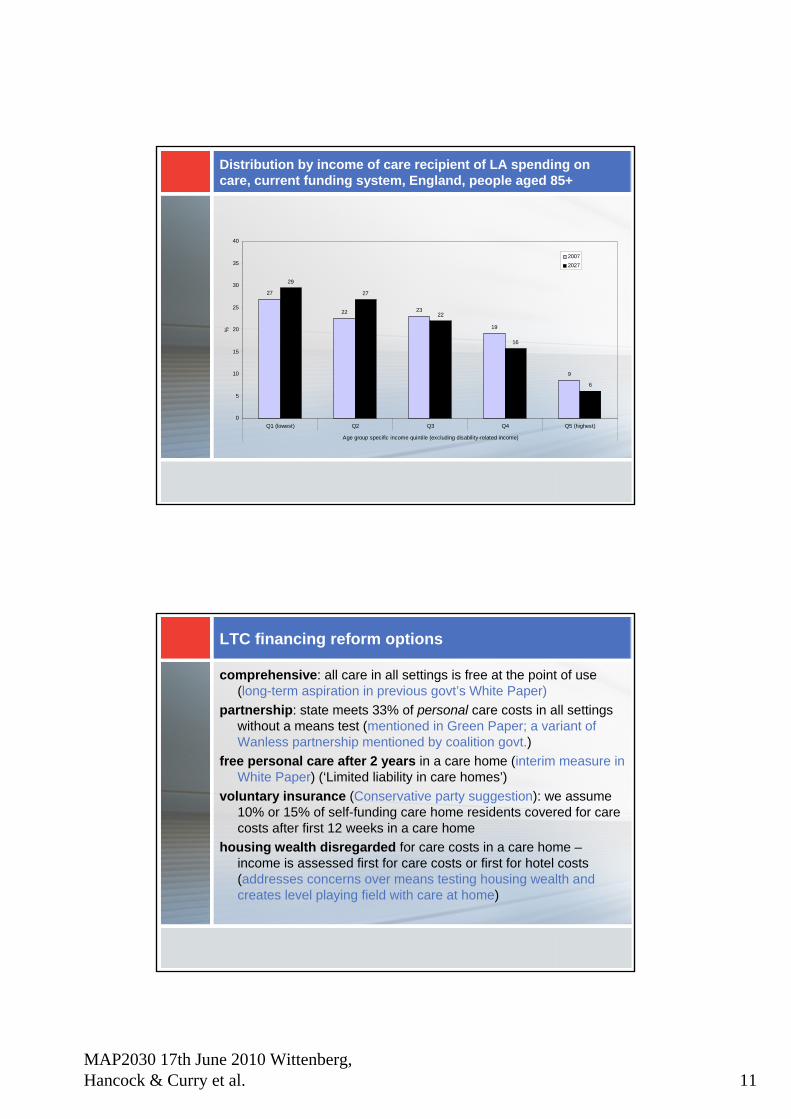
Distribution by income of care recipient of LA spending on care, current funding system, England, people aged 85+
27
22 23
19
9
29
27
22
16
6
0
5
10
15
20
25
30
35
40
Q1 (lowest) Q2 Q3 Q4 Q5 (highest)
Age group specific income quintile (excluding disability-related income)
%
20072027
LTC financing reform options
comprehensive: all care in all settings is free at the point of use (long-term aspiration in previous govt’s White Paper)
partnership: state meets 33% of personal care costs in all settings without a means test (mentioned in Green Paper; a variant of Wanless partnership mentioned by coalition govt.)
free personal care after 2 years in a care home (interim measure in White Paper) (‘Limited liability in care homes’)
voluntary insurance (Conservative party suggestion): we assume 10% or 15% of self-funding care home residents covered for care costs after first 12 weeks in a care home
housing wealth disregarded for care costs in a care home –income is assessed first for care costs or first for hotel costs(addresses concerns over means testing housing wealth and creates level playing field with care at home)
MAP2030 17th June 2010 Wittenberg, Hancock & Curry et al. 12
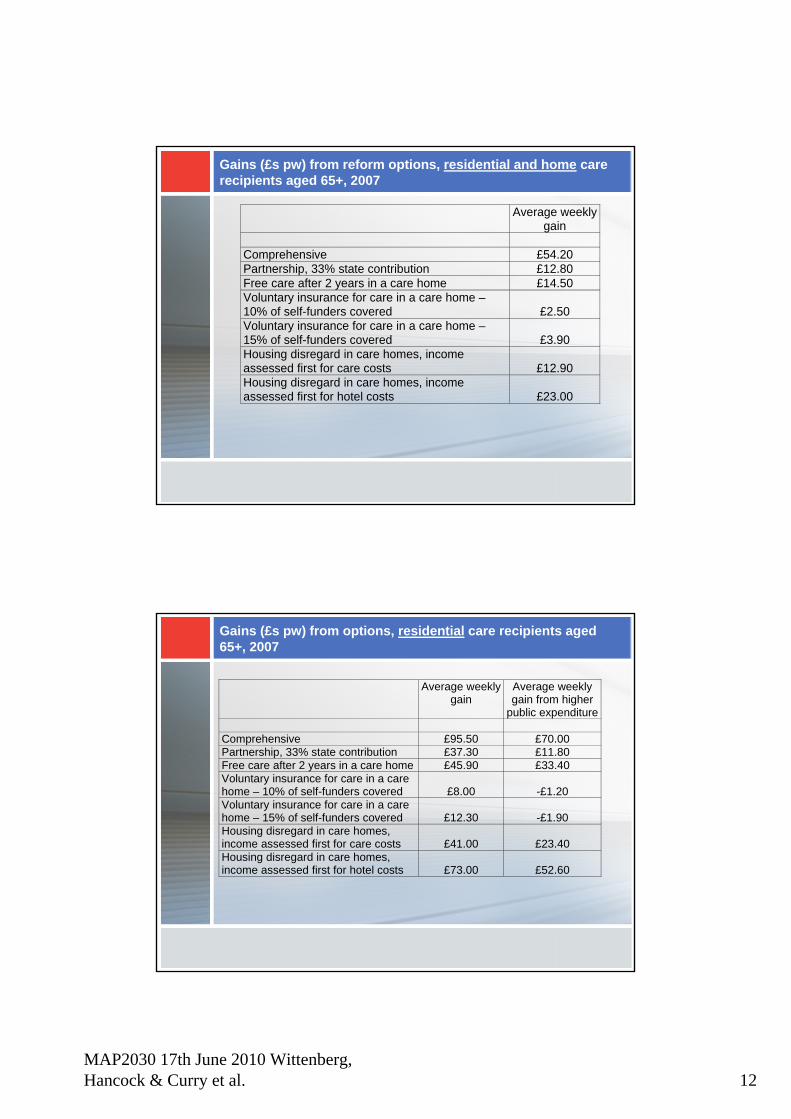
Gains (£s pw) from reform options, residential and home care recipients aged 65+, 2007
Average weekly gain
Comprehensive £54.20 Partnership, 33% state contribution £12.80 Free care after 2 years in a care home £14.50 Voluntary insurance for care in a care home – 10% of self-funders covered £2.50 Voluntary insurance for care in a care home – 15% of self-funders covered £3.90 Housing disregard in care homes, income assessed first for care costs £12.90 Housing disregard in care homes, income assessed first for hotel costs £23.00
Gains (£s pw) from options, residential care recipients aged 65+, 2007
Average weeklygain
Average weekly gain from higher
public expenditure Comprehensive £95.50 £70.00 Partnership, 33% state contribution £37.30 £11.80 Free care after 2 years in a care home £45.90 £33.40 Voluntary insurance for care in a care home – 10% of self-funders covered £8.00 -£1.20 Voluntary insurance for care in a care home – 15% of self-funders covered £12.30 -£1.90 Housing disregard in care homes, income assessed first for care costs £41.00 £23.40 Housing disregard in care homes, income assessed first for hotel costs £73.00 £52.60
MAP2030 17th June 2010 Wittenberg, Hancock & Curry et al. 13
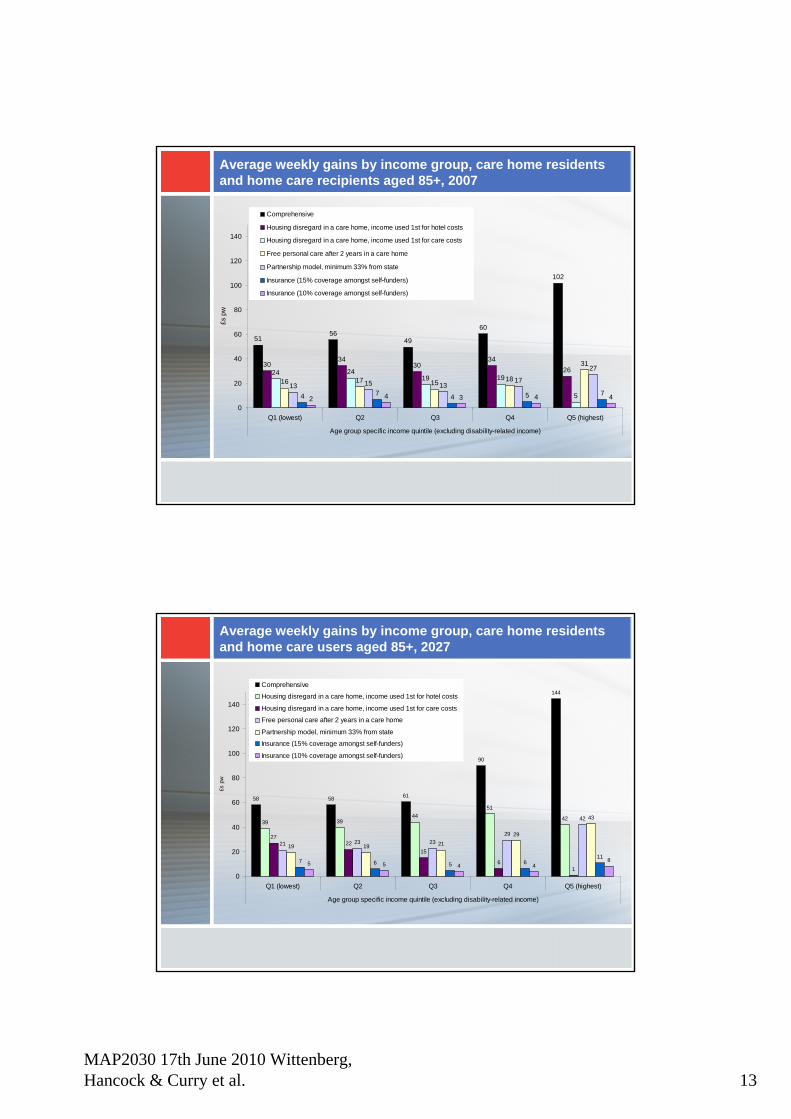
Average weekly gains by income group, care home residents and home care recipients aged 85+, 2007
5156
49
60
102
3034
3034
2624 2419 19
5
16 17 15 18
31
13 15 1317
27
4 7 4 5 72 4 3 4 4
0
20
40
60
80
100
120
140
Q1 (lowest) Q2 Q3 Q4 Q5 (highest)
Age group specific income quintile (excluding disability-related income)
£s p
wComprehensive
Housing disregard in a care home, income used 1st for hotel costs
Housing disregard in a care home, income used 1st for care costs
Free personal care after 2 years in a care home
Partnership model, minimum 33% from state
Insurance (15% coverage amongst self-funders)
Insurance (10% coverage amongst self-funders)
Average weekly gains by income group, care home residents and home care users aged 85+, 2027
58 58 61
90
144
39 3944
51
42
2722
15
61
21 23 2329
42
19 19 21
29
43
7 6 5 611
5 5 4 48
0
20
40
60
80
100
120
140
Q1 (lowest) Q2 Q3 Q4 Q5 (highest)
Age group specific income quintile (excluding disability-related income)
£s p
w
Comprehensive
Housing disregard in a care home, income used 1st for hotel costs
Housing disregard in a care home, income used 1st for care costs
Free personal care after 2 years in a care home
Partnership model, minimum 33% from state
Insurance (15% coverage amongst self-funders)
Insurance (10% coverage amongst self-funders)
MAP2030 17th June 2010 Wittenberg, Hancock & Curry et al. 14
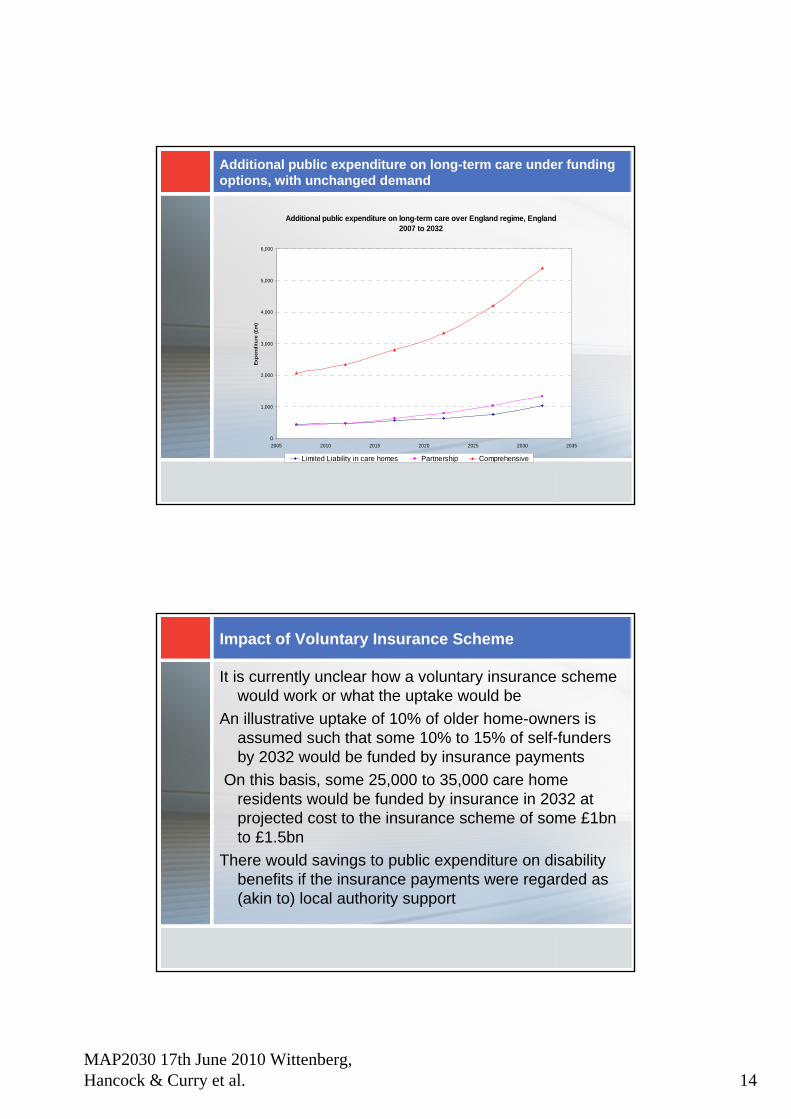
Additional public expenditure on long-term care under funding options, with unchanged demand
Additional public expenditure on long-term care over England regime, England 2007 to 2032
0
1,000
2,000
3,000
4,000
5,000
6,000
2005 2010 2015 2020 2025 2030 2035
Expe
nditu
re (£
m)
Limited Liability in care homes Partnership Comprehensive
Impact of Voluntary Insurance Scheme
It is currently unclear how a voluntary insurance scheme would work or what the uptake would be
An illustrative uptake of 10% of older home-owners is assumed such that some 10% to 15% of self-funders by 2032 would be funded by insurance payments
On this basis, some 25,000 to 35,000 care home residents would be funded by insurance in 2032 at projected cost to the insurance scheme of some £1bn to £1.5bn
There would savings to public expenditure on disability benefits if the insurance payments were regarded as (akin to) local authority support
MAP2030 17th June 2010 Wittenberg, Hancock & Curry et al. 15
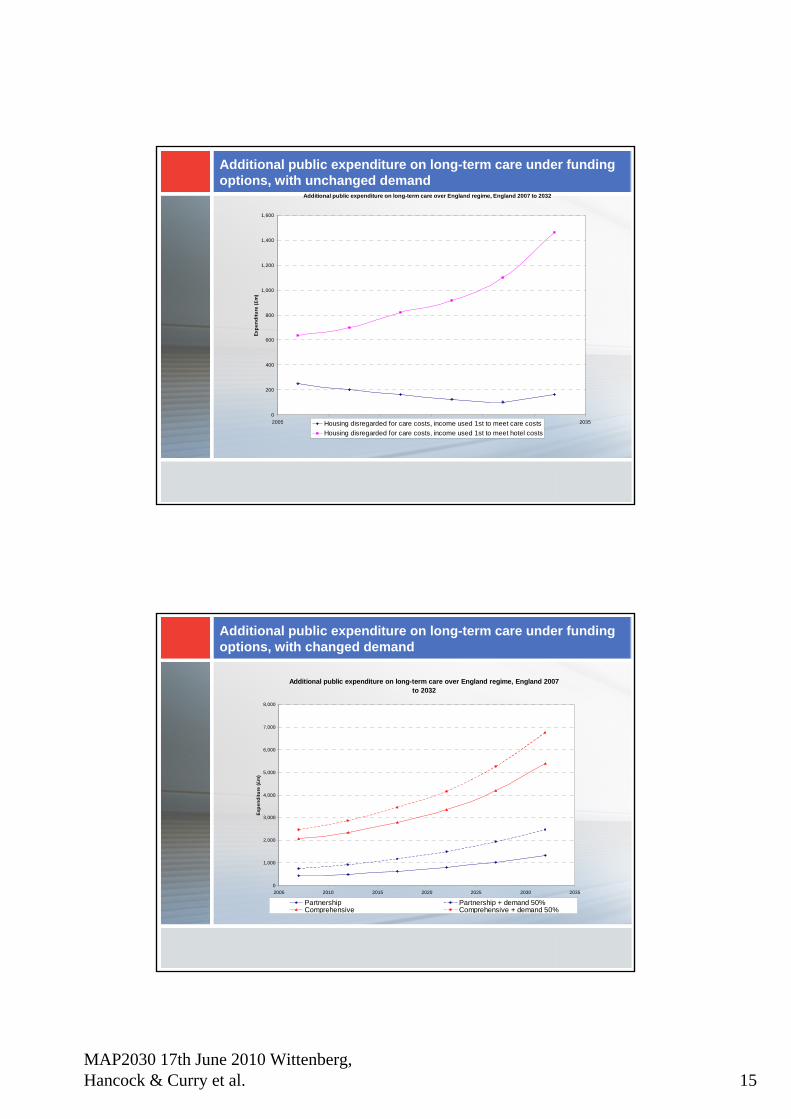
Additional public expenditure on long-term care under funding options, with unchanged demand
Additional public expenditure on long-term care over England regime, England 2007 to 2032
0
200
400
600
800
1,000
1,200
1,400
1,600
2005 2010 2015 2020 2025 2030 2035
Expe
nditu
re (£
m)
Housing disregarded for care costs, income used 1st to meet care costsHousing disregarded for care costs, income used 1st to meet hotel costs
Additional public expenditure on long-term care under funding options, with changed demand
Additional public expenditure on long-term care over England regime, England 2007 to 2032
0
1,000
2,000
3,000
4,000
5,000
6,000
7,000
8,000
2005 2010 2015 2020 2025 2030 2035
Expe
nditu
re (£
m)
Partnership Partnership + demand 50%Comprehensive Comprehensive + demand 50%
MAP2030 17th June 2010 Wittenberg, Hancock & Curry et al. 16
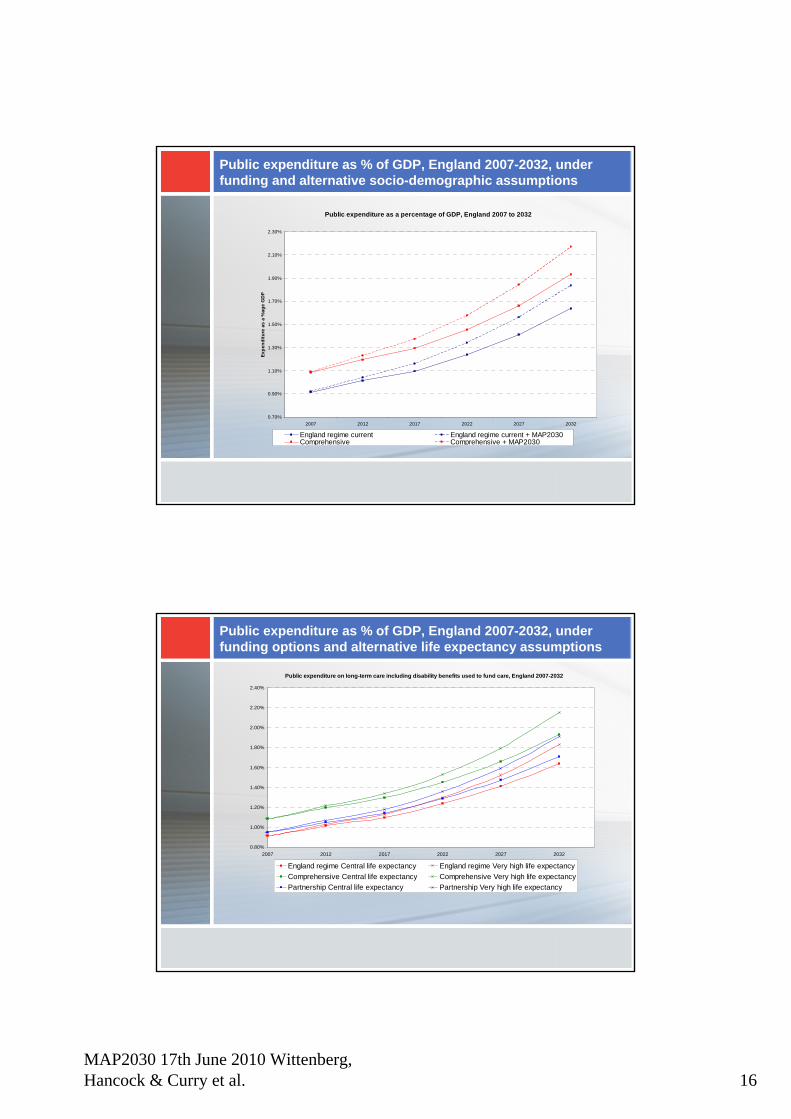
Public expenditure as % of GDP, England 2007-2032, under funding and alternative socio-demographic assumptions
Public expenditure as a percentage of GDP, England 2007 to 2032
0.70%
0.90%
1.10%
1.30%
1.50%
1.70%
1.90%
2.10%
2.30%
2007 2012 2017 2022 2027 2032
Expe
nditu
re a
s a
%ag
e G
DP
England regime current England regime current + MAP2030Comprehensive Comprehensive + MAP2030
Public expenditure as % of GDP, England 2007-2032, under funding options and alternative life expectancy assumptions
Public expenditure on long-term care including disability benefits used to fund care, England 2007-2032
0.80%
1.00%
1.20%
1.40%
1.60%
1.80%
2.00%
2.20%
2.40%
2007 2012 2017 2022 2027 2032
England regime Central life expectancy England regime Very high life expectancyComprehensive Central life expectancy Comprehensive Very high life expectancyPartnership Central life expectancy Partnership Very high life expectancy
MAP2030 17th June 2010 Wittenberg, Hancock & Curry et al. 17
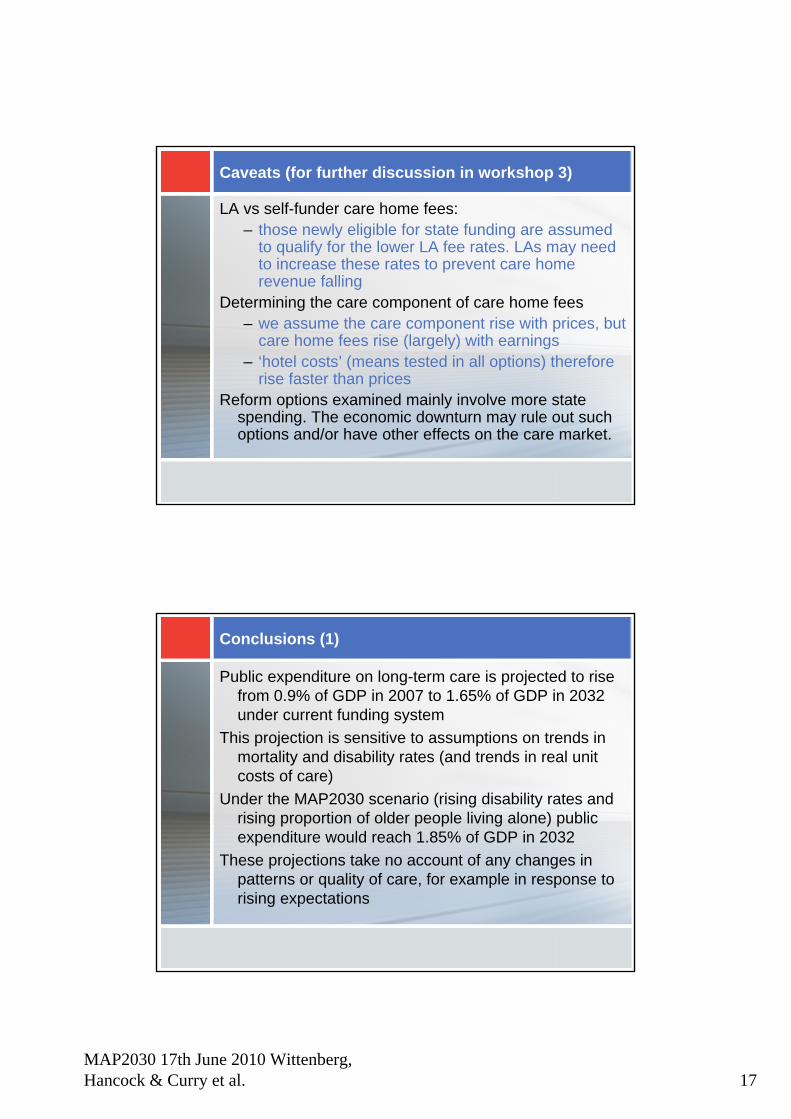
Caveats (for further discussion in workshop 3)
LA vs self-funder care home fees:– those newly eligible for state funding are assumed
to qualify for the lower LA fee rates. LAs may need to increase these rates to prevent care home revenue falling
Determining the care component of care home fees– we assume the care component rise with prices, but
care home fees rise (largely) with earnings– ‘hotel costs’ (means tested in all options) therefore
rise faster than pricesReform options examined mainly involve more state
spending. The economic downturn may rule out such options and/or have other effects on the care market.
Conclusions (1)
Public expenditure on long-term care is projected to rise from 0.9% of GDP in 2007 to 1.65% of GDP in 2032 under current funding system
This projection is sensitive to assumptions on trends in mortality and disability rates (and trends in real unit costs of care)
Under the MAP2030 scenario (rising disability rates and rising proportion of older people living alone) public expenditure would reach 1.85% of GDP in 2032
These projections take no account of any changes in patterns or quality of care, for example in response to rising expectations
MAP2030 17th June 2010 Wittenberg, Hancock & Curry et al. 18
Conclusions (2)
The additional costs to public expenditure of the various financing options in 2032, before demand effects, are:Limited liability £1.0bn; Partnership £1.3bn, Comprehensive £5.4bn; Disregard of housing assets £1.bn (income used first for hotel costs) or £0.15bn (income used first for care costs)
Demand effects could increase the 2032 costs of partnership or comprehensive by around £1bn on illustrative assumptions
These financing options, other than the housing disregard options, would benefit the higher income quintiles of the older population more than the lower quintiles, before considering how they would be funded
MAP2030 17th June 2010 Pickard 1
Linda Pickard, PSSRU, [email protected]
MAP2030 End of Project Conference17 June 2010
www.lse.ac.uk/collections/MAP2030
A growing care gap?Informal care for older people
in England to 2032
MAP2030 Programme – Informal/Unpaid Care
• One of the key aims of MAP2030 is to make projections of family circumstances of older people
• As part of Workpackage 5, PSSRU is looking at projections of informal or unpaid care for older people in England to 2032
• Builds on PSSRU Long-Term Care Finance macrosimulation model and relies on work of PSSRU colleagues (Raphael Wittenberg, Adelina Comas-Herrera, Derek King, Juliette Malley)
• Informal care defined as unpaid help with personal care or domestic tasks by family, friends or neighbours
• Focus is on informal care by children of older people
MAP2030 17th June 2010 Pickard 2
Why focus on projections of care by children?
• Concerns about supply of care by children
(1) Potential family support
• What will be availability of adult children to future cohorts of older people?
(2) Propensity to provide support
• Will such issues as increasing employment of mid-life women & changing family structures affect willingness or ability of younger generation to provide care to older parents?
• Will care be provided at levels sufficient to meet needs of growing older population?
Four types of informal care projections
1. Projections of availability of adult children to future cohorts of older people
2. Projections of household type/informal care receipt, contingent on availability of children
3. Projections of provision of informal care
4. Comparisons of projections of informal care receipt and informal care provision: a growing informal ‘care gap’?
• Note: projections mainly relate to functionally disabled population aged 65 and over in private households
MAP2030 17th June 2010 Pickard 3
General assumptions of projections
• Number of people by age and gender in future years changes in line with Government Actuary’s Department (GAD) 2006-based population projections
• Marital status changes in line with GAD 2006-based marital status and cohabitation projections
• Prevalence rates of disability by age and gender remain unchanged in future years, based on 2001/02 General Household Survey (GHS)
• Long-term care system remains unchanged, as the current system for England
1 Projections of availability of adult children
• Aim to be consistent with earlier projections of availability of children (Murphy & Grundy 2003)
• Projections use pseudo-cohort approach based on ELSA (Waves 1 & 3) data on percentages of men & women with no surviving child by age, marital status & education, key assumptions being:
• No children born after age 40 • Educational qualifications by age & gender change in
line with International Institute for Applied Systems Analysis (IIASA) projections for the UK to 2030
• Proportions of people without a child can be applied to disabled & non-disabled older population
MAP2030 17th June 2010 Pickard 4
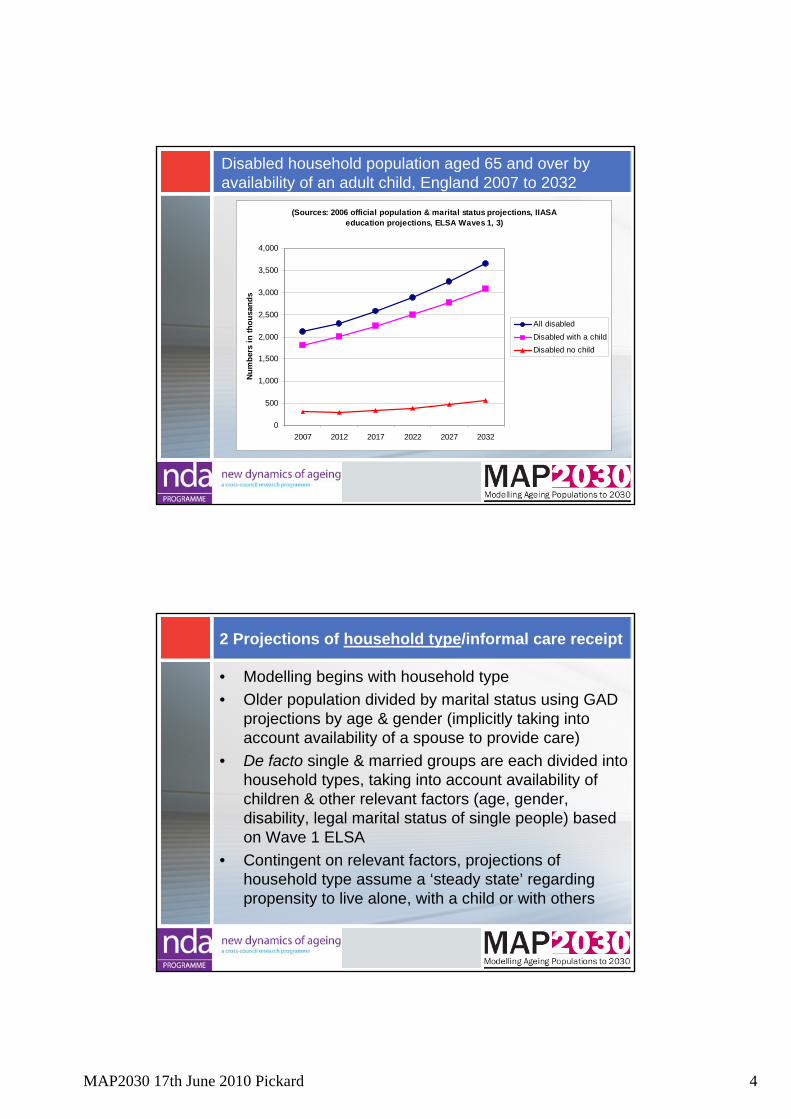
Disabled household population aged 65 and over by availability of an adult child, England 2007 to 2032
(Sources: 2006 official population & marital status projections, IIASA education projections, ELSA Waves 1, 3)
0
500
1,000
1,500
2,000
2,500
3,000
3,500
4,000
2007 2012 2017 2022 2027 2032
Num
bers
in th
ousa
nds
All disabledDisabled with a childDisabled no child
2 Projections of household type/informal care receipt
• Modelling begins with household type• Older population divided by marital status using GAD
projections by age & gender (implicitly taking into account availability of a spouse to provide care)
• De facto single & married groups are each divided into household types, taking into account availability of children & other relevant factors (age, gender, disability, legal marital status of single people) based on Wave 1 ELSA
• Contingent on relevant factors, projections of household type assume a ‘steady state’ regarding propensity to live alone, with a child or with others
MAP2030 17th June 2010 Pickard 5
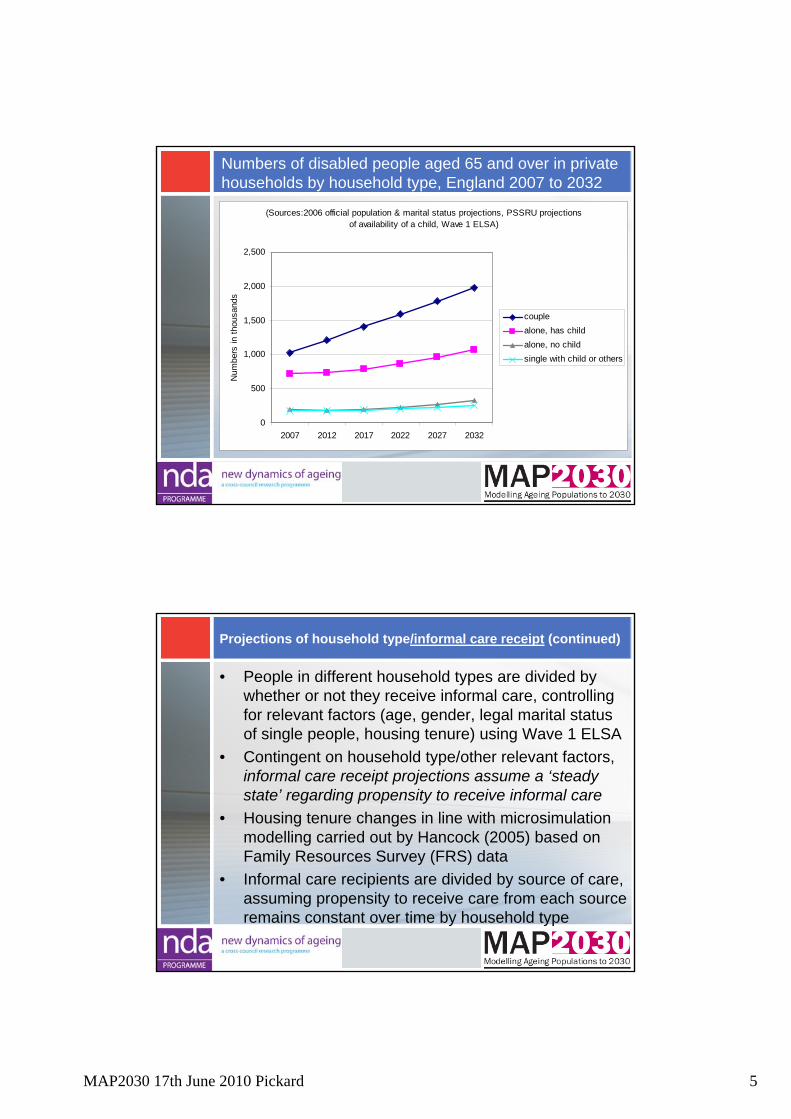
Numbers of disabled people aged 65 and over in private households by household type, England 2007 to 2032
(Sources:2006 official population & marital status projections, PSSRU projections of availability of a child, Wave 1 ELSA)
0
500
1,000
1,500
2,000
2,500
2007 2012 2017 2022 2027 2032
Num
bers
in th
ousa
nds
couplealone, has childalone, no childsingle with child or others
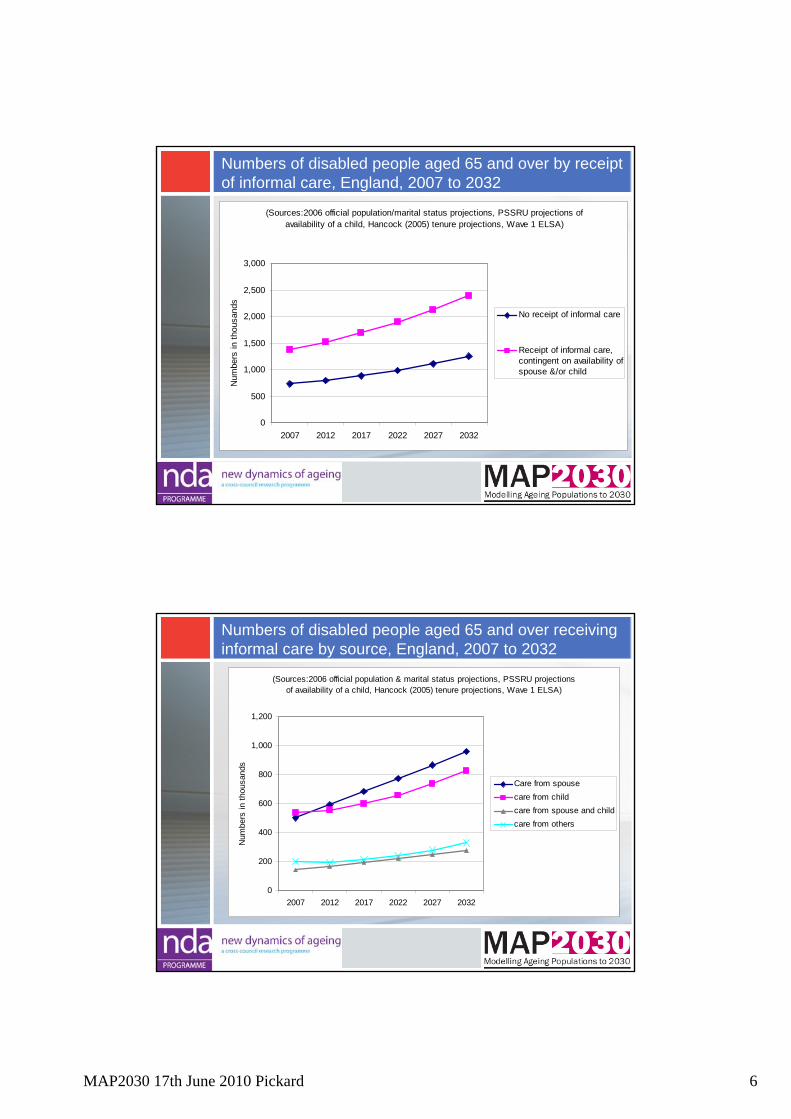
Projections of household type/informal care receipt (continued)
• People in different household types are divided by whether or not they receive informal care, controlling for relevant factors (age, gender, legal marital status of single people, housing tenure) using Wave 1 ELSA
• Contingent on household type/other relevant factors, informal care receipt projections assume a ‘steady state’ regarding propensity to receive informal care
• Housing tenure changes in line with microsimulation modelling carried out by Hancock (2005) based on Family Resources Survey (FRS) data
• Informal care recipients are divided by source of care, assuming propensity to receive care from each source remains constant over time by household type
MAP2030 17th June 2010 Pickard 6
Numbers of disabled people aged 65 and over by receipt of informal care, England, 2007 to 2032
(Sources:2006 official population/marital status projections, PSSRU projections of availability of a child, Hancock (2005) tenure projections, Wave 1 ELSA)
0
500
1,000
1,500
2,000
2,500
3,000
2007 2012 2017 2022 2027 2032
Num
bers
in th
ousa
nds
No receipt of informal care
Receipt of informal care,contingent on availability ofspouse &/or child
Numbers of disabled people aged 65 and over receiving informal care by source, England, 2007 to 2032
(Sources:2006 official population & marital status projections, PSSRU projections of availability of a child, Hancock (2005) tenure projections, Wave 1 ELSA)
0
200
400
600
800
1,000
1,200
2007 2012 2017 2022 2027 2032
Num
bers
in th
ousa
nds
Care from spousecare from childcare from spouse and childcare from others
MAP2030 17th June 2010 Pickard 7
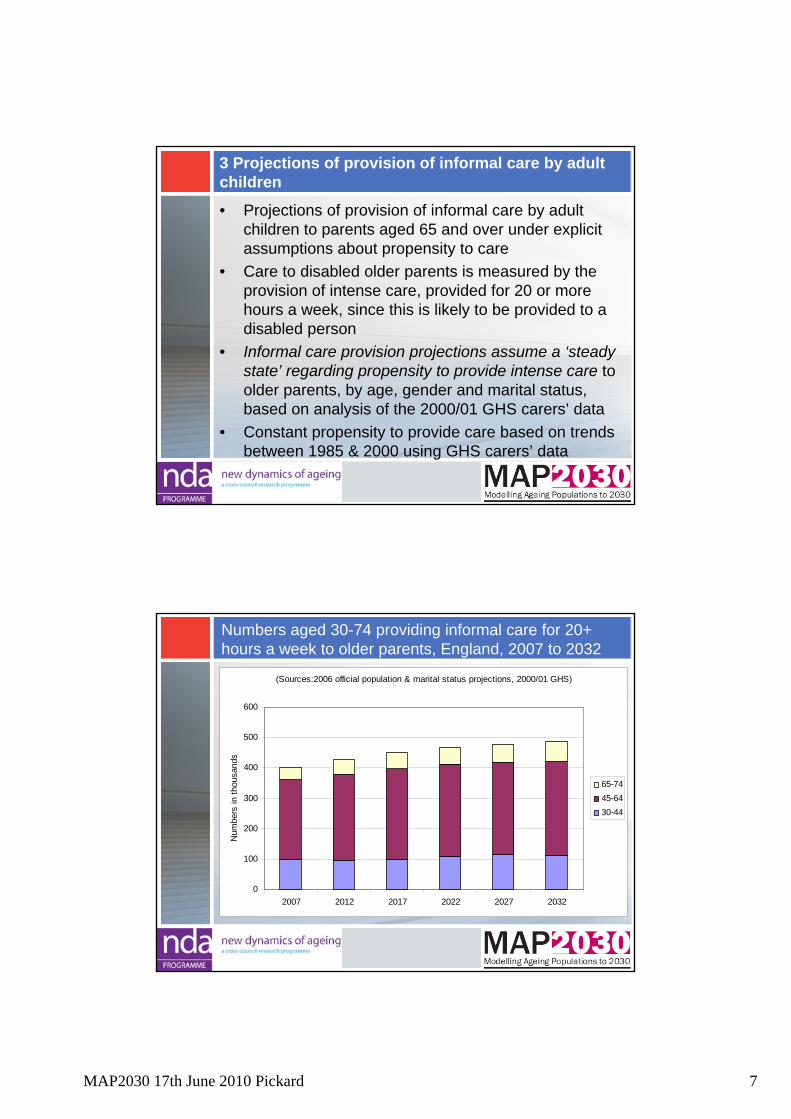
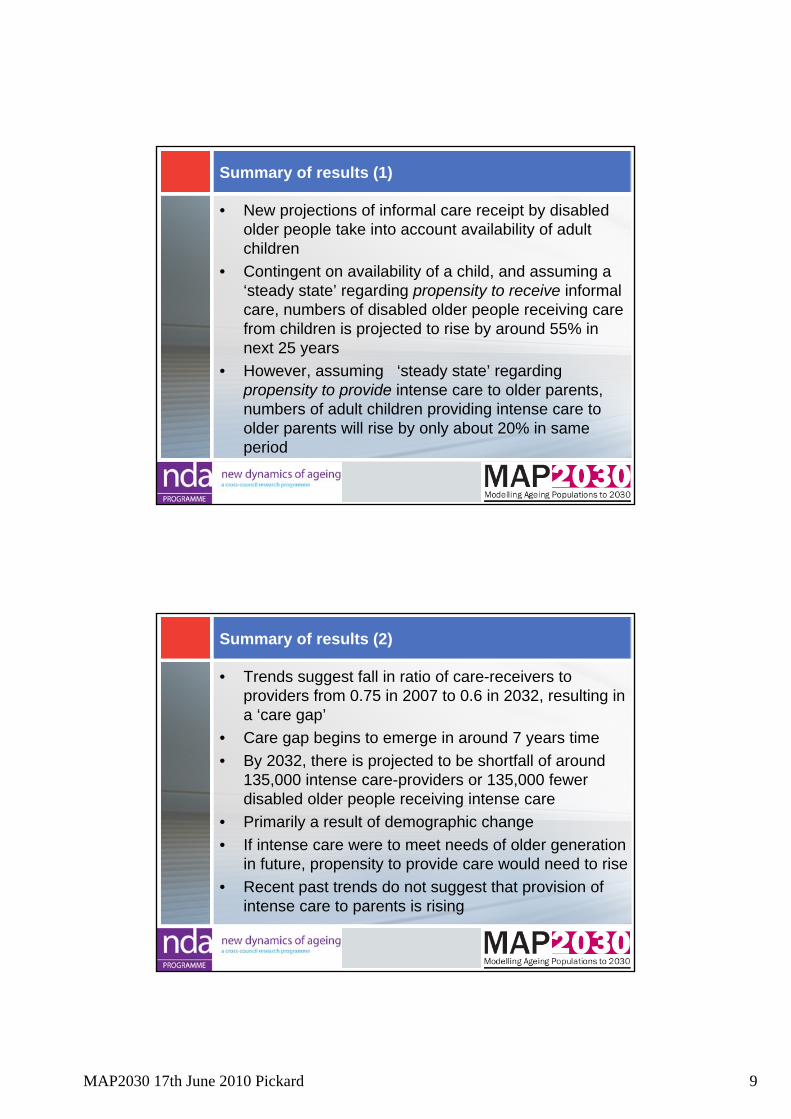
3 Projections of provision of informal care by adult children
• Projections of provision of informal care by adult children to parents aged 65 and over under explicit assumptions about propensity to care
• Care to disabled older parents is measured by the provision of intense care, provided for 20 or more hours a week, since this is likely to be provided to a disabled person
• Informal care provision projections assume a ‘steady state’ regarding propensity to provide intense care to older parents, by age, gender and marital status, based on analysis of the 2000/01 GHS carers’ data
• Constant propensity to provide care based on trends between 1985 & 2000 using GHS carers’ data
Numbers aged 30-74 providing informal care for 20+ hours a week to older parents, England, 2007 to 2032
(Sources:2006 official population & marital status projections, 2000/01 GHS)
0
100
200
300
400
500
600
2007 2012 2017 2022 2027 2032
Num
bers
in th
ousa
nds
65-7445-6430-44
MAP2030 17th June 2010 Pickard 8
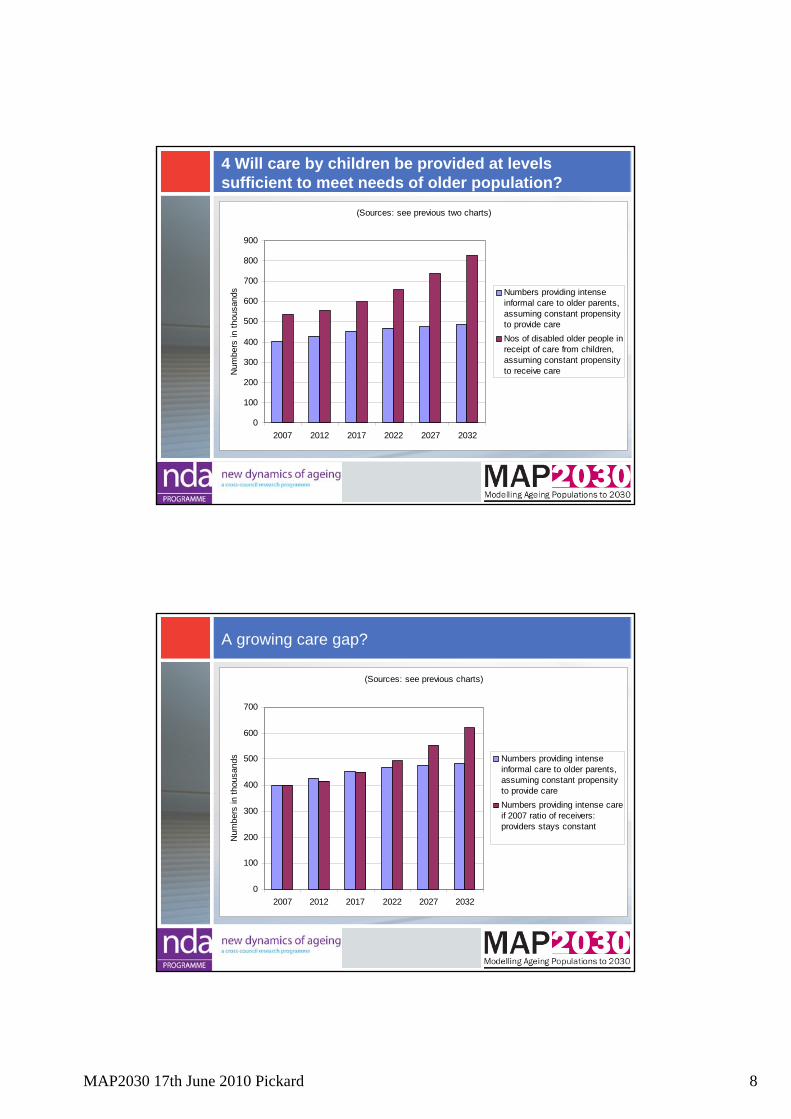
4 Will care by children be provided at levels sufficient to meet needs of older population?
(Sources: see previous two charts)
0
100
200
300
400
500
600
700
800
900
2007 2012 2017 2022 2027 2032
Num
bers
in th
ousa
nds Numbers providing intense
informal care to older parents,assuming constant propensityto provide careNos of disabled older people inreceipt of care from children,assuming constant propensityto receive care
A growing care gap?
(Sources: see previous charts)
0
100
200
300
400
500
600
700
2007 2012 2017 2022 2027 2032
Num
bers
in th
ousa
nds Numbers providing intense
informal care to older parents,assuming constant propensityto provide careNumbers providing intense careif 2007 ratio of receivers:providers stays constant
MAP2030 17th June 2010 Pickard 9
Summary of results (1)
• New projections of informal care receipt by disabled older people take into account availability of adult children
• Contingent on availability of a child, and assuming a ‘steady state’ regarding propensity to receive informal care, numbers of disabled older people receiving care from children is projected to rise by around 55% in next 25 years
• However, assuming ‘steady state’ regarding propensity to provide intense care to older parents, numbers of adult children providing intense care to older parents will rise by only about 20% in same period
Summary of results (2)
• Trends suggest fall in ratio of care-receivers to providers from 0.75 in 2007 to 0.6 in 2032, resulting in a ‘care gap’
• Care gap begins to emerge in around 7 years time• By 2032, there is projected to be shortfall of around
135,000 intense care-providers or 135,000 fewer disabled older people receiving intense care
• Primarily a result of demographic change • If intense care were to meet needs of older generation
in future, propensity to provide care would need to rise• Recent past trends do not suggest that provision of
intense care to parents is rising
MAP2030 17th June 2010 Pickard 10
Policy dilemmas: for discussion
• If intense care provision were to rise in future, would primarily affect people of ‘working age’
• Likely to contradict policies of raising labour market participation rates of ‘older workers’ as response to challenges of population ageing
• Therefore care gap may have implications for demand for long-term care services for older people in future
• Reinforces need for reform of long-term care policy • Raises questions about long-term care policies that
rely heavily on informal care • Both research and policy-making require
consideration of ‘dual focus of caring’ - policy for carers and policy for older people linked (Twigg 1992)
MAP2030 17th June 2010 Grundy & Read 1
Household and family resources of older people
Emily Grundy and Sanna ReadLondon School of Hygiene & Tropical Medicine
MAP2030 End of Project Conference17 June 2010
Outline:Trends in household patterns: past, future and implicationsFamily resource of older people – brief report
Discussion points and policy dilemmas
Family, households, health and well-being
Family identified by older people as one of the most important domains of life (Bowling 1995)
Large literature showing better health and lower mortality among married people (although some studies report best health for never-married women at oldest ages)
Several studies show higher mortality among the childlessLarge literature showing beneficial effects of social ties on health and
emotional well-beingLinks with children found to be associated with better health among older
men of lower education in Detroit (Antonucci et al 2003); Less than weekly contact with adult children associated with higher risks of
ischaemic heart disease among men in Copenhagen (Barefoot 2004). Being childless/having little contact with children associated with more
depression among older European men (Buber 2008, analysis of SHARE data).
Some studies have shown lower mortality among those with more co-residents (Welin 1985), but many show the reverse for the unmarried (i.e. worse health if living with others). Also reported associations with risk of cognitive decline.
Unmarried/childless make greater use of formal health and social care Interpretation of all complicated by selection effects.
MAP2030 17th June 2010 Grundy & Read 2
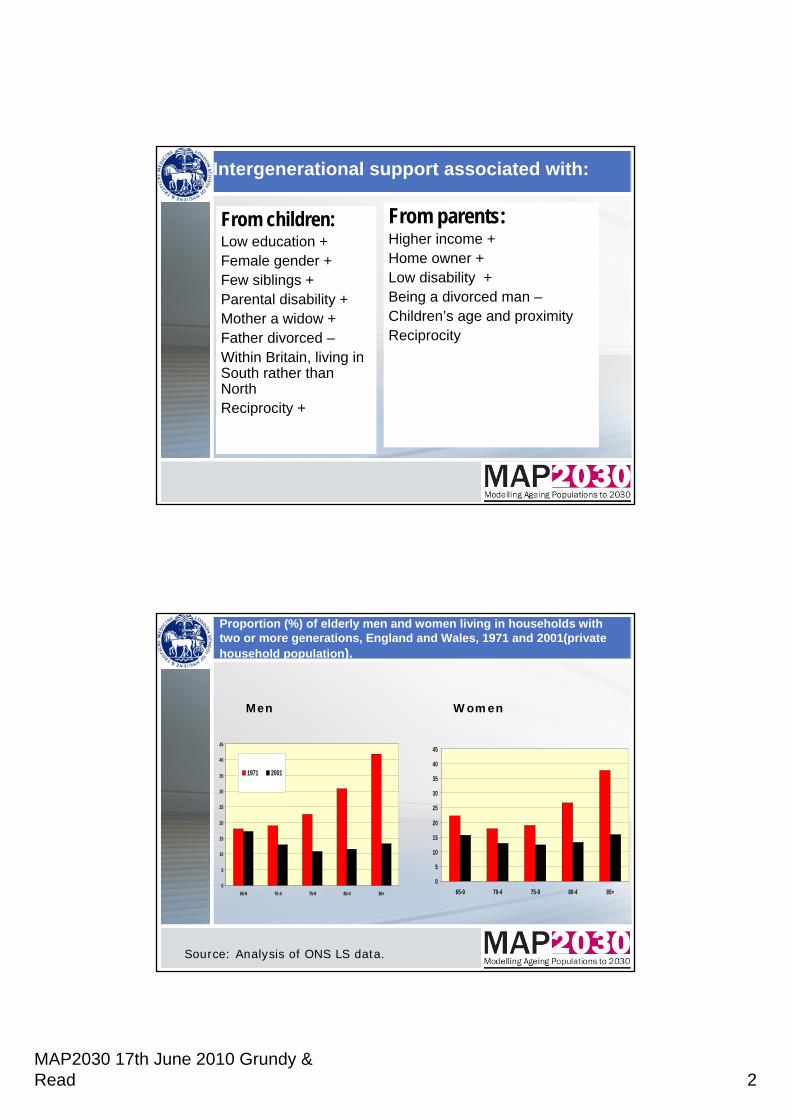
Intergenerational support associated with:
From children:Low education +Female gender +Few siblings +Parental disability +Mother a widow +Father divorced –Within Britain, living in South rather than NorthReciprocity +
From parents:Higher income +Home owner +Low disability +Being a divorced man –Children’s age and proximityReciprocity
Proportion (%) of elderly men and women living in households with two or more generations, England and Wales, 1971 and 2001(private household population).
0
5
10
15
20
25
30
35
40
45
65-9 70-4 75-9 80-4 85+
1971 2001
0
5
10
15
20
25
30
35
40
45
65-9 70-4 75-9 80-4 85+
Men Women
Source: Analysis of ONS LS data.
MAP2030 17th June 2010 Grundy & Read 3
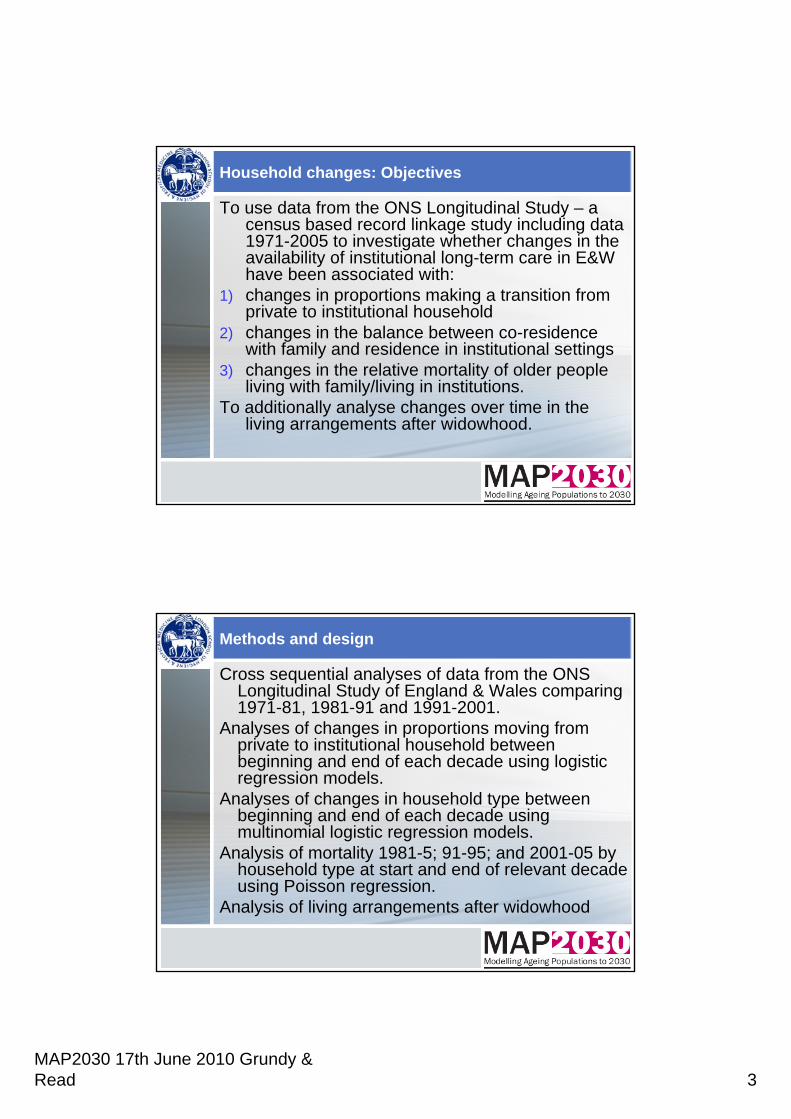
Household changes: Objectives
To use data from the ONS Longitudinal Study – a census based record linkage study including data 1971-2005 to investigate whether changes in the availability of institutional long-term care in E&W have been associated with:
1) changes in proportions making a transition from private to institutional household
2) changes in the balance between co-residence with family and residence in institutional settings
3) changes in the relative mortality of older people living with family/living in institutions.
To additionally analyse changes over time in the living arrangements after widowhood.
Methods and design
Cross sequential analyses of data from the ONS Longitudinal Study of England & Wales comparing 1971-81, 1981-91 and 1991-2001.
Analyses of changes in proportions moving from private to institutional household between beginning and end of each decade using logistic regression models.
Analyses of changes in household type between beginning and end of each decade using multinomial logistic regression models.
Analysis of mortality 1981-5; 91-95; and 2001-05 by household type at start and end of relevant decade using Poisson regression.
Analysis of living arrangements after widowhood
MAP2030 17th June 2010 Grundy & Read 4
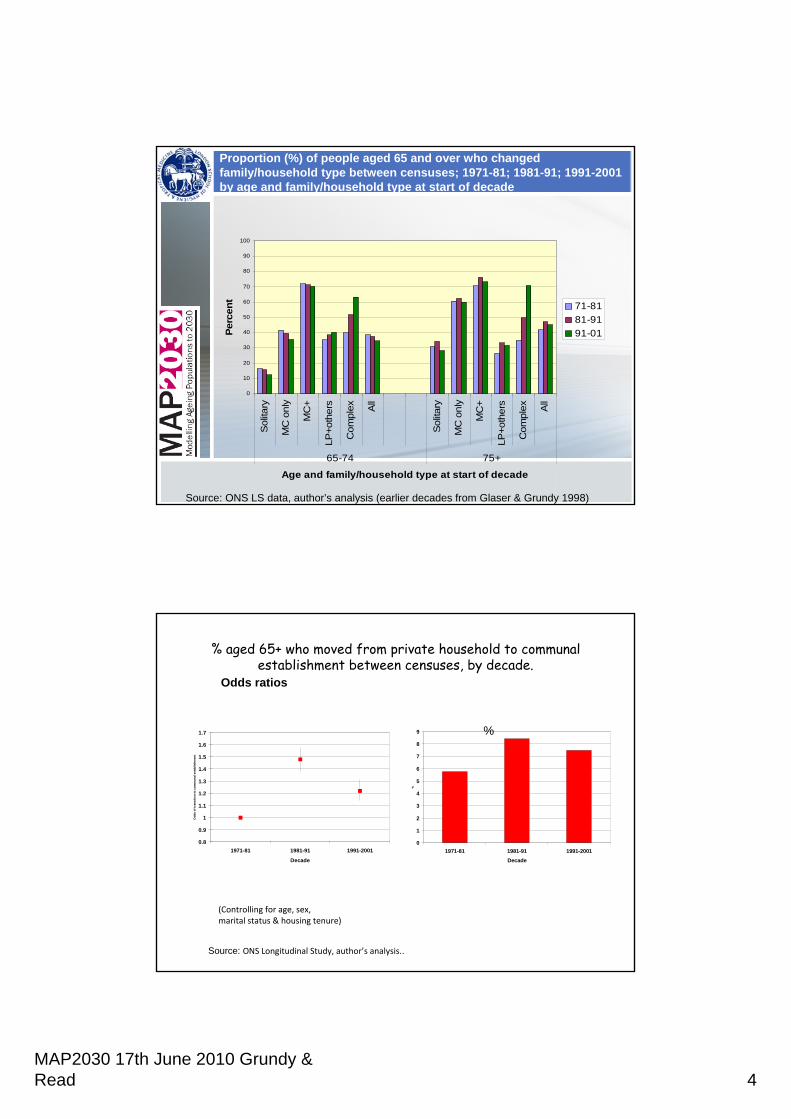
Proportion (%) of people aged 65 and over who changed family/household type between censuses; 1971-81; 1981-91; 1991-2001 by age and family/household type at start of decade
0
10
20
30
40
50
60
70
80
90
100
Sol
itary
MC
onl
y
MC
+
LP+o
ther
s
Com
plex A
ll
Sol
itary
MC
onl
y
MC
+
LP+o
ther
s
Com
plex A
ll
65-74 75+
Age and family/household type at start of decade
Perc
ent
71-8181-9191-01
Source: ONS LS data, author’s analysis (earlier decades from Glaser & Grundy 1998)
% aged 65+ who moved from private household to communal establishment between censuses, by decade.
0.8
0.9
1
1.1
1.2
1.3
1.4
1.5
1.6
1.7
1971-81 1981-91 1991-2001
Decade
Odd
s of
tran
sitio
n to
com
mun
al e
stab
lishm
ent
0
1
2
3
4
5
6
7
8
9
1971-81 1981-91 1991-2001Decade
%
Source: ONS Longitudinal Study, author’s analysis..
Odds ratios
(Controlling for age, sex, marital status & housing tenure)
%
MAP2030 17th June 2010 Grundy & Read 5
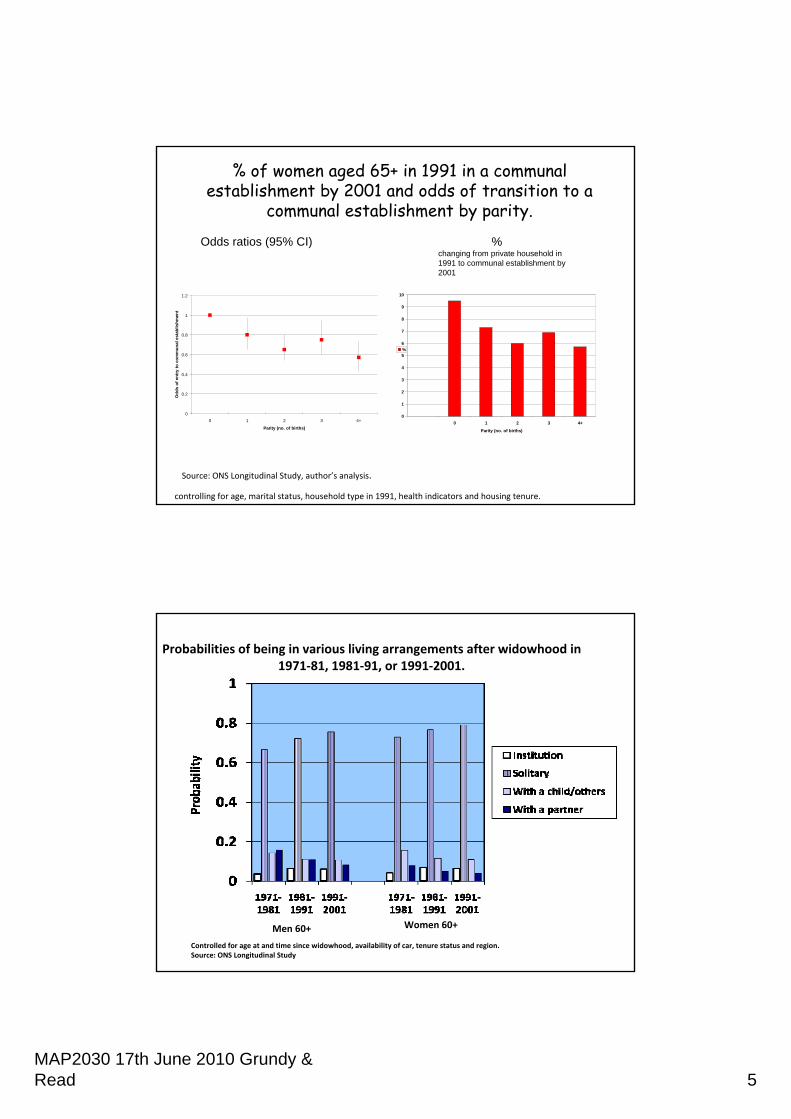
% of women aged 65+ in 1991 in a communal establishment by 2001 and odds of transition to a
communal establishment by parity.
0
0.2
0.4
0.6
0.8
1
1.2
0 1 2 3 4+
Parity (no. of births)
Odd
s of
ent
ry to
com
mun
al e
stab
lishm
ent
0
1
2
3
4
5
6
7
8
9
10
0 1 2 3 4+
Parity (no. of births)
%
Odds ratios (95% CI) % changing from private household in 1991 to communal establishment by 2001
Source: ONS Longitudinal Study, author’s analysis.
controlling for age, marital status, household type in 1991, health indicators and housing tenure.
Men 60+ Women 60+
Probabilities of being in various living arrangements after widowhood in 1971‐81, 1981‐91, or 1991‐2001.
Controlled for age at and time since widowhood, availability of car, tenure status and region. Source: ONS Longitudinal Study
MAP2030 17th June 2010 Grundy & Read 6
Results summaryThe risk of making a transition from a private to a non-private
household was much higher in the 1981-91 decade than in 1971-81; in 1991-2001 it fell but was still higher than in the first decade – reflection in part of policy changes.
Higher risks of transitions to institutions were associated with long term illness; older age; being unmarried (especially never-married); not owning a home; being female and living in the North. (Results from fully adjusted model).
Among women, those who had never had children had the highest risk, and those who had had two children the lowest, of transition to an institution (taking account of marital status and other relevant co-variates).
Those in institutions had higher mortality than those living with family – not equivalent groups in terms of health status. Excess mortality of institutional population higher 2001-05 than previous decades – suggests effect of stricter prior assessment.
Downward trend in transitions to living with relatives versus other arrangements (increase living alone or just with a spouse).
Increasing trend towards living alone after widowhood/widowerhood.
Modelling changes in household type: Methods
Demographic parameters (age, sex, marital status)Cross sequential analyses of data from the ONS Longitudinal
Study of England & Wales comparing 1971-81, 1981-91 and 1991-2001 to identify trend in shifts to different types of living arrangement
In full model further modification to take account of changes indisability
Further work will include modification to take account of availability of a child
MAP2030 17th June 2010 Grundy & Read 7
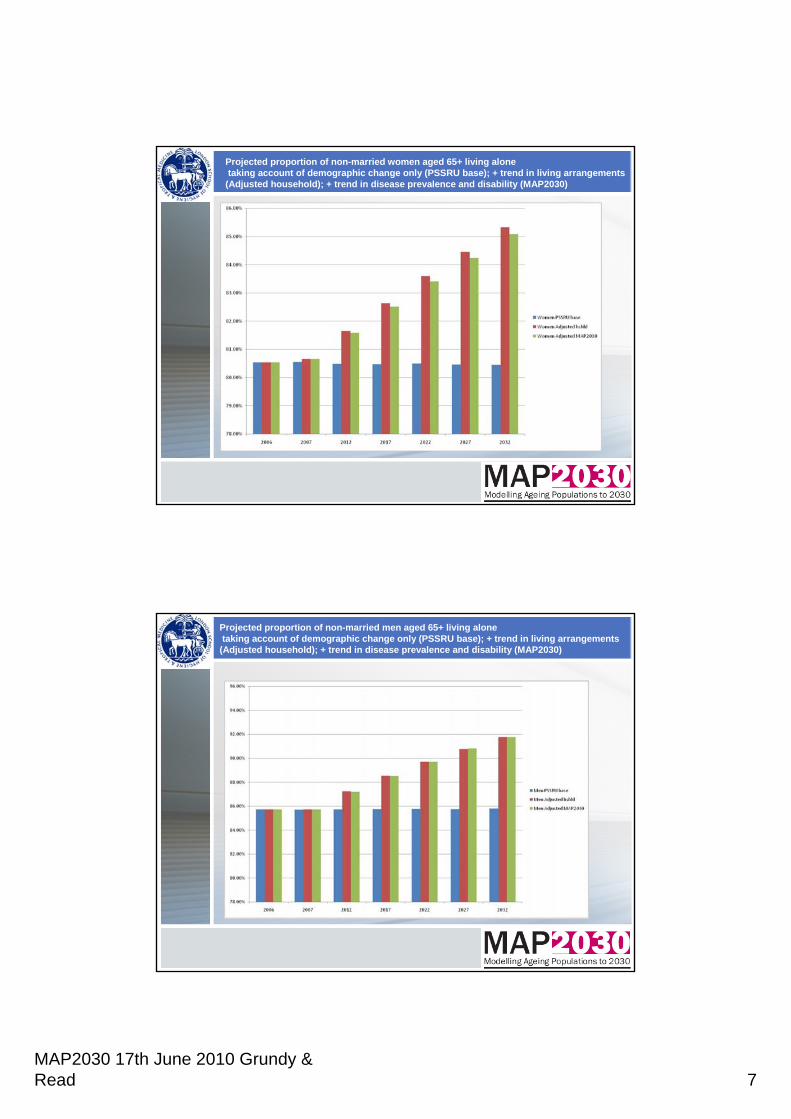
Projected proportion of non-married women aged 65+ living alonetaking account of demographic change only (PSSRU base); + trend in living arrangements
(Adjusted household); + trend in disease prevalence and disability (MAP2030)
Projected proportion of non-married men aged 65+ living alonetaking account of demographic change only (PSSRU base); + trend in living arrangements
(Adjusted household); + trend in disease prevalence and disability (MAP2030)
MAP2030 17th June 2010 Grundy & Read 8
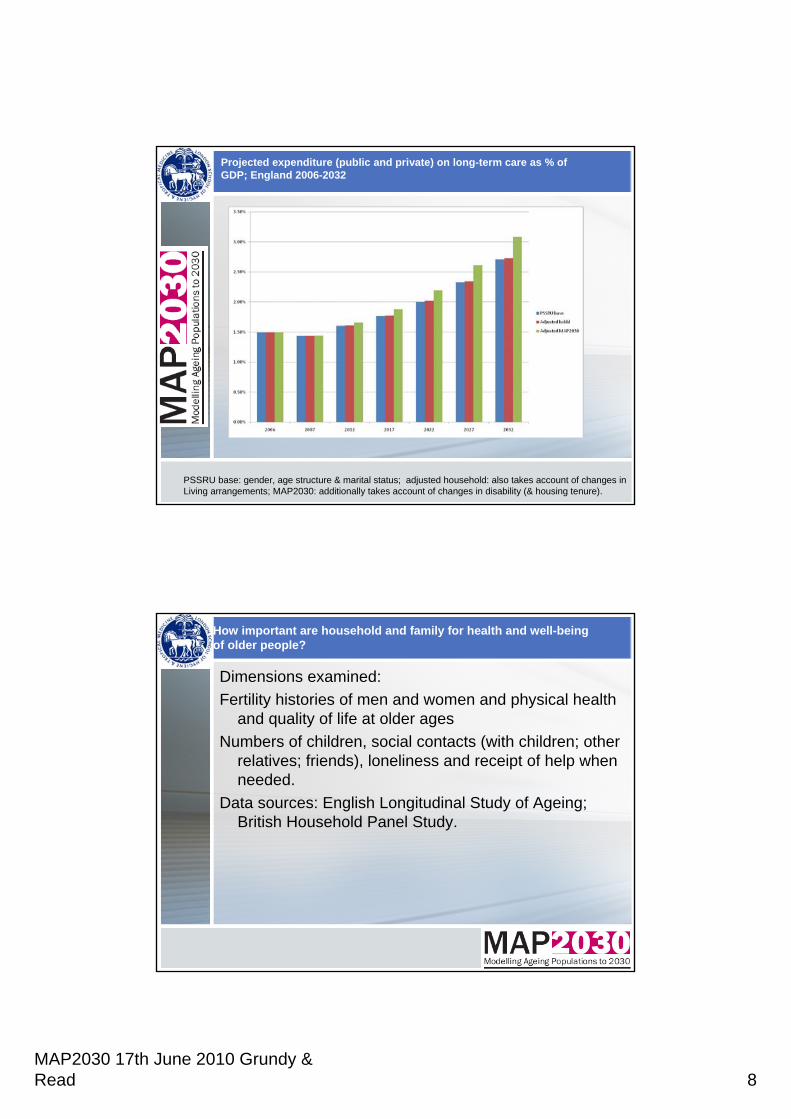
Projected expenditure (public and private) on long-term care as % of GDP; England 2006-2032
PSSRU base: gender, age structure & marital status; adjusted household: also takes account of changes inLiving arrangements; MAP2030: additionally takes account of changes in disability (& housing tenure).
How important are household and family for health and well-being of older people?
Dimensions examined: Fertility histories of men and women and physical health
and quality of life at older agesNumbers of children, social contacts (with children; other
relatives; friends), loneliness and receipt of help when needed.
Data sources: English Longitudinal Study of Ageing; British Household Panel Study.
MAP2030 17th June 2010 Grundy & Read 9
Summary of results:
Results suggest that early entry to parenthood and to some extent high parity were related to poorer quality of life and poorer health at older ages’ but had minor effects on loneliness.
Older parents had more social contacts than the childless with availability of a daughter being particularly important.
Among older women with one or more limitations in ability to undertake Activities of Daily Living, number of children was associated with receipt of help, but we did not find a similar association among men.
Differentials by level of education and other socio-economic indicators in line with previous studies.
Policy dilemmas: for discussion
Policies to extend length of working life may reduce help from older people to children and grandchildren – could weaken bonds of reciprocity
Reducing state support for older people and requiring more of families could lead to conflicts with other roles (e.g. raising children themselves)
Targetting supports on elderly living alone/lacking family support could over burden and discourage family care; providing more support could ’crowd out’ family care
Both research and policy making requires consideration of the life course and intergenerational linkages.
Some policies beneficial in all regards e.g. promotion of healthy ageing through primary prevention (discourgaing smoking etc), secondary prevention (e.g. treating hypertension and cvd risk factors) and rehabilitation and enabling supports.
Current economic climate means deciding on priorities particularly important.
Areas for discussion
1. The Credit Crunch: Long-term Care and Pensions
2. Behavioural responses to policy: demand effects
3. Funding reform options and care home fees
4. Pension reform options
Ruth Hancock & Marcello Morciano (UEA)
Raphael Wittenberg, Adelina Comas-Herrera, Juliette Malley, Derek King & Linda Pickard (PSSRU)
Chris Curry, John Adams & Sean James (PPI)
MAP2030 End of Project Conference
17 June 2010
The Credit Crunch: Long-term Care and Pensions: ideas for a further research project
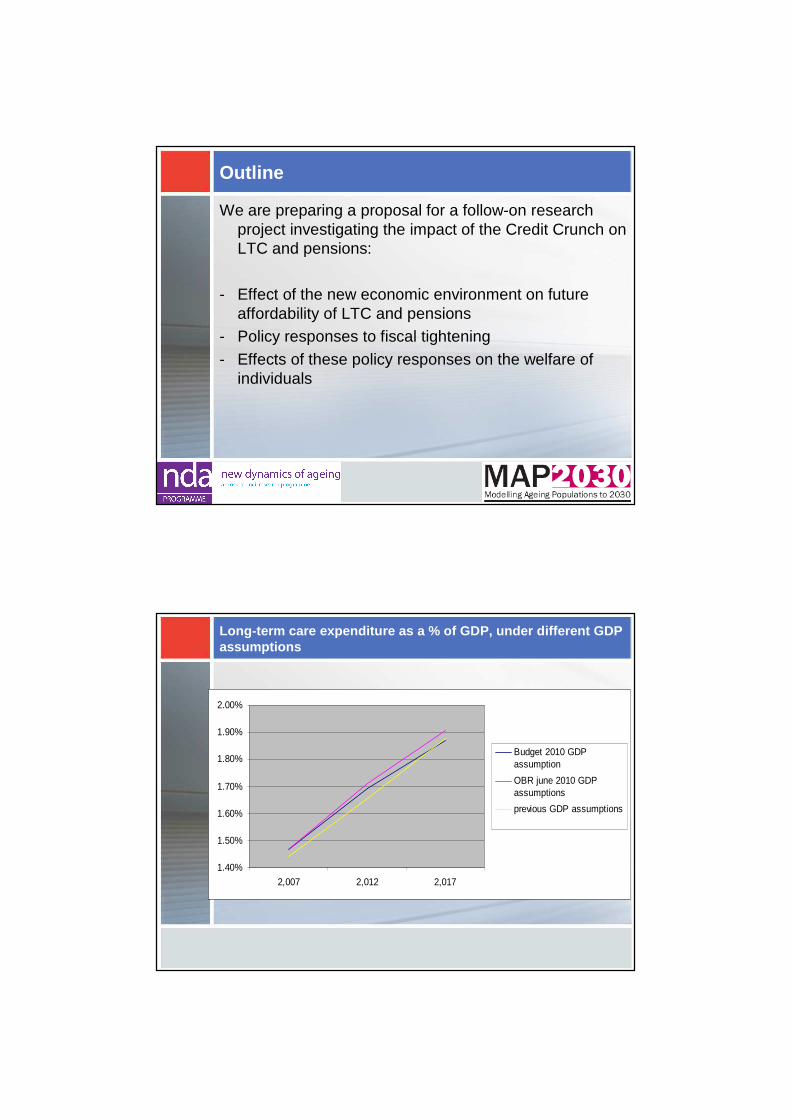
Outline
We are preparing a proposal for a follow-on research project investigating the impact of the Credit Crunch on LTC and pensions:
- Effect of the new economic environment on future affordability of LTC and pensions
- Policy responses to fiscal tightening- Effects of these policy responses on the welfare of
individuals
Long-term care expenditure as a % of GDP, under dif ferent GDP assumptions
1.40%
1.50%
1.60%
1.70%
1.80%
1.90%
2.00%
2,007 2,012 2,017
Budget 2010 GDPassumption
OBR june 2010 GDPassumptions
previous GDP assumptions
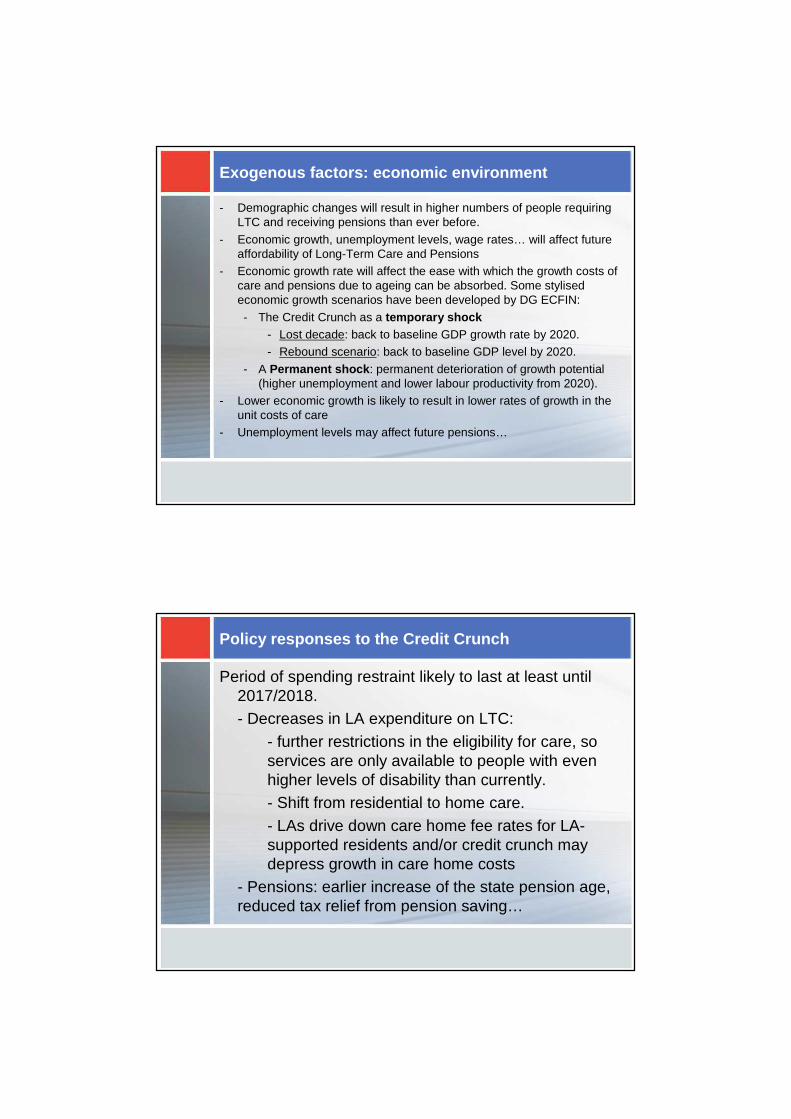
Exogenous factors: economic environment
- Demographic changes will result in higher numbers of people requiring LTC and receiving pensions than ever before.
- Economic growth, unemployment levels, wage rates… will affect future affordability of Long-Term Care and Pensions
- Economic growth rate will affect the ease with which the growth costs of care and pensions due to ageing can be absorbed. Some stylised economic growth scenarios have been developed by DG ECFIN:
- The Credit Crunch as a temporary shock- Lost decade: back to baseline GDP growth rate by 2020.- Rebound scenario: back to baseline GDP level by 2020.
- A Permanent shock : permanent deterioration of growth potential (higher unemployment and lower labour productivity from 2020).
- Lower economic growth is likely to result in lower rates of growth in the unit costs of care
- Unemployment levels may affect future pensions…
Policy responses to the Credit Crunch
Period of spending restraint likely to last at least until 2017/2018.- Decreases in LA expenditure on LTC:
- further restrictions in the eligibility for care, so services are only available to people with even higher levels of disability than currently.- Shift from residential to home care.- LAs drive down care home fee rates for LA-supported residents and/or credit crunch may depress growth in care home costs
- Pensions: earlier increase of the state pension age, reduced tax relief from pension saving…
Measuring the impact:
- How to measure the welfare loss as a result of possible decreases in LA expenditure?- Hours of publicly funded care lost / numbers of older
people who would no longer be going into a care home.
- Other measures?- Pension changes: distributional impact.- Links between pensions and ability to meet LTC costs:
linking PPI’s model and CARESIM to look at whether there would be an increase in people eligible for public funding.
Behavioural responses to policy:
Demand effects
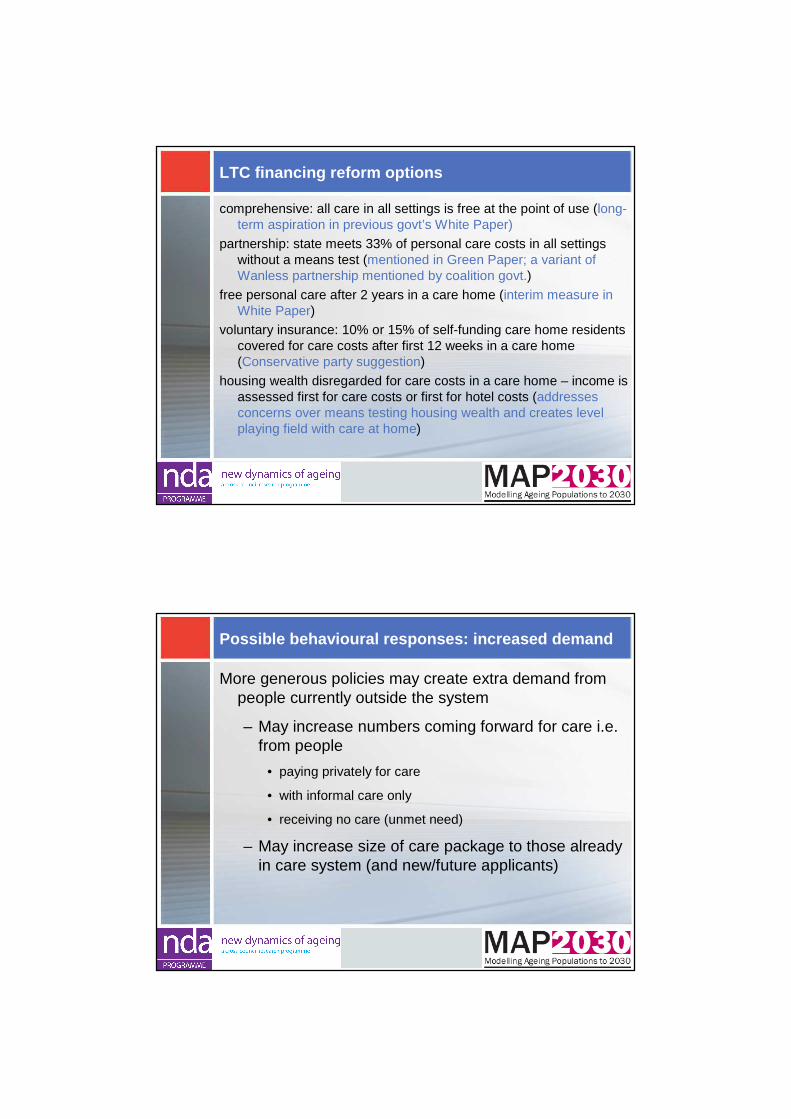
LTC financing reform options
comprehensive: all care in all settings is free at the point of use (long-term aspiration in previous govt’s White Paper)
partnership: state meets 33% of personal care costs in all settings without a means test (mentioned in Green Paper; a variant of Wanless partnership mentioned by coalition govt.)
free personal care after 2 years in a care home (interim measure in White Paper)
voluntary insurance: 10% or 15% of self-funding care home residents covered for care costs after first 12 weeks in a care home (Conservative party suggestion)
housing wealth disregarded for care costs in a care home – income is assessed first for care costs or first for hotel costs (addresses concerns over means testing housing wealth and creates level playing field with care at home)
Possible behavioural responses: increased demand
More generous policies may create extra demand from people currently outside the system
– May increase numbers coming forward for care i.e. from people
• paying privately for care
• with informal care only
• receiving no care (unmet need)
– May increase size of care package to those already in care system (and new/future applicants)
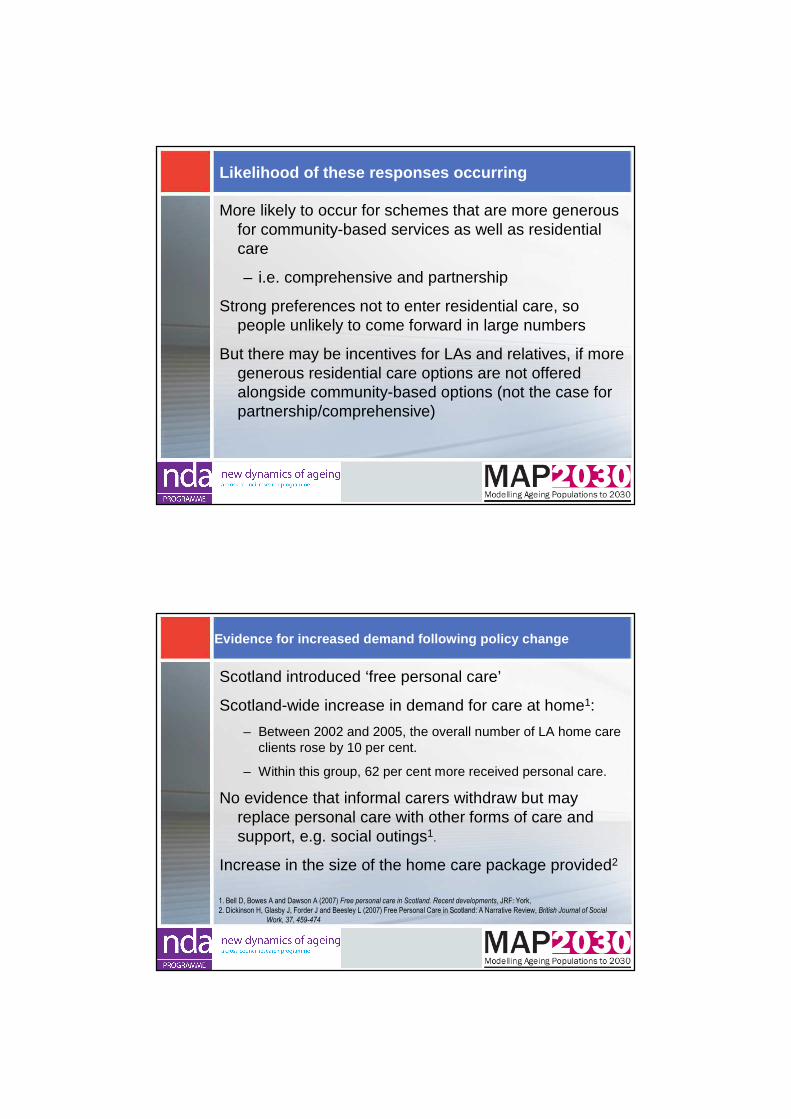
Likelihood of these responses occurring
More likely to occur for schemes that are more generous for community-based services as well as residential care
– i.e. comprehensive and partnership
Strong preferences not to enter residential care, so people unlikely to come forward in large numbers
But there may be incentives for LAs and relatives, if more generous residential care options are not offered alongside community-based options (not the case for partnership/comprehensive)
Evidence for increased demand following policy chan ge
Scotland introduced ‘free personal care’
Scotland-wide increase in demand for care at home1:
– Between 2002 and 2005, the overall number of LA home care clients rose by 10 per cent.
– Within this group, 62 per cent more received personal care.
No evidence that informal carers withdraw but may replace personal care with other forms of care and support, e.g. social outings1.
Increase in the size of the home care package provided2
1. Bell D, Bowes A and Dawson A (2007) Free personal care in Scotland. Recent developments, JRF: York,
2. Dickinson H, Glasby J, Forder J and Beesley L (2007) Free Personal Care in Scotland: A Narrative Review, British Journal of Social
Work, 37, 459-474
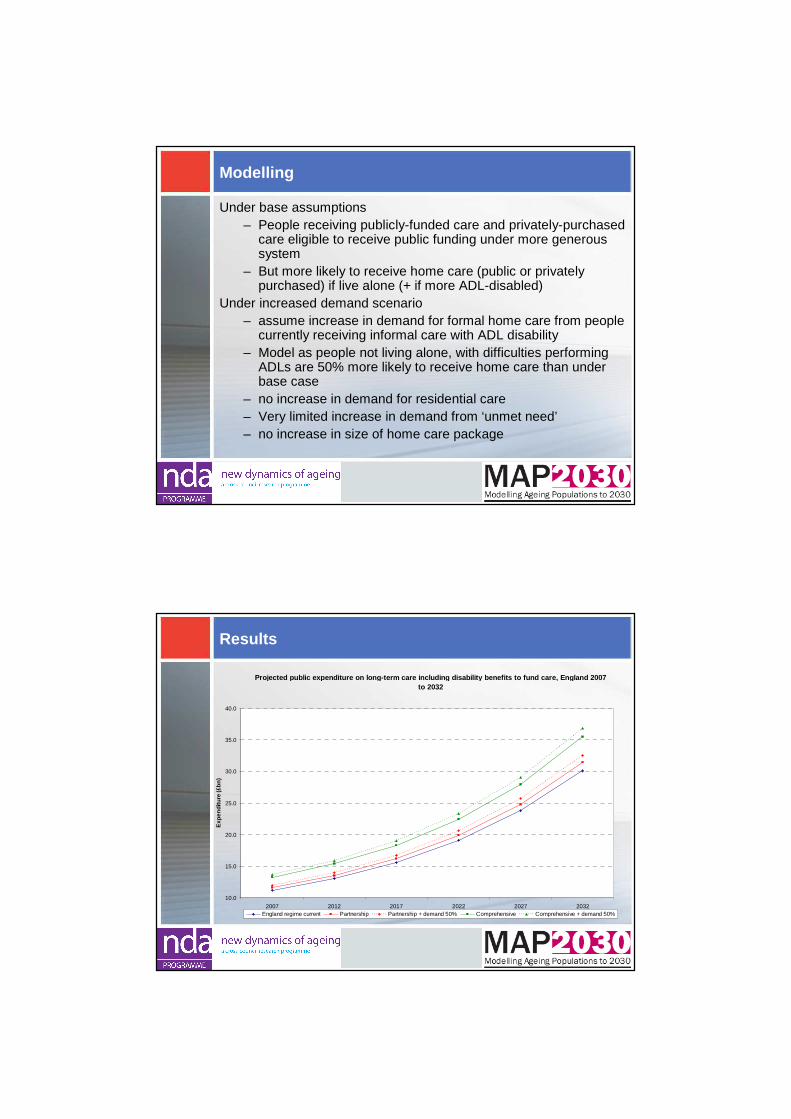
Modelling
Under base assumptions – People receiving publicly-funded care and privately-purchased
care eligible to receive public funding under more generous system
– But more likely to receive home care (public or privately purchased) if live alone (+ if more ADL-disabled)
Under increased demand scenario– assume increase in demand for formal home care from people
currently receiving informal care with ADL disability– Model as people not living alone, with difficulties performing
ADLs are 50% more likely to receive home care than under base case
– no increase in demand for residential care– Very limited increase in demand from ‘unmet need’– no increase in size of home care package
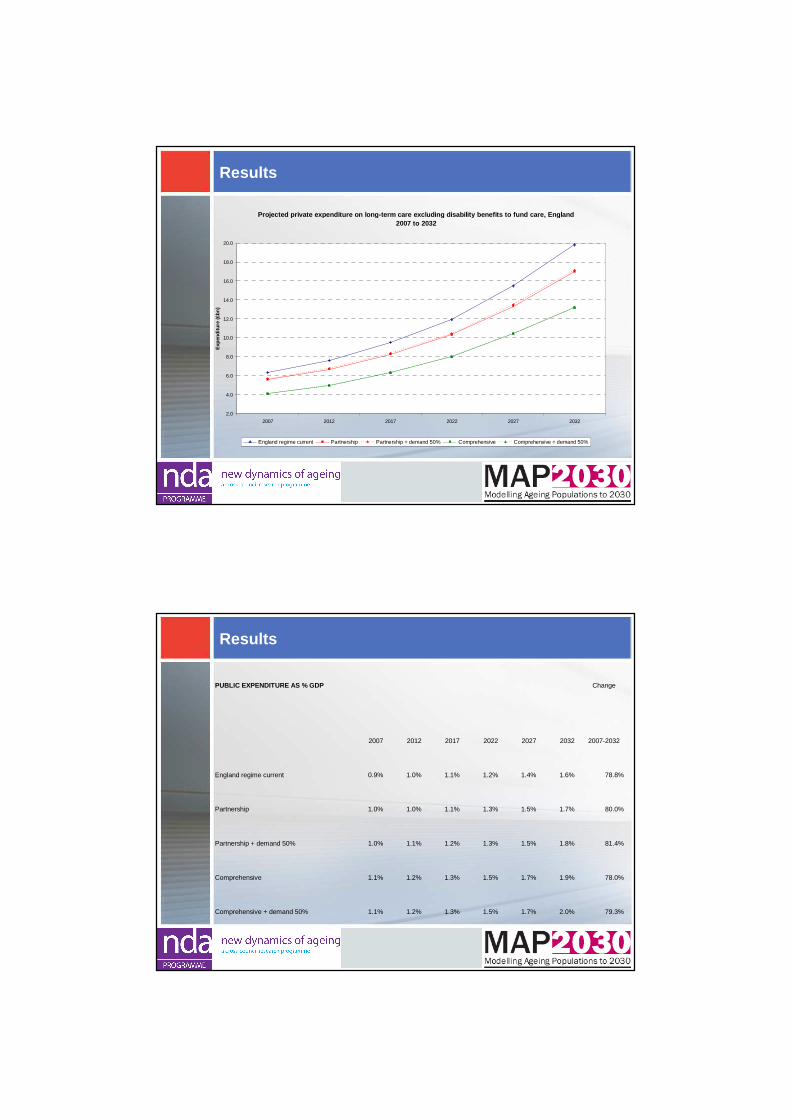
Results
Projected public expenditure on long-term care incl uding disability benefits to fund care, England 200 7 to 2032
10.0
15.0
20.0
25.0
30.0
35.0
40.0
2007 2012 2017 2022 2027 2032
Exp
endi
ture
(£bn
)
England regime current Partnership Partnership + demand 50% Comprehensive Comprehensive + demand 50%
Results
Projected private expenditure on long-term care exc luding disability benefits to fund care, England 2007 to 2032
2.0
4.0
6.0
8.0
10.0
12.0
14.0
16.0
18.0
20.0
2007 2012 2017 2022 2027 2032
Exp
endi
ture
(£b
n)
England regime current Partnership Partnership + demand 50% Comprehensive Comprehensive + demand 50%
Results
PUBLIC EXPENDITURE AS % GDP Change
2007 2012 2017 2022 2027 2032 2007-2032
England regime current 0.9% 1.0% 1.1% 1.2% 1.4% 1.6% 78.8%
Partnership 1.0% 1.0% 1.1% 1.3% 1.5% 1.7% 80.0%
Partnership + demand 50% 1.0% 1.1% 1.2% 1.3% 1.5% 1.8% 81.4%
Comprehensive 1.1% 1.2% 1.3% 1.5% 1.7% 1.9% 78.0%
Comprehensive + demand 50% 1.1% 1.2% 1.3% 1.5% 1.7% 2.0% 79.3%
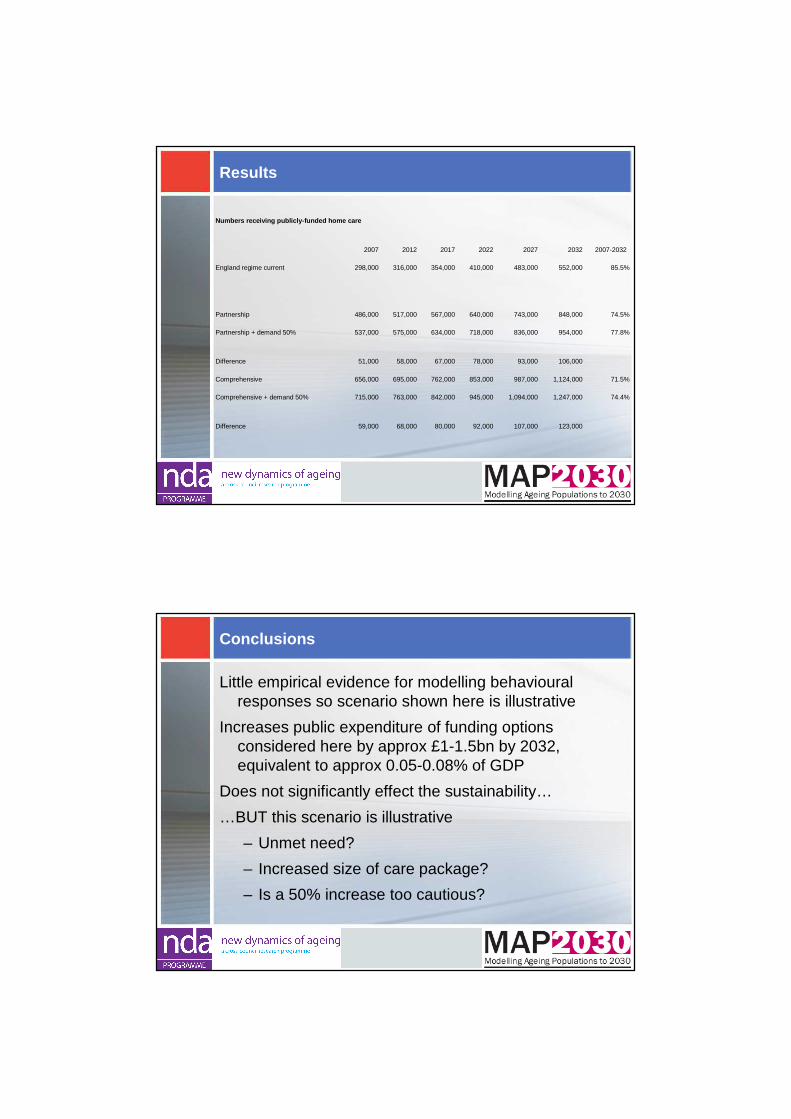
Results
Numbers receiving publicly-funded home care
2007 2012 2017 2022 2027 2032 2007-2032
England regime current 298,000 316,000 354,000 410,000 483,000 552,000 85.5%
Partnership 486,000 517,000 567,000 640,000 743,000 848,000 74.5%
Partnership + demand 50% 537,000 575,000 634,000 718,000 836,000 954,000 77.8%
Difference 51,000 58,000 67,000 78,000 93,000 106,000
Comprehensive 656,000 695,000 762,000 853,000 987,000 1,124,000 71.5%
Comprehensive + demand 50% 715,000 763,000 842,000 945,000 1,094,000 1,247,000 74.4%
Difference 59,000 68,000 80,000 92,000 107,000 123,000
Conclusions
Little empirical evidence for modelling behavioural responses so scenario shown here is illustrative
Increases public expenditure of funding options considered here by approx £1-1.5bn by 2032, equivalent to approx 0.05-0.08% of GDP
Does not significantly effect the sustainability…
…BUT this scenario is illustrative
– Unmet need?
– Increased size of care package?
– Is a 50% increase too cautious?
FUNDING REFORM OPTIONS AND CARE
HOME FEES
LA-supported versus self-funder Care Home Fees
LAs often negotiate reduced (below market?) fee rates for residents receiving LA financial support. Care homes raise self-funder fees to compensate.
Reforms which increase the % of residents for whom care homes receive the lower fee will reduce care home revenue unless:(1) LAs increase the rate they pay
(2) the self-funder rate rises (without loss of demand)
or(3) those who self-fund under the current system continue to pay
the self-funder rate but with the possibility of a contribution from the state (as happened when FPC was introduced in Scotland)
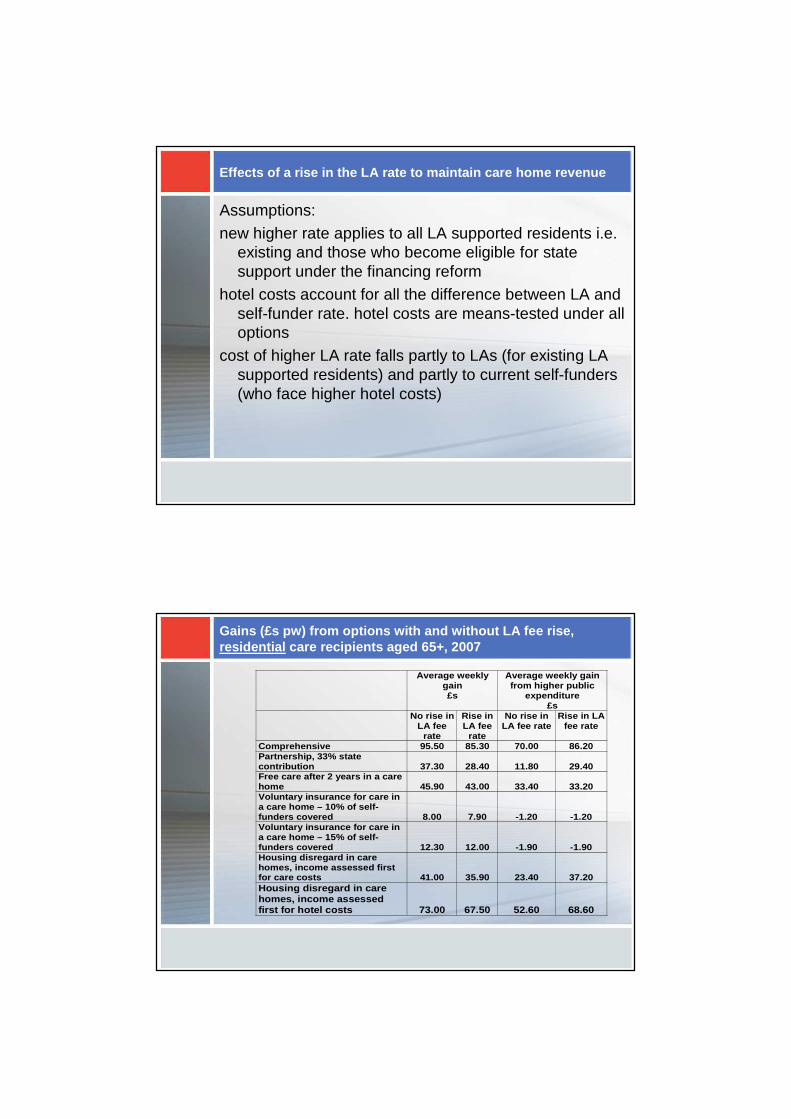
Effects of a rise in the LA rate to maintain care h ome revenue
Assumptions:new higher rate applies to all LA supported residents i.e.
existing and those who become eligible for state support under the financing reform
hotel costs account for all the difference between LA and self-funder rate. hotel costs are means-tested under all options
cost of higher LA rate falls partly to LAs (for existing LA supported residents) and partly to current self-funders (who face higher hotel costs)
Gains (£s pw) from options with and without LA fee rise, residential care recipients aged 65+, 2007
Average weekly gain £s
Average weekly gain from higher public
expenditure £s
No rise in LA fee
rate
Rise in LA fee
rate
No rise in LA fee rate
Rise in LA fee rate
Comprehensive 95.50 85.30 70.00 86.20 Partnership, 33% state contribution 37.30 28.40 11.80 29.40 Free care after 2 years in a care home 45.90 43.00 33.40 33.20 Voluntary insurance for care in a care home – 10% of self-funders covered 8.00 7.90 -1.20 -1.20 Voluntary insurance for care in a care home – 15% of self-funders covered 12.30 12.00 -1.90 -1.90 Housing disregard in care homes, income assessed first for care costs 41.00 35.90 23.40 37.20 Housing disregard in care homes, income assessed first for hotel costs 73.00 67.50 52.60 68.60
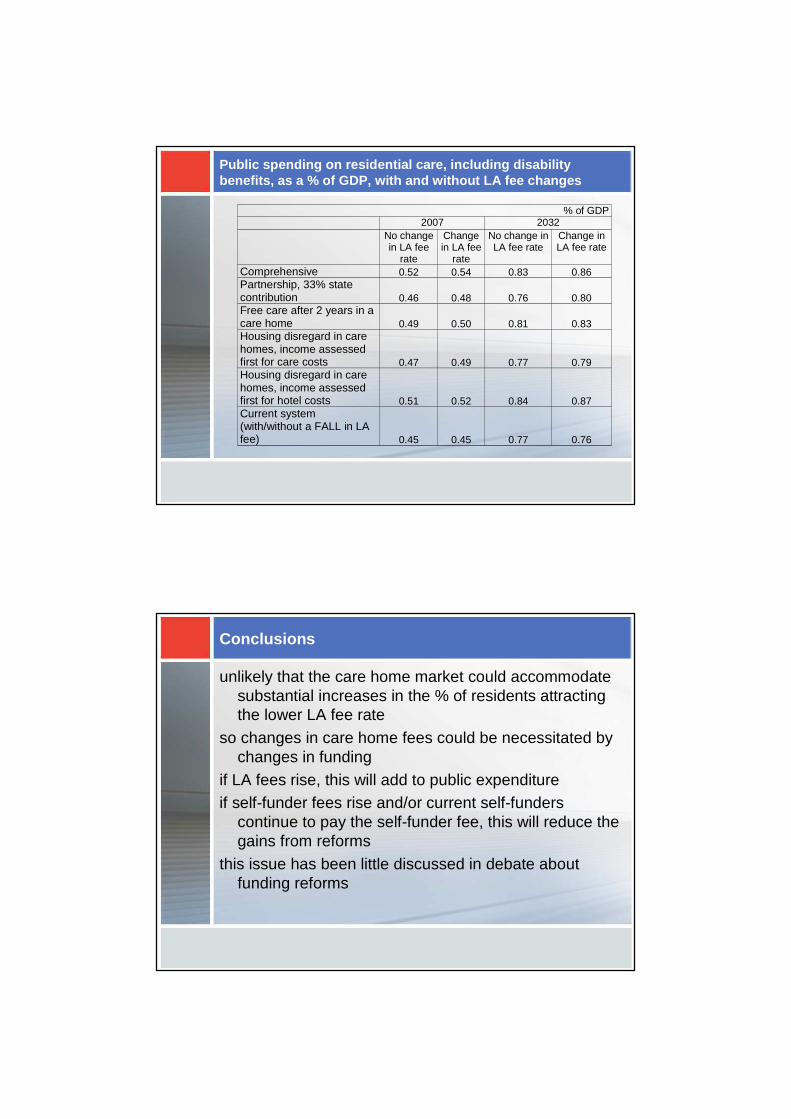
Public spending on residential care, including disa bility benefits, as a % of GDP, with and without LA fee ch anges
% of GDP 2007 2032 No change
in LA fee rate
Change in LA fee
rate
No change in LA fee rate
Change in LA fee rate
Comprehensive 0.52 0.54 0.83 0.86 Partnership, 33% state contribution 0.46 0.48 0.76 0.80 Free care after 2 years in a care home 0.49 0.50 0.81 0.83 Housing disregard in care homes, income assessed first for care costs 0.47 0.49 0.77 0.79 Housing disregard in care homes, income assessed first for hotel costs 0.51 0.52 0.84 0.87 Current system (with/without a FALL in LA fee) 0.45 0.45 0.77 0.76
Conclusions
unlikely that the care home market could accommodate substantial increases in the % of residents attracting the lower LA fee rate
so changes in care home fees could be necessitated by changes in funding
if LA fees rise, this will add to public expenditureif self-funder fees rise and/or current self-funders
continue to pay the self-funder fee, this will reduce the gains from reforms
this issue has been little discussed in debate about funding reforms
PENSION REFORM OPTIONS
Pension Reform Options
Review of State Pension Age – faster and further?
Move earlier to a more generous, single tier pension
Changes in means-testing
Private reform could affect private spending – auto-enrolment, public sector pensions, early access