Embed Size (px)
Citation preview

INSTITUTE FOR INTEGRATED DEVELOPMENT STUDIES (IIDS)
CONFEDERATION OF NEPALESE INDUSTRIES (CNI)
Investment and Financing Needsseptember 2019
N e pa l I N F r a s t r u c t u r e 2 0 3 0

N e pa l I N f r a s t r u c t u r e 2 0 3 0 : I N ve s t m e N t a N d f I N a N c I N g N e e d s
2
INstItute fOr INtegrated develOpmeNt studIes (IIds)
cONfederatION Of Nepalese INdustrIes (cNI)
Investment and Financing Needsseptember 2019
N E PA L I N F R A S T R U C T U R E 2 0 3 0

IIDS Study TeamDhruba Bhandari, PhD (Team Leader) Nayan Krishna Joshi, PhD Saurab Man Shrestha
Sector ExpertsDevendra Adhikari ( Energy)Dinesh Raj Manandhar, PhD (Water and Sanitation)Kamal Pande (Transport)Kirti Kusum Joshi, PhD (Urban Development)Sanjaya Adhikary andSuman Prasad Sharma (Water and Sanitation)
CNI and IIDS Advisory TeamBirendra Raj Pandey, CNIBishnu Dev Pant, PhD, Executive Director, IIDSVishnu Kumar Agarwal, CNI
Design and processed byThink Center Media Pvt Ltd., 9841560569
Printed in Nepal

i i i

N e p a l i N f r a s t r u c t u r e 2 0 3 0 : I n v e s t m e n t a n d F I n a n c I n g n e e d s
i v


N e p a l i N f r a s t r u c t u r e 2 0 3 0 : I n v e s t m e n t a n d F I n a n c I n g n e e d s
vi


N e p a l i N f r a s t r u c t u r e 2 0 3 0 : I n v e s t m e n t a n d F I n a n c I n g n e e d s
viii


N e p a l i N f r a s t r u c t u r e 2 0 3 0 : I n v e s t m e n t a n d F I n a n c I n g n e e d s
x

N e p a l i N f r a s t r u c t u r e 2 0 3 0 : I n v e s t m e n t a n d F I n a n c I n g n e e d s
xii

Foreword
The Confederation of Nepalese Industries (CNI), since its establishment some 17 years ago, has been trying to contribute to the industrial sector of Nepal by promoting investment opportunities within and abroad. I believe, adequate investments in infrastructure can boost up the economic growth of the country.
Materializing the goal of “Prosperous Nepal, and Happy Nepali” demands social harmony as well as economic growth. This necessitates heavy investment in infrastructural development from both the public and private sectors. But, this is possible only if we prioritize industrial investment in the country.
In such a context, CNI’s collaboration with the Institute for Integrated Development Studies (IIDS)in the form of this study “Nepal Infrastructure 2030: Investments and Financing Needs”, which highlights the infrastructural state of Nepal and estimates the investments required under different growth scenarios, is a timely publication. I hope, the findings and recommendations of this report will be useful to all stakeholders, both public and private, involved in the development of the industrial sector in Nepal.
I take this opportunity to thank all for the efforts put in preparing this report.
Satish Kumar More President, CNI
presIdeNt cNI
Kathmandu
nepal

N e p a l i N f r a s t r u c t u r e 2 0 3 0 : I n v e s t m e n t a n d F I n a n c I n g n e e d s
xiv

acKnowledgement
Infrastructure has always been the backbone of an economy. It not only makes economy vibrant and prosperous but also, improves people’s standard of living. Internalizing this fact, Confederation of Nepalese Industries (CNI) took the initiative to create public awareness about infrastructure and lobby with government for necessary reforms in policies and strategies so as to achieve objective of establishing infrastructure as the core agenda of development.
CNI has been organizing infrastructure Summit since 2014. In second summit organized in the year 2017, during serious deliberations, a huge deficit in terms of capacity, finance and resource was felt in medium and long term to achieve infrastructure goals.
It was the initiative of Dr. Bindu Lohani which laid the foundation of first such research study by a private sector organization ever taken in Nepal. This is how IIDS was brought in picture to undertake this research under guidance and direction of Dr. Lohani. We are so happy with the results, which not only talks about the financing gap but, has dedicated an entire chapter on the role of private sector. It also talks about the opportunities in various sectors and has made an attempt to project the size of the industry on the basis of consumption standards.
I would like to acknowledge Dr. Lohani for envisioning and guiding us throughout the project.
Also, would like to thank prof. Dr. Ram Manohar Shrestha for his regular inputs to ensure that we are in right direction. I do admit that working the research of this proportion, coordinating with each sector experts, editing the report to bring a concise book with clear projection and analysis, in no way was an easy task. I would like to thank Dr. Bishnu Dev Pant, sector experts and their team for completing these tasks in spite of all the obstacles.
From the very beginning National Planning Commission had been very supportive to the study and would like to extend my special thanks to Honorable Vice Chairman, Prof. Dr. Pushpa Raj Kadel, Honorable Sushil Bhatta and their team for organizing the workshop to ensure that we are able to have feedback from all the Government Bodies and Development Partners. We have tried to accommodate whatever that could be possible. I would like to express my sincere gratitude to CNI President Mr. Hari Bhakta Sharma, Mr. Satish More, Vice President of CNI and Head of Infrastructure Committee, Mr. Birendra Pandey and his committee members as well as CNI secretariat for their suggestions and putting so much of effort to get the result what we are seeing today.
I am sure this book would be helpful to policy makers, private sector and scholars equally and would encourage other organizations also to undertake such studies for benefit of the nation.
vIce presIdeNt cNI
Kathmandu
nepal
Vishnu Kumar Agarwal Vice President, CNI

N e p a l i N f r a s t r u c t u r e 2 0 3 0 : I n v e s t m e n t a n d F I n a n c I n g n e e d s
xvi

This report is a joint publication of the Institute for Integrated Development Studies (IIDS) and the Confederation of Nepalese Industries (CNI). The major objectives of the report are to estimate infrastructure investment needs and gaps, build a strong case for the increased role of the private sector for infrastructure development in Nepal, and recommend policy and institutional reforms.
The report was prepared as a combined effort of a study team of the IIDS and another team of experts from energy, transport, water and sanitation, and urban development sectors. The IIDS team included Dhruba Bhandari, PhD (Senior Economist, IIDS), Nayan Krishna Joshi, PhD (Senior Economist, IIDS), and Saurab Man Shrestha (Economist, IIDS). The team of sector experts included Devendra Adhikari (energy), Dinesh Manandhar, PhD (water and sanitation), Kamal Pande (transport), Kirti Kusum Joshi, PhD (urban development), Sanjaya Adhikary (water and sanitation), and Suman Prasad Sharma (water and sanitation).
The study team benefited significantly from the guidance and inputs of Bindu Nath Lohani, PhD (member, CNI think tank) and Ram Manohar Shrestha, PhD (Emeritus Professor, Asian Institute of Technology (AIT)).
Prajol Joshi and Binod Regmi (Page One Management Pvt. Ltd.) provided valuable inputs on financial instruments, case studies, and policy reforms in the country.
Anand Aditya, Dhruba Bhandari, Saurab Man Shrestha, and Sudeep Regmi, PhD (Senior Economist, IIDS) edited the manuscript extensively, ensuring coherence and consistency.
Moti Marasini prepared the final design and layout of the report.
Myself and Birendra Raj Pandey Vice President, CNI provided overall coordination in undertaking and finalizing this study. Shankar Aryal (Senior Program Officer, IIDS) managed logistics in the course of this study.
Bishnu Dev Pant, PhD Executive Director, IIDS
executIve dIrector, IIds
Kathmandu
nepal
acKnowledgement

N e p a l I N f r a s t r u c t u r e 2 0 3 0 : I n v e s t m e n t a n d F I n a n c I n g n e e d s
xviii

N e p a l I N f r a s t r u c t u r e 2 0 3 0 : I n v e s t m e n t a n d F I n a n c I n g n e e d s
xix
Contents
List of tables xxiList of figures xxiiList of Boxes xxiiAbbreviations xxivHighlights xxix
1. Introduction 11.1 Why is this study needed? 11.2 What does this study contain? 2
2. Infrastructure and its role in development 52.1 Role of infrastructure in growth 52.2. Role of the priority sectors in growth 6
3. Current state and challenges of infrastructure development in Nepal 113.1. Current state of infrastructure 113.2. Capital expenditure and Gross Fixed Capital Formation (GFCF) 113.3. State of energy infrastructure 123.4. State of transport infrastructure 153.5. State of water and sanitation infrastructure 193.6. State of urbanization 233.7. Challenges in infrastructure development 27
4. Estimating infrastructure investment needs and gaps 314.1. Top-down (macro-economic) method 314.2. Bottom-up method 334.3. Summary of investment needs from two methods 424.4. Investment gap is significant: what is next? 43
5. Role and opportunity for the private sector 475.1. Roles and opportunities in the energy sector 475.2. Roles and opportunities in the transport sector 485.3. Roles and opportunities in the water and sanitation sector 505.4. Roles and opportunities in the urban development sector 53
N e p a l I N f r a s t r u c t u r e 2 0 3 0 : I n v e s t m e n t a n d F I n a n c I n g n e e d s
xx
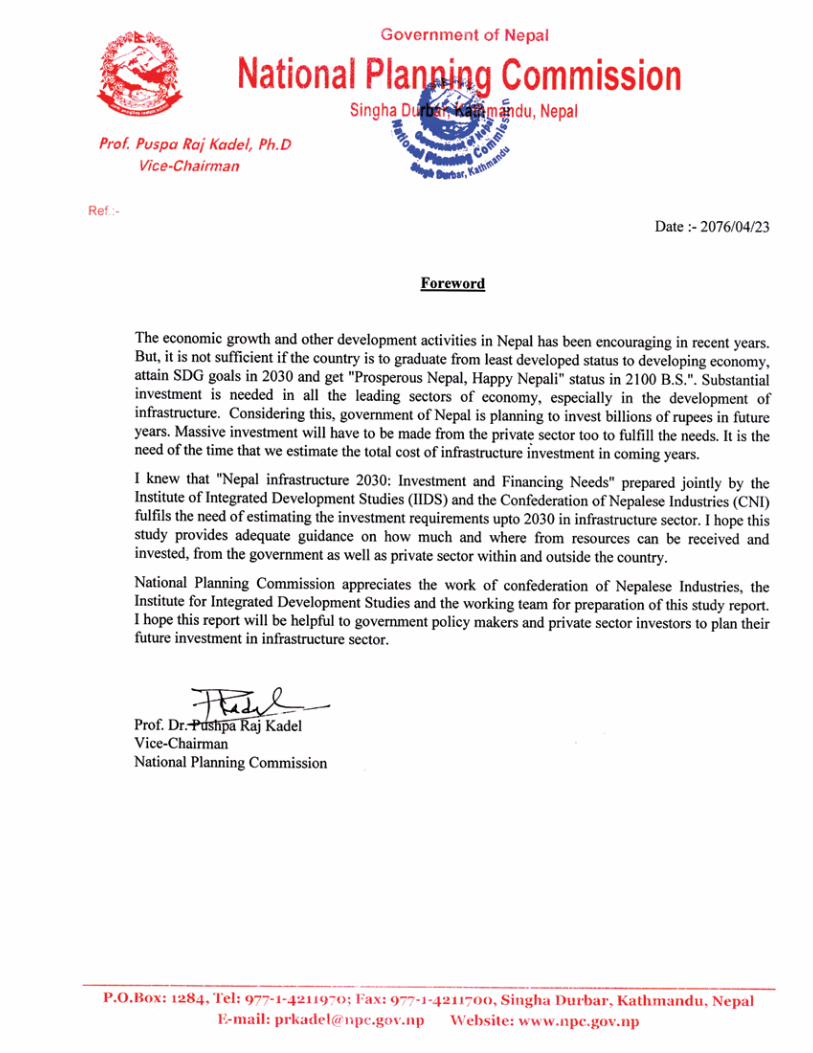
6. Way forward for infrastructure development in Nepal 596.1. General policies and strategies 596.2. Policies and strategies for the energy sector 616.3. Policies and strategies for the transport sector 626.4. Policies and strategies for the water and sanitation sector 646.5. Policies and strategies for the urban development sector 656.6. Financing capacity and reform 656.7. Effective management and ingenious ways 72
7. Conclusion 77
References 79Annexes 83A1: National Pride Projects in the priority sectors in Nepal 83A2: Sustainable Development Goals 85A3: Data and methodology of top-down method 86A4: GDP growth projections 89A5: Unit cost of hydropower 89A6: Detail of cost calculation for the transport sector 90A7: Detail of cost calculation for the water and sanitation sector 95A8: Net infrastructure financing requirements for the urban development sector
(2018/19 – 2030/31) (USD billion) 96A9: Institutional arrangement and major policies in priority infrastructure sectors 97

N e p a l I N f r a s t r u c t u r e 2 0 3 0 : I n v e s t m e n t a n d F I n a n c I n g n e e d s
xxi
List of tabLes
Table 1: Summary of GDP and infrastructure stock of Nepal and other relevant countries 11
Table 2: Types and condition of Strategic Road Network (SRN) by physiographic region (2016) 15
Table 3: Service level of water supply 21
Table 4: Service level of sanitation 22
Table 5: Wastewater treatment plants in Kathmandu Valley 22
Table 6: Municipal population in province 26
Table 7: Key challenges specific to the priority sectors 29
Table 8: Summary of factors considered for bottom-up estimation of investment needs 34
Table 9: Planned and proposed transmission projects 36
Table 10: Investment required for electricity generation, transmission, and distribution, 2019-2030 (USD billion) 36
Table 11: Investment gaps in energy sector, 2019-2030 (USD billion) 37
Table 12: Summary of investment needs and gaps in transport sector, 2019-2030 ( USD billion) 39
Table 13: Investment required and gaps in water and sanitation sector, 2019- 2030 (USD billion) 41
Table 14: Urban development indicators and targets to be achieved by 2030/31 42
Table 15: Investment needs and gaps in urban development (2018/19 - 2030/31) (USD billion) 43
Table 16: Summary of investment needs and infrastructure stocks from two approaches (USD billion) 44
Table 17: Summary of available fund for investment and investment gaps in priority sectors, 2019-2030 (USD billion) 45
Table 18: Estimation of construction materials for energy sector, 2019-2030 (in MT) 48
Table 19: Summary of role of private sector engagement in transport sector 49
Table 20: Estimation of construction materials for transport sector, 2019-2030 (in MT) 50
Table 21: Areas envisaged for private sector involvement in water and sanitation sector 51
Table 22: Estimation of construction materials for water and sanitation sector, 2019-2030 (in MT) 53
Table 23: Relevant NUDS strategies from the perspective of private sector investment 55
Table 24: Common issues in transport sector 63
Table 25: Summary of capacity of domestic funding sources 66

N e p a l I N f r a s t r u c t u r e 2 0 3 0 : I n v e s t m e n t a n d F I n a n c I n g n e e d s
xxii
List of figures
Figure 1. Urbanization and per capita GDP in Nepal (1960-2015) 7Figure 2. Urbanization and per capita GDP in China (1960-2004) 8Figure 3a. Capital expenditure in priority sectors as percentage of GDP for fiscal years 2011/12-2016/17 12Figure 3b. Capital expenditure in priority sectors in billion of USD for fiscal years 2011/12-2016/17 13Figure 4. Hydropower potential and generation capacity by province in percentage 14Figure 5. Map of road connectivity in Nepal 15Figure 6. Road network developed by Department of Road for fiscal years 2001/02-2015/16 16Figure 7. Total roads (SRN and LRN) in provinces by physiographic region 17Figure 8. Total roads (SRN and LRN) by province 17Figure 9. Road density by province 18Figure 10. Ranking of provinces by road density 19Figure 11. Water coverage by source and region 20Figure 12. Municipal population growth trend 24Figure 13. Province-wise distribution of municipal bodies 25Figure 14. Municipalities in Nepal 26Figure 15. Investment need as percentage of estimated GDP with and without climate change adjustment 32Figure 16: Investment needs in priority sectors without climate change adjustment (in USD billion 2010 prices) 33Figure 17: Investment needs in priority sectors with climate change adjustment (in USD billion 2010 prices) 34Figure 18: Investment needs and gaps in water and sanitation sector (USD billion) 40
List of boxesBox 1: Can Nepal be a part of regional connectivity with BRI ? 6Box 2: Available energy infrastructure 14Box 3: Why Asia needs to invest in quality infrastructure ? 18Box 4: Leading by example – Lekhnath WUSC shows the way 20Box 5: Smart city development in Nepal 24Box 6: An example of approval process in hydropower project 27Box 7: Investment in quality infrastructure 40Box 8: SCADA improves efficiency of system operations 50Box 9: Private sector involvement in wastewater treatment—Is it a trend for the future? 52Box 10: New Bus Park to have state-of-the-art facilities 53Box 11: Examples of urban-sector PPP initiatives in India 54Box 12: Capacity, willingness, and constraints of the private sector 72Box 13: Managing transport in Kathmandu valley 74Box 14: Electrict vehicle 74Box 15: Utilization of Tunnel Boring Machine (TBM) in Nepal 75

N e p a l I N f r a s t r u c t u r e 2 0 3 0 : I n v e s t m e n t a n d F I n a n c I n g n e e d s
xxiii

N e p a l I N f r a s t r u c t u r e 2 0 3 0 : I n v e s t m e n t a n d F I n a n c I n g n e e d s
xxiv
abbreviations
ACNP Asian Currency Note ProgramADB Asian Development BankAIIB Asian Infrastructure Investment BankASEAN Association of Southeast Asian NationsASP Activated Sludge ProcessBFIs Banks and Financial InstitutionBIMSTEC Bay of Bengal Initiative for Multi-Sectoral Technical and Economic CooperationBOOT Build, Own, Operate, TransferBRI Belt and Road InitiativeCBS Central Bureau of StatisticsCIT Citizen Investment TrustCKM Circuit KilometerCNI Confederation of Nepalese IndustriesCPI Consumer Price IndexDEWATS Decentralized Wastewater Treatment SystemsDoI Department of IndustriesDOLIDAR Department of Local Infrastructure Development and Agriculture RoadsDoR Department of RoadsDRCN District Road Core NetworkDUDBC Department of Urban Development and Building ConstructionDWSSM Department of Water Supply and Sewerage ManagementEPF Employee Provident FundESIA Environmental and Social Impact AssessmentFCAN Federation of Contractors, Association of Nepal FDI Foreign Direct InvestmentFITTA Foreign Investment and Technology Transfer ActGDP Gross Domestic ProductGFCF Gross Fixed Capital FormationGoI Government of IndiaGoN Government of NepalGWh Gigawatt hoursHa HectareHDI Human Development IndexHDP Hydropower Development PolicyHHs HouseholdsIBA Investment Board ActIBN Investment Board NepalICT Information and Communication TechnologyIFC International Finance CorporationIGFT Inter-Governmental Fiscal TransferIIDS Institute for Integrated Development Studies IIPB Industry and Investment Promotion Board

N e p a l I N f r a s t r u c t u r e 2 0 3 0 : I n v e s t m e n t a n d F I n a n c I n g n e e d s
xxv
IMD India Millennium DepositINPS Integrated National Power SystemINR Indian RupeeIOC Indian Oil CorporationIPPs Independent Power ProducersKEXIM The Export- Import Bank of KoreaKMC Kathmandu Metropolitan CityKSUTP Kathmandu Sustainable Urban Transport Project KUKL Kathmantu Upatyaka Khanepani LimitedKv KilovoltkWh Kilowatt hourLPCD Liters per Capita per DayLRN Local Road Network MCC Millennium Challenge CorporationMDG Millennium Development GoalMLD Million Liters per Day MoF Ministry of FinanceMoUD Ministry of Urban DevelopmentMRT Mass Rapid TransitMT Metric TonMTEF Medium Term Expenditure FrameworkMW MegawattNDWQS National Drinking Water Quality StandardsNEA Nepal Electricity AuthorityNOC Nepal Oil CorporationNPC National Planning CommissionNPR Nepalese RupeeNRB Nepal Rastra BankNRI Non-resident IndianNSTS National Sustainable Transport StrategyNTGC National Transmission Grid CompanyNUDS National Urban Development StrategyODF Open Defecation FreePDA Power Development AgreementPPP Public Private PartnershipPPPI Public Private Partnership and Investment ActPT.SMI PT. Sarana Multi InfrastrukturRBI Reserve Bank of IndiaRBT Rapid Bus TransitREC Rural Electrification CorporationRIB Resurgent India BondRIDF Rural Infrastructure Development Fund

N e p a l I N f r a s t r u c t u r e 2 0 3 0 : I n v e s t m e n t a n d F I n a n c I n g n e e d s
xxvi
RoR Run-of-RiverSASEC South Asia Sub-Regional Economic CooperationSC Smart CitySCADA Supervisory Control and Data AcquisitionSDG Sustainable Development GoalSDP Sector Development PlanSEIU Sector Efficiency and Improvement UnitSRN Strategic Road Network TBM Tunnel Boring MachineTDF Town Development FundUNCRD United Nations Centre for Regional DevelopmentUNDESA United Nations Department of Economic and Social AffairsUNDP United Nations Development ProgramUNICEF United Nations International Children’s Emergency Fund USD United States DollarVDC Village Development CommitteeVGF Viability Gap FundingVRCN Village Road Core Network WB World BankWDI World Development IndicatorsWECS Water and Energy Commission SecretariatWHO World Health Organization WUSC Water Users and Sanitation Committee

N e p a l I N f r a s t r u c t u r e 2 0 3 0 : I n v e s t m e n t a n d F I n a n c I n g n e e d s
xxvii

N e p a l I N f r a s t r u c t u r e 2 0 3 0 : I n v e s t m e n t a n d F I n a n c I n g n e e d s
xxviii
HIgHlIgHts
Investment and Financing Needs
N e pa l I N F r a s t r u c t u r e 2 0 3 0
N e p a l I N f r a s t r u c t u r e 2 0 3 0 : I n v e s t m e n t a n d F I n a n c I n g n e e d s
xxix
n Investment in infrastructure (considered in this study as energy, transport, water and sanitation, and urban development) is essential in Nepal to achieve the desired growth, to reduce poverty and improve the standard of living, to graduate to middle income country by 2030, to achieve the Sustainable Development Goals (SDGs), and to achieve the long-term vision of economic growth of the 15th plan of the government including “Prosperous Nepal, Happy Nepali”. However, the level of investment is lower compared to the neighboring countries when measured using indicators such as Infrastructure Score Rank, Gross Fixed Capital Formation, access to electricity, per capita energy consumption,
density of paved roads, access to water and sanitation, and level of urbanization. The quality of services delivered through such infrastructure (for instance, 24-hour electricity supply, clean tap water and proper sanitation, all weather roads, well designed smart cities) is unsatisfactory as well.
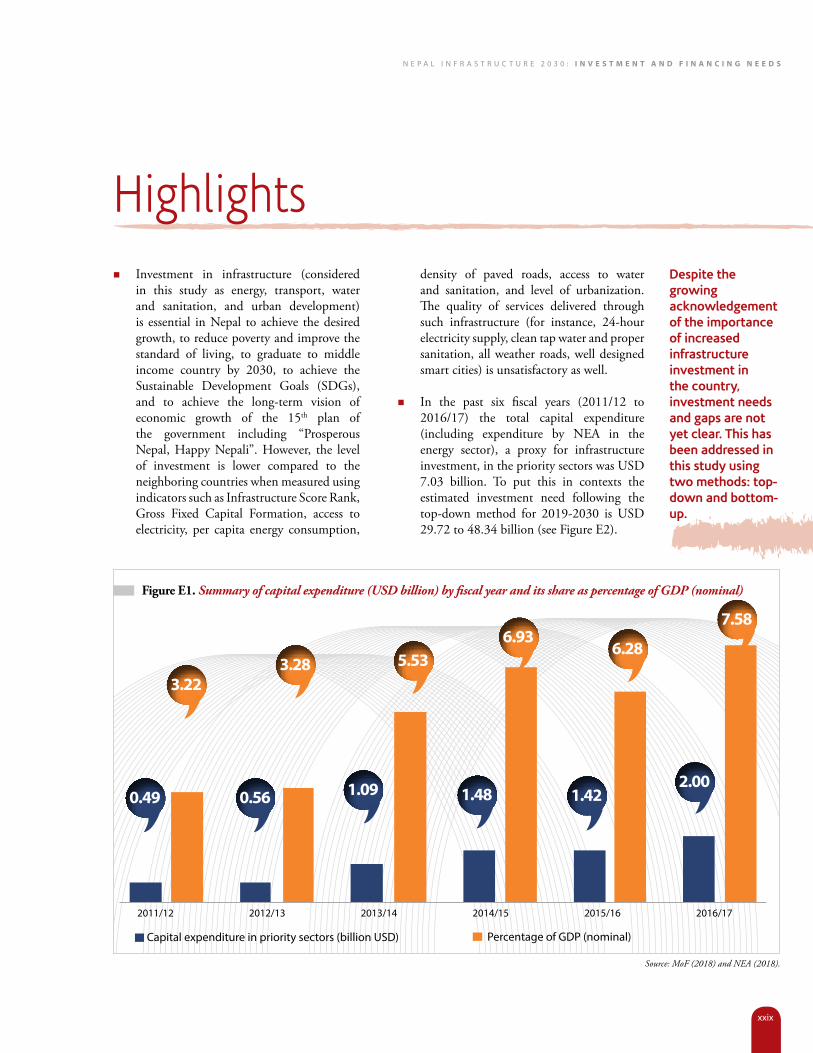
n In the past six fiscal years (2011/12 to 2016/17) the total capital expenditure (including expenditure by NEA in the energy sector), a proxy for infrastructure investment, in the priority sectors was USD 7.03 billion. To put this in contexts the estimated investment need following the top-down method for 2019-2030 is USD 29.72 to 48.34 billion (see Figure E2).
highlights
Figure E1. Summary of capital expenditure (USD billion) by fiscal year and its share as percentage of GDP (nominal)
2011/12 2012/13 2013/14 2014/15 2015/16 2016/17
capital expenditure in priority sectors (billion usD) percentage of GDp (nominal)
Source: MoF (2018) and NEA (2018).
0.49
3.22
0.56
3.28
1.09
5.536.28
2.001.421.48
7.586.93
despite the growing acknowledgement of the importance of increased infrastructure investment in the country, investment needs and gaps are not yet clear. this has been addressed in this study using two methods: top-down and bottom-up.
N e p a l I N f r a s t r u c t u r e 2 0 3 0 : I n v e s t m e n t a n d F I n a n c I n g n e e d s
xxx
n Among these sectors, capital expenditure in energy was USD 3.95 billion and in transport USD 2.30 billion, in water and sanitation USD 0.60 billion, and in urban development USD 0.16 billion. A summary of the total capital expenditure in the priority sectors by fiscal year and as percentage of GDP (nominal) is presented in Figure E1.
n Despite the growing acknowledgement of the importance of increased infrastructure investment in the country, investment needs and gaps in the priority sectors are not yet clear. This has been addressed here using two methods to estimate the infrastructure investment need in Nepal by 2030. The first is top-down (macroeconomic) method. The second is the bottom-up method. The report generates two sets of estimates
for both methods of estimation, namely: baseline estimate and climate-adjusted estimate.
top-down method of estimating infrastructure investment needs (2019-2030)n The first method (top-down or
macroeconomic) estimates infrastructure investment needs using a relationship between GDP and the variables that represent the level of infrastructure such as road density (kilometer of road/1000 sq.km), kilowatt of electricity generated per capita, and percentage of population with access to drinking water and sanitation. In the present study, this method has been used to estimate the investment needs under three different GDP growth scenarios: normal growth at 5%, optimistic growth at 7.5% and highly optimistic growth at 10% per annum. Estimated GDP and investment requirements are in USD billion in 2010 prices.
n The cumulative estimated GDP for the period 2019 to 2030 is USD 365.13 billion under normal growth (5%), USD 422.63 billion under optimistic growth (7.5%), and USD 490 billion under highly optimistic growth (10%). For the year 2017, the GDP is USD 21.34 billion and for 2030 the estimated GDP is USD 39.23, USD 50.82, and USD 65.44 billion for the three growth rate scenarios respectively.
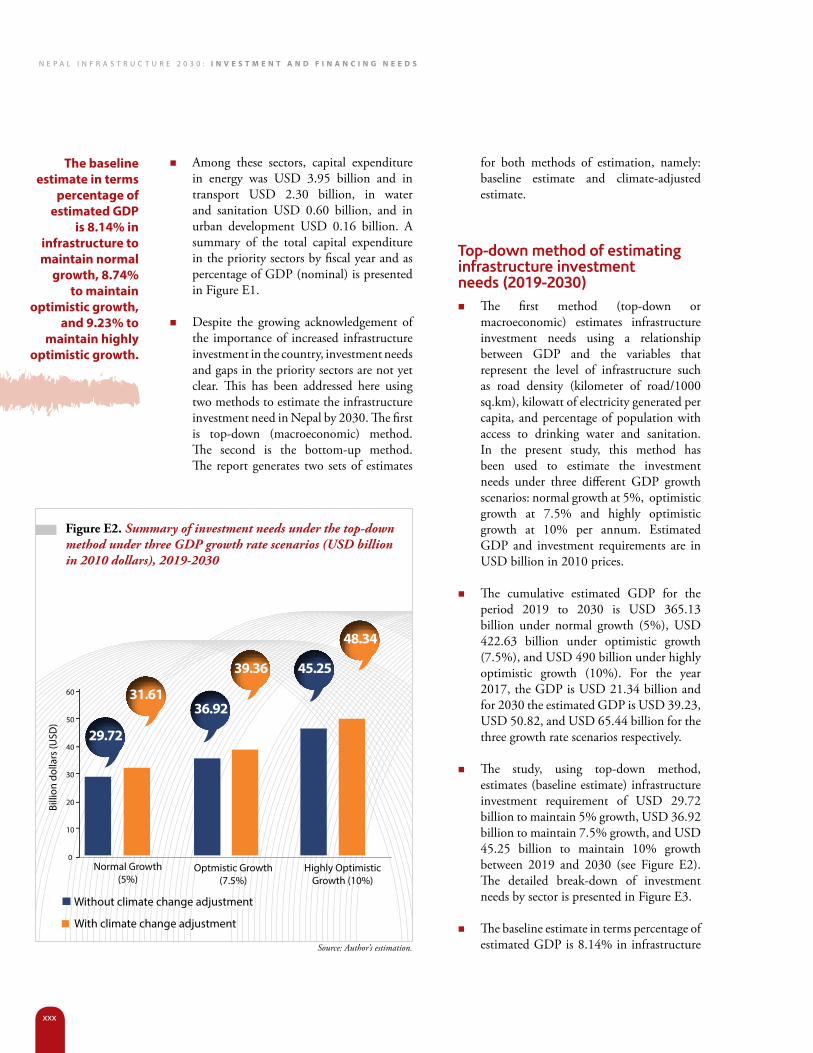
n The study, using top-down method, estimates (baseline estimate) infrastructure investment requirement of USD 29.72 billion to maintain 5% growth, USD 36.92 billion to maintain 7.5% growth, and USD 45.25 billion to maintain 10% growth between 2019 and 2030 (see Figure E2). The detailed break-down of investment needs by sector is presented in Figure E3.
n The baseline estimate in terms percentage of estimated GDP is 8.14% in infrastructure
the baseline estimate in terms
percentage of estimated gdP
is 8.14% in infrastructure to maintain normal
growth, 8.74% to maintain
optimistic growth, and 9.23% to
maintain highly optimistic growth.
Figure E2. Summary of investment needs under the top-down method under three GDP growth rate scenarios (USD billion in 2010 dollars), 2019-2030
Normal Growth(5%)
0
10
20
30
40
50
60
Billi
on d
olla
rs (u
sD)
Optmistic Growth(7.5%)
Highly Optimistic Growth (10%)
Without climate change adjustment
With climate change adjustment
29.72
31.6136.92
39.36 45.25
48.34
Source: Author’s estimation.

N e p a l I N f r a s t r u c t u r e 2 0 3 0 : I n v e s t m e n t a n d F I n a n c I n g n e e d s
xxxi
to maintain normal growth, 8.74% to maintain optimistic growth, and 9.23% to maintain highly optimistic growth.
n The climate-adjusted estimate of infrastructure investment requirement under the top-down method is USD 31.51 billion to maintain 5% growth, USD 39.36 to maintain 7.5% growth, and USD 48.34 billion to maintain 10% growth between 2019 and 2030 (see Figure E2).
n The climate-adjusted estimate in terms of the percentage of estimated GDP is 8.66% in infrastructure to maintain normal growth, 9.31% to maintain optimistic growth, and 9.85% to maintain highly optimistic growth.
Bottom-up method of estimating infrastructure investment need (2019-2030) n Unlike in the top-down method, in principle,
the bottom-up method would explicitly consider the demand for end-use services for the estimation of infrastructure needs. In doing so, the bottom-up method would normally consider the appropriateness of different technology options, e.g., different modes of transport (road, rail, water and air transport) and vehicular options for providing the transport services. The bottom-up method can also capture all the complexities of infrastructure investments in the country which the top-down method cannot, such as issues of quality of infrastructure, terrain conditions, levels of services, urban development goals, mixes of run-of-the-river (RoR) and storage projects, etc. Due to lack of basic information, the bottom-up method in the present study uses ongoing government projects, international commitments and targets (i.e., SDGs) as well as projects in the pipeline rather than considering the levels of service demand in different end uses in order to estimate investment needs. It should therefore be
noted that the estimate under the bottom-up varies depending on the number of projects considered in the estimation of investment requirements.
n The bottom-up method in the energy sector considers three alternative levels of power demands, i.e., 13000 MW, 15,000 MW, and 18000 MW by 2030. It estimates the investment needs of the sector in the range of USD 23 to 36 billion. The study also provides the estimates for investment needs for meeting the alternative levels of power demand with different mixes of RoR and storage hydropower projects. For example, to meet 13,000 MW of power demand with a combination of 60% RoR and 40% storage projects the estimated investment need is 23.63 billion, whereas the investment need to meet the demand
Source: Author’s estimation.
Figure E3. Summary of investment needs by sectors under the top-down method for three GDP growth rate scenarios (USD billion in 2010 dollars), 2019-2030
energy transport Water sanitation
Optimistic growth (7.5%)
Normal growth(5%)
Highly optimistic growth (10%)
1.52
1.65 2.632.63
2.87
2.78
2.751.79
22.76
29.86
38.09
2.63
the study, using top-down method, estimates (baseline estimate) infrastructure investment requirement of usd 29.72 billion to maintain 5% growth, usd 36.92 billion to maintain 7.5% growth, and usd 45.25 billion to maintain 10% growth between 2019 and 2030.

N e p a l I N f r a s t r u c t u r e 2 0 3 0 : I n v e s t m e n t a n d F I n a n c I n g n e e d s
xxxii
of 18,000 MW with similar combination of RoR and storage project is USD 36.76 billion. This is the baseline estimate. Based on the availability of funding such as government revenue and private sources, this method also estimated the investment gap in the energy sector by 2030. The estimated investment gap in energy sector ranges from USD 4.39 to 5.93 billion to achieve 13,000 MW whereas to achieve 15,000 MW the gap ranges from USD 9.3 to 11.18 billion and to attain 18,000 MW the gap ranges from USD 16.67 to 19.06 billion.
n The bottom-up method in the transport sector, considers giving continuity to current road projects and construction of additional 120,000 km of road to meet the SDG target, and upscaling
investment to meet the economic growth by 2030. It estimates the investment need of USD 84.88 billion. This is the baseline estimate. Based on the availability of funds, the investment gap estimated for the transport sector is USD 48.88 billion.
n The bottom-up method in the water and sanitation sector considers meeting Sector Development Plan (SDP) and SDG targets by 2030. It estimates the sector’s investment need of USD 31.90 billion. Based on the availability of funds based upon GoN funding trend, the estimated gap in water and sanitation sector is USD 11.77 billion by 2030.
n The bottom-up method in the urban development sector, which considers four scenarios meeting 60%, 75%, 90%, and 100% of urban development indicators and targets set by National Urban Development Strategy (NUDS), estimates the investment needs from USD 40.05 billion to USD 75.84 billion. This is the baseline estimate. Based on the availability of funds, the estimated investment gap ranges from USD 15.62 to 51.57 billion.
n The bottom up method also estimates additional demand for the construction of materials. By 2030, there will be additional demand for 19,699 thousand tons of steel and 23,500 thousand tons of cement.
n The minimum annual (assuming equal annual investment need over the period) estimated investment need (2019-2030) under the top-down method is USD 2.63 billion (under 5% growth) and the maximum annual investment need is USD 4.63 billion (under 10% growth). Under the bottom-up method the minimum annual investment need is USD 16.55 billion (sum of minimum values in the range of investment needs) and the maximum annual investment need is USD 20.55 billion (sum of the maximum values in the range of investment needs). The capital expenditure on priority sectors in fiscal year 2016/17 is USD 2 billion. This is summarized in Figure E5.
the minimum annual estimated investment need
(2019-2030) under the top-down
method is Usd 2.63 billion (under 5%
growth). Under the bottom-up method
the minimum annual investment need is Usd 16.55
billion (sum of minimum values
in the range of investment needs).
Figure E4. Summary of infrastructure investment need from bottom-up method (in USD billions), 2019-2030
energy transport Water & sanitation
urban Development
Minimum Maximum
23.63
40.0536.76
31.89
84.88
75.84
Source: Author’s estimation.

N e p a l I N f r a s t r u c t u r e 2 0 3 0 : I n v e s t m e n t a n d F I n a n c I n g n e e d s
xxxiii
Why are the estimates for investment needs different under the two methods?n The estimates under the top-down and bottom-
up methods differ due to differences in the level of infrastructure stock predicted by 2030 by the two methods. In the top-down method, the infrastructure stock is predicted under three GDP growth scenarios from 2019 to 2030. The infrastructure stock is then converted into monetary value to get the investment need. In the bottom-up method, the cost of different ongoing and upcoming projects in each sector are considered to estimate the need. The stock of infrastructure considered in the bottom-up method is significantly higher than the stock predicted by the top-down method. For details, see Table 16 in chapter four.
n The inclusion of projects to meet the SDG targets in the bottom-up method is one reason why the infrastructure stock is higher than the estimated infrastructure stock in the top-down (macroeconomic) method. A preliminary estimate of annual investment need by the National Planning Commission to meet the SDGs for the period 2016-2030 is USD 17.70 billion (NPC, 2017b). This figure for the period under consideration is close to the annual bottom-up estimate of this study. The annual investment need from NPC estimate is higher than current (FY 2018/19) annual budget of the country (which is NPR 1315 billion (USD 13.15 billion).
n The top-down method is based on some macroeconomic variables and broad sector specific national indicators. As such the data requirements in the top-down method are relatively less challenging than the bottom-up method. The top-down method can therefore be more conveniently applied to compare the investment needs for infrastructures across different countries. The top-down method has found its use by multilateral regional funding agencies (e.g., ADB) to assess the investment needs for infrastructures in the case of Asian developing countries.
The substantial difference in the results of the two methods in terms of investment requirements
reflect partly the fundamental differences between the two methods. More significantly, the differences in the results are due to the way the bottom-up method has been used in the study; in particular, the bottom-up method has considered the inventory of various kinds of projects (existing projects, projects in pipeline as well as the perspective projects identified by different government agencies). It is uncertain whether all these projects represent the real needs for the socioeconomic development of the country or manifest broader sectoral development aspiration in a longer term (i.e., beyond 2030). It is also uncertain whether identified projects satisfy the criteria of economic efficiency as well as financial viability and sustainability.
One thing comes out very clearly from the wide variations in the estimates of the investment
Figure E5. Summary of annual investment needs under two methods USD billion, 2019-2030
top-down method
Bottom-up method
capital expenditure
(2016/17)
Minimum annual expenditure
Maximum annual expenditure
4.36
20.55
2.02.64
16.55
Source: Author’s estimation.

N e p a l I N f r a s t r u c t u r e 2 0 3 0 : I n v e s t m e n t a n d F I n a n c I n g n e e d s
xxxiv
requirements from the two methods: that is, further research is warranted to examine the criteria and process through which projects are identified and included in the sectoral and national infrastructure development plans. In particular, it is worth analyzing if the criteria to define the infrastructure needs are scientific and whether the present portfolio of projects satisfy the criteria and are not merely a compilation of identified projects.
a strong case for the role of the private sectorn Given the size of the Nepalese economy (NPR
3007 billion (USD 30 billion) in 2017/18 and NPR 34643 billion (34 billion USD) in 2018/19) and the magnitude of the estimated investment gap considering availability of funding sources, the government alone cannot fill the gap through public expenditure. The capital expenditure, roughly 30% of the total budget of the country is not enough, given the significant size of estimated investment gap. There is also additional pressure on capital expenditure as a result of the new federal structure, which has increased the recurrent expenditure. The government also cannot fill the gap by borrowing more as the current debt to GDP ratio (27%) is already high, and increasing it would negatively affect capital formation and growth of the country.
n There is an ample opportunity for the private sector to fill the estimated gap. The private sector can either invest solely or enter public private partnership (PPP) with the government. It also has an important role in supplying construction materials needed to build the infrastructures. Currently, the private sector in infrastructure investment in Nepal is active in hydropower generation projects through Independent Power Producers (IPP), a role that can be extended into other sectors like transport (with PPP models other than BOOT), water and sanitation, and urban development (for instance, real estate, urban transport, solid waste management, etc.).
n There are many constraints to investment and reaping its benefits, the key one being financing infrastructure development. The country also faces other challenges like: unfavorable investment climate, such as lengthy approval process and bureaucratic hurdles due to unaligned institutional arrangements, ineffective policy design and enforcement, and lack of technical skills to plan, design, and set up infrastructure projects.
n To increase the role of the private sector there is a need to create a favorable investment climate through policy and institutional reform and innovation in financial instruments.
policy, Institutional and Financial reform, and strategies n Formulate a unified infrastructure policy with
one window system to reduce the duration of approval process and obtaining permit, and reduce confusion and contradiction among the competing acts, policies, and concerned ministries.
n Effectively enforce the recently enacted Public Private Partnership and Investment (PPPI) Act (2019) with the provision for PPP unit at the Investment Board of Nepal, one stop service, unsolicited proposals, Viability Gap Funding (VGF), and revolving fund for land acquisition.
n Effectively enforce the newly enacted FITTA (2019) with provision for FDI approval within a week, one stop center at Department of industries, 100 % foreign investment, venture capital fund, etc.
n Formulate enabling policies to facilitate land acquisition and forest clearance for infrastructure projects.
n Review and revise the Public Procurement Act (2007) and Rules (2008) to discourage the awarding of contracts to abnormally low

N e p a l I N f r a s t r u c t u r e 2 0 3 0 : I n v e s t m e n t a n d F I n a n c I n g n e e d s
xxxv
bids. Such practices do not take into account the quality and effective execution of projects. Awarding contracts beyond the capacity and need of the government must be restrained.
n Establish clearly-defined roles and responsibilities between the three levels of the government to achieve the goals of infrastructure development.
n Establish an electricity regulatory authority and empower it with the capacity to eliminate impediments to the private sector’s investment in generation, transmission, and distribution of electricity.
n Introduce a new system of road classification and prioritization based on functionality, connectivity, and volume of traffic as opposed to the current system of administrative hierarchy.
n Review and redefine the strategy in road construction system – which involves track opening followed by upgrading and then surfacing – for effective and efficient construction and completion of roads.
n Effectively regulate groundwater extraction to ensure sustainable supply of drinking water.
n Improve the system of collection, treatment, and disposal of fecal sludge through construction of collection centers and treatment plants at the strategic locations.
n Introduce other modalities of financing infrastructures such as project financing (or non-recourse financing), debt financing (which is underdeveloped in Nepal, but has the potential for long-term infrastructure investment), diaspora financing, Viability Gap Funding, Infrastructure Development Fund, etc.
n Build capacity of the construction industry so that Nepal can build infrastructure with its own capital and human resources.
n Encourage the use of modern technology, such as tunnel boring machine to build infrastructure.
n Enforce effective prioritization and selection of projects, better coordination among stakeholders, and effective management of existing infrastructures to make the most of the investments.
there is ample opportunity for the private sector to fill the estimated investment gap. to increase the role of the private sector there is a need to create a favorable investment climate through policy and institutional reform and innovation in financial instruments.

N e p a l I N f r a s t r u c t u r e 2 0 3 0 : I n v e s t m e n t a n d F I n a n c I n g n e e d s
xxxvi
INtroductIoN
Investment and Financing Needs
N e pa l I N F r a s t r u c t u r e 2 0 3 0

N e p a l I N f r a s t r u c t u r e 2 0 3 0 : I n v e s t m e n t a n d F I n a n c I n g n e e d s
1
Infrastructure – considered in this study as energy, transport, water and sanitation, and urban development – is essential for the economic growth of a country.
Infrastructures feature as inputs in the production of goods and services, help raise productivity, lower the cost of production and distribution, improve the standard of living, and help in reducing poverty. Overall, they can function as an engine of growth.
The importance of infrastructures in the economic development of Nepal is reflected in the choice of the National Pride Projects of the country (for details of National Pride Projects in the priority sector, see Annex A1), but in order to reap the benefits of infrastructures it is essential to invest in them. Such an investment is important for Nepal to:
n achieve sustained economic growth rate,n improve the standard of living by providing
access to basic services,n achieve SDGs (see Annex A2 for
SDG indicators and targets related to infrastructure),
n graduate to the status of middle income countries by 2030, and
n graduate to the status of rich nations by 2043 as laid out in the long-term vision of the fifteenth plan1.
1.1 WHY Is tHIs studY Needed?Despite growing acknowledgement of the need for increased investment in Nepal’s
infrastructure by 2030, investment needs and gaps in the priority sectors are far from obvious. It was in such a context that, the Confederation of Nepalese Industries (CNI) and the Institute for Integrated Development Studies (IIDS) conceived and proposed this study. The study examines the current state of infrastructure in Nepal in relation to its neighboring countries, assesses the constraints and challenges to infrastructure investment, estimates the investment needs and investment gaps, presents a strong case for the private sector to fill in the investment gaps, and provides a way forward.
The reports available on infrastructure investment needs published by the Asian Development Bank (ADB) and the World Bank cover either Asia or the whole world. An overall view of the world or Asia cannot be a substitute for the detailed analysis of an individual economy’s sectoral infrastructure nor can it account for country specific challenges, geographical terrain, policies, and institutions. This study tries to fill that void for Nepal.
While filling that void, the study also intends to benefit the academicians, policymakers, and entrepreneurs. It informs policymakers on the estimated infrastructure investment needs and gaps and the need of policy, institutional, and financial reform to facilitate infrastructure investment. For the entrepreneurs and business community, it highlights the opportunities in investment in infrastructure in the priority sectors.
1. Introduction
1. NPC, 2019.

N e p a l I N f r a s t r u c t u r e 2 0 3 0 : I n v e s t m e n t a n d F I n a n c I n g n e e d s
2
1.2 WHat does tHIs studY coNtaIN?Chapter 1 is an introduction. Chapter 2 discusses in detail the role of infrastructure in development of the country. Chapter 3 provides a general overview of the state of infrastructure in the country, followed by an in-depth discussion of each priority sector.
Chapter 4 first discusses methodology used for the estimation of infrastructure investment needs. This is followed by the discussion of the estimate of investment needs. Two methods are used to estimate the investment needs by 2030. The first one is top-down (or macro-economic) method (similar to the one used by ADB in 2017), which estimates the need under three different GDP growth scenarios- normal (at 5% growth), optimistic (at 7.5% growth), and highly optimistic (at 10% growth). The highly optimistic growth also is in line with the long-term vision laid out in the draft approach paper of the fifteenth plan, which aims at 10.5% growth by 2043 (NPC, 2019).
The second one is bottom-up method that uses demand for end-use services for the estimation of the infrastructure investment needs. In the absence of detailed data needed to estimate the demand for end use services, the bottom-up method in the present study uses the information ongoing projects, projects in the pipeline, and projects required to meet the international target (i.e., SDGs) to estimate the investment needs. In both methods the underlying assumption is that infrastructure projects will not incur time and cost overruns.
Nepal is at a key juncture of its political history with ample opportunities for economic
growth by investing in infrastructure. However, there are many constraints to investment and reaping its benefits, the key one being financing infrastructure development. The country also faces other challenges such as the lack of a conducive climate for investment, and lack of effective institutions, poorly designed policies and its enforcement, and paucity of technical skills to plan, design, and construct infrastructure projects.
Chapter 5 discusses the role of the private sector in filling the investment gap in infrastructure. The private sector can invest in infrastructure on its own or by entering into Public Private Partnership (PPP) agreements with the government. It can also supply construction materials and contracting services needed for the infrastructure projects. Chapter 6 discusses policies and strategies required to promote investment in infrastructure, the current capacity of government and non-government sources of funding and the need and scope for Foreign Direct Investment (FDI), and other financial instruments. The chapter also discuses innovative ways of planning, executing, and managing the infrastructure to get the most out of investments. For example, proper coordination and cooperation among stakeholders can reduce time and cost overruns in projects; proper management of the existing infrastructure and traffic can reduce traffic congestion; and, managing electricity leakages, using energy-efficient appliances, can reduce the need to build new ones. Effective management can increase the productivity of the existing infrastructure by 40% and reduce the need to build the new ones2. Finally, the report presents conclusion in Chapter 7.
2. Dobbs et al., 2013.
N e p a l I N f r a s t r u c t u r e 2 0 3 0 : I n v e s t m e n t a n d F I n a n c I n g n e e d s
3

N e p a l I N f r a s t r u c t u r e 2 0 3 0 : I n v e s t m e n t a n d F I n a n c I n g n e e d s
4
INFrastructure aNd Its role IN developmeNt
Investment and Financing Needs
N e pa l I N F r a s t r u c t u r e 2 0 3 0

N e p a l I N f r a s t r u c t u r e 2 0 3 0 : I n v e s t m e n t a n d F I n a n c I n g n e e d s
5
2. Infrastructure and its Role in Development
2.1. ROLE OF INFRASTRUCTURE IN GROWTH
Nepal’s economy has grown slower compared to its South Asian neighbors’. It has not followed the path of structural transformation that other fast growing emerging economies have experienced. On the contrary, it has stuck at a “growth plateau”. While many countries have experienced rapid economic growth with modest reduction in poverty, the country is showing the opposite trend: slower growth with brisk reduction in poverty and income inequality. Still, Nepal remains one of the poorest and slowest growing economies. Its economic growth has hovered around an average of 4% in the last twenty years3. In this sense, further progress and sustained economic growth in Nepal require targeted policies and investments. The World Bank (2014) emphasize the importance of three “I”s – Investment, Infrastructure, and Inclusion— for the development of Nepal and recommends that, to take a major development leap toward middle income status, the country should achieve annual real GDP growth rate of around 7%.
There have been various constraints on growth in Nepal: modest natural endowments, challenging topography, extractive political regimes, low level of physical and human capital, and a prolonged period of political transition. The current state of Nepalese economy is also a result of poorly designed and implemented policies that have resulted in weak performance
of the agriculture sector, low public investment, low capital accumulation, and low productivity growth4. Political instability and co-ordination failure are the major challenges to economic growth in Nepal and the country should focus on agriculture, tourism, transport, and energy sectors for development5.
There are several ways of assessing the contribution of infrastructure to an economy. It is widely acknowledged that infrastructure directly contributes to the production of goods and services and can enhance the efficiency of productivity of other factors of production. For example, infrastructure plays an important role in production (energy) and distribution of goods (roads) and also has implications for the overall well-being of households (electricity, access to market, access to safe drinking water and proper sanitation, and to well-designed cities). Infrastructure also affects productivity and output as an additional input in the process of production (energy), reducing transaction and other costs of production (communication and transport), and allowing for more efficient use of productive resources6.
One way to assess the relationship between infrastructure and its role in development is to examine the relationship between Infrastructure Index, GDP per capita and poverty rate. There is a strong positive correlation between GDP per capita and indicators of infrastructure stock
3. World Bank, 2018. 4. Cosic, Dahal , and Kitzmuller, 2017.5. Basnett et al., 2014 and NPC 2017b.6. Dethier and Moore, 2012.

N e p a l I N f r a s t r u c t u r e 2 0 3 0 : I n v e s t m e n t a n d F I n a n c I n g n e e d s
6
and a negative relationship between poverty rate and indicators of infrastructure stock7.
2.2. role oF tHe prIorItY sectors IN groWtHAccess to energy (electricity, fuel, etc.) is important in productive activities and improving the standard of living. Low level of electricity generation has not only constrained economic growth in Nepal but also its social development. Easy access to energy is also a key factor for a ‘smart civilization’ with smart cities8. There is a positive association between Human Development Index (HDI) and per
capita electricity consumption9. Lee (2005), studying the relationship between per capita energy consumption and the GDP of eighteen countries concludes that there is a long- term relationship between energy consumption and GDP of a country.
Transport infrastructure contributes to the economy through connectivity by facilitating the movement of goods and services. It also helps in providing access to health, education, markets, and services. Synergies created by connectivity of people, location, and goods and services can create jobs and industrial hubs. One obvious benefit of better transportation network is saving of travel-time, which can
in 2014, china established the usD 40 billion silk road fund to invest in several key projects, collectively known as Belt and road initiative (Bri). this initiative will see the development of six major economic corridors— the New eurasian land Bridge, china–Mongolia–russia, china–central asia–West-ern asia, indo-china peninsula, china–pakistan, and Bangladesh–china–india–Myanmar.
these corridors are anticipated to be the major economic hub of energy and industrial clusters which will be created using rail, roads, waterways, air, pipe-lines, and information highways. By connecting and enhancing the productivity of the countries along the new silk road, china hopes that the economic benefits of cooperation can be shared and the circle of friendship further expanded and strengthened.
in Nepal, the Ministry of finance (Mof) has received development proposals from in-line ministries, following the news of the Bri. prioritizing the goal of connectivity, proposals related to road, rail, hydro-power, transmission line and communication projects have been forwarded to the Mof for selection and the discussions regarding viable projects will be held in-line with the common interests of both Nepal and china. the proposals have prioritized Kyirong-Kath-mandu- pokhara-lumbini railway, Kyirong-Kathman-du Highway, Nepal-china transmission line, sunkoshi Marine Diversion, irrigation and drinking water
projects in some mid-hill areas. although, Nepal has been pushing for massive usD 1 trillion connectiv-ity projects with china since 2013, the framework agreement was finally signed only in May 2017. the initiative has to take off the ground since officials of the countries are yet to hold discussions after the Government of Nepal selects the priority projects.
Bri can prove to be extremely profitable for Nepal in terms of infrastructure and trade expansion. partici-pating countries like Nepal, which have little to very low capacity to build national infrastructures on their own, can benefit immensely by gaining easy and fast access to projects and their products could become easily tradable in the international market.
Nepal has ample opportunities to reap the benefits of being geographically located between two big giants in terms of global trade. to best utilize the potential of prospective sectors such as hydropower, tourism, and agriculture, Nepal needs huge investments in mega infrastructural projects. Development of those sectors is only possible with a wide network of sea and land routes across many countries. therefore, joining the Bri initiative has the potential to bring investments and experience from across the world to Nepal.
Sources: https://thehimalayantimes.com/business/government-obtains-belt-and-road-initiative-development-proposals/
https://thehimalayantimes.com/opinion/obor-initiative-implications-nepal/
Box 1 caN Nepal Be a part oF regIoNal coNNectIvItY WItH BrI ?
7. ADB, 2017.8. NPC/ADB, 2016.9. UNDP, 2012.
N e p a l I N f r a s t r u c t u r e 2 0 3 0 : I n v e s t m e n t a n d F I n a n c I n g n e e d s
7
result in efficiency and reduction in production cost. Banister and Berechman (2001) argue that investment in transport infrastructure can be a supporting factor for economic development if other conditions like highly skilled work force, availability of funds for investment, and suitable policy and regulatory environment are met. The study also acknowledges the close correlation between growth in freight and passenger traffic and GDP of a country.
Water and sanitation play an important role in economic growth through improvement in health and productivity resulting from access to safe drinking water and proper management of sanitation. One benefit of safe drinking water and properly managed sanitation is prevention of communicable diseases that can result from low quality and unsafe drinking water and unmanaged sewage system. It also improves the standard of living with better access to safe piped water and safer management of wastewater. Overall, improved water and sanitation can enhance productivity and improve the standard of living by preventing diseases contracted from unsafe drinking water and poor sanitation10.
Urbanization and growth of a country go together. It helps create agglomeration economies that foster economic growth. No country has ever reached middle-income status without a significant population shifting into cities. Very few countries have reached income levels of USD 10,000 per capita before reaching about 60% urbanization. In other words, urbanization is necessary to sustain growth11.
Although a simple statistical relation between urbanization level and GDP does not establish causality, it does suggest that urbanization is a very strong indicator of all aspects of productivity growth over the long run12.
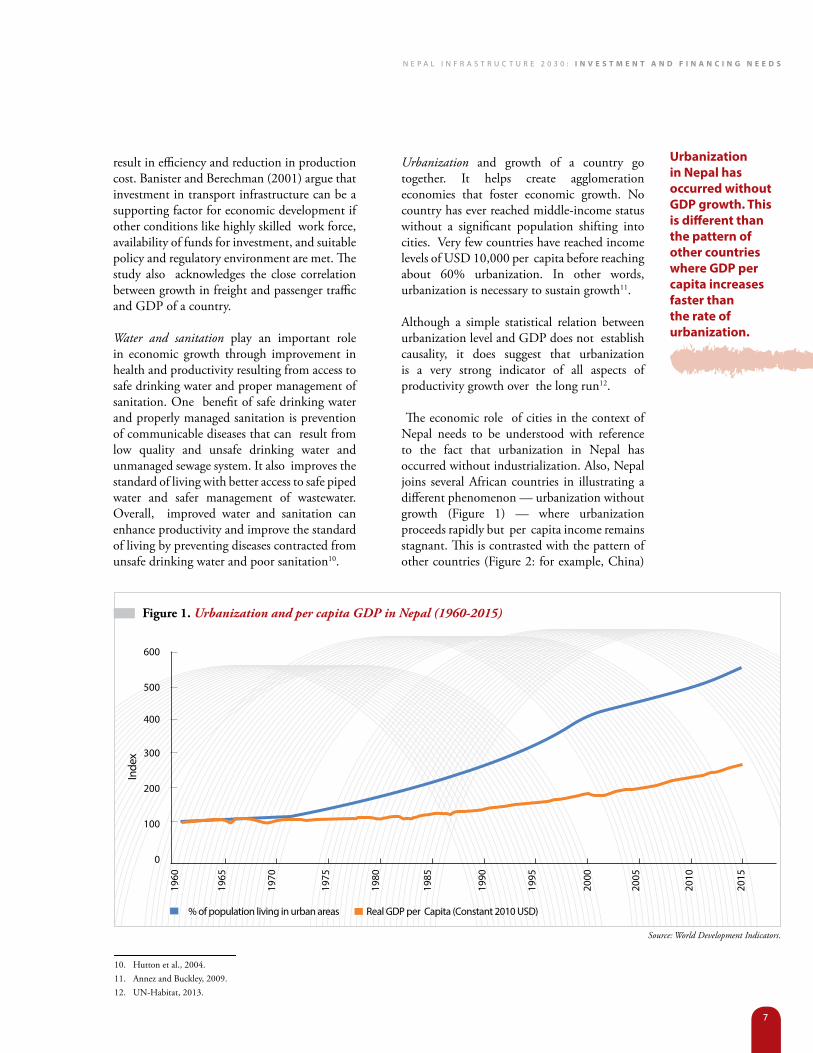
The economic role of cities in the context of Nepal needs to be understood with reference to the fact that urbanization in Nepal has occurred without industrialization. Also, Nepal joins several African countries in illustrating a different phenomenon — urbanization without growth (Figure 1) — where urbanization proceeds rapidly but per capita income remains stagnant. This is contrasted with the pattern of other countries (Figure 2: for example, China)
Figure 1. Urbanization and per capita GDP in Nepal (1960-2015)
0
100
1960
1965
1970
1975
1980
1985
1990
1995
2000
2005
2010
2015
200
300
400
500
600
Source: World Development Indicators.
% of population living in urban areas real GDp per capita (constant 2010 usD)
inde
x
Urbanization in nepal has occurred without gdP growth. this is different than the pattern of other countries where gdP per capita increases faster than the rate of urbanization.
10. Hutton et al., 2004.11. Annez and Buckley, 2009.12. UN-Habitat, 2013.

N e p a l I N f r a s t r u c t u r e 2 0 3 0 : I n v e s t m e n t a n d F I n a n c I n g n e e d s
8
Figure 2. Urbanization and per capita GDP in China (1960-2004)
0
200
1960
1964
1968
1972
1976
1980
1984
1988
1992
1996
2000
2004
400
600
800
1000
1400
% of population living in urban areas GDp per capita in constant price (chain series)
1200
Source: Adapted from Malpezzi and Lin (1999) cited in spence, Annez, and Buckley (2009).
inde
x
where GDP per capita is increasing faster than the rate of urbanization. The y-axis in the figure starts from 100.
Whereas China’s rate of urbanization was 16% and GDP per capita USD was 448 in 1960, in 2004 the rate of urbanization was 39% and GDP per capita USD was 5,33313. In Nepal, the rate of urbanization is increasing faster than GDP per capita. In 1960 rate of urbanization was 3.6% and 42% in 201514, GDP per capita was USD 267 and 689 respectively (GDP per
capita in 2010 constant price obtained from WDI).
In Nepal, whenever new municipalities are declared, the level of urbanization jumps abruptly to a new height in official figures. This however, is a populist political decision and most of the municipalities are still predominantly rural in character. In fact, there are rural areas within municipalities and urbanized areas within Gaunpalikas (so-called rural municipalities). All in all, Nepal is still in an early phase of urbanization.
13. Annez and Buckley, 2009.14. Census data cited in Subedi 2014 and NPC, 2016.

N e p a l I N f r a s t r u c t u r e 2 0 3 0 : I n v e s t m e n t a n d F I n a n c I n g n e e d s
9

curreNt state aNd cHalleNges oF INFrastructure developmeNt IN Nepal
Investment and Financing Needs
N e pa l I N F r a s t r u c t u r e 2 0 3 0

1115 Also includes investment made by NEA in addition to budget allocation in energy sector.
Table 1: Summary of GDP and infrastructure stock of Nepal and other relevant countries
cOuNtry GDp per capita iN usD (2017)
GDp GrOWtH rate (%) iNfrastructure scOre (Out Of 100)
2017 2016
Bangladesh 1,516 7.28 7.1 31.5
india 1,942 6.68 7.1 51.4
lao pDr 2,457 6.89 7 34.2
nepal 849 7.91 0.6 17
pakistan 1,547 5.7 5.7 35.1
sri lanka 4,073 3.31 4.4 54.6
thailand 6,595 3.91 3.2 62.2
vietnam 2,342 6.81 6.2 56.3Source: ADB (2017), World Bank national account data, Global Competitiveness Report 2017-18.
3. Current State and Challenges of Infrastructure Development in Nepal
This section presents the current state of infrastructure and discusses the challenges of infrastructure development in the country. The
discussion begins with a general overview of the state of infrastructure followed by an in-depth discussion on the state of infrastructure in each priority sector, including at the federal level. To assess the state of infrastructure of the country and compare it with other countries, the study looks into infrastructure score, capital expenditure, Gross Fixed Capital Formation (GFCF), and access to basic services to electricity, paved roads, safe drinking water, etc.
3.1. curreNt state oF INFrastructureThe current state of infrastructure of the country is far from satisfactory. Table 1 summarizes the GDP per capita, GDP growth
rate, and infrastructure score (one of the components of global competitiveness ranks). Nepal’s infrastructure score at 17 fares poorly compared to other countries, indicating its weak infrastructure stock. Nepal’s GDP per capita (USD 849) is also comparatively lower.
3.2. capItal expeNdIture aNd gross FIxed capItal FormatIoN (gFcF)Capital expenditure and GFCF are proxies for investment in infrastructure. Government expenditure in Nepal is divided into capital and recurrent expenditures. Capital expenditure includes expenses on vehicles, land, and buildings. The total capital expenditure in the priority sectors in the six fiscal years 2011/12 to 2016/17 was USD 7.03 billion15. Of the priority sectors, energy and transport showed higher capital expenditures compared to water

N e p a l I N f r a s t r u c t u r e 2 0 3 0 : I n v e s t m e n t a n d F I n a n c I n g n e e d s
12
and sanitation and urban development sectors. The capital expenditure in energy was USD 3.95 billion, in transport USD 2.30 billion, in water and sanitation sector USD 0.60 billion, and in urban development 0.16 billion, (MoF, 2018).
For the fiscal year 2016/17 capital expenditure in transport was USD 0.82 billion, 3.12% of the GDP16. For energy sector, it was USD 0.86 billion, 3.27% of GDP. Details on capital expenditure of the priority sectors as percentage of GDP and in billion USD for the six fiscal years are presented in figures 3a. and 3b. However, according to the estimate of spending required on infrastructure from studies by Andres et al. (2014) and Bhattacharya (2010), this level of spending is low.
The GFCF is the net value of assets acquired during the accounting period and records the value of fixed asset investment. The record is classified generally into construction, machinery
and equipment, and other categories (including research and development). However, not all the fixed assets are infrastructure investment17. Despite this, GFCF is a good indicator of the level of investment in infrastructure. Larger GFCF values indicate a higher level of investment in infrastructure. ADB (2017) uses various measures such as: i) budget spending plus private participation in infrastructure; ii) GFCF plus private participation in infrastructure; and iii) GFCF on construction excluding buildings. The general level of GFCF of Nepal (nearly 6% of the GDP) is lower compared to that of India (nearly 8%) and China (nearly 16%).
3.3. state oF eNergY INFrastructureThe major sources of energy in Nepal are firewood, agri-residue, animal waste, coal, petroleum products, and electricity. Firewood is the largest source of energy (68%) in Nepal,
Figure 3a. Capital expenditure in priority sectors as percentage of GDP for fiscal years 2011/12-2016/17
2011/12
1.52
1.43
0.19
0.07
1.73
1.29
0.19
0.07
3.93
1.28
0.27
0.06
1.65
0.48
0.09
3.56
1.95
0.58
0.16
3.27
3.12
0.88
0.29
4.65
2012/13 2013/14 2014/15 2015/16 2016/17
energy transport Water and sanitation urban development
Source: MoF(2018), NEA (2018).
16. Economic Survey (Ministry of Finance, 2016).17. For instance, housing or dwelling.

N e p a l I N f r a s t r u c t u r e 2 0 3 0 : I n v e s t m e n t a n d F I n a n c I n g n e e d s
13
whereas electricity constitutes only 4% of the total energy supply (MoF, 2017). Although the contribution of electricity in total energy supply is lower compared to other sources, it has the highest potential to catalyze economic growth and improve the standard of living.
With a huge hydropower generation potential (economical) of around 43,000 MW, Nepal has so far been able to generate less than 1,000 MW. According to the Nepal Electricity Authority (NEA), there are 88 hydropower plants in operation with a combined generating capacity of 967.85 MW. Of these plants, 60 belong to independent power producers (IPPs) contributing 441 MW to the Integrated National Power System (INPS). Furthermore, there are 113 hydropower plants of varying capacities at different stages of construction, expected to generate 3,080 MW. Among these, 102 IPP plants are expected to generate 2,042 MW. There are also two thermal plants (with NEA) with a combined capacity of 53.4 MW (NEA, 2017).
Only 76.3% of the total households in Nepal have access to electricity (MoF, 2017). Limited access to electricity has resulted in low level of economic and social development. The consumption level for those with access to electricity is also low compared to other South Asian countries. Per capita electricity consumption in Nepal is 130 kWh compared to India, Pakistan, Bangladesh, and Sri Lanka (780, 459, 290 and 530 kWh respectively) (ADB, 2016). Furthermore, until 2016, Nepal faced a severe constraint in electricity supply resulting in 3-4 hours of daily loadshedding during the wet season, and upto 18 hours in the dry season.
The total circuit length of the national transmission system is 3,465.76 km. An additional 3,205 km is now under construction (NEA, 2017). Currently, there are 2.79 million (out of 5.4 million) households connected to the NEA power system (NEA, 2016).
Nepal has a potential of generating approximately 1,830 MW of electricity from
Figure 3b. Capital expenditure in priority sectors in billion of USD for fiscal years 2011/12-2016/17
2011/12
0.23
0.22
0.03
0.01
0.29
0.22
0.04
0.01
0.77
0.25
0.05
0.01
0.35
0.10
0.02
0.80
0.44
0.13
0.04
0.86
0.82
0.23
0.08
0.99
2012/13 2013/14 2014/15 2015/16 2016/17
energy transport Water and sanitation urban development
Source: MoF(2018), NEA (2018).
With a huge hydropower potential of around 43,000 mW, nepal has so far been able to generate less than 1000 mW.
N e p a l I N f r a s t r u c t u r e 2 0 3 0 : I n v e s t m e n t a n d F I n a n c I n g n e e d s
14
concentrating solar energy and about 2,100 MW from grid connected photovoltaic system.
Additionally, Nepal has the potential to produce nearly 3,000 MW of electricity from wind energy (AEPC, 2008).
One important indicator for efficiency of the power sector is the percentage of electricity lost in transmission and distribution. Nepal loses nearly 30% of the total electricity generated. To put it in context, the average electricity loss of OECD countries is 6% (ADB, 2017). The rate of loss of electricity is declining, albeit at a very slow pace.
There is also a constraint to the storage of petroleum products. Nepal Oil Corporation
(NOC), which is a monopoly supplier, currently has a storage capacity of only 71,622 kiloliters at 10 different locations (NOC, 2017). Among these, Kathmandu and Amlekhgunj are the major storage hubs. However, they are barely able to meet 20 days’ worth of national demand (NOC, 2017). Nepal has, so far, no network of pipelines for transportation of the petroleum products. However, NOC and Indian Oil Corporation (IOC) have initiated the preparation of a detailed project report for a 41-km long petroleum pipeline network of which 39 km will lie in Nepal and the remaining 2 km in India.
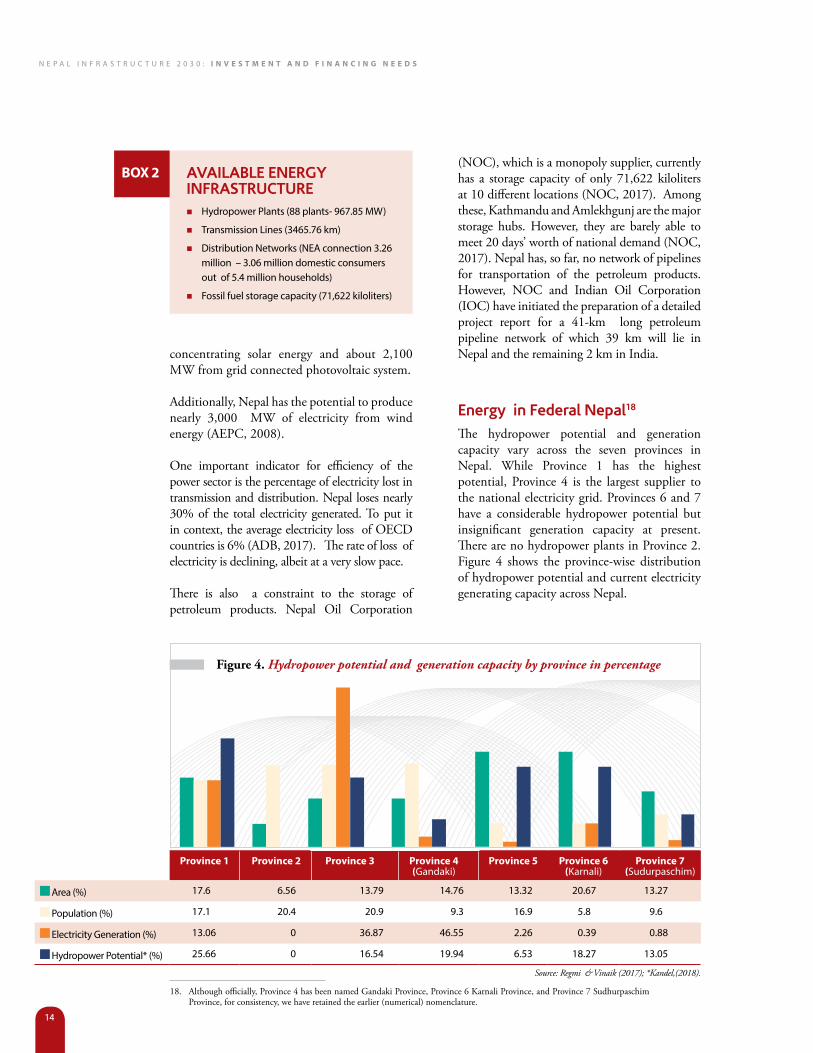
energy in Federal Nepal18
The hydropower potential and generation capacity vary across the seven provinces in Nepal. While Province 1 has the highest potential, Province 4 is the largest supplier to the national electricity grid. Provinces 6 and 7 have a considerable hydropower potential but insignificant generation capacity at present. There are no hydropower plants in Province 2. Figure 4 shows the province-wise distribution of hydropower potential and current electricity generating capacity across Nepal.
Figure 4. Hydropower potential and generation capacity by province in percentage
Province 1 Province 2 Province 3 Province 4 (Gandaki)
Province 5 Province 6 (Karnali)
Province 7 (sudurpaschim)
area (%) 17.6 6.56 13.79 14.76 13.32 20.67 13.27
population (%) 17.1 20.4 20.9 9.3 16.9 5.8 9.6
electricity Generation (%) 13.06 0 36.87 46.55 2.26 0.39 0.88
Hydropower potential* (%) 25.66 0 16.54 19.94 6.53 18.27 13.05
Source: Regmi & Vinaik (2017); *Kandel,(2018).
n Hydropower plants (88 plants- 967.85 MW)
n transmission lines (3465.76 km)
n Distribution Networks (Nea connection 3.26 million – 3.06 million domestic consumers out of 5.4 million households)
n fossil fuel storage capacity (71,622 kiloliters)
Box 2 avaIlaBle eNergY INFrastructure
18. Although officially, Province 4 has been named Gandaki Province, Province 6 Karnali Province, and Province 7 Sudhurpaschim Province, for consistency, we have retained the earlier (numerical) nomenclature.

N e p a l I N f r a s t r u c t u r e 2 0 3 0 : I n v e s t m e n t a n d F I n a n c I n g n e e d s
15
3.4. state oF traNsport INFrastructureNepal’s transport infrastructure is dominated by road networks, which provide for the movement of approximately 90% of all passengers and freight. The road infrastructure in Nepal is categorized into Strategic Road Network (SRN) and Local Road Network (LRN). SRN comprises national highways and feeder roads and LRN district, urban, and village roads. The objectives of SRN are to provide: a) important
road linkages to the border areas with China; b) connect major river corridors; and c) develop Mid-Hill and Postal Highways. LRN is divided into Village Road Core Network (VRCN) and District Road Core Network (DRCN) which connects at local levels.
The road network has grown from 276 km in 1956 to around 69,000 km in 2017. LRN constitutes a significant proportion (82%) of Nepal’s road system. of which around 51%
Table 2: Types and condition of Strategic Road Network (SRN) by physiographic region (2016)
REGION TOTAL LENGTH (IN KM)
% ROAD CLASSBLACK
TOPPED% GRAVEL % EARTHEN %
Mountain (16 Districts)
1,644 13.19 614.36 9.65 95.1 5.50 935.5 21.4 709.46
Hill (39 Districts)
6,593 52.86 3,183.56 49.99 567.25 32.83 2,842.34 64.9 3,750.81
tarai (20 Districts)
4,235 33.96 2,571.06 40.37 1,065 61.67 599.03 13.7 3,636.80
total (Nepal) 12,473 100.0 6,368.98 100.0 1,728 100.0 4,376.87 100.0 8,097
Source: DoR (2016).
Figure 5. Map of road connectivity in Nepal
Source: DoLIDAR, DoR.
the road networks in nepal is dominated by fair weather roads which are seasonal and operational only during rainy season. only 33 percent of total road networks are all-weather roads.
N e p a l I N f r a s t r u c t u r e 2 0 3 0 : I n v e s t m e n t a n d F I n a n c I n g n e e d s
16
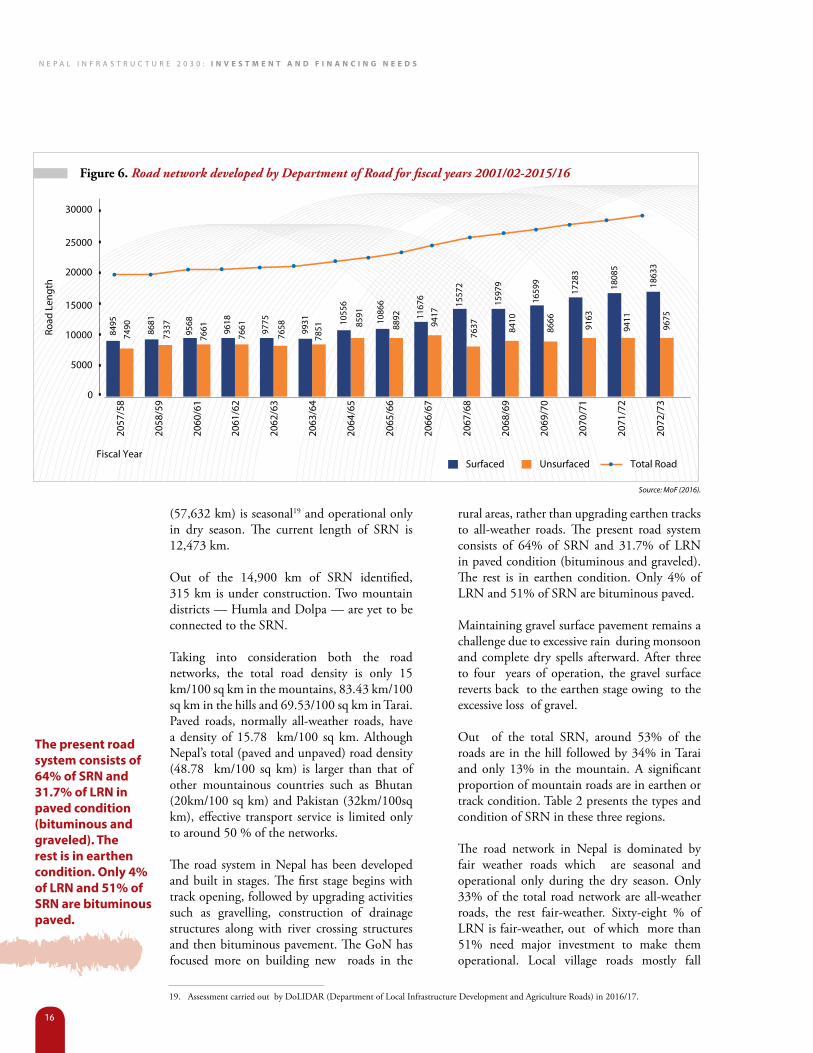
(57,632 km) is seasonal19 and operational only in dry season. The current length of SRN is 12,473 km.
Out of the 14,900 km of SRN identified, 315 km is under construction. Two mountain districts — Humla and Dolpa — are yet to be connected to the SRN.
Taking into consideration both the road networks, the total road density is only 15 km/100 sq km in the mountains, 83.43 km/100 sq km in the hills and 69.53/100 sq km in Tarai. Paved roads, normally all-weather roads, have a density of 15.78 km/100 sq km. Although Nepal’s total (paved and unpaved) road density (48.78 km/100 sq km) is larger than that of other mountainous countries such as Bhutan (20km/100 sq km) and Pakistan (32km/100sq km), effective transport service is limited only to around 50 % of the networks.
The road system in Nepal has been developed and built in stages. The first stage begins with track opening, followed by upgrading activities such as gravelling, construction of drainage structures along with river crossing structures and then bituminous pavement. The GoN has focused more on building new roads in the
rural areas, rather than upgrading earthen tracks to all-weather roads. The present road system consists of 64% of SRN and 31.7% of LRN in paved condition (bituminous and graveled). The rest is in earthen condition. Only 4% of LRN and 51% of SRN are bituminous paved.
Maintaining gravel surface pavement remains a challenge due to excessive rain during monsoon and complete dry spells afterward. After three to four years of operation, the gravel surface reverts back to the earthen stage owing to the excessive loss of gravel.
Out of the total SRN, around 53% of the roads are in the hill followed by 34% in Tarai and only 13% in the mountain. A significant proportion of mountain roads are in earthen or track condition. Table 2 presents the types and condition of SRN in these three regions.
The road network in Nepal is dominated by fair weather roads which are seasonal and operational only during the dry season. Only 33% of the total road network are all-weather roads, the rest fair-weather. Sixty-eight % of LRN is fair-weather, out of which more than 51% need major investment to make them operational. Local village roads mostly fall
Figure 6. Road network developed by Department of Road for fiscal years 2001/02-2015/16
Source: MoF (2016).
2057
/58
2058
/59
2060
/61
2061
/62
2062
/63
2063
/64
2064
/65
2065
/66
2066
/67
2067
/68
2068
/69
2069
/70
2070
/71
2071
/72
2072
/73
30000
25000
20000
15000
10000
5000
0
Road
Len
gth
Fiscal YearUnsurfaced Total RoadSurfaced
19. Assessment carried out by DoLIDAR (Department of Local Infrastructure Development and Agriculture Roads) in 2016/17.
8495
7490 86
81
7337
9568
7661 96
18
7661 97
75
7658 99
3178
51
1055
6
8591
1086
6
8892 11
676
9417
1557
2
7637
1597
9
8410
1659
9
8666
1728
391
63
1808
594
11
1863
396
75
the present road system consists of 64% of sRn and 31.7% of LRn in paved condition (bituminous and graveled). the rest is in earthen condition. only 4% of LRn and 51% of sRn are bituminous paved.

N e p a l I N f r a s t r u c t u r e 2 0 3 0 : I n v e s t m e n t a n d F I n a n c I n g n e e d s
17
Figure 7. Total roads (SRN and LRN) in provinces by physiographic region
Source: DoR (2016) and DoLIDAR (2016).
prov
ince
1
1325
8688
4149
0
7051
3986
1092
3
2022
405
1178
3
0 0
5186
5211
722
2228
1717
648
2526
1961
0
prov
ince
3
prov
ince
5
prov
ince
2
prov
ince
4
(Gan
daki
)
prov
ince
6
(Kar
nali)
prov
ince
7
(sud
urpa
schi
m)
Mountain region Hill region tarai region
under this category. According to the Ministry of Finance (MoF) Economic Survey (2016/17), 65% of the roads built by the Department of Roads (DoR) (including district road network) are all-weather. During the early years of planned development, (FY 2001/02 to FY 2006/07), road work grew by around 2.2% annually. After FY 2006/07 it rose to 6%. Figure 6 depicts the focus and priority received by road up-grading activities after FY 2006/07.
Following the approval of the Strategic Plan20 for SRN, major efforts have been put into upgrading and widening of the existing SRN to higher lane standards. The East-West Highway is being upgraded to four-lane standards. The design work of the Narayanghat-Butwal Section has been completed and is awaiting construction.
roads in Federal NepalAccording to the Constitution, highways come under the jurisdiction of the Federal Government whereas LRN has been entrusted to local governments21. Figure 7 presents the road network distribution in each province based on terrain conditions. The hills constitute
a significant proportion of road networks (58%) in all provinces except Province 2. Province 2, with only Tarai districts with a flat terrain, has 31% leaving 10% to the mountain, mostly in the form of track and operational only during the winter season. Considering the distribution of all-weather and fair-weather roads (SRN and LRN) in the provinces, Provinces 1, 3, and 4 have a significantly higher share of fair-weather
Source: DoR (2016).
Figure 8. Total roads (SRN and LRN) by province
fair-Weatherall Weather
prov
ince
1
prov
ince
3
prov
ince
5
prov
ince
2
prov
ince
4
(Gan
daki
)
prov
ince
6
(Kar
nali)
prov
ince
7
(sud
urpa
schi
m)
4195
9889
4044
3005
5267
1195
6
1077
1100
3
4726
5644
1928
2708
1994
3039
20. Approved by the GoN, 2014 Development and Agriculture Roads) in 2016/17.21. Schedules 5,6,7,8, and 9 of the Constitution define the roles and responsibilities of road network among the three tiers of the government.

N e p a l I N f r a s t r u c t u r e 2 0 3 0 : I n v e s t m e n t a n d F I n a n c I n g n e e d s
18
Source: DoRs (2011) and DoLIDAR (2016).
Figure 9. Road density by province
province 3 province 5province 2province 1 province 4 (Gandaki)
province 6 (Karnali)
province 7 (sudurpaschim)
84.8
3
25.9
4
58.8
9
55.9
9
4.99
51.0
1 59.0
7
17.6
0
41.4
8
77.9
6
41.8
6
31.1
0
56.6
4
25.8
1
30.8
3 29.0
6
12.0
9 16.9
8 25.7
6
10.2
1
15.5
5
total all-Weather fair-Weather
National average (total) of 47.88 Km/100sq. Km
Headline numbers on infrastructure investments needs usually highlight the quantity of infrastructure required to sustain economic growth. But a higher quantity of investment may not necessarily translate to greater returns from infrastructure in the long run.
equal attention should be devoted to the quality of the infrastructure that is built. after all, higher- quality infrastructure is generally more durable, resilient, and efficient.
Quality infrastructure may cost more in the beginning but is worth the extra investment. infrastructure of lower quality tends to deteriorate faster, making it more expensive to maintain, and eventually replace. in other words, you get what you pay for…
…We (authors of the blog, Janine elora lazatin and John paul flaminiano) begin our comparative exercise by estimating two types of composite road densities for developing asia (excluding the people’s republic of china) and for OecD countries. first, we derive the “unadjusted road density” by taking a simple sum of road densities for each type of road. then, we come up with an “adjusted road density” by putting a larger weight on motorways. Our exercise suggests that there is a 9.05 km per 10,000
sq km difference between adjusted and unadjusted road densities based on our model.
if we apply this gap to developing asia’s land area and assume a uniform unit cost, this would mean that there is an additional 90,026 km worth of roads that needs to be financed for developing asia to meet the OecD’s quality-adjusted road density level.
Our simple illustration using road density demonstrates that we need to adjust for quality when estimating infrastructure investments. failure to consider quality may result in a persistently large gap between a country’s true infrastructure investment needs, and how much it currently invests or should invest in the future.
adjusting for quality matters. if countries in asia and the pacific truly want to close their infrastructure gap, future investments should avoid scrimping on quality. low-quality infrastructure can be seen as better than no infrastructure at all. But in the long run, only high-quality infrastructure can sustain the region’s sustainable economic growth.
source: https://blogs.adb.org/blog/why-asia-needs-invest-quality-infrastructure published: friday, 05 May 2017.
Box 3 WHY asIa Needs to INvest IN QualItY INFrastructure ?
Quality infrastructure may cost more in the beginning but is worth the extra investment. Infrastructure of low quality tends to deteriorate faster making it expensive to maintain and to replace.

N e p a l I N f r a s t r u c t u r e 2 0 3 0 : I n v e s t m e n t a n d F I n a n c I n g n e e d s
19
roads compared to the remaining provinces, summarized in Figure 8. In terms of province-wise road distribution, Province 3 claims the highest road density (84.83 km/100 sq km), and Province 7 the lowest. In fact, the road densities in Provinces 6 and 7 are less than the national average (47.88 km/100 sq km.). The proportion of all-weather road network in each province is lower than 50%. The road density (km/100 sq km) of each province is compared in Figure 9.
Figure 10 provides an overall outlook on road density in the provinces. Province 4, with a kilometer for 211 people, stands highest in road density ranking 7th (5 km/100 sq km) in forms of all-weather road density (km of road per 100 sq km) and Province 2 figures lowest (1 km for 823 people), ranking second in forms of all-weather road density (31.1 km/100 sq km). Looking at the current state of road development in provinces, adopting the currently followed standardized strategy may not be appropriate in managing and developing road networks in every province. Provinces 3
and 4 need strategies for upgrading the roads from fair-weather to all-weather and Provinces 2 and 7 need strategies to increase road length.
3.5. state oF Water aNd saNItatIoN INFrastructure Nepal has made substantial progress in the past few decades in providing access to basic water supply and sanitation services. The Millennium Development Goals target for Nepal of 53% coverage of both water supply and sanitation was surpassed by the end of the 2015. The current reported coverage is 95% in basic water supply and 98% in sanitation22 (NPC, 2019). However, this does not account for quality of services of the water supply and sanitation. As of 2017, only 27% of water supply is safely managed, a slight improvement from 24% in 2000 (WHO & UNICEF, 2017).
According to the National Water Policy (2005) coverage targets for 2017, 27% of the population should have access to medium or high-level
Figure 10. Ranking of provinces by road density
Source: DoR (2061) and DoLIDAR (2016).
prov
ince
1
serv
ing
num
ber o
f peo
ple
per k
m
Km p
er 1
00 s
q. k
m a
rea
900
800
700
600
500
400
300
200
100
0
prov
ince
2
prov
ince
3
prov
ince
4
(Gan
daki
)
prov
ince
5
prov
ince
6
(Kar
nali)
prov
ince
7
(sud
urpa
schi
m)
70
60
50
40
30
20
10
0
road per km serving number of population fair weather road per km serving 100 sq. km area all weather road per km serving 100 sq. km area
22. Other surveys such as the Demographic and Health Survey (DHS), Multiple Indicator Cluster Survey (MICS), etc.also report a coverage figure of more than 80 % for water and sanitation services in Nepal.
out of the total sRn, around 53% of the roads are in the hill followed by 34% in tarai and only 13% in the mountain. a significant proportion of mountain roads are in earthen or track condition.
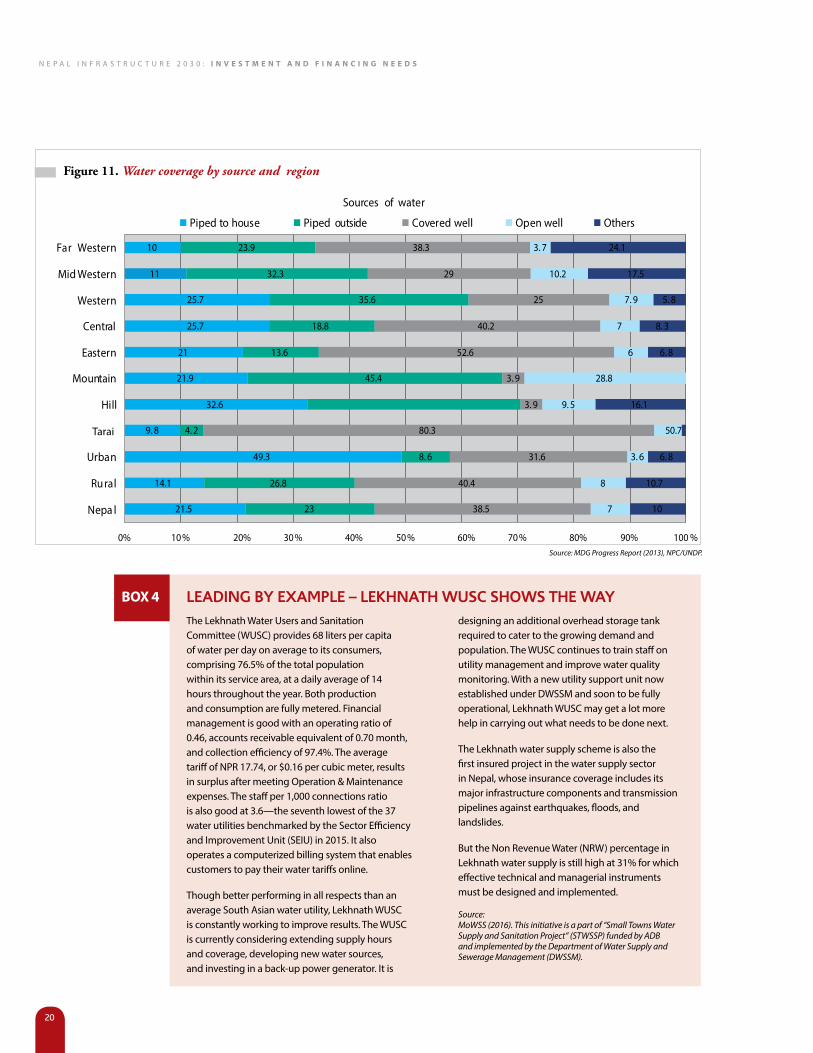
N e p a l I N f r a s t r u c t u r e 2 0 3 0 : I n v e s t m e n t a n d F I n a n c I n g n e e d s
20
the lekhnath Water users and sanitation committee (Wusc) provides 68 liters per capita of water per day on average to its consumers, comprising 76.5% of the total population within its service area, at a daily average of 14 hours throughout the year. Both production and consumption are fully metered. financial management is good with an operating ratio of 0.46, accounts receivable equivalent of 0.70 month, and collection efficiency of 97.4%. the average tariff of Npr 17.74, or $0.16 per cubic meter, results in surplus after meeting Operation & Maintenance expenses. the staff per 1,000 connections ratio is also good at 3.6—the seventh lowest of the 37 water utilities benchmarked by the sector efficiency and improvement unit (seiu) in 2015. it also operates a computerized billing system that enables customers to pay their water tariffs online.
though better performing in all respects than an average south asian water utility, lekhnath Wusc is constantly working to improve results. the Wusc is currently considering extending supply hours and coverage, developing new water sources, and investing in a back-up power generator. it is
designing an additional overhead storage tank required to cater to the growing demand and population. the Wusc continues to train staff on utility management and improve water quality monitoring. With a new utility support unit now established under DWssM and soon to be fully operational, lekhnath Wusc may get a lot more help in carrying out what needs to be done next.
the lekhnath water supply scheme is also the first insured project in the water supply sector in Nepal, whose insurance coverage includes its major infrastructure components and transmission pipelines against earthquakes, floods, and landslides.
But the Non revenue Water (NrW) percentage in lekhnath water supply is still high at 31% for which effective technical and managerial instruments must be designed and implemented.
Source:MoWSS (2016). This initiative is a part of “Small Towns Water Supply and Sanitation Project” (STWSSP) funded by ADB and implemented by the Department of Water Supply and Sewerage Management (DWSSM).
Box 4 leadINg BY example – leKHNatH Wusc sHoWs tHe WaY
Source: MDG Progress Report (2013), NPC/UNDP.
Figure 11. Water coverage by source and region
Sources of water
21.5
14.1
49.3
9. 8
32.6
21.9
21
25.7
25.7
11
10
23
26.8
8. 6
4. 2
37.9
45.4
13.6
18.8
35.6
32.3
23.9
38.5
40.4
31.6
80.3
3. 9
3. 9
52.6
40.2
25
29
38.3
7
8
3. 6
5
9. 5
28.8
6
7
7. 9
10.2
3. 7
10
10.7
6. 8
0.7
16.1
6. 8
8. 3
5. 8
17.5
24.1
0% 10 % 20% 30 % 40% 50 % 60% 70 % 80% 90% 100 %
Nepa l
Rural
Urban
Terai
Hill
Mountain
Eastern
Central
Western
Mid Western
Far Western
Piped to house Piped outside Covered well Open well Others
tarai

N e p a l I N f r a s t r u c t u r e 2 0 3 0 : I n v e s t m e n t a n d F I n a n c I n g n e e d s
21
drinking water supply service. Piped water, considered to be the safest source, varies across the rural-urban setting in terms of coverage. While 58% of the population in the urban areas has piped water services, the figure is only 41% for rural areas (Figure 11). In areas without access to basic water supply, water sources are either natural springs and spouts, or shallow groundwater wells, and hand pumps. Despite attempts to improve water quality, only 27% of the water systems are reported to comply with the national water quality standards.23
Nepal has come a long way in improving access to basic sanitation24 with coverage raised to 97% in 201925 from 62% in 2011. The country has witnessed a robust social momentum and transformational improvements in basic sanitation with several districts and municipalities being declared Open Defecation Free (ODF) zones, following the launch of Sanitation and Hygiene Master Plan in 2011. In the case of rural sanitation, as is the focus of the Master Plan, the country has adopted a sanitation ladder approach of gradually moving from ODF to a total sanitation community. However, CBS (2011) states that only 30% of the urban households are connected to sewerage or septic tank. This implies that wastewater has not received a priority.
Issues of access and qualityAn improved drinking water source is defined as one that is not only protected from outside contamination but also from fecal matter
contamination through appropriate safety measures. Coverage figures may drop sharply if normalized based on this definition. Mediocre situation of water supply in Kathmandu — the biggest urban center in the country — raises questions about the relevance and interpretation of such statistics.
The quality of supplied water is still a matter of concern to consumers. Contaminated water and unsafe sanitation have increased the vulnerability of population to diseases like cholera, diarrhea, dysentery, hepatitis A, typhoid, polio etc. One study by WHO Nepal (2018) states that almost 240 million people are affected globally by schistosomiasis – an acute chronic disease caused by parasitic worms contracted through exposure to infested water26. It recounts the recent cholera outbreak in Rautahat, as also Hepatitis A and E outbreaks in Biratnagar in 2014.
There is high prevalence of arsenic (As) in 22 districts of Tarai, with sporadic cases reported in Kathmandu. Public water supply in Kathmandu, in general, is highly contaminated (mainly by pathogens) and people have to resort to expensive coping mechanisms like filtering and boiling to keep water safe. Water quality, for these reasons, should receive priority during the next decade. This would require precautionary methods through adoption of water safety plans, and establishment of additional water treatment plants. Tables 3 and 4 summarize the various parameters of different quality levels of water supply and sanitation proposed by this study to facilitate planning and continued assessment.
Table 3: Service level of water supply
liMiteD Basic iMprOveD
• partially protected source• No disinfection• partial supply
• protected source• Disinfected and basic
treatment• HHs connection – 45 lpcd*• intermittent daily supply
• treated to National Drinking Water Quality standards (NDWQs)
• fully plumbed• 100 lpcd• continuous
*Note: lpcd denotes liters per capita per day.
23. Fourteenth Plan (2016/17-2018/19), National Planning Commission.24. Basic sanitation is the lowest-cost technology ensuring use of toilets.25. Fifteenth Plan (2019/20-2023/24), National Planning Commission.26. Country Cooperation Strategy 2018-2022 position paper prepared by WHO
in Nepal for Program Category – Cat 3 Environmental Health (WASH).
Piped water, considered to be the safest source, varies across the rural-urban setting in terms of coverage. While 58% of the population in the urban areas has piped water services, it is only 41% for rural areas.

N e p a l I N f r a s t r u c t u r e 2 0 3 0 : I n v e s t m e n t a n d F I n a n c I n g n e e d s
22
Wastewater managementFor all practical purposes, waste-water management system in Nepal can be considered to be in infancy. Very few systems have been constructed and few of those constructed are in successful operation. Some successful examples are— treatment of hospital wastewater in Dhulikhel, industrial wastewater in Hetauda, a small community wastewater system in Siddhipur (Lalitpur), etc. A fecal sludge treatment plant is in successful operation in Lubhu, Lalitpur. The Department of Water Supply and Sewerage Management (DWSSM) is also piloting non-sewered sanitation programs in Kakarvitta and Charali in Jhapa, taking into consideration the applied regulations across sanitation service chains, effective operation of treatment plants, and partnership between the public and private sector.
Water treatment systems in Nepal are rare, the sewers are discharging openly into natural bodies. Kathmandu Valley has 4 pond-based treatment units, in Dhobighat and Kodku-Balkumari (in Lalitpur), and Sallaghari and Hanumanghat
(in Bhaktapur). However, the total treatment capacity of these plants is a mere 19 MLD27.
Further, most of these systems are dysfunctional. The treatment plant just upstream of Guheshwori, constructed to treat sewerage before discharging it into the Bagmati River, has a treatment capacity of 17 MLD and is only partially functional.
A Sewerage Master Plan for Kathmandu projected to the year 2030 — Kathmandu Valley Wastewater Management Project — has been prepared under an ADB Loan28. The scope of this project includes rehabilitating existing network, laying new interceptors along the major rivers, expansion of networks, refurbishment of existing treatment plants, and construction of new treatment plants. The cost of the project is approximately USD 817 million. The plan projects a population of 4.5 million by 2025 and assumes that 70% of it will be covered through a sewerage network, with 30% relying on onsite sanitation systems. The master plan has made an inventory of wastewater treatment systems in the Kathmandu Valley (see Table 5).
Table 4: Service level of sanitation
ON-site saNitatiON
ON-site cONNecteD WitH treatMeNt
seWereD WitH priMary treatMeNt
seWereD WitH secONDary treatMeNt
• septic tank
• soak away and soak pit
• septic tank
• regular desludging services
• safe fecal sludge management
• connected sewer network
• pond or wetland system
• connected sewer network
• reactor-based treatment
• treated to National Wastewater effluent standards
Table 5: Wastewater treatment plants in Kathmandu Valley
paraMeter HaNuMaNGHat sallaGHari KODKu DHOBiGHat GuHesHWOri
year of establishement 1975 1983 1982 1982 2001
capacity (MlD) 0.5 2 1.1 15.5 16.4
area of WWtp (ha) 0.7 3.3 6.5 30.4 5.0
population 4,000 20,000 8,000 40,000 198,000
Source: Draft Sewer Master Plan Review Report, Kathmandu Valley Wastewater Management Project (2016).
27. Million liters per day.28. ADB Loan No. 3000NP.

N e p a l I N f r a s t r u c t u r e 2 0 3 0 : I n v e s t m e n t a n d F I n a n c I n g n e e d s
23
Water and sanitation in Federal NepalThe recent restructuring of state presents an opportunity for improvement in the current situation in the sector. It is highly likely that water supply and sanitation will be amongst the first-priority issues to be addressed by these municipalities. The central government’s role in the sector includes program development and investment in quality water and sanitation services. The federal role will also be that of a facilitator, engaging mainly in building local capacities to deliver safely managed water supply and sanitation services and addressing the broader issues of pollution control of natural water bodies and climate change. However, metropolitan and sub-metropolitan cities would still require significant central support to implement their programs.
In the rural areas, programs are more likely to be focused on building new systems for “reaching the unreached” and improving the functionality of water systems already commissioned.
Additionally, works related to catchment management, source protection, and local actions to mitigate climate change impacts are also likely to gain momentum.
The realization of Sustainable Development Goal 6 – Ensure availability and sustainable management of water and sanitation for all – and associated activities, will be pursued as a national agenda, but it will be implemented locally. The range of activities, where private sector inputs are desired and mutually beneficial, needs to be explored and designed.
Upgrading the levels of services, based on municipal water supply and sanitation plans, is likely to be the agenda for many municipalities. Most of the activities are likely to be related to strengthening reliability and continuity of the systems and ensuring availability of the adequate quantity of safe water. Accordingly, many municipalities will prepare a plan for 24 hours supply of safe drinking water. They will also need to mobilize resources and political will toward city-wide inclusive sanitation services
3.6. state oF urBaNIZatIoN Urbanization is a global phenomenon. Today, more than half of the world’s population live in cities.29 The share of urban population is expected to increase to 66% by 2050 with urban growth concentrated in Asia and Africa (UN DESA, 2014). The two neighbors of Nepal – China and India – are projected to add 696 million urban dwellers by 2050.30 Nepal’s own urbanization may not be as significant as that of its neighbors, yet it is one of the most rapidly urbanizing countries in the world.
Urban growth in Nepal is primarily characterized by: (i) an increase in the number of municipalities; (ii) an expansion in urban areas; (iii) a relatively steady increase in the population of designated urban areas in the initial years; and (iv) an explosion in the population in recent years (Subedi, 2014). Measuring urbanization in terms of municipal population—in contrast to the designated urban areas meeting minimum criteria related to population, infrastructure, and revenue— affects the analysis of urban growth in the country. Although this is a contested method, there is no denying that urban growth in Nepal has been mostly haphazard where declaration of municipalities is mostly a political decision.
Infrastructure and services in most municipalities, including established cities, are inadequate in terms of both quantity and quality. Numerous challenges still exist in meeting even the basic needs of the burgeoning urban population including housing, drinking water and sanitation, jobs, transportation, and healthcare, among others.
In 1981, there were 23 municipalities which were home to 6.4% of the total population of the country. In 1991, the number of municipalities increased to 58 and remained unchanged till 2011. However, the share of population living in municipalities rose from 13.9 to 17.1% at a significant growth rate of 3.38% per annum. With 293 municipalities in the country today (see Figure 14), about two-thirds of the national population are estimated to live in municipalities. Out of the
29. In 2014, the share of urban population stood at 54 % (UN DESA, 2014).30. Between 2014 and 2050, China, India, and Nigeria will account for 37 % of the projected growth of the world’s urban population
with India adding 404 million urban dwellers, China 292 million, and Nigeria 212 million by 2050 (UN DESA, 2014).
Urban growth in nepal is primarily characterized by an increase in the number of municipalities

N e p a l I N f r a s t r u c t u r e 2 0 3 0 : I n v e s t m e n t a n d F I n a n c I n g n e e d s
24
With widespread development in the information, communication, and technology (ict) sector, the concept of smart city (sc) has gained momentum worldwide. an sc is an urban development vision to improve the quality of life by using urban informatics and technology to improve the efficiency of services and meet residents’ needs (uN-ecOsOc, 2016).
the urgent need for cities in developing countries is to provide adequate urban infrastructure to match the rapid pace of urbanization. in meeting infrastructure demands, smart infrastructure applications can enable cities to achieve leapfrogging in technology. Keeping this in mind, the Government of Nepal announced, through the Budget of fiscal year 2016/17, development of three scs, namely lumbini, Nijgadh, and the defined area of Gorkha, lamjung and tanahu districts with palungtar at the center. More recently, ten more municipalities have been added for development as scs.
scs can either be built from the start — such cities are designed to attract businesses and residents with a master plan that uses ict to deliver efficient citizen benefit services — or existing cities can be ‘smartized’ step-by-step using retrofits and
upgrades. However, for established cities, setting up smart technology in areas like water, power, and transport takes longer as these cities were not built keeping technology advancement in mind.
scs exploit technology to offer high quality of life for residents — in electricity, water supply, sanitation and recycling, traffic and transport systems (that use data analytics to provide efficient solutions to ease commuting), automated building security and surveillance systems (requiring minimal human intervention), and Wi-fi-powered open spaces and houses that ensure always-on, high-speed connectivity.31
ppp allows the government to tap the private sector’s capacity to innovate, invent, and bring in efficiency. Greater involvement of the private sector in the delivery of services is another instrument as it brings enables higher levels of efficiency. However, certain concerns need to be addressed: defining the scope properly, setting of dispute resolution mechanism at the local level, designing ppp projects that enough flexibility is available, ensuring full transparency and accountability, shortening the procurement cycle, and facilitating due recognition to quality rather than only profit.
Box 5 smart cItY developmeNt IN Nepal
Figure 12. Municipal population growth trend
Source: Based on CBS data cited in Subedi (2014) with added input.
1952
/54*
1961
*
1971
*
1981
*
1991
*
2001
*
2011
*
2014
May
2014
Dec
2015
sep
2017
Mar
2017
May
Num
ber o
f mun
icip
aliti
es
prop
ortio
n of
mun
icip
al p
opul
atio
n in
tota
l pop
ulat
ion
(%)
350
300
250
200
150
100
50
0
70
60
50
40
30
20
10
0
No. of municipalities percentage of total population Note: *Data for census year indicates total as of the given year.
31. http://www.livemint.com/Specials/HucTFmqE2wflhIpVTcv0XN/Smart-cities-to-soon-become-a-reality-in-India.html.
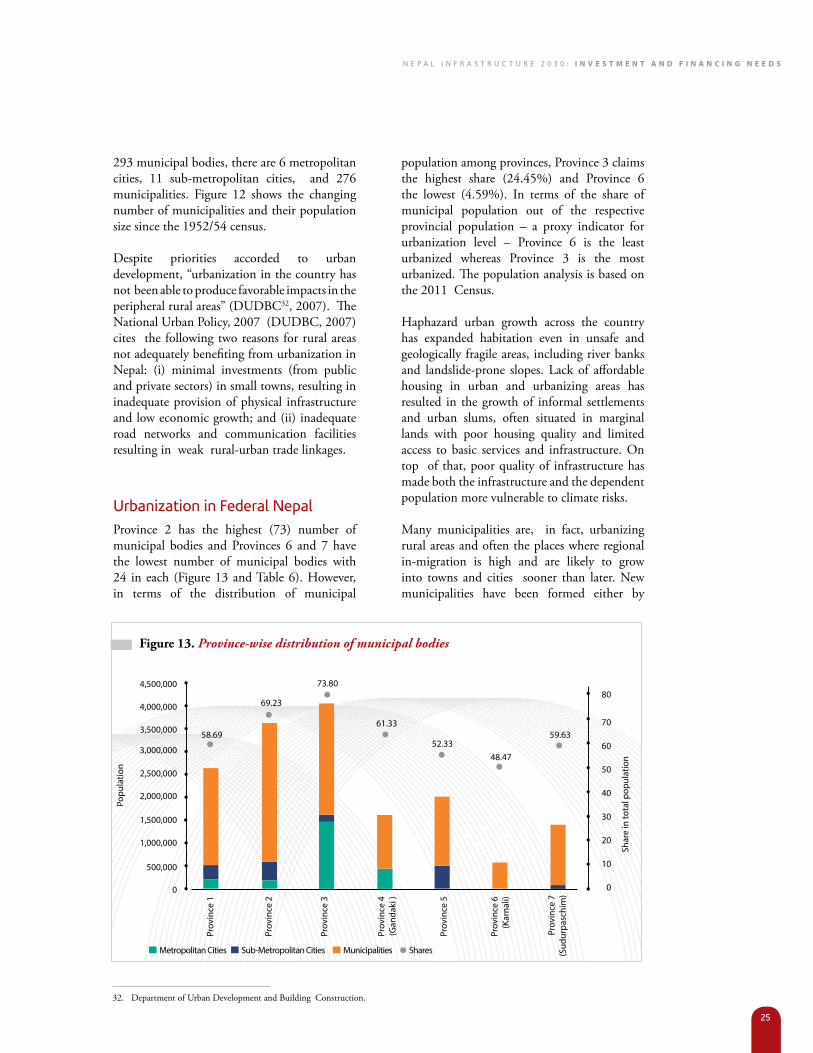
N e p a l I N f r a s t r u c t u r e 2 0 3 0 : I n v e s t m e n t a n d F I n a n c I n g n e e d s
25
293 municipal bodies, there are 6 metropolitan cities, 11 sub-metropolitan cities, and 276 municipalities. Figure 12 shows the changing number of municipalities and their population size since the 1952/54 census.
Despite priorities accorded to urban development, “urbanization in the country has not been able to produce favorable impacts in the peripheral rural areas” (DUDBC32, 2007). The National Urban Policy, 2007 (DUDBC, 2007) cites the following two reasons for rural areas not adequately benefiting from urbanization in Nepal: (i) minimal investments (from public and private sectors) in small towns, resulting in inadequate provision of physical infrastructure and low economic growth; and (ii) inadequate road networks and communication facilities resulting in weak rural-urban trade linkages.
Urbanization in Federal NepalProvince 2 has the highest (73) number of municipal bodies and Provinces 6 and 7 have the lowest number of municipal bodies with 24 in each (Figure 13 and Table 6). However, in terms of the distribution of municipal
population among provinces, Province 3 claims the highest share (24.45%) and Province 6 the lowest (4.59%). In terms of the share of municipal population out of the respective provincial population – a proxy indicator for urbanization level – Province 6 is the least urbanized whereas Province 3 is the most urbanized. The population analysis is based on the 2011 Census.
Haphazard urban growth across the country has expanded habitation even in unsafe and geologically fragile areas, including river banks and landslide-prone slopes. Lack of affordable housing in urban and urbanizing areas has resulted in the growth of informal settlements and urban slums, often situated in marginal lands with poor housing quality and limited access to basic services and infrastructure. On top of that, poor quality of infrastructure has made both the infrastructure and the dependent population more vulnerable to climate risks.
Many municipalities are, in fact, urbanizing rural areas and often the places where regional in-migration is high and are likely to grow into towns and cities sooner than later. New municipalities have been formed either by
Figure 13. Province-wise distribution of municipal bodies
prov
ince
1
prov
ince
2
prov
ince
3
prov
ince
4
(Gan
daki
)
prov
ince
5
prov
ince
6
(Kar
nali)
prov
ince
7
(sud
urpa
schi
m)
popu
latio
n
shar
e in
tota
l pop
ulat
ion
3,500,000
4,000,000
4,500,000
58.69
69.23
73.80
61.33
52.3348.47
59.63
3,000,000
2,500,000
2,000,000
1,500,000
1,000,000
500,000
0
70
80
60
50
40
30
20
10
0
Metropolitan cities sub-Metropolitan cities Municipalities shares
32. Department of Urban Development and Building Construction.

N e p a l I N f r a s t r u c t u r e 2 0 3 0 : I n v e s t m e n t a n d F I n a n c I n g n e e d s
26
Table 6: Municipal population in province
prOviNces tOtal NO. Of MuNicipalitiestOtal MuNicipal
pOpulatiON (2011 ceNsus)
DistriButiON aMONG
prOviNces (%)
sHare iN tOtal prOviNcial
pOpulatiON (%)
1 49 (including Biratnagar Mc and itahari and Dharan sMcs) 2,642,524 16.09 58.69
273 (including Birgunj Mc and Janakpur, Kalaiya, and Jitpur-simara sMcs)
3,724,85422.67 69.23
349 (including lalitpur, Kathmandu, and Bharatpur Mcs, and Hetauda sMc)
4,016,862 24.45 73.80
4 (Gandaki)32 (including pokhara-lekhnath Mc and Butwal, tulsipur, Ghorahi, and Nepalgunj sMcs)
1,464,6548.92 61.73
5 32 2,321,266 14.13 52.33
6 (Karnali) 24 754,241 4.59 48.47
7 (sudurpaschim) 34 (including Dhangadhi sMc) 1,503,379 9.15 59.63
total 293 (including 6 Mcs and 11 sMcs) 16,427,780 100.00 62.67
Acronyms: MC – Metropolitan City; SMC – Sub-metropolitan City..
Figure 14. Municipalities in Nepal
municipalities in nepal(total = 293)

N e p a l I N f r a s t r u c t u r e 2 0 3 0 : I n v e s t m e n t a n d F I n a n c I n g n e e d s
27
amalgamating several Village Development Committees (VDCs) or by dissolving and/ or integrating VDCs into neighboring municipalities. Urbanization in Nepal, which has been mostly haphazard, is characterized by inadequate and sub-standard urban infrastructure and services. In an assessment of basic urban infrastructure in the earlier 58 municipalities for the National Urban Development Strategy (NUDS), 2017, only 26 (45%) municipalities scored 50 or more out of a total 100. There are wide deficits as well as geographical disparities in the availability of basic urban infrastructure (housing, roads, water supply and sanitation, sewage drainage, electricity, and solid waste management, among others). According to MoUD (2017), only one-third of the households in urban Tarai have access to piped water supply compared to 81% in urban hills. The quality and quantity of drinking water is insufficient in all the urban regions. Likewise, little more than half of the urban households have access to sanitation system. Out of the previous 58 municipalities, only six had sanitary landfill sites and five practiced controlled waste dumping. The average road density in the urban areas is significantly low: 3.26 km/sq km. Lack of affordable housing, resulting in the growth of squatter settlements and urban slums, is a major emerging concern in many urban areas.
3.7. cHalleNges IN INFrastructure developmeNt Clear policies, political stability, choices in financing options, and investment-friendly bureaucracy are the foundation of overall infrastructure development in any country. They also constitute important criteria for investment in infrastructure by the private sector. However, these are clearly lacking in Nepal and the country has a low level of infrastructure development as discussed in previous sections. There are numerous problems and challenges at all levels and stages of infrastructure development. Though not comprehensive, the study has identified the following challenges in infrastructure investment and development in the country.
Lengthy approval processesThe current system of governance and bureaucracy of Nepal causes delay in, and has opaque requirements for, approval and permits. There is inefficiency in the processes of licensing, construction, and operation of project resulting from delayed decision, lengthy approval processes, duplication of efforts to get approval (same process of approval from two different authorities), frequently changing of laws and policies on an ad hoc basis, etc. See Box 6 for example.
a hydropower developer needs to go through 7 ministries and 23 government departments to develop a hydropower project in Nepal. the processes of obtaining permit, license, and acquiring land are difficult due to legal inconsistencies, lack of coordination among the governing bodies/ministries, and overall ineffective governance. some of the ministries and other institutions that a hydropower developer needs to go through in the process of project development are:
• MinistryofEnergy,WaterResource&irrigation: license, project Development agreement.
• MinistryofForestandEnvironment:Deforestation, environment impact assessment.
• MinistryofIndustry,Commerceandsupplies: registration of company, foreign investment.
• MinistryofFederalAffairs&Generaladministration: local taxes.
• MinistryofHomeAffairs:Explosivesandsafety.
• MinistryofFinanceandNRB:Foreignexchange.
• NepalElectricAuthority:Power.
Box 6aN example oF approval process IN HYdropoWer proJect
N e p a l I N f r a s t r u c t u r e 2 0 3 0 : I n v e s t m e n t a n d F I n a n c I n g n e e d s
28
Multiple policies with overlapping authorities Lack of a national unified policy on infrastructure development and investment is a major hurdle for infrastructure development in Nepal. There are multiple acts and policies on sectorial infrastructure, domestic investment, and foreign investment. Some of them dealing with infrastructure in Nepal are: Land Acquisition Act (1977); Hydropower Development Policy (HDP) (2001); Foreign Investment and Technology Transfer Act (FITTA) (2019); Public Private Partnership and Investment Act (PPPI) (2019).
Due to such multiple policies, there is overlapping of authorities, as also inconsistency in regulation between the authorities. The authorities, moreover, have regulatory powers depending on the nature and size of the project, exacerbating the uncertainty of the project. For example, the provision on issuance of hydropower license is contradictory to the new PPPI Act (2019) which authorizes IBN to issue generation license for project above 200 MW, which contradicts the current provision of the Electricity Act (1992) authorizing the Ministry of Energy, Water Resources, and Irrigation to issue license for all hydropower projects. Such ambiguities in policies pose a major hurdle in infrastructure investment since they create risks for the investors.
Inability to mitigate investment riskInfrastructure projects in Nepal are exposed to various risks, namely: political factors; ambiguous laws and regulations; risks of fluctuations in environment, and interest rates and exchange rates; and risks to the constant revenue stream. Mitigating these risks is a major challenge for infrastructure development in Nepal. Such risks affect the bankability of projects as also the willingness of investors to invest. The project development agreement of Nepal does not have provisions to account for various risks to protect investors nor does it meet the international standards.
Hedging regulations do protect investors from probable losses arising from exchange
rate fluctuations for foreign investment in some identified critical infrastructure projects. Investors can pay a hedging premium to the NRB and the bank can offer protection to investors from risk by fixing the exchange rate to the rate of loan availing date. Such protection should be extended to other projects as well to increase the bankability of Nepalese infrastructure investment.
Limited financing optionsAccess to finance is important for the development of infrastructure. However, lack of clear guidelines on raising capital for infrastructure projects and limited financing options are the major hurdles in infrastructure development. Generally, infrastructure projects in Nepal are financed through debt and equity financing. One of the major issues with debt financing is the capacity and willingness of Banks and Financial Institutions (BFIs) to finance the infrastructure projects since the projects are a long-term investment. This apart, NRB regulates BFIs on their portfolios, limiting their investment on infrastructure projects.
On the equity side, preference shares are the financing option. There are regulations on maintaining the debt-equity ratio by the company investing in infrastructure.
The current equity issuing guidelines rely heavily on the traditional balance sheet. According to the Company Act 2006, for the issuance of share at a premium, a company needs to have a three-year track record of net profit. Such guidelines undermine the prospect of premium pricing based on the future return and future revenue stream of the project.
BOOT model as the only form of Public Private Partnership (PPP)The enactment of the Hydropower Development Policy in 1992 and the Electricity Act in 1992 triggered private sector participation in infrastructure. The Electricity Act recognizes the BOOT modality for developing hydropower projects. BOOT model with limited terms
Lack of clear guidelines on
raising capital for infrastructure
projects and limited financing
options are the major hurdles
in infrastructure development.

N e p a l I N f r a s t r u c t u r e 2 0 3 0 : I n v e s t m e n t a n d F I n a n c I n g n e e d s
29
(for example, 35 years for development of infrastructure project) as the only form of PPP can also be a challenge for infrastructure development in the country. Although this model has been successful in the development of hydropower by the private sector, it may not be ideal for all types of infrastructure needs.
For example, road projects may not be feasible under the BOOT model due to the risks to revenue streams.
Besides the above-mentioned challenges, each priority sector faces specific challenges, summarized in Table 7.
Table 7: Key challenges specific to the priority sectors
sectOrs cHalleNGes
energy
n understanding future demand (or demand forecast)n inadequate supply of electricity and reliance on the traditional source for
energyn High cost of energy importn leakages in energy supplyn inefficiency in energy usen lack of integrated planning and execution of projects
transport
n under-utilization of existing networksn administrative, rather than economic/strategic classification of roadsn Majority of roads are fair-weather roads (seasonal)n road networks vulnerable to climate change and disastersn Difficulty of maintaining the existing road networks due to ineffective asset
management, which results in higher maintenance costn traditional approach to road construction – cutting high slopes and filling
valleysn absence of short-term and long-term plans and progress of projects
dictated by available resources (or budget allocation)
Water and sanitation
n larger disparity in access to basic water supply and basic sanitation across the country
n Water supply and sanitation system in need of major repair and re-construction
n poor condition of water treatment plantsn unplanned densely-populated urban areasn poorly designed and constructed drainage systemsn Disposal of waste water without proper treatmentn unregulated extraction of ground water in urban areas
urban development
n Haphazard urbanizationn urbanization without economic growth of the countryn poor quality of basic infrastructure (roads, hospitals, schools, water and
sanitation, solid waste management, etc)n shortage of funds in municipalitiesn acquisition of private lands
although Boot model has been successful in the development of hydropower projects by the private sector, it may not be ideal for all types of infrastructure needs.

N e p a l I N f r a s t r u c t u r e 2 0 3 0 : I n v e s t m e n t a n d F I n a n c I n g n e e d s
30
estImatINg INFrastructure INvestmeNt Needs aNd gaps
Investment and Financing Needs
N e pa l I N F r a s t r u c t u r e 2 0 3 0
N e p a l I N f r a s t r u c t u r e 2 0 3 0 : I n v e s t m e n t a n d F I n a n c I n g n e e d s
31
This section presents a brief overview of the estimation methodology used in the study, estimates of infrastructure investment needs by 2030
and investment gap. The estimates are generated using two methods: top-down (macroeconomic), method similar to the one used by ADB (2017), and a bottom up methods for each priority sector.
The top-down method estimates investment needs using the macro-economic approach under three different GDP growth scenarios. The estimation is based on the relationship between GDP and variables that represent infrastructure investment (such as: road density, energy generated per capita, percentage of population with access to water, and sanitation services). However, these variables alone cannot capture all the complexities of infrastructure investment in the country such as issues of quality, energy generated with different mixes of run of the river or storage project, level and types of services provided by infrastructure, terrain conditions, urban development goals, etc. To account for these issues, the present study also estimates the investment needs using the bottom-up method, which in theory uses demand for end-use services as the basis for the estimation of the investment needs. However, due to lack of detailed data on demand for end use services, the bottom-up method in this study estimates the investment needs by considering ongoing projects, projects in the pipeline, and projects required to meet the international target (i.e., SDGs).
An underlying assumption in both the methods is that the project would not incur time and cost overrun. Although projects in Nepal do incur time and cost overrun, the study did not account for it due to time, budget, and data constraints. The estimated needs will increase, if the projects incur time and cost overrun.
4.1. top doWN (macro-ecoNomIc) metHodThe top-down method estimates infrastructure investment needs using a relationship between GDP and the variable that represent the level of infrastructure road density (kilometer of road/1000 sq.km), kilowatt of electricity generated per capita, and percentage of population with access to drinking water and sanitation. In the present study, this method has been used to estimate the investment needs under three different GDP growth scenarios: normal growth at 5%, optimistic growth at 7.5% and highly optimistic growth at 10% per annum.
Two sets of investment needs are estimated: baseline and climate adjusted estimate. The approach to estimating baseline investment needs is similar to those used by ADB (2017), Ruiz-Nunez and Wei (2015), ADB and ADBI (2009), Bogetic and Fedderke (2006), Fay and Yepes (2003), and Fay (2000). Generating baseline estimates first requires estimating the relationship between the physical infrastructure stocks (for example, kilometers of roads or megawatts of electricity generated) and the key economic and demographic factors that influence demand and/ or supply of infrastructure
4 Estimating Infrastructure Investment Needs and Gaps

N e p a l I N f r a s t r u c t u r e 2 0 3 0 : I n v e s t m e n t a n d F I n a n c I n g n e e d s
32
services, including lagged infrastructure stock, per capita gross domestic product (GDP), population density, share of urban population, and the shares of agriculture and industry in GDP. The study uses the real GDP, share of agriculture value-added in GDP (AGR), share of industrial value-added in GDP (IND), share of population in urban areas (URBAN), and population density (POPDEN), kilowatts of installed electricity generation capacity per capita, kilometers of road per 1,000 sq km of land area, percentage of population with access to water, and percentage of population with access to sanitation. The data was obtained from the World Development Indicators (WDI) of the World Bank, annual reports of NEA, and the Economic Surveys of the MoF. The sample ranges from FY1971 to FY2016 for energy and transport sectors, and from FY1992 to FY2015 for water and sanitation sectors. The starting and end periods of the samples are determined by the availability of data for infrastructure stock variables representing these sectors.
The regression estimates generally suggest that, ceteris paribus, while a country’s infrastructure stock increases with GDP per capita, the incremental needs decrease with the existing stock of infrastructure. Future
physical infrastructure stocks are then estimated using projections of those same economic and demographic factors. Annual needs for additional infrastructure are calculated as a year-by-year difference in infrastructure stocks. Empirically estimated unit costs are then applied to the annual increments in infrastructure stock to derive the monetary values of new investment needs. The methodology is discussed in detail in Annexes A3 and A4.
Similar to ADB (2017 and 2016), two additional infrastructure-related investments are considered: environmental risk mitigation and climate proofing to estimate infrastructure investments with climate change adjustments. The adjustments required for the baseline estimate to account for climate change are: 7.8% for transport, 0.4% for energy, and 1.9% each for water and sanitation.
Figure 15 shows that investment need (as a percentage of estimated GDP under three growth scenarios) ranges from 8.14 to 9.23% for baseline estimates and from 8.66% to 9.85 for climate adjusted estimates.
Figures 16 and 17 present the result of the total investment need under different growth scenarios. The estimated total investment need ranges from USD 29.72 billion to 45.25 billion in the baseline estimates and from USD 31.61 billion to 48.34 billion in the climate-adjusted estimates. Among the priority sectors, the largest need is in the transport (USD 22 billion to 41 billion) followed by sanitation.
The investment need in the transport is around ten times higher than that in other sectors. For water and sanitation, the need does not vary under different growth scenarios as the indicator is a percentage of population with access to water and sanitation and the current value is close to 90%.
According to the ADB (2017) estimate, the largest investment need remains in the energy sector followed by the transport sector. There is a certain difference between the estimate of this study and the ADB estimate. The ADB estimate for transport includes roads, railways,
Investment need (as a percentage
of estimated gdP under three
growth scenarios) ranges from 8.14
to 9.23% for baseline estimates
and from 8.66% to 9.85 for
climate adjusted estimates.
Figure 15. Investment need as percentage of estimated GDP with and without climate change adjustment
Highly Optimistic Growth (10%)
9.85 9.318.71 8.66
8.149.23
Optimistic Growth (7.5%)
Normal Growth (5%)
12
10
8
6
4
2
0
With climate change adjustment Without climate change adjustment
Source: Author’s estimation.

N e p a l I N f r a s t r u c t u r e 2 0 3 0 : I n v e s t m e n t a n d F I n a n c I n g n e e d s
33
airports, and sea ports whereas this study only includes roads. The ADB study also covers the communication sector, which this study does not.
In general, it is estimated that 1% of GDP growth requires investment of at least 1% of GDP in infrastructure (Bhattacharya, 2010). Yepes (2008) estimates that a low-income country should invest 7% of GDP in infrastructure and 5.5% in maintenance, totaling to 12.5% of GDP on infrastructure.33 Andres et al. (2014) also estimate that Nepal needs to invest 8 to 12% of GDP34 in infrastructure. The overall top-down estimate of investment need (as % of GDP) is within the range, which is 8.14% to 9.85% of the estimated GDP.
4.2. Bottom-up metHodIdeally, the bottom-up method estimates the need of investment in the selected infrastructure sectors on the basis for demand for relevant end-use services. For example, the level of lighting, heating, cooling and cooking needs
would be included in estimating the electricity supply capacity requirements; similarly, the transport infrastructure requirements would consider the level of mobility needed by people in terms of passenger-kilometer travel and need for transport of goods in freight-kilometers). Thus unlike in the top-down method, the need for infrastructure facilities in the bottom up method is derived on the basis of the demand for relevant end use services. In doing so, the bottom-up method would normally consider the appropriateness of different technology options, e.g., different modes of transport (road, rail, water and air transport) and vehicular options for providing the transport services. The bottom-up method can also consider more explicitly the variations in quality aspects of infrastructures as well as the effects of geographical variations.
The bottom-up method in this study estimates the investment needs by considering ongoing projects, projects in the pipeline, and projects required to meet the international target (i.e., SDGs).
Bottom-up method to estimate investment needs considers: ongoing projects, projects in the pipeline, sector development plans and strategies, and government and international targets to be met by 2030.
33. This number estimated using macro-economic model linking per capita income growth to demand for infrastructure services.34. Infrastructure investment need in the study estimated from 2010-2020.
Figure 16: Investment needs in priority sectors without climate change adjustment (in USD billion 2010 prices)
transport
2.63 2.63 2.63 2.87 2.78 2.75
Water sanitation
40
35
30
25
20
15
10
0energy
1.52 1.65 1.79
22.76
29.86
38.09
Normal Growth (5%) Optimistic Growth (7.5%) Highly Optimistic Growth (10%)
Source: Author’s estimation.

N e p a l I N f r a s t r u c t u r e 2 0 3 0 : I n v e s t m e n t a n d F I n a n c I n g n e e d s
34
Not all projects and their costs have been taken into account in the estimation exercise due to time, data, and budgetary constraints. Table 8 summarizes the projects and targets considered for each priority sector.
EnergyInvestment needs in the energy sector are estimated considering energy demand for meeting universal energy access targets as a part of SDG, completing ongoing projects
Table 8: Summary of factors considered for bottom-up estimation of investment needs
sectOrs prOJects aND tarGets cONsiDereD
energy
n Meeting universal energy access target as a part of sDG: 13,000 MW
n completing identified projects in the pipeline: 15,000 MW
n Meeting the maximum demand of electricity forecast for 2030 by the Water and energy commission secretariat (Wecs): 18,000 MW
transport
n Giving continuity to current programs
n projections based on sDG targets
n upscaling investment to achieve economic growth and prosperity
n climate proofing
Water and sanitationn estimation based on cost per capita for programs in water and sanitation
projects based on the sector Development plan (sDp) and sDG
n climate resilience and social development factors
urban development
n estimates on needs based on the estimates of town Development fund (tDf) which are based on the National urban Development strategy (NuDs)
n considers four scenarios: meeting 100%, 90%, 75%, and 60% of infrastructure needs of NuDs by 2030
n Baseline and climate change-adjusted estimates
the bottom-up method in energy
sector considers meeting targets
of 13,000 mW, 15000 mW and
18,000 mW with different mixes of
RoR and storage hydropower
projects.
Figure 17: Investment needs in priority sectors with climate change adjustment (in USD billion 2010 prices)
2.68 2.68 2.68 2.87 2.78 2.8
Water sanitation
45
40
35
30
25
20
15
10
0energy
1.52 1.66 1.79
transport
24.54
32.19
41.06
Normal Growth (5%) Optimistic Growth (7.5%) Highly Optimistic Growth (10%)
Source: Author’s estimation.

N e p a l I N f r a s t r u c t u r e 2 0 3 0 : I n v e s t m e n t a n d F I n a n c I n g n e e d s
35
and projects in the pipeline, and meeting the maximum demand for electricity forecast by the Water and Energy Commission Secretariat (WECS).
Meeting universal energy access targets: The present level of electricity supply in Nepal is 4631.5 GWh (NEA, 2016). Nepal needs around 19,000 to 38,000 GWh of electricity to meet the basic needs in cooking and lightning by 2030. Whereas the country needs 62,240 GWh to fulfill the needs of modernizing society by 2030, it is more than 13 times the current level of energy supply, implying 10,000 MW to 13,000 MW would be needed to meets universal energy access targets. The study considers the maximum of this range to estimate the investment needs.
Generation projects: The Department of Electricity Development (DoED) has granted survey licenses to projects with accumulative capacity of 12,421.44 MW and construction licenses to projects with a total capacity of 3,892.629 MW (DoED 2017). Additionally, there are projects with a total capacity of generating 3,090.62 MW under different stages in construction, comprising 1,047.10 MW (11 projects) under NEA and 2,043.62 MW (102 projects) under IPPs. This apart, 60 projects have been planned and proposed with a total capacity of 3,680.51 MW out of which 51 (910.51 MW) belong to IPPs for which financial closure is awaited. NEA has planned and proposed nine projects for future development. Additionally, 19 hydropower projects belonging to IPPs with a total capacity of 83.8 MW have been terminated due to various reasons, one being inability to manage financing, even if the projects are technically feasible.
Additionally, 163 projects (10,363.25 MW) reserved by the government as of December 22, 2017 (DoED, 2017) are in different stages but are yet to advance:
• 110GoNbasketprojectswithcapacityof3,240.54 MW.
• 5GoN studiedprojectswith capacity of1,294.02 MW.
• 48GoNunderstudyprojectswithcapacityof 5,828.69 MW.
Besides these, IBN has signed power development agreements (PDA) for the development of the Upper Karnali Hydroelectric Project (900 MW) and Arun Hydroelectric Project (900 MW) in addition to three other hydropower projects for FDI (IBN, 2017).
This method considers the scenario of 15,000 MW if all identified projects in the pipeline are to be completed by 2030.
Transmission projects: DoED has issued 88 survey licenses (more than 1500 km) and 90 construction licenses for the construction of transmission lines as of December 22, 2017 (NEA, 2017). NEA and IPPs hold these licenses. Some of the transmission projects have either been completed or are under construction by the NEA. A USD 540 million South Asia Sub-regional Economic Cooperation (SASEC) Power System Expansion Project (under ADB financial assistance) is developing transmission line projects in the major transmission corridors. The Office of Millennium Challenge Corporation (MCC) Nepal (under the US Government Grant Assistance) has, moreover, planned to execute the Mid-hill 400 KV transmission line network, on which the GoN and MCC have signed a USD 500 million compact agreement. There are seven sub-station improvement projects and 28 transmission line projects with different voltage levels with the NEA. Additionally, the following projects have been planned by the NEA for future construction.
At present, about 3.06 million households are connected to the grid and around one million households are electrified from off-grid systems. To electrify the additional households investment of USD 772 to 967 million (average USD 870 million) would be needed by 2030 (Author’s Calculation, See Annex table A 5.4). To this end, NEA has identified pipelines of transmission lines and substation

N e p a l I N f r a s t r u c t u r e 2 0 3 0 : I n v e s t m e n t a n d F I n a n c I n g n e e d s
36
projects (see Table 9). Based on the available unit cost estimation, USD 651.25 million for transmission lines and USD 676.85 million for substation projects will be required, totaling to USD 1.33 billion. Based on NEA transmission and substation projects, these requirements may be on the lower side, considering the total national requirements.
Distribution of projects: Nepal has around 5.4 million households. Depending on various growth scenarios, the population will reach somewhere between 31.5 and 34.7 million in around 7 million households by 2030 (UN, 2017). According to the government plan, 25% of this population will be connected to renewable energy (hydropower and other off-grid systems) and the remaining 75% to the grid. Around 5.25 million households thus need to be connected to the grid.
Projection of demand by WECS: WECS has projected electricity demand on the basis of various GDP growth scenarios (4.5%, 7.2%, and 9.2%) for 2015, 2020, 2025, and 2030.
This study considers the maximum forecast of demand by 2030, which is 18,000 MW (WECS, 2017).
Thus, considering the various scenarios (universal energy access, projects in the pipeline, and demand forecast by WECS) of energy demand, the investment needs are estimates based on meeting the targets of 13,000 MW, 15,000 MW, and 18,000 MW by 2030. Table 10 shows the total figure for needs by 2030 to achieve the above mentioned capacity of electricity under different mixes of the run-of-the river and storage plants. These costs also include the figures required for transmission lines and electricity distribution (grid and off-grid) to meet the SDG target of reaching 99% electrification. The need for the period 2019-2030, ranges from USD 22 billion to USD 36 billion. For details on per unit cost of grid and off-grid electrification, hydropower projects, and transmission lines, see Annex A5. This estimate is close to the other estimates. According to the government estimate, it requires USD 20.2 billion to
Table 9: Planned and proposed transmission projects
cateGOries capacity (Kv) NuMBer Of prOJect leNGtH (cKM)
substation
up to 400
up to 220
up to 132
5
18
21
-
-
-
transmission line
400
220
132
4
2
9
1.580
240
846
Source: (NEA, 2017).
Table 10: Investment required for electricity generation, transmission, and distribution, 2019-2030 ( USD billion)
aNticipateD GeNeratiON
capacity (MW)35
rOr 60%, stOraGe 40%
rOr 70%, stOraGe 30% rOr 75%, stOraGe 25%
13,000 23.63 22.60 22.09
15,000 28.88 27.63 27.00
18,000 36.76 35.16 34.37
Source: Author’s estimation.
35. Please note that 4,000 MW will have already been completed or on-going construction for which financial closure has already made secured. It means for reaching 13,000 MW, investment will be needed only for 9,000 MW and so on.

N e p a l I N f r a s t r u c t u r e 2 0 3 0 : I n v e s t m e n t a n d F I n a n c I n g n e e d s
37
construct 11,396 MW from 180 hydropower projects (including public and private) in the pipeline (GoN, 2017). International Finance Corporation (IFC) estimates that USD 22.5 billion will be needed between 2018 and 2030 to achieve the generation capacity of 12,000 MW (IFC, 2017).
Nepal can have around USD 1 billion annually to invest in hydropower from major institutional sources. The major sources include the government, banks and finance companies, Employee Provident Fund (EPF), and Citizen Investment Trust (CIT). The total government budget for electricity was less than USD 0.7 billion in 2016/17.
The banking sector is, so far, investing a maximum of 3% of its total lending in electricity, gas, and water which amounted to USD 387 million in 2015. The EPF Fund is also investing around USD 250 million per year in hydropower. While the CIT has not yet invested much in hydropower as per its strategic business plan, it intends to increase its investment from USD 12 million in 2015 to USD 72 million in 2019. If these institutions increase their investment by 5% annually, around USD 17.7 billion will be available for investment in the sector. In such a case, the investment gap would be: a) USD 4.39 billion to 5.93 billion to reach the 13,000 MW target; b) USD 9.3 billion to 11.18 billion to reach the 15,000 MW target; and c) USD 16.67 billion to 19.06 billion to reach the 18,000 MW target. The gaps differ for different mixes of run-of-the river and storage projects. Table 11 provides details of these gaps.
There may not be significant incremental investment requirements to address impacts on climate change if these are addressed as a part of design practices and long-term planning processes. The level of investment shall differ for different mixes of the run-of-the-river and storage plants. Furthermore, adoption of demand-side management practices and energy efficiency helps in saving investments in the long term. Incremental investments in such cases may not be needed to add to the existing costs to address the climate change impact.
TransportTo estimate the investment needs in transport, three scenarios have been considered. The first one gives continuity to the current road program. The other one is based on the SDG targets. The third scenario up-scales investment to meet the upcoming challenges of economic growth and prosperity. It is an outcome of extensive discussion on future demands in transport and services delivery.
The construction and upgrading cost used to estimate financing need is based on the average estimated cost of construction of new fair-weather roads in 2017. In estimating the cost, the following rates from different project sources have been considered: a) terrain condition: mountainous, hills, and Tarai; b) the estimated cost of Kathmandu – Fast Track; c) the contract cost of Narayanghat – Mugling Highway Improvement Project; and d) the average estimated cost of Narayanghat – Butwal Highway Widening Project. Estimation of the investment need in the transport sector mainly focuses on road-transport and excludes the cost
Table 11: Investment gaps in energy sector, 2019-2030 (USD billion)
aNticipateD GeNeratiON
capacity (MW)
rOr 60%, stOraGe 40%
rOr 70%, stOraGe 30% rOr 75%, stOraGe 25%
13,000 5.93 4.9 4.39
15,000 11.18 9.93 9.3
18,000 19.06 17.46 16.67Source: Author’s estimation.
sdg has projected an additional construction of 120,000 km by 2030 to meet the transport requirement for nepal’s socioeconomic needs.

N e p a l I N f r a s t r u c t u r e 2 0 3 0 : I n v e s t m e n t a n d F I n a n c I n g n e e d s
38
of projects envisioned such as the ‘Kathmandu-Tarai Fast Track’ and ‘Second International Airport’. The estimation also excludes air transport and other modes of transport such as railways and ropeways.
Giving continuity to the current road program: The current road program36 focuses on: a) upgrading the East-West Highway and other selected highways to four-lane standards; b) opening and upgrading Mid-Hill Highway; c) upgrading Tarai Hulaki Marg and associated north-south link roads; d) widening of roads to district HQs; e) track opening of north-south link roads to the northern border, etc. These programs are part of the ‘Strategic Plan’ for Strategic Road Network approved by the government in FY 2015/16. The strategic plan has envisaged an expenditure of NPR 620 billion (USD 6.2 billion) in five years. In line with the strategic plan, the transport sector needs around NPR 124 billion (USD 1.24 billion) annually.
In addition, LRN needs can be identified by gradually increasing the road stock that is operational round the year. There are around 29,000 km37 of District Road Core Network (DRCN) which urgently needs major investment to upgrade it to a serviceable and all-weather condition.
Projecting resource demand based on SDG target: The SDG has projected an additional construction of 120,000 km by 2030 to match the transport requirement for Nepal’s socio- economic need. In addition, it also projects around 25,000 km of roads to be upgraded to all-weather standards. Based on the country’s population of 2018, the target of providing 1 km of road to 133 people looks highly ambitious and unrealistic.
If road extension continues without proper attention to the upkeep of roads, it could lead to a rise in demand for rehabilitation or reconstruction at four-to-ten fold38 the cost of maintaining the roads. In meeting the SDG targets, the standards adopted play a key role
in deciding the total resource demand. If the roads are to be built and upgraded to the DRCN standards, the government will have to spend a minimum of NPR 440 billion39 (USD 4.40 billion) per year till 2030.
Upscaling investment to meet the challenge of economic growth and prosperity: The third scenario in road development and management is an outcome of extensive discussions of future demands in transport and service delivery.
Estimate on investment gaps is based on the availability of funds determined by the current trend of funding and budget allocation. Over the last 5 years, a significant amount (exceeding NPR 60 billion) has been pledged for contracts. This is in addition to the fiscal allocation to the transport sector. The government is finding it difficult to mobilize additional resources to the tune of NPR 60 billion (0.6 billion USD). Table 12 summarizes the investment needs and gaps in the transport sector. A majority of investment gaps in the transport sector lie in meeting the SDGs and upscaling investment need. From the investment requirement estimated, it is evident that the total required investment is USD 84.88 billion, of which the fund available is USD 36 billion. This is enough to fully finance only the current program and partially cover the SDGs and up-scaling of road infrastructure to meet the economic growth desired. Details of the estimation are presented in Annex A6.
Water and sanitationThe bottom-up estimates of investment needs for water and sanitation infrastructure are based on meeting the Sector Development Plan (SDP) and SDG targets by 2030. The estimation is based on the cost per capita for various interventions in water and sanitation projects. Water and sanitation components include safe piped water supply system, waste water with treatment system, industrial waste water treatment, and public toilet and drainage system. The percentages of population to be covered are subdivided into urban municipalities
the bottom-up estimate
on investment needs for water
and sanitation infrastructure are based on meeting
the sector development Plan
and sdg targets by 2030.
36. As outlined in Strategic Plan of MoPIT, 2073 (or 2015/16).37. DoLIDAR estimates.38. Various past studies have concluded that the cost of rehabilitation/reconstruction is four to ten times the cost of maintenance.39. The construction and upgrading cost is based on the average estimated cost of new construction of fair-weather roads in 2017.

N e p a l I N f r a s t r u c t u r e 2 0 3 0 : I n v e s t m e n t a n d F I n a n c I n g n e e d s
39
and rural municipalities. The total population is assumed to be 60% spread out in urban areas and 40% in rural areas by 2030.
The water supply target has been sub-divided into limited (partially protected source, no disinfection, partial supply in some vulnerable areas), basic (piped to premises, 65 lpcd, intermittent and meeting the National Drinking Water Quality Standards (NDWQS)), and improved (internally plumbed, 100 lpcd, continuous and meeting NDWQS) facilities.
The wastewater system is subdivided into onsite, onsite with septage treatment, and sewered with primary and secondary treatment. The industrial wastewater treatment requirement is based upon the assumption that about 100 units will be covered by 2030. The public toilet (one unit for a population of 5,000) coverage is assumed to be 60% and 20% of the population in urban and rural areas respectively and drainage in low-lying areas with 20% and
10% coverage of population in urban and rural municipalities respectively. Estimates on investment needs in USD are based on per capita per unit cost. There are climate-resilient as well as social development factors to be taken into account. In this study, cost increments of 10% for climate resiliency and 5% for social development a year were assumed. Table 13 presents the investment needs and gaps by 2030, calculated accounting for climate proofing and social development cost per year. Cumulative costs for 2020, 2025, and 2030 are depicted in the subsequent columns in the table which also presents the available fund based upon GoN funding trend and gap in funding. The details of estimation are presented in Annex A7.
Figure 18 shows the investment need of USD 31.8 billion by 2030 and investment gap of USD 11.72 billion based on the estimated investment requirement and funding available through government’s budget.
Table 12: Summary of investment needs and gaps in transport sector, 2019-2030 ( USD billion)
prOJects aND tarGets
iNvestMeNt reQuireD availaBility Of fuND40 Gap
WitHOut cliMate
prOOfiNG
WitH cliMate
prOOfiNG
WitHOut cliMate
prOOfiNG
WitH cliMate
prOOfiNG
WitHOut cliMate
prOOfiNG
WitH cliMate prOOfiNG
Giving continuity to the current program41
12 - 12 - -
resource demand based on sDG target
48 51.22 12 12.80 36 38.41
upscaling investment to meet the upcoming challenges in economic growth. 5.24% of GDp at 5% growth, 5.12% of GDp at 7.5% growth, and 3.55% of GDp at 10% growth)
24.88 26.55 12 12.80 12.88 13.74
Source: Author’s estimation.
40. Availability based on current trend of funding.41. The annual budget based on current trend of budget allocation.

N e p a l I N f r a s t r u c t u r e 2 0 3 0 : I n v e s t m e n t a n d F I n a n c I n g n e e d s
40
the lack of infrastructure impedes economic growth and improvement of the country’s living standard. the lack of infrastructure in Nepal is a severe challenge. infrastructure itself cannot become a goal. the goal should be development of infrastructure to empower the country. there is now growing awareness of the need of quality infrastructure investment to achieve development goals of the country. But what does quality infrastructure investment entail?
it is important to remember that infrastructure has to be easy to use, safe, disaster-resilient, and of high quality as well as in harmony with the local environment, community, and local livelihood. in the course of designing and planning, it is important, moreover, in the course of future construction and maintenance work to ensure that infrastructure is cost-effective and generates local employment and facilitates technology transfer apart from complying with high quality international standards and rules. all of this must be done from the planning stage. it is also necessary to utilize private sector funding and
know how. Quality infrastructure investment takes all of these factors into account.
Quality infrastructure may be costly in the beginning, but yields benefits in the long run. the benefit of quality infrastructure can be economic efficiency, convience and comfort, sustainability, safety and disaster resilent.
economic efficiency: efficiency and durability reduce environmental burden and social costs (for example, through an effective design that requires little land expropriation);
convenience and comfort: service reliability and compatibility with customers reduce user burden (e.g., traffic congestion), and enhance ease in operation and maintenance work;
safety and resilience against natural disasters.
Source: White paper on development cooperation (2015), MoFA, ODA, Tokyo, Japan.
Box 7 INvestmeNt IN QualItY INFrastructure
Urban developmentThe estimate for investment needs for urban infrastructure is based on figure available from the Town Development Fund (TDF) (2016).
An earlier draft of NUDS (2017) calculated infrastructure investment needs for the erstwhile 58 municipalities and the newly-declared 72 municipalities for a period up to 2030/31. TDF (2016) has updated estimates to cover the newly-declared municipalities, totaling to 217. However, the number of municipalities has now reached 293 where about two-thirds of the total population now live. Arguably, municipal population is an imperfect proxy indicator for the level of urbanization, particularly in Nepal’s context where most municipalities are predominantly rural in character. However, for this study, we assume that all municipalities are properly urbanized in due course of time so that municipal populations can truly represent the level of urbanization. It is also expected that there will be no dramatic change in the number of municipalities in the near future.
In this study, the infrastructure investment needs estimated by TDF (2016) have been reworked to cover all the 293 municipalities. Two sets of estimates are generated: (1) baseline estimates and (2) climate-adjusted estimates to incorporate the effects of climate change.
Figure 18: Investment needs and gaps in water and sanitation sector (USD billion)
2020
3.93 1.83
2.11
13.22
31.9
20.13
7.07 6.15
11.7
2025 2030
35
30
25
20
15
10
5
0
* Based upon the yearly allocation of budget for the water sector by GoN
requirement projected availability* Gap
Source: Author’s estimation.

N e p a l I N f r a s t r u c t u r e 2 0 3 0 : I n v e s t m e n t a n d F I n a n c I n g n e e d s
41
Some of the original steps followed by TDF (2016), relevant to this study, are summarized below:
1. The indicators and targets for the desired level of infrastructure to be achieved by 2030/31 are shown in Table 14.
2. Four scenarios, namely, meeting 100%, 90%, 75%, or 60% of infrastructure needs by target year, have been considered.
3. Estimates have been made with 2015/16 as the baseline year.
4. Net infrastructure financing requirement is estimated by deducting investments to be made through municipal revenue, intergovernmental fiscal transfer (IGFT), and market borrowing.
Following the aforementioned steps, this study makes the following modifications:• Investment needs from 2018/19 are
considered based on the 2015/16 prices.• The projections made for the old 58
municipalities are adopted from TDF (2016), but the projections for other 235 municipalities have been reworked on the basis of population.
The baseline estimates are adjusted by adding the costs of climate mitigation (for instance, for more efficient and cleaner power generation and electricity transmission) and adaptation (in particular, for “climate proofing”, by making
infrastructure more resilient to the climate change impacts).
Taking reference of estimates in ADB (2017) for South Asia, the baseline estimates have been adjusted by a multiplication factor of 1.159 (or additional 15.9%) to adjust for climate change, which includes climate mitigation and climate proofing costs, but excludes other adaptation costs not applicable to Nepal, especially those associated with sea level rise.
Without adjusting for climate change the total infrastructure investment needs for the period 2018/19–2030/31 are estimated to be 66.75 to 75.84 billion USD, if 100% of the targets presented in Table 14 are to be met by 2030/31 (see Table 15). This figure includes the costs for unleashing local and regional development potential, including specialized infrastructure needs for provincial capitals (25–35%) and costs for project preparation, implementation/ management safeguards, institutional development, building community resilience, and land provisioning and rehabilitation support (22–32%). Following TDF (2016), it is expected that 32% of the investment will be met through municipal revenue, IGFT, and market borrowing. The net investment needs then turn out to be USD 45.39 to 51.57 billion. The PPP contribution is expected to be worth USD 1.36-1.55 billion (or USD 104.6
Table 13: Investment required and gaps in water and sanitation sector, 2019- 2030 (USD billion)
s. N. iNfrastructure 2020 2025 2030
1 safe piped water supply system 2.388 8.029 19.374
2 Wastewater with treatment system 1.289 4.333 10.457
3 industrial wastewater treatment 0.004 0.015 0.036
4 public toilet 0.013 0.044 0.105
5 Drainage system 0.237 0.797 1.925
total 3.932 13.219 31.898
availability of Funding 1.83 7.07 20.13
gap in Funding 2.11 6.15 11.77Source: Author’s estimation.
the total infrastructure investment need in urban development for the period 2018/19–2030/31 is estimated to be 66.75 to 75.84 billion Usd (baseline estimate), if 100% of the nUds targets are to be met by 2030/31

N e p a l I N f r a s t r u c t u r e 2 0 3 0 : I n v e s t m e n t a n d F I n a n c I n g n e e d s
42
Table 14: Urban development indicators and targets to be achieved by 2030/31
s. N. iNDicatOrs tarGets
1 road density (new roads and upgrading)
Minimum 7.5 km per sq km (old 58 municipalities) and 5 km per sq km (new municipalities)
2 piped water supply coverage 80% of urban households with 100 liters per capita per day supply
3 toilet facilities connected with sewerage system 100% of urban households
4 road length covered by storm drainage Minimum 60% (minimum 20% in core areas)
5 electricity connection 100% of urban households
landfill sites 100% of municipalities
Source: Based on MoUD (2017).
-119.2 million per annum) for PPP projects in the urban infrastructure sector.
Table 15 also includes estimates for other scenarios whereby 60%, 75%, and 90% of the targets would be met. Climate change-adjusted estimates are also presented in the table. Accordingly, the net investment needs inclusive of climate change-adjustment would be USD 52.61-59.77 billion, out of which PPP projects could cost USD 1.58-79 billion at an assumed share of 3%.
4.3. summarY oF INvestmeNt Needs From tWo metHodsThis section recapitulates estimated investment needs in the four priority sectors. The investment need based on the two methods is vastly different, one reason being, the different level of infrastructure stocks considered. In the top-down method, the infrastructure stock is predicted under three GDP growth scenarios from 2019 to 2030. The stock is then converted into monetary value to get the need. In the bottom-up method, the cost of implementing various ongoing and upcoming projects in each sector are considered (see Table 16). The stock of infrastructure considered in the bottom-up method is significantly higher and accounts for quality, level of services, mixes of RoR, storage projects, etc.
For example: in water and sanitation sector, the infrastructure variable considered in the top-down method includes only the percentage of population with access to water whereas in the bottom-up method considers the identified projects for safe piped water supply system, waste water treatment system, industrial wastewater treatment etc.
The bottom-up method also considers projects to meet SDG targets in the respective sectors. The infrastructure stock needed to meet SDG targets are significantly higher than the infrastructure stock estimated to meet GDP growth targets by 2030. The preliminary estimate of need made by the National Planning Commission for 2016-2030 to meet SDGs is NPR 1770 (USD 17.70) billion annually (NPC, 2017b), which is close to annual (assuming equal annual investment need over the period) investment need estimated from the bottom-up method, which is USD 16.55-20.55 billion.
Details for estimated investment needs and level of infrastructure stock by 2030 for both methods are presented in Table 16.
The substantial difference in the results of the two methods in terms of investment requirements also reflects fundamental differences between the two methods. More specifically, the differences in the results are due to the way bottom-up methods has been used in the study. The bottom-up method
the investment gap in each
priority sector (2019-2030) is
high relative to the gdP
and budget of the country.
Investment gap in the transport
is 48.88 billion and in urban
development is 51.57 billion
(maximum gap in range). In water
and sanitation, the gap is Usd 11.77
billion and in energy Usd 19.06 billion (maximum
gap in range).

N e p a l I N f r a s t r u c t u r e 2 0 3 0 : I n v e s t m e n t a n d F I n a n c I n g n e e d s
43
in the present study has considered the inventory of various kinds of projects (existing projects, projects in the pipeline as well as the perspective projects identified by different government agencies, and projects to meet international targets). However, it is uncertain whether all these projects represent the real needs for socio-economic development of the country or reflect sectoral development aspirations in a longer term (i.e., beyond 2030). It is also uncertain whether all the identified projects satisfy the criteria of economic efficiency, financial viability and sustainability.
As stated earlier the top-down method is based on some macroeconomic variables and broad sector specific indicators. Thus the data requirements in the top-down method are
relatively less challenging than in the bottom-up method. The top-down method can therefore be more conveniently applied to compare the investment needs for infrastructure across different countries as there is much uniformity in the types of the variables considered. The top-down method has been used by multilateral funding agencies (e.g., ADB) to assess the investment needs for infrastructure in the case of Asian developing countries.
4.4. INvestmeNt gap Is sIgNIFIcaNt: WHat Is Next?The investment gap for the period of 2019-2030 was calculated by taking into account the estimated infrastructure investment need and
Table 15: Investment needs and gaps in urban development (2018/19 - 2030/31) (USD billion)
particulars pHysical tarGet
100% 90% 75% 60%
(1) Without adjustment in climate change
Desired level of selected infrastructure# 45.41 40.87 34.06 27.24
unleashing local and regional development potential including specialized infrastructure needs for provincial capitals (25-35%)*
11.35 to 15.89
10.22 to 14.30
8.51 to 11.92
6.81 to 9.54
project preparation, implementation/ management safeguards, institutional development, building community resilience, and land provisioning and rehabilitation support (22-32%)*
9.99 to 14.53
8.99 to 13.08
7.49 to 10.90
5.99 to 8.72
total financing needs 66.75 to 75.84
60.07 to 68.25
50.06 to 56.87
40.05 to 45.50
financing to be met through municipal revenue, iGft, and market borrowing* 32% 41% 53% 61%
Net financing needs 68% 59% 47% 39%
Net financing needs 45.39 to 51.57
35.44 to 40.27
23.53 to 26.73
15.62 to 17.74
(2) With adjustment in climate change (additional 15.9% cost)
total financing needs 77.36 to 87.90
69.62 to 79.1
58.02 to 65.91
46.42 to 52.73
Net financing needs 52.61 to 59.77
41.08 to 46.67
27.27 to 30.98
18.10 to 20.57
Note: All figures are in billion USD unless otherwise mentioned. # See Table 14.* Based on TDF (2016) with some adjustment. Source: Author’s estimation.

N e p a l I N f r a s t r u c t u r e 2 0 3 0 : I n v e s t m e n t a n d F I n a n c I n g n e e d s
44
Table 16: Summary of investment needs and infrastructure stocks from two approaches (USD billion)
sectOrs estiMate frOM
tOp-DOWN MetHOD
estiMateD iNfrastructure stOcK uNDer tHree GDp
GrOWtH sceNariOs
estiMate frOM
BOttOM-up MetHOD
prOJect cONsiDereD iN BOttOM-up MetHOD
energy 1.52-1.79 0.44,0.47 and 0.51 Kw of electricity generated per capita
23-36 Bottom-up estimation considers achieving 13000, 15,000, and 18,000 MW with combination of ror and storage projects
transport 22.76-41.06 381.1, 455, and 542 km per 1000 sq km of land area
84.88 primarily considers road upgrading, expansion, and construction projects. construction of additional 120,000 km of road by 2030 to meet the sDGs.
Water and
sanitation
5.45-5.55 100% of population with access to water and 45.8% of population with access to sanitation
31.89 Based on targets of sDGs and sector Development plan
urban
Development
N/a N/a 40.05-75.84 Bottom-up estimation considers achieving 60, 75, 90, and 100 % of targets set by NuDs
projection of available funds for investment in infrastructure by 2030. Most of the source of fund for investment is public investment through capital expenditure allocation in the priority sectors. For energy, there are also other sources of funding such as Employee Provident Fund, Citizen Investment Trust, BFI’s, and investment from the private sectors. For other sectors, the government is the major source of financing.
The investment gap in each priority sector (2019-2030) is high relative to the GDP and budget of the country. Investment gap in the transport is 48.88 billion and in urban development is 51.57 billion (maximum gap in range). In water and sanitation, the gap is USD 11.77 billion and in energy USD 19.06 billion (maximum gap in range). A detailed summary of the gaps is given in Table 17.
To put the investment needs in Nepal’s context, with the country’s GDP at NPR 34643 billion (34 USD billion) (nominal GDP), one can take an example of the investment gap in the transport sector which is USD 48.8 billion. If
that gap is to be filled equally over eleven years, the additional fund required in addition to current and projected budget allocation in the transport sector comes to USD 4.43 billion annually. The current budget (FY 2018/19) is NPR 1315 billion (USD 13.15 billion) of which capital expenditure is NPR 313 billion (USD 3.13 billion). The budget set aside for the transport sector is USD 1.09 billion (MoF, 2018).
The component of loan and grant is USD 3.1 billion which is 22% of the budget in FY 2018/19 (MoF, 2018). If the estimated investment gap is to be filled by the government through public expenditure, it can only be done with additional borrowing, since increasing the revenue to boost-up economic growth to fill the gap or reducing expenditure in other categories is not a viable option. Increasing fiscal deficit raises the ratio of debt to GDP which in 2017 was 26.8, projected by the World Bank to rise to 34.4% in 2019 and to 37.6% in 2020.42 Additional debt impacts the economy in a negative way. High borrowing leads to high debt and hinders capital accumulation and growth.
42. https://kathmandupost.ekantipur.com/news/2018-04-19/wb-warns-of-alarming-rise-in-debt-to-gdp-ratio.html
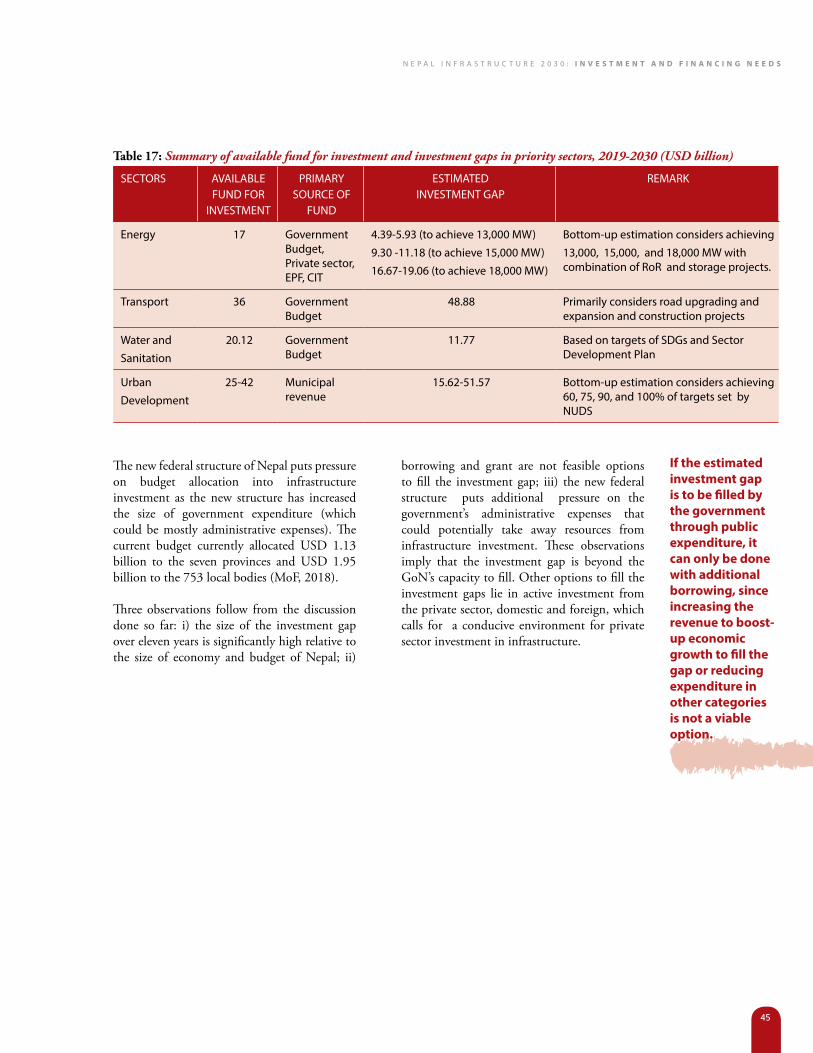
N e p a l I N f r a s t r u c t u r e 2 0 3 0 : I n v e s t m e n t a n d F I n a n c I n g n e e d s
45
Table 17: Summary of available fund for investment and investment gaps in priority sectors, 2019-2030 (USD billion)
sectOrs availaBle fuND fOr
iNvestMeNt
priMary sOurce Of
fuND
estiMateDiNvestMeNt Gap
reMarK
energy 17 Government Budget, private sector, epf, cit
4.39-5.93 (to achieve 13,000 MW)
9.30 -11.18 (to achieve 15,000 MW)
16.67-19.06 (to achieve 18,000 MW)
Bottom-up estimation considers achieving
13,000, 15,000, and 18,000 MW with combination of ror and storage projects.
transport 36 Government Budget
48.88 primarily considers road upgrading and expansion and construction projects
Water and
sanitation
20.12 Government Budget
11.77 Based on targets of sDGs and sector Development plan
urban
Development
25-42 Municipal revenue
15.62-51.57 Bottom-up estimation considers achieving 60, 75, 90, and 100% of targets set by NuDs
The new federal structure of Nepal puts pressure on budget allocation into infrastructure investment as the new structure has increased the size of government expenditure (which could be mostly administrative expenses). The current budget currently allocated USD 1.13 billion to the seven provinces and USD 1.95 billion to the 753 local bodies (MoF, 2018).
Three observations follow from the discussion done so far: i) the size of the investment gap over eleven years is significantly high relative to the size of economy and budget of Nepal; ii)
borrowing and grant are not feasible options to fill the investment gap; iii) the new federal structure puts additional pressure on the government’s administrative expenses that could potentially take away resources from infrastructure investment. These observations imply that the investment gap is beyond the GoN’s capacity to fill. Other options to fill the investment gaps lie in active investment from the private sector, domestic and foreign, which calls for a conducive environment for private sector investment in infrastructure.
If the estimated investment gap is to be filled by the government through public expenditure, it can only be done with additional borrowing, since increasing the revenue to boost-up economic growth to fill the gap or reducing expenditure in other categories is not a viable option.

N e p a l I N f r a s t r u c t u r e 2 0 3 0 : I n v e s t m e n t a n d F I n a n c I n g n e e d s
46
role aNd opportuNItIes FortHe prIvate sector
Investment and Financing Needs
N e pa l I N F r a s t r u c t u r e 2 0 3 0

N e p a l I N f r a s t r u c t u r e 2 0 3 0 : I n v e s t m e n t a n d F I n a n c I n g n e e d s
47
The government has always been a major player in constructing, financing, and maintaining infrastructure projects. It makes investments in infrastructures
by allocating budget for capital expenditure in its fiscal administration. The major sources of funding for these investments are the revenue it collects from the public, loans from public or international donor agencies, and aid from different countries. The size of the county’s GDP was a mere NPR 3007 billion (USD 30 billion) in 2017/18 and NPR 34643 billion (USD 34 billion) in 2018/19. The annual budget presented by the government is around half of this43. Likewise, the GoN has been allocating around 30% of the total fiscal outlay under capital expenditure44. Capital expenditure on the priority sectors for FY2016/17, viz. energy, transport, water and sanitation, and urban development are merely 3.27%, 3.12%, 0.87, and 0.28% of GDP respectively45. Further, under-spending of capital expenditure allocation is a recurring problem owing to structural flaws in the process of budget formulation and implementation46. Compared to the role of government, that of the private sector in infrastructure development is limited. During the six years between 2007 and 2012, private sector investment in infrastructure was merely 0.66% of GDP, whereas for India it was 2.57% (Andres et al., 2014).
The estimates on investment needs and gaps running to billions of dollars, the government
alone does not have the capacity to finance. This makes a strong case for the increased active role of the private sector in the country. The government can facilitate the private sector’s role in investing, constructing, and maintaining infrastructure, while itself assuming the role of a regulator for quality control. The following sections highlight in some detail the roles and opportunities in investment for the private sector investors.
5.1. roles aNd opportuNItIes IN tHe eNergY sectorAmong the priority sectors, the private sector today wields a strong presence in the energy sector. According to the estimate, there will be a need of USD 22-36 billion47 investment in energy by 2030. The estimated investment gap is USD 4.39-19.06 billion. This creates an opportune situation for the private sector to step in by upscaling their role from supplying of 324 MW to becoming a major energy supplier.
It is unlikely that the private sector can invest in transmission in the absence of wheeling charge and wheeling mechanisms. However, with unbundling of NEA and formation of the National Transmission Grid Company (NTGC), a separate entity to work for development and operation of transmission lines, the role of private sector looks promising in building transmission lines.
5 Role and Opportunities forthe Private Sector
the government can facilitate the private sector’s role in investing, constructing, and maintaining infrastructure, while itself assuming a role of a regulator for quality control.
43. Budget of Nepal for Fiscal Year 2018-19 is USD13.15 billion.44. It is worthwhile mentioning that not all of the capital expenditure goes to infrastructure. For example, motor vehicles purchased by
the government is also accounted under the capital expenditure heading.45. Economic Survey (MoF, 2018). 46. Nepal Economic Outlook, 2017-18.47. According to the bottom- up estimate.

N e p a l I N f r a s t r u c t u r e 2 0 3 0 : I n v e s t m e n t a n d F I n a n c I n g n e e d s
48
The new area of investment for the private sector could be action in electricity distribution in which the government can allow and encourage it to invest. But because of the high cost of mini-grid development and low applicable tariff rates in rural areas, it may not be feasible for the private sector to invest in mini-grids.
Additionally, increase in the demand for infrastructure will certainly increase the demand for construction materials. The volume of input materials needed to generate 1 MW of hydroelectricity has been extrapolated from the volume of requirements to build 13,000-18,000 MW of hydropower projects by 2030, presented in Table 18. These figures, however, should be taken as indicative as the real requirements of the construction materials vary significantly from one project to another, contingent on the location, type, size, and design considerations.
5.2. roles aNd opportuNItIes IN tHe traNsport sectorThe transport sector receives one-third of the total capital expenditure allocation. There is a significant contribution of development partners (40%) in the sector. In the coming years, the demand for investment in the sector is expected to increase significantly due to i) equitable demand of provincial and local governments for roles in developing, expanding, and managing transport networks; ii) demand for resources for “National Pride” projects; iii) scaling up of investment by development partners; and iv) the need for meeting the
cost of projects contracted under multi-year48 scheme, but without a credible financing plan.
The investment gap in the sector by the year 2030 has been estimated to be USD 48.88 billion. To fill it, the only viable option for the government is investments from the private sector. Although the scope is limited compared to that in energy, there is still significant scope for the private sector to enter into PPP agreements with the government and/or to finance projects on their own. However, the private sector has a limited role in investment in transport, may be due to uncertainty of generating constant revenue streams.
For example, the idea of toll roads has not taken hold in Nepal, probably due to uncertainty regarding consumers’ willingness to pay. Thus, unlike in energy, private sector involvement is insufficient in transport. Given these constraints, private sector investment can be solicited by providing annuity mode of payment that can be used for all types of transport infrastructures where the recovery of investment is a challenge. The government can offer transport projects to the private sector for investment and the private sector can use the annuity payment modality to recover their investments, generating reasonable profits. This mode of payment will also provide relief to the budgetary pressure to some extent.
Expansion in the transport sector will also create additional demand for construction materials. Construction of roads, bridges, etc. requires substantial account of construction materials, including crushed aggregates,
Table 18: Estimation of construction materials for energy sector, 2019-2030 (in MT*)
cONstructiON Material type
averaGe MaXiMuM MiNiMuM
cement 11,579 19,010 4,614
steel 20,699 80,018 354
sand and stone 44,194 69,439 22,155
explosives 72 160 9* Note: MT = Metric Ton . Source: Authors estimation based on survey (2017) for per megawatt unit material requirements.
Investment gap of Usd 4.39 to 19.06
billion creates an opportune
situation for the private sector to
upscale their role in energy sector.
Private sector can increase their role
in generation, transmission and
distribution.
48. Over the last 5 years significant amount (exceeding NR 60 billion) has been pledged for contracts under multi-year contracts in addition to the fiscal allocation to the transport sector. The government is finding it difficult to in mobilize additional resources to the tune of NR 60 billion.

N e p a l I N f r a s t r u c t u r e 2 0 3 0 : I n v e s t m e n t a n d F I n a n c I n g n e e d s
49
Table 19: Summary of role of private sector engagement in transport sector
s.N. pOteNtial prOpOsal activity
1 constructing a cluster of bridges using latest innovative technology like pre-cast beams, and pre-cast slabs under the single contract.
• facilitating private industry to start developing technology to produce bridge units in a mass scale production
• establishing at least one unit of industry in every province
• promoting use of ready mixed concrete to give quality
2 construction of bypasses on highways to avoid urban municipal boundaries.
• increasing efficiency in the movement of freight and passenger services
• these locations can be identified, and roads can be constructed on the basis of the annuity mode of ppp or toll revenue
3 establishing operating passenger commuter system between a) itahari – rani; b) Dhalkebar – Bhittamod; c) Hetauda – Birgunj; d) Butwal – Bhairahawa; e) Kohalpur – Nepalgunj; f ) atariya – Dhangadi.
• an appropriate mode of transport (based on mass transit) to be identified and infrastructure investment on annuity mode of ppp
• separate operating mechanism can be developed under the revenue sharing model
4 establishing appropriate mode of mass transit system in Kathmandu valley:
• investing in creating appropriate infrastructure for public transport system (example: erecting pole and wiring system for the operation of electric trolley system)
• Operating electric trolley like public transport system running over the infrastructure created
5 financing North-south trade link
• it can be done on an annuity basis
6 upgrading the part of existing network to the economic corridor as discussed in this report
• investment on annuity mode of ppp
7 Maintaining road Network • road maintenance contract on a performance basis; private investors allowed to maintain road network (more appropriate for urban roads)
• payment based on performance indicators
8 Maintaining bridges • Bridge maintenance contract on a performance basis; private investors allowed to maintain road network (more appropriate for urban roads)
• payment based on performance indicators
cement, reinforcement, shuttering materials, concrete, etc. This provides huge opportunity for expansion of industries that supply these
inputs. Table 20 provides an estimate of the materials required in line with the estimated infrastructure investment need.
government can solicit the private sector investment in transport infrastructure using annuity payment modality to fill the investment gap of Usd 48.88 billion.

N e p a l I N f r a s t r u c t u r e 2 0 3 0 : I n v e s t m e n t a n d F I n a n c I n g n e e d s
50
Table 20: Estimation of construction materials for transport sector, 2019-2030 (in MT)
cONstructiON Material type reQuireMeNts fOr 2019 – 2030*
averaGe Minimum Maximum
course aggregates for base 4.5 5.5 6.36
surfacing aggregates for asphalt concrete 5.0 4.0 6.57
steel 120 100 150
cement 1,500 1,000 1,929
Bitumen 300 240 360
*The requirements estimated for construction materials for transport sector are based on: Average 10 m bridge length per km of road length for strategic road network. Estimates of 814 bridges required for DRCN (based on a study carried out by Local Road Bridge Program (LRBP) and quantity calculated using the standard norms in practice. Source: Author’s estimation.
the scaDa system has been piloted in water supply and sanitation sector projects in two small towns – Karaiya Makrahr (rupandehi) and Mukundapur (Nawalparasi). the Karaiya Makrahr is a groundwater-based system while Mukundapur is a combination of both groundwater and gravity systems. there are more than 1,500 household connections in Karaiya and 3,000 in Mukundapur.
advantages• Reducedrequirementofhumanresourcefor
system operation.
• Effectiveinreducingleakages.
• System’spressureandquantityinformationavailable whenever required.
• SuccessfulinreducingNon-RevenueWater(NrW).
• DifferentDMAdemandknownquickly,which improves valve operation as per the requirement.
• Operatordoesnotneedtogotoeachcomponent thus making the operation and supply easy and reliable.
Box 8 scada Improves eFFIcIeNcY oF sYstem operatIoNs
5.3. roles aNd opportuNItIes IN tHe Water aNd saNItatIoN sector
The role of the private sector in the water and sanitation sector is limited in Nepal. Given the estimated investment need of USD 31.89 billion in the sector, an investment gap of USD11.7749 is significant. This opens up huge opportunities and scope for investment by the private sector which can engage itself in providing safe-water services, wastewater management services, chlorine gas production, etc. It can also be a part of supplying innovative technologies and equipment required.
Construction and operation of wastewater systems are generally more complex and expensive than a water supply system. Innovative approaches and operation skills need to be identified to attract investment in the sector. Private sector investment and/or PPPs in high population density areas look promising. However, investment must be backed by sound analysis of risks and returns. Investment requirements are contingent upon the size, population density of towns, economy, and choice of collection and treatment methodologies. Quick costing tools must be applied to understand the level of investment in other towns as well. A ladder approach of onsite systems, DEWAT and fecal sludge management systems with treatment systems, and fully sewered towns are the potential approaches to
49. From bottom-up estimate.
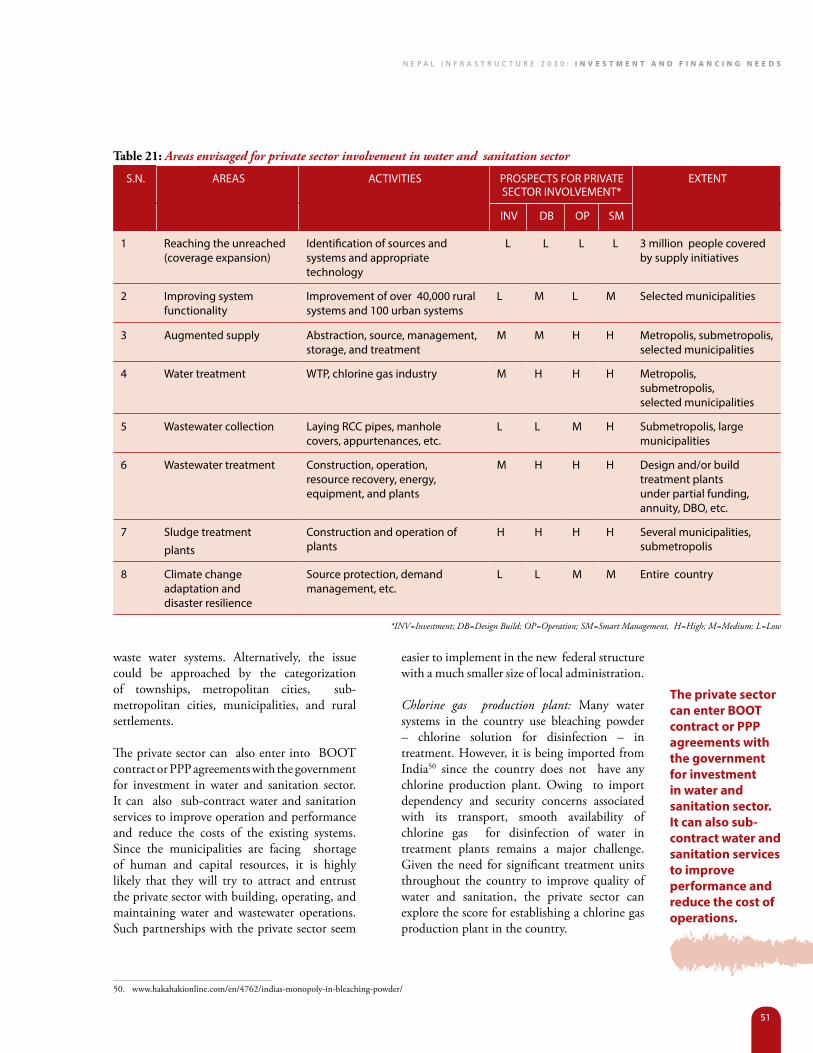
N e p a l I N f r a s t r u c t u r e 2 0 3 0 : I n v e s t m e n t a n d F I n a n c I n g n e e d s
51
waste water systems. Alternatively, the issue could be approached by the categorization of townships, metropolitan cities, sub-metropolitan cities, municipalities, and rural settlements.
The private sector can also enter into BOOT contract or PPP agreements with the government for investment in water and sanitation sector. It can also sub-contract water and sanitation services to improve operation and performance and reduce the costs of the existing systems. Since the municipalities are facing shortage of human and capital resources, it is highly likely that they will try to attract and entrust the private sector with building, operating, and maintaining water and wastewater operations. Such partnerships with the private sector seem
easier to implement in the new federal structure with a much smaller size of local administration.
Chlorine gas production plant: Many water systems in the country use bleaching powder – chlorine solution for disinfection – in treatment. However, it is being imported from India50 since the country does not have any chlorine production plant. Owing to import dependency and security concerns associated with its transport, smooth availability of chlorine gas for disinfection of water in treatment plants remains a major challenge. Given the need for significant treatment units throughout the country to improve quality of water and sanitation, the private sector can explore the score for establishing a chlorine gas production plant in the country.
Table 21: Areas envisaged for private sector involvement in water and sanitation sector
s.N. areas activities prOspects fOr private sectOr iNvOlveMeNt*
eXteNt
iNv DB Op sM
1 reaching the unreached (coverage expansion)
identification of sources and systems and appropriate technology
l l l l 3 million people covered by supply initiatives
2 improving system functionality
improvement of over 40,000 rural systems and 100 urban systems
l M l M selected municipalities
3 augmented supply abstraction, source, management, storage, and treatment
M M H H Metropolis, submetropolis, selected municipalities
4 Water treatment Wtp, chlorine gas industry M H H H Metropolis, submetropolis, selected municipalities
5 Wastewater collection laying rcc pipes, manhole covers, appurtenances, etc.
l l M H submetropolis, large municipalities
6 Wastewater treatment construction, operation, resource recovery, energy, equipment, and plants
M H H H Design and/or build treatment plants under partial funding, annuity, DBO, etc.
7 sludge treatment
plants
construction and operation of plants
H H H H several municipalities, submetropolis
8 climate change adaptation and disaster resilience
source protection, demand management, etc.
l l M M entire country
*INV=Investment; DB=Design Build; OP=Operation; SM=Smart Management, H=High; M=Medium; L=Low
50. www.hakahakionline.com/en/4762/indias-monopoly-in-bleaching-powder/
the private sector can enter Boot contract or PPP agreements with the government for investment in water and sanitation sector. It can also sub-contract water and sanitation services to improve performance and reduce the cost of operations.

N e p a l I N f r a s t r u c t u r e 2 0 3 0 : I n v e s t m e n t a n d F I n a n c I n g n e e d s
52
Innovative technologies: The private sector can supply innovative equipments and technologies required in the sector such as modern tools and equipment for excavation, Supervisory Control and Data Acquisition (SCADA) software, appropriate technologies for rugged and geographically challenged locations, such as using horizontal drilling, rain water and fog water harvesting etc.
Table 21, which presents the prospects for the private sector in the water and sanitation sector, shows the key areas envisaged for investment
in the future (up to 2030), with involvement opportunities for the private sector, through investment, design-build, operation, and smart management technology, to address the gap and challenges in the sector. The private sector can also supply construction materials for building water and sanitation infrastructure. Table 22 provides estimates for the construction materials required to build water and sanitation infrastructures. The major inputs (construction materials) needed for water and sanitation sector are cement, steel aggregates and sand, pipes, and accessories, and chlorine (for disinfection). This estimate is based
the government has been making serious efforts to reclaim the water quality of the Bagmati river since as early as the mid-1990s by conceiving and implementing the Bagmati area sewerage project. a High- powered committee for integrated Development of Bagmati civilization was formed, initially through a cabinet order, to implement and carry forward the project and other activities. the major task entrusted to the committee was to construct a wastewater treatment plant with a capacity of 16.2 MlD. a plant comprising an oxidation ditch with extended aeration system fitted with mechanical surface aerators was commissioned in 2001. the committee also laid 11 km of interceptor sewerage line between Gokarna and the treatment plant site in Guheswori to intercept and carry sewerage to the treatment plant site; first along one bank and later along both banks of the Bagmati river. furthermore, a 552-meter- long tunnel was constructed to carry the treated effluent to a discharge point in the river below the pashupatinath ttemple. construction of the sewerage system and plant was carried out under normal government-designed, procured, and supervised civil works contract without any obligation for the contractor to meet output target or other operational liabilities.
the plant did not operate successfully, mainly because of inadequate capacity of the operators. this was aggravated by erratic power supply and a combination of other technical and operational problems. No user charges were levied and operation of plant depended entirely on government-allocated budget. High turnover of the skilled technical staff, which was due to lack of proper recognition and incentives, became a problem.
this plant was later decided to be expanded and rehabilitated by adding another unit of 16.2 MlD capacity. this would upscale total plant capacity to 32.4 MlD by 2020. activated sludge process (asp) would be used to biologically treat wastewater. this additional component would be fitted with pretreatment units, primary and secondary clarifiers, and effluence disinfection provisions before finally discharging sludge into the river. the sludge will be dewatered, digested, and sent to drying beds. additionally, the plant would generate 321 KWH of energy internally during the sludge digestion process. the old oxidation ditch would also be converted to an asp of similar process.
the contract was awarded to va tech Wabag ltd. (india) for approximately usD 25.6 million on august 1, 2016 providing it with 720 days to complete the construction. unlike the previous contract, the present contract follows a Design, Build, Operate model with a strong design and operation focus – the contractors will not only design and build the plant, but will also operate the plant for 10 years with several operational parameters and strict target values – specified for compliance. these include BOD5 (10 mg/l), ss (10 mg/l), ammonia Nitrogen (<50mg/l), and cOD (<250 mg/l) amongst others.
a contract under a similar model and arrangements has been awarded to safBon Water service (Holding), shanghai, china to upgrade the non-functional treatment plants in Dhobhighat (Kathmandu), Kodku (lalitpur), and sallaghari (Bhaktapur) for a total contract value equivalent to usD 32 million.
Source: KUKL (2017).
Box 9 prIvate sector INvolvemeNt IN WasteWater treatmeNt—Is It a treNd For tHe Future ?
the private sector can supply
innovative equipments and
technologies required in
the water and sanitation
sector such as modern tools
and equipment for excavation,
supervisory control and
data acquisition software,
horizontal drilling, etc.
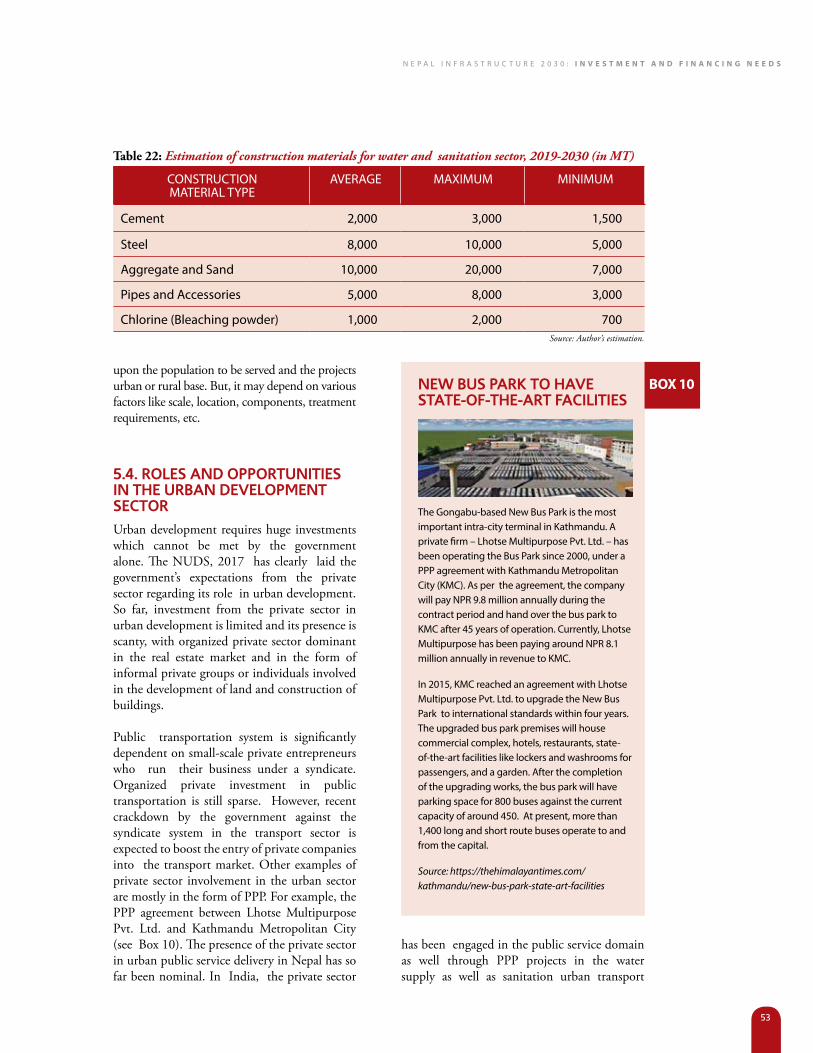
N e p a l I N f r a s t r u c t u r e 2 0 3 0 : I n v e s t m e n t a n d F I n a n c I n g n e e d s
53
upon the population to be served and the projects urban or rural base. But, it may depend on various factors like scale, location, components, treatment requirements, etc.
5.4. roles aNd opportuNItIes IN tHe urBaN developmeNt sectorUrban development requires huge investments which cannot be met by the government alone. The NUDS, 2017 has clearly laid the government’s expectations from the private sector regarding its role in urban development. So far, investment from the private sector in urban development is limited and its presence is scanty, with organized private sector dominant in the real estate market and in the form of informal private groups or individuals involved in the development of land and construction of buildings.
Public transportation system is significantly dependent on small-scale private entrepreneurs who run their business under a syndicate. Organized private investment in public transportation is still sparse. However, recent crackdown by the government against the syndicate system in the transport sector is expected to boost the entry of private companies into the transport market. Other examples of private sector involvement in the urban sector are mostly in the form of PPP. For example, the PPP agreement between Lhotse Multipurpose Pvt. Ltd. and Kathmandu Metropolitan City (see Box 10). The presence of the private sector in urban public service delivery in Nepal has so far been nominal. In India, the private sector
has been engaged in the public service domain as well through PPP projects in the water supply as well as sanitation urban transport
Table 22: Estimation of construction materials for water and sanitation sector, 2019-2030 (in MT)
cONstructiON Material type
averaGe MaXiMuM MiNiMuM
cement 2,000 3,000 1,500
steel 8,000 10,000 5,000
aggregate and sand 10,000 20,000 7,000
pipes and accessories 5,000 8,000 3,000
chlorine (Bleaching powder) 1,000 2,000 700Source: Author’s estimation.
the Gongabu-based New Bus park is the most important intra-city terminal in Kathmandu. a private firm – lhotse Multipurpose pvt. ltd. – has been operating the Bus park since 2000, under a ppp agreement with Kathmandu Metropolitan city (KMc). as per the agreement, the company will pay Npr 9.8 million annually during the contract period and hand over the bus park to KMc after 45 years of operation. currently, lhotse Multipurpose has been paying around Npr 8.1 million annually in revenue to KMc.
in 2015, KMc reached an agreement with lhotse Multipurpose pvt. ltd. to upgrade the New Bus park to international standards within four years. the upgraded bus park premises will house commercial complex, hotels, restaurants, state-of-the-art facilities like lockers and washrooms for passengers, and a garden. after the completion of the upgrading works, the bus park will have parking space for 800 buses against the current capacity of around 450. at present, more than 1,400 long and short route buses operate to and from the capital.
Source: https://thehimalayantimes.com/kathmandu/new-bus-park-state-art-facilities
Box 10NeW Bus parK to Have state-oF-tHe-art FacIlItIes

N e p a l I N f r a s t r u c t u r e 2 0 3 0 : I n v e s t m e n t a n d F I n a n c I n g n e e d s
54
Box 11 examples oF urBaN-sector ppp INItIatIves IN INdIa
Water supply and sewerage project (salt lake, Kolkata)
it is a combined Water supply-cum-sewerage project for the entire township through ppp under the Build, Operate, and transfer (BOt) format. implementation and management of the project has been handed over to a competitively selected private agency for an initial period of thirty years, subject to renewal for another thirty years.
Water supply project(chandrapur, Maharashtra)
this scheme was initially being managed by the Municipal council and was bearing losses. later, it was privatized by handing it over to a private agency for ten years. the council no longer needs to spend any amount on the scheme. On the contrary, it receives an income of 15.9 million for ten years from the private agency.
Water Management contract (source totap) (latur, Maharashtra)
this is india’s first source-to-tap integrated Management contract. a ten-year contract was floated for the operation, maintenance, and repair of latur Water supply scheme. the contract covers bringing water from dams and weirs, managing pumping stations, electrical installations and water reservoirs, connecting pipelines and distribution system, and collecting fees from users. a special-purpose company was set up by three private firms.
Water supply and sewerage project(tirupur, tamil Nadu)
it is the largest private sector investment in the urban infrastructure sector and the first water and sanitation ppp project in india. it is promoted by the Government of tamil Nadu and a private agency. it is also the first water project in india to be funded on a project finance, non-recourse basis.
centralized Biomedical Waste treatment facility (surat, Gujrat)
surat Municipal corporation set up a centralized Biomedical Waste treatment facility on BOOt basis. Operational since 2003, the facility currently serves 1922 health-care units in and around surat. this includes 638 hospitals, 165 pathology laboratories, 900 clinics, and 219 other units.
integrated solid Waste Management project (alandur, pallavaram, and tambaram Municipalities, tamil Nadu)
this project addresses solid waste management in three municipalities in tamil Nadu. Half of the project cost is shared by the Government of india and Government of tamil Nadu, and the remaining half is to be funded by ppp partner. the municipalities pay to the concessionaire in terms of tipping fee payable per metric ton of solid waste generated by the respective municipalities.
Waste Management facilities (Haldia, West Bengal)
Haldia Development authority formed West Bengal Waste Management limited (WBWMl) in joint venture with a private agency to develop and operate integrated common hazardous waste-treatment, storage, and disposal facility on a seventy- acre land for the benefit of industries. WBWMl will manage the facility for twenty-five years on BOOt basis. post-completion, the monitoring period is twenty-five years.
city Bus service on ppp (surat, Gujarat)
till recently, the city of surat had an insignificant public transportation system which was run by the state transport corporation with fifteen buses on city routes. in august 2007, surat Municipal corporation started operation of city bus services through private agencies. Within a year, 102 buses were deployed that carried over 45,000 passenger-trips every day on forty-two routes in the city. By the end of 2008, the number of buses reached more than 200.
Modern inter-state Bus terminal(Dehradun, uttaranchal)
under the agreement, the developer is required to design, finance, build, operate, and maintain the facility for the entire concession period of twenty years; extendable to up to thirty years.
sardar patel ring road(ahmedabad, Gujarat)
the extension of existing two lanes to four lanes is carried out as a ppp project under BOt model with a concession period of twenty years at a cost of 3.78 billion. a private party is responsible for junction development, plantation along the road, toll tax collection, and signage development.
establishment of High capacity Wirelessinfrastructure(pimpri chinchwad, Maharashtra)
the project, with the cost of 428.4 million and duration of 10 years, envisages a city-wide high capacity wireless infrastructure through ppp model on a revenue-sharing basis. the private partner is expected to bear costs of infrastructure, bandwidth, management, human resources, maintenance of services, and collection of revenue, among others. the Municipal council provides land on rent for setting up the infrastructure.
Source: MOUD and CII (n.d.).

N e p a l I N f r a s t r u c t u r e 2 0 3 0 : I n v e s t m e n t a n d F I n a n c I n g n e e d s
55
Table 23: Relevant NUDS strategies from the perspective of private sector investment
strateGic tHeMe strateGies activities
urban systems
identify and facilitate higher level functions and services in major regional urban centers and future provincial capitals.
improve connectivity and infrastructure standards in intermediate and small towns as well as toward southern tarai towns.
prioritize infrastructure investment through government and/or provide incentives for private sector investment.
Develop local economic development plans in participation with the private sector.
urban infrastructure
promote private sector investment in both basic services (water supply, waste collection, and management including recycling, housing for economically weak groups, rental housing, planned land parcels) and higher order infrastructures.
provide incentives for private sector investment in urban infrastructure.
urban economy
facilitate formulation and implementation of local, regional, and provincial economic development plan.
plan and implement an urban regeneration program in the historic core areas and disaster-affected urban centers.
Develop economic development plans in participation with the private sector.
promote public/private investment in urban regeneration through incentives.
urban finance and investment
Mobilize investment through alternative financing instruments including private sector involvement.
prepare and internalize guidelines for financing methods; select viable urban ppp projects as pilot projects; and support municipalities/urban areas for implementation.
urban land management
establish and internalize land information system.
facilitate private sector in establishing web-based information system on availability of land parcels to sell and buy.
Source: after MoUD (2017).
sectors and Nepal can learn from its neighbor (see Box 11 for some examples) and promote and increase the role of the private sector in urban infrastructure development. Involvement of the private sector in effective water supply, organized urban public transport, organized inter-provincial transport, and solid waste management is important and needed in Nepal.
As urban areas in Nepal are expanding and receiving more investments from government and development partners, it is an appropriate time for the private sector to increase their presence in the sector’s development. Some of
the potential areas for private investment could be as follows:
• Real estate: High-rise apartments, housing (including rental), commercial/office complexes, and rental housing in emerging cities.
• Urban transport: City buses, inter-city buses or Rapid Bus Transit (RBT), Mass Rapid Transit (MRT) including smart technologies.
• Roads: Toll roads in economically viable stretches.
• Water and Sanitation: Operation and maintenance of water and sanitation

N e p a l I N f r a s t r u c t u r e 2 0 3 0 : I n v e s t m e n t a n d F I n a n c I n g n e e d s
56
schemes, operation and maintenance of water filtration and wastewater treatment plants, and supply and delivery of fresh water.
• Solid waste management: Collection and management of solid waste, operation, and maintenance of sanitary landfill sites, recycling centers, and/or material recovery facilities.
• Power: Investment in hydropower projects, expansion of solar power system, smart metering, and smart energy management at household level.
• Large-scale multidimensional urban projects: PPP components of large-scale government projects in the urban development sector.
The NUDS has also estimated the investment required to achieve the desirable conditions in terms of infrastructure and service delivery for the next fifteen years (or up to year 2030/31).
As municipalities alone cannot meet investment requirements, other funding sources, including the private sector, have been identified to meet the investment deficit. The NUDS expects that about 60% of investment would come from the federal government through fiscal transfer, 30% from development partners, 5% from the internal resources of the municipality, and the remaining 5% from the community and private sector. Community would be involved in projects like water supply, inner urban roads, drainage and sewerage, and the private sector in the construction of bus parks and other infrastructure services through PPPs.
The NUDS does not mention the potential investments from the private sector alone, without PPP modality. However, in terms of strategies, the NUDS has high hopes from the private sector, evident from Table 23.
some of the potential areas
for private investment
in urban development
sector could be: high-rise apartments, commercial
complexes, mass Rapid transit,
toll roads, supply and delivery
of water, waste water treatment,
solid waste management,
expansion of solar power
system, smart metering and
or smart energy management etc.

N e p a l I N f r a s t r u c t u r e 2 0 3 0 : I n v e s t m e n t a n d F I n a n c I n g n e e d s
57

N e p a l I N f r a s t r u c t u r e 2 0 3 0 : I n v e s t m e n t a n d F I n a n c I n g n e e d s
58
WaY ForWard For INFrastructure developmeNt IN Nepal
Investment and Financing Needs
N e pa l I N F r a s t r u c t u r e 2 0 3 0

N e p a l I N f r a s t r u c t u r e 2 0 3 0 : I n v e s t m e n t a n d F I n a n c I n g n e e d s
59
Nepal will need to invest 8.14 to 9.85% of its GDP which translates to USD 29 to 48 billion51 from 2019 to 2030 in infrastructure to achieve
the desired economic growth, increase access to basic services, and improve the standard of living. With the current trend of budget allocation and limited role of the private sector in infrastructure investment, it will be quite a challenge to meet the estimated investment needs. To meet the challenges and allow the private sector to fill the investment gap, there is an urgent need for major policy and institutional reforms. This section discusses overall and sector-specific policy reforms, summary of financing capacity and financial instruments, and methods to get the most out of infrastructure investment. Institutional arrangements and major policies governing the priority sectors are elaborated in Annex A9.
6.1. geNeral polIcIes aNd strategIesUnifying infrastructure policy and one window systemThere is need for a unified national infrastructure policy and a single-window clearance system to reduce not only the length of the approval process but also confusions and contradictions on policies among the concerned ministries. Such a unified policy can facilitate infrastructure investment by speeding up the process of obtaining permits and approval of solicited and non-solicited proposals, among others. Since such a policy can mitigate some of the risks that might arise due to the constantly
changing infrastructure investment policies, it can also help attract FDI.
New institutional set-up in Federal NepalThe institutional set-up in federal Nepal is important to create an environment conducive to facilitating investment in infrastructure by the private sectors (foreign and domestic). The institutional set-up should clearly define the roles and responsibilities of different levels of government and complement these roles to achieve the national infrastructure visions and targets.
A central agency with the requisite authority and capacity is urgently needed to design and implement projects aimed at the social and economic development of the country. Such an agency should comprise highly trained technical professionals and policy experts. The technical professionals would support in planning, designing, and managing projects based on the visions and goals set by the policy experts. Such an agency should also help prioritize and strengthen the national project banks.
Enactment of new Land Acquisition, Resettlement, and Rehabilitation ActAcquiring land for infrastructure projects has been one of the biggest challenges in Nepal. It is not easy to acquire private land for large projects, since the compensation demanded is often exorbitant, an issue which is even more
6 Way Forward for Infrastructure Development in Nepal
the institutional set up should clearly define the roles and responsibilities of different levels of government and complement these roles to achieve the national infrastructure visions and targets.
51. Estimate from top-down (macroeconomic) approach under three GDP growth scenarios: 5%, 7.5% and 10%.

N e p a l I N f r a s t r u c t u r e 2 0 3 0 : I n v e s t m e n t a n d F I n a n c I n g n e e d s
60
critical in urban areas where land is in short supply and prices remain high.
The government is now planning to enact a new law replacing the existing Land Acquisition Act (1977) in line with the Land Acquisition, Resettlement, and Rehabilitation Policy (2014). The Act is expected to ensure an easy, simple, and effective procedure for land acquisition. The Act has, among other things, envisaged ensuring timely acquisition of land for infrastructure projects, a scientific mechanism for land valuation, and providing compensation (or land in suitable areas) to families for the land acquired at par with the market price. This will pave the way for infrastructure developers to acquire land without affecting the livelihood of the affected and/ or displaced population. To this end, the policy has stressed the need to assess the economic and social impact of development projects. Based on the levels of risk, projects will be categorized as:
• High-riskprojects:Projectswhichdisplace50 or more households in the mountainous region, 75 or more households in the hill region, and 100 or more households in Tarai.
• Medium-risk projects: Projects whichforce relocation of less than 50 households in the mountainous region, less than 75 households in the hill region, and less than 100 households in Tarai.
• Low-risk projects: Projects which causeproductive property to shrink by up to 10%.
For low-risk projects, the policy needs a strategy on land acquisition and compensation. But in the case of high and medium-risk projects, a detailed resettlement and rehabilitation plan must be designed.
The policy also has a provision that allows the government to take action against those who try to disrupt land acquisition process or create hurdles for project developers that have acquired land by following the due process. This is expected to aid timely completion of projects in the country.
Getting approval for forest clearance for infrastructure project is also a hurdle for infrastructure development. This can be addressed by applying a detailed Environmental Impact Assessment (EIA) of international standard and easing the process once the assessment shows that the environmental impact from forest clearance is minimal. However, detailed EIA alone may not be able to address the bureaucratic hurdle of forest clearance in Nepal.
Increasing the role of private sectors with effective enforcement of the Public Private Partnership and Investment Act (2019)The GoN has long been trying to promote PPP to engage the private sector in development of physical infrastructure projects in the country. The legal provisions regarding PPP have their roots in the Private Financing in Build and Operation of Infrastructure (BOOT) Act (2006) and Rules (2007). The government also introduced the PPP Policy (2015) with provisions for unsolicited proposals, Project Preparatory Fund, Viability Gap Funding (VGF52), assurance that land acquisition will be done by the government, and demarcation of the responsibilities of PPP Center and PPP steering committee.
The recently enacted act is a product of two elements: the first one is to convert the PPP Policy (2015) into law and the second to empower IBN as an institution to facilitate private investors by reducing hurdles. This act supersedes the Investment Board Act (2011) and BOOT Act (2006).
The Act has a provision for creating a revolving fund for land acquisition, VGF, and for sharing of risks and benefits proportionately between the government and the private sector during and after the completion of the projects. VGF from the government projects is going to make it feasible and commercially viable for the interested private sector agencies to participate.
a central agency with requisite authority and
capacity should help prioritize
and strengthen national project
banks.
52. Viability gap is the difference between revenue required to make a project commercially viable and revenue that is expected to be generated upon a project’s completion.
N e p a l I N f r a s t r u c t u r e 2 0 3 0 : I n v e s t m e n t a n d F I n a n c I n g n e e d s
61
The Act provides for two wings at IBN: PPP center and investment center. The role of the PPP center is to identify, manage, and oversee PPP project. The center is also responsible for developing a PPP framework, support other agencies to implement PPP projects, act as a knowledge hub, and also function as a project bank. The act also has a provision for creating an effective one stop center with authority to issue survey license, sign MOU’s and other agreements related to infrastructure project, and grant investment approval. Effective enforcement of the newly enacted law will facilitate and help increase the role of the private sector in infrastructure investment. The act also authorizes IBN to remove procedural and other hurdles faced by the private investor.
Increasing the role of foreign investors with effective enforcement of the new Foreign Investment and Technology Transfer Act (2019) This act has a provision for approving FDI within a week of application, one stop service through establishment of a center at the MoI, provision for 100 % of foreign investment and technology transfer, repatriation of investment and profit in foreign currency, investment through opening a branch or by establishing venture capital fund, etc.
Increasing the role of industries with effective enforcement of the new Industrial Enterprise Act (2016)This act provides for one stop service, contract manufacturing, import of goods from foreign company for market development of new goods, 40% exemption on income tax rate for industries investing in construction of roads, bridges, tunnel, railways, etc. and 100% percent tax exemption for the first five years to manufacturing industries with investment of at least NPR one billion and providing employment to more than 500 individuals.
Transparent and efficient procurement processesActivities such as acquiring goods and services and commissioning of large infrastructure projects are governed by the Public Procurement Act (2007) and Rules (2008). In the absence of proper guidelines and technical notes to facilitate public procurement efficiently and transparently, users are not fully accustomed to effectively use public procurement process. Thus, there are problems in each stage of the procurement process, be it in planning, bidding, contracting, constructing, managing, or supervising. To make procurement process efficient, and transparent, improve the process of execution and completion of projects, and promote competitive role of the private sector, this study recommends the following:
• Amend the current process of awardingcontract to the lowest bidder. The current process does not take into account the quality and effectiveness of execution of projects.
• Amend the current system of poordisclosure of information related to procurement processes to make it more transparent.
• Organize public and stakeholders’engagement programs during the procurement process.
• Developanefficientsystemofmonitoringand supervision for timely feedback and problem solving.
• Abolish the system of opening call forsubmission of bids beyond the need and capacity of government.
6.2. polIcIes aNd strategIes For tHe eNergY sectorOne strategy to improve infrastructure in the energy sector is unbundling of operations — generation, distribution, and transmission — of NEA. Another is establishing an independent regulator in the Nepalese electricity market. The recently enacted Nepal Electricity Regulatory Commission Act (2074) has fulfilled the first
current process of awarding contract to lowest bidder does not take into account the quality and effectiveness of execution of projects.

N e p a l I N f r a s t r u c t u r e 2 0 3 0 : I n v e s t m e n t a n d F I n a n c I n g n e e d s
62
need to some extent. An independent regulator, however, has yet to become functional. The Electricity Regulatory Authority should be made functional with immediate effect to deal with the following issues to facilitate private investment in the hydropower sector in Nepal.
• Institutionalizing forecasting of nationalelectricity demand.
• Establishingelectricitypricesupplycurves;• Establishing average tariff high enough
to meet the marginal cost of electricity generation and transmission.
• Eliminatingimpedimentstoprivatesectorinvestment in generation, transmission, and distribution.
• Making the power purchase agreementprocess public.
• Establishing a schedule of NEAdetermination regarding power purchase.
• Providing a guarantee of payment forevacuated power.
• Establishingapowerwheelingcharge.• Establishing local compensation packages
for affected population.• Institutionalizing policy monitoring and
review procedures. • Promotingenergyefficiencyandrenewable
energy.
Furthermore, the strategy in the energy sector should also consider optimal utilization of the energy resources, systematic planning and efficient development of energy system and hydropower, competitive bidding (auctioning) in hydropower development, diversification of electricity supply mix, and climate proofing in energy infrastructure.
Additionally, policy changes should also focus on pro-active investment policies – such as tax incentives, risk mitigation, and eliminating administrative hurdles – to encourage private sector investment, and bilateral agreements with countries that can facilitate cross, border electricity trade (e.g; BIMSTEC grid interconnection) with India, China, and Bangladesh.
6.3. polIcIes aNd strategIes For tHe traNsport sectorTo achieve the goals set by the government (such as SDGs, Strategic Plans, National Pride Projects, etc.) and increase the role of the private investor in the transport sector, the following strategies are deemed necessary:
Revision of current road classifications: The current classification of road systems in Nepal is based more on administrative hierarchy53 rather than the functionality of the road system. To improve efficiency and reduce transport cost, it is necessary now to introduce a new and clearer road classification based on functionality, connectivity, and volume of traffic. The objective of building strategic highways (higher standard road) should be to: a) enhance connectivity to the economic growth corridor and economic clusters; b) minimize economic losses due to frequent road closures; and c) promote and establish Nepal as a transitional hub for international trade between India and China. All roads connecting to the international border and facilitating international trade need to be further classified under “Economic Connectivity”.
Changes in practice of road construction: Road construction has been practiced in stages as a part of the strategy adopted by DoR. The process begins with track opening followed by upgrading and finally surfacing. This practice needs to be reviewed so that a complete road package, including the bridges, is delivered in time without causing inconvenience to the movement of goods and passengers. The existing roads need to be widened out by setting higher standards to increase efficiency and lower overall transport cost. If widening does not provide space for improving overall efficiency, alternative alignment should be explored and selected.
Establishment of a backbone economic connectivity corridor to facilitate economic growth: North -South Corridors and East-West Corridors (East-West Highway and Mid-Hill Highway) need to be treated as a backbone for the entire
53. As it stands, highway means a higher class of road (road at the top of the classification) but it does not necessarily reflect high volume of traffic or higher standards of roads.
some of strategies of energy sector:
institutionalizing forecasting of
national electricity demand, making
power purchase agreement
process public, promoting energy
efficiency and renewable
energy etc.
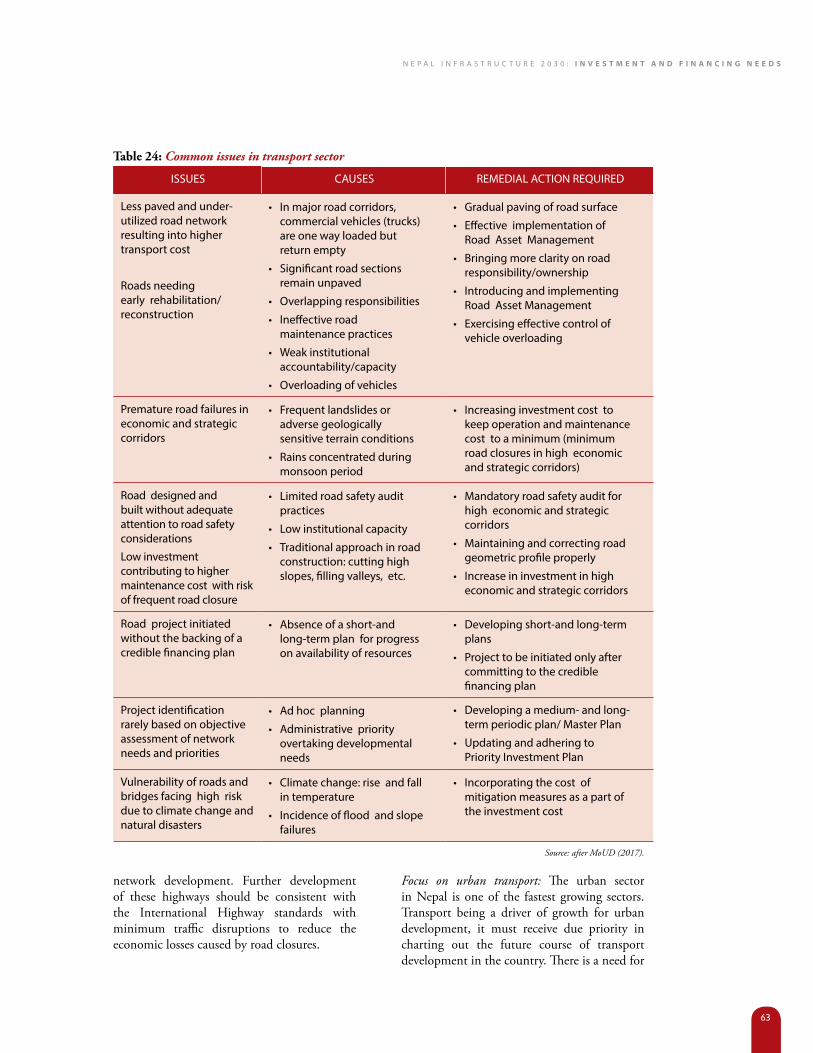
N e p a l I N f r a s t r u c t u r e 2 0 3 0 : I n v e s t m e n t a n d F I n a n c I n g n e e d s
63
network development. Further development of these highways should be consistent with the International Highway standards with minimum traffic disruptions to reduce the economic losses caused by road closures.
Focus on urban transport: The urban sector in Nepal is one of the fastest growing sectors. Transport being a driver of growth for urban development, it must receive due priority in charting out the future course of transport development in the country. There is a need for
Table 24: Common issues in transport sector
issues causes reMeDial actiON reQuireD
less paved and under-utilized road network resulting into higher transport cost
roads needing early rehabilitation/ reconstruction
• in major road corridors, commercial vehicles (trucks) are one way loaded but return empty
• significant road sections remain unpaved
• Overlapping responsibilities
• ineffective road maintenance practices
• Weak institutional accountability/capacity
• Overloading of vehicles
• Gradual paving of road surface
• effective implementation of road asset Management
• Bringing more clarity on road responsibility/ownership
• introducing and implementing road asset Management
• exercising effective control of vehicle overloading
premature road failures in economic and strategic corridors
• frequent landslides or adverse geologically sensitive terrain conditions
• rains concentrated during monsoon period
• increasing investment cost to keep operation and maintenance cost to a minimum (minimum road closures in high economic and strategic corridors)
road designed and built without adequate attention to road safety considerations
low investment contributing to higher maintenance cost with risk of frequent road closure
• limited road safety audit practices
• low institutional capacity
• traditional approach in road construction: cutting high slopes, filling valleys, etc.
• Mandatory road safety audit for high economic and strategic corridors
• Maintaining and correcting road geometric profile properly
• increase in investment in high economic and strategic corridors
road project initiated without the backing of a credible financing plan
• absence of a short-and long-term plan for progress on availability of resources
• Developing short-and long-term plans
• project to be initiated only after committing to the credible financing plan
project identification rarely based on objective assessment of network needs and priorities
• ad hoc planning
• administrative priority overtaking developmental needs
• Developingamedium-andlong-term periodic plan/ Master plan
• updating and adhering to priority investment plan
vulnerability of roads and bridges facing high risk due to climate change and natural disasters
• climate change: rise and fall in temperature
• incidence of flood and slope failures
• incorporating the cost of mitigation measures as a part of the investment cost
Source: after MoUD (2017).
N e p a l I N f r a s t r u c t u r e 2 0 3 0 : I n v e s t m e n t a n d F I n a n c I n g n e e d s
64
doubling urban road density by 2030. For an effective delivery of transport services, a mass transit system also needs to be promoted.
Institutional reform: Institutional reform is also required to:
• Prioritize road maintenance activitiesbased on strategic importance, traffic, and treatments;
• Developadequatecapacitytomanageroadassets;
• Ensure adequate funding to carry outmaintenance operation.
Furthermore, a clear policy on the role of each tier of government (federal, provincial, and local) in coordinating and managing a mass transit system is needed to attract investment in this sector. The responsibility of strategic highways, which form the backbone for strategic connectivity and reduction of transport cost, should be that of the federal government. Roads connecting districts and provincial centers (intra- and inter-provincial) should be the responsibility of provincial governments.
These roads can be secondary road links to strategic highways. Furthermore, local road networks in urban and rural areas should be the responsibility of the local government. Some of the common issues and strategies/remedial actions in the transport sector are summarized in Table 24.
6.4 polIcIes aNd strategIes For tHe Water aNd saNItatIoN sectorThe government aims to achieve universal access to basic water services and make the country open defecation-free by 2021.54 The 15th Five Year Plan (2019) has a target to provide 40% of the population with improved water supply and provide 100% of the population with basic water supply. The plan also targets to treat
20% of wastewater before it is discharged into natural water bodies. The 14th Plan55 is focused on (i) improving functionality; (ii) enhancing service levels and quality; and (iii) expanding and deepening water and environmental sanitation, in municipalities. The 15th Five Year Plan (2019) focuses on: (i) improving public health through the provision of adequate, safe, and reliable water supply; (ii) maintaining environmental cleanliness through provision of safely managed sanitation services; (iii) rendering water and sanitation systems climate-friendly and disaster-resilient; and (iv) building the capacity of federal, provincial, and local bodies to provide effective water and sanitation services. However, the overarching focus of the water supply and sanitation policies, so far, has been on providing universal access to these services.
The sector now needs a policy shift from universal access to improvement of water quality and standard of services.
The following strategies are necessary to achieve the aforementioned goals:
• Clarity in the roles and responsibilities ofthe various levels of governments.
•Strongagenciesatthelocalandprovinciallevels to plan and implement programs, monitor service providers’ and users’ committees, etc.
• Involvement of the private sector inundertaking professional development and activating smart water and wastewater management. They can also be involved in building and operating treatment plants and commercially viable collection and distribution systems, bulk water systems, etc.
• Effective groundwater management withcontrol over arbitrary water extraction.
• Identification and mapping of theunreached population to make it easier to provide them with safe drinking water and sanitation services.
some of the strategies of
transport sector: revise current
classification of road that is based on administrative hierarchy change
the current practice of road
construction which begins with
track opening followed by
upgrading and finally surfacing.
54. GoN, 2005, National Water Plan. Kathmandu and subsequent target revisions in 2017.55. Fourteenth Plan (2016/17-2018/19), National Planning Commission

N e p a l I N f r a s t r u c t u r e 2 0 3 0 : I n v e s t m e n t a n d F I n a n c I n g n e e d s
65
• Repair,maintenance,andrehabilitationofsystems constructed in the past
• Designing,building,andupgradingofnewsystems to increase quality of water service
• Improving the system of collection,treatment, and disposal of fecal sludge by constructing collection centers and treatment plants at strategic locations
• Inducing the sewer network to collect,transport, and safely treat sewage from the populated areas before discharging into natural water bodies
• Promoting PPP in wastewater collection,management, treatment, and recycling.
6.5. polIcIes aNd strategIes For tHe urBaN developmeNt sectorIn the urban sector, each of the three tiers of the government has an important role to play. Although urban policies will continue to be framed at the federal level, individual municipalities will emerge as the dominant players when it comes to city planning and implementation of urban projects. However, the municipalities lack not only financial resources but also technical capabilities to execute these projects. Consequently, the private sector will most likely be working with municipalities in the future to invest and provide technical assistance in these projects. Some of the strategies for urban development are:
• Enforcement of the PPPI Act-2019 withprovisions of VGF, sharing of risks and benefits between the government and the private sector, and easy land acquisition to increase the role of the private sector in urban development.
• Given the huge infrastructure requiredin the urban sector to attract private investment in urban development, there is a need to clearly define the role of the private sector in the Urban Development Act. The Act should also clarify the roles and responsibilities of the three tiers of
government and the vertical and horizontal relationships among different governments regarding city and regional level planning and implementation of large scale infrastructure projects.
6.6 FINaNcINg capacItY aNd reFormInfrastructure projects can be either financed by the public sector (through tax revenue and foreign loans and grants) or by the private sector (through bank loans and equity). The public sector invests in infrastructure through capital expenditure, which hovers around 30% of the total budget.
The financial sector in Nepal is dominated by commercial banks, development banks, finance companies, micro-credit development banks, and savings and credit co-operatives. NRB has licensed 199 BFIs as of 201856. Other institutions that are part of the financial system and have the ability to invest in infrastructure are insurance companies, Employee Provident Fund (EPF), Citizen Investment Trust (CIT), Nepal Army Welfare Fund, and Hydroelectricity Investment Development Company Limited (HIDCL). The total capital base of BFIs in Nepal is 160 billion (USD 1.6 billion) (Khatiwada et al. 2015).
But a majority of funds in the Nepalese financial system are available only for short-term lending that can cause significant hindrance to investment in infrastructures, which they require for long-term investment. Long-term financing options provided by banks are in the form of fixed deposits with terms of five years or more. The funding options for private investors in Nepal are limited to banks as they have no access to sources such as CIT, EPF, HIDCL, and similar other funds.
Investment by BFIs in the infrastructure sector is around 15.5% of their total lending portfolio (Sigdel, 2016; NRB, 2016). There
Water and sanitation sector needs shift in vision from universal access to improvement of water quality and standard of services.
56. https://nrb.org.np/bfr/bfi_list/List%20of%20BFIs_July2018.pdf.
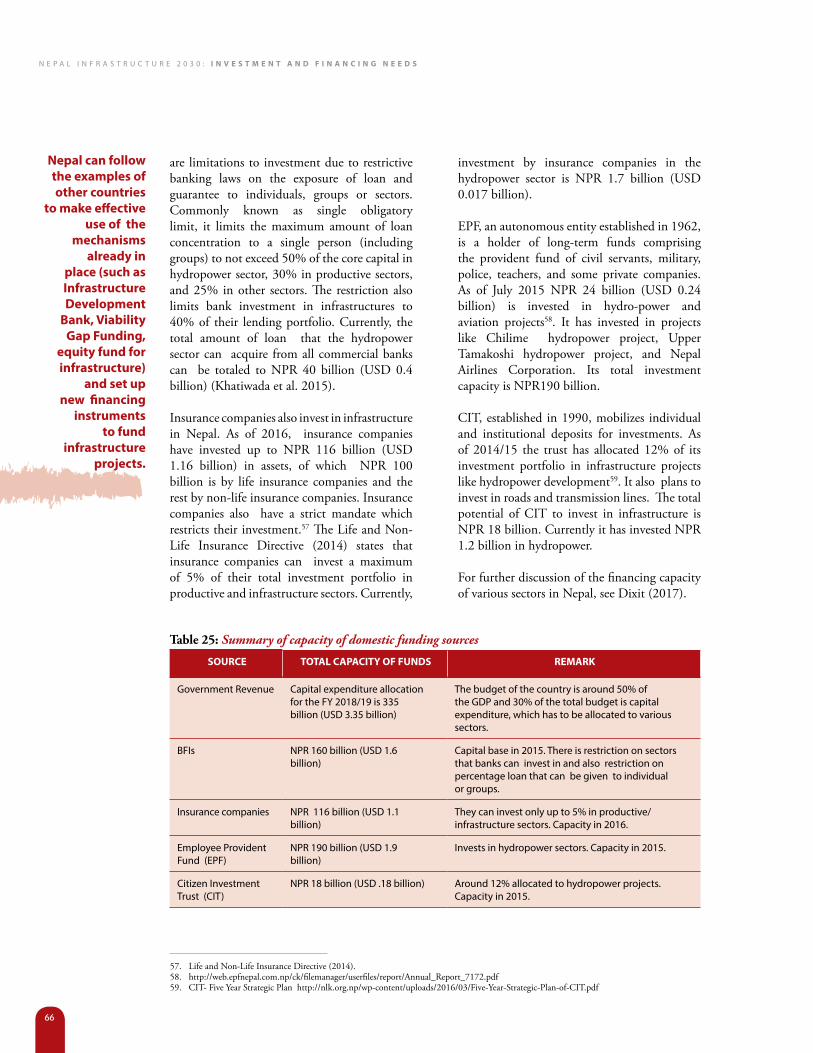
N e p a l I N f r a s t r u c t u r e 2 0 3 0 : I n v e s t m e n t a n d F I n a n c I n g n e e d s
66
are limitations to investment due to restrictive banking laws on the exposure of loan and guarantee to individuals, groups or sectors. Commonly known as single obligatory limit, it limits the maximum amount of loan concentration to a single person (including groups) to not exceed 50% of the core capital in hydropower sector, 30% in productive sectors, and 25% in other sectors. The restriction also limits bank investment in infrastructures to 40% of their lending portfolio. Currently, the total amount of loan that the hydropower sector can acquire from all commercial banks can be totaled to NPR 40 billion (USD 0.4 billion) (Khatiwada et al. 2015).
Insurance companies also invest in infrastructure in Nepal. As of 2016, insurance companies have invested up to NPR 116 billion (USD 1.16 billion) in assets, of which NPR 100 billion is by life insurance companies and the rest by non-life insurance companies. Insurance companies also have a strict mandate which restricts their investment.57 The Life and Non-Life Insurance Directive (2014) states that insurance companies can invest a maximum of 5% of their total investment portfolio in productive and infrastructure sectors. Currently,
investment by insurance companies in the hydropower sector is NPR 1.7 billion (USD 0.017 billion).
EPF, an autonomous entity established in 1962, is a holder of long-term funds comprising the provident fund of civil servants, military, police, teachers, and some private companies. As of July 2015 NPR 24 billion (USD 0.24 billion) is invested in hydro-power and aviation projects58. It has invested in projects like Chilime hydropower project, Upper Tamakoshi hydropower project, and Nepal Airlines Corporation. Its total investment capacity is NPR190 billion.
CIT, established in 1990, mobilizes individual and institutional deposits for investments. As of 2014/15 the trust has allocated 12% of its investment portfolio in infrastructure projects like hydropower development59. It also plans to invest in roads and transmission lines. The total potential of CIT to invest in infrastructure is NPR 18 billion. Currently it has invested NPR 1.2 billion in hydropower.
For further discussion of the financing capacity of various sectors in Nepal, see Dixit (2017).
Table 25: Summary of capacity of domestic funding sources
soURce totaL caPacItY oF FUnds RemaRK
Government revenue capital expenditure allocation for the fy 2018/19 is 335 billion (usD 3.35 billion)
the budget of the country is around 50% of the GDp and 30% of the total budget is capital expenditure, which has to be allocated to various sectors.
Bfis Npr 160 billion (usD 1.6 billion)
capital base in 2015. there is restriction on sectors that banks can invest in and also restriction on percentage loan that can be given to individual or groups.
insurance companies Npr 116 billion (usD 1.1 billion)
they can invest only up to 5% in productive/infrastructure sectors. capacity in 2016.
employee provident fund (epf)
Npr 190 billion (usD 1.9 billion)
invests in hydropower sectors. capacity in 2015.
citizen investment trust (cit)
Npr 18 billion (usD .18 billion) around 12% allocated to hydropower projects. capacity in 2015.
57. Life and Non-Life Insurance Directive (2014).58. http://web.epfnepal.com.np/ck/filemanager/userfiles/report/Annual_Report_7172.pdf59. CIT- Five Year Strategic Plan http://nlk.org.np/wp-content/uploads/2016/03/Five-Year-Strategic-Plan-of-CIT.pdf
nepal can follow the examples of other countries
to make effective use of the
mechanisms already in
place (such as Infrastructure development
Bank, viability gap Funding,
equity fund for infrastructure)
and set up new financing
instruments to fund
infrastructure projects.

N e p a l I N f r a s t r u c t u r e 2 0 3 0 : I n v e s t m e n t a n d F I n a n c I n g n e e d s
67
Summary of financing capacity and financial instrumentsThe total capacity of BFIs in Nepal is approximately USD 8.13 billion (from discussion in the previous section and summarized in Table 25). However, not all funds can be invested in infrastructure due to restriction on lending and investing regulations. According to the top-down estimate, the investment needs range from USD 29.72 to 48.34 billion and the bottom-up estimate ranges from USD 182 to NPR226 billion for the period 2019-2030. Thus, financial innovation and supportive financial policy reforms are required to meet the estimated investment needs by mobilizing investment from the private sector (foreign and domestic).
Nepal can follow the examples of other countries to make effective use of the mechanisms already in place (such as Infrastructure Development Bank, Viability Gap Funding, equity fund for infrastructure) and set up new financing instruments to fund infrastructure projects. Some of these instruments with relevant examples are discussed below.
A. Bond financing: Due to the longer time period of infrastructure projects as well as their longer repayment schedules, bonds can be a suitable option to raise funds for infrastructure projects in Nepal. These bonds are best suited to be used by projects with clear revenue and cash flows, such as the hydropower sector and fast track toll road projects. The GoN can also issue infrastructure bonds. Financial institutions entrusted and promoted by the government can serve as intermediaries to manage and administer the process of bond issuance.
The bond market is not yet fully developed in Nepal (only to the extent of government securities to meet short-term financing needs through short-term treasury bills), though this mode of financing is suitable for long-term infrastructure investment and is widely used internationally. Examples: green bond and long-term infrastructure bond, panda bond, etc.
Green bond: Green bonds are simply defined as bonds issued by companies, municipalities, etc. to procure funds exclusively for projects that address environmental problems.
The Export-Import Bank of Korea (KEXIM) issued its inaugural global Green Bonds for USD 500 million back in 2013. With the issuance, KEXIM became the first non-international financial institution to issue a global Green Bond. Before KEXIM, such bonds were used by multilateral financial institutions, such as ADB only. The proceeds from the issuance of bonds were used to finance projects that promote low-carbon and climate-resilient growth, particularly in fostering renewable energy, reducing carbon emission, promoting energy efficiency, and encouraging environment-friendly industries.
According to their Green Fund Framework which guides their investment decisions, the sectors eligible for financing include new energy sectors, renewable energy sectors, such as solar power, geothermal, waste energy, etc., and mitigation sectors such as water supply, water sanitation, water treatment, etc.
The inaugural global Green bonds issued by KEXIM had the following features: Tenure: 5 years; Coupon: 1.75%. Despite being a first offering, the demand for these green bonds was strong as they received orders of USD 1.8 billion from 100 investors against the issuance value of USD 500 million60. The sector allotment for the bonds was 55% to asset managers, 31% to banks, 5% to insurance and pension funds, 4% to companies and 5% to “other” investors. These bonds had received an AA3 rating.
Long-term infrastructure bond series: The Government of India (GoI) has started giving permission to select companies to issue long- term infrastructure bonds from July 2010. To ensure that the bonds receive initial attention from the investors, GoI has also offered to provide tax benefits for subscription of up to INR 20,000. Following the initial nod by GoI, REC has registered itself as an Infrastructure Finance Company with the Reserve Bank
60. https://www.climatebonds.net/2014/05/korean-exp-imp-bank-500m-green-bond-way-oversubscribed-95bps-over-ust-bingo-bravo
the bond market is not yet fully developed in nepal (only to the extent of government securities to meet short-term financing needs through short-term treasury bills), though this mode of financing is suitable for long-term infrastructure investment.

N e p a l I N f r a s t r u c t u r e 2 0 3 0 : I n v e s t m e n t a n d F I n a n c I n g n e e d s
68
of India (RBI). At the initial stage, Rural Electrification Corporation Ltd. (REC) issued bonds as unsecured redeemable non-convertible long-term bonds through private placement.
The initial offering was made for a total value worth INR 50 crores with a par value of INR 5,000 each. The issue was made with a green-shoe option which means any amount of application oversubscribed than initial issuance will be retained for issuance of additional infrastructure bonds. The issue has received an AAA rating from CRISIL India, LAAA rating from ICRA, and AAA(IND) by Fitch which is the highest possible rating to obtain. It was issued with two options: Option I offered annual coupon at 8% per annum and buyback after 5 years and Option II offered Annual coupon at 8.10% per annum with no buyback option61.
The issuer, i.e. the REC is one of India’s largest institutions owned by the Government of India. It is a public infrastructure finance company working in India’s power sector whose primary goal is to promote rural electrification projects across the country. It provides finance to Central/State Sector Power Utilities in the country, State Electricity Boards, Rural Electric Cooperatives, and Private Power Developers.
Thematic Bond-Panda Bonds: A Panda bond refers to bonds issued by a non-Chinese issuer within the Chinese territory and is denominated in Chinese renminbi. The first Panda bonds were issued by the International Finance Corporation (IFC) and ADB in October 2005. The bond issued by the IFC had terms of 10-year maturity with a yield rate of 3.4% amounting to 1.13 billion yuan. Another bond issued by the ADB had terms of 10-year maturity with a yield of 3.34% amounting to 1 billion yuan. During the initial years of such issue, the proceeds from the issue were not allowed to be invested outside China, but this restriction was lifted in May 2010.
In June 2016, Poland’s Ministry of Finance issued a Panda bond making Poland the first
European sovereign government to issue such a bond. Later on, in March 2018, the Philippines also issued Panda Bond and raised 1.46 billion renminbi. Such Panda Bonds can be issued by any foreign institution, such as foreign governments, international development organizations, foreign financial institutions, and non-financial corporates. Recently, in December 2018, Pakistan’s cabinet also approved the issuance of Panda bonds. The size of issuance, though, is not fixed for approval, but they expect to raise 500 million to 1 billion USD in various tranches62. This issue by Pakistan was continuation of its multi-prolonged approach for bridging the foreign financing needs of the country and also to build a sustainable level of foreign exchange reserves.
Thematic Bond-ADB Water Bond: During the last decade, countries within the South Asian and the Asia-Pacific region have achieved a rapid and high level of economic growth inviting a high level of water insecurity in the region. The rapid economic growth along with rapid population growth has brought a high demand for industry, and for food and domestic supply along with a high level of pollution, natural hazards, and climate change. Many cities within the region are still suffering from a low level of water services though large capital investments are being made to improve urban water supply and sewage systems.
ADB is working to increase access to clean water and sanitation, improve irrigation productivity and efficiency, and enhance overall water security within the region. It has already provided loans and grants for various components related to water service, such as projects in water supply and sanitation, irrigation and drainage, flood management, water resources management, and hydropower generation. To facilitate the financing of projects related to this sector, ADB has been issuing an innovative bond called ADB Water Bond. It issued the first tranche of water bonds in 2010 and raised a total of 638 million USD. Since then, it has already issued a number of tranches of such bonds raising approximately 1.5 billion USD (ADB, 2016). The amounts
61. https://taxguru.in/income-tax/highlights-of-long-term-infrastructure-bonds-us-80ccf-of-rural-electrification-corporation-rec-limited.html62. https://www.business-standard.com/article/international/pakistan-cabinet-approves-issuance-of-panda-bonds-in-chinese-
currency-118122800361_1.html

N e p a l I N f r a s t r u c t u r e 2 0 3 0 : I n v e s t m e n t a n d F I n a n c I n g n e e d s
69
thus raised are used for various water-related projects within Asia and the Pacific region. Examples of the water projects initiated by ADB include Anhui Chao Lake Environmental Rehabilitation Project in China with a total loan package of 250 million USD from ADB, Dhaka Water Supply Network Improvement in Bangladesh with a total loan package of 275 million USD, Guizhou Rocky Desertification Area Water Management Project in China with a total loan package of 150 million USD, and Integrated Participatory Development and Management of Irrigation Program in Indonesia with a total loan package of 500 million USD (ADB, 2018).
Municipal Bond: Municipal bonds, which are commonly known as Muni bond or local authority bond, are issued by states/provinces, cities, counties, and other governmental entities. These bonds are issued to finance schools, highways, hospitals, sewers systems, and many other projects for public good. Institutional investors and the public can buy these bonds.
State/provincial or local government uses revenue from the project to repay the interest and principal on the bond. In the context of federal Nepal, this method of financing is promising especially for infrastructure projects related to urban development.
B. Infrastructure Development Fund: These funds can be established by banks or other financial institutions and can work in a way similar to the mutual funds.
Regional Infrastructure Development Fund: The project was introduced by the World Bank for Indonesia to increase access to infrastructure finance at the subnational level through a financially sustainable financial intermediary. It was set up by the Indonesian Ministry of Finance in partnership with the World Bank with the primary objective to provide capital for municipal infrastructure lending. Lending through this fund was primarily made for the development of public market, hospitals, and roads. The fund is managed by PT. Sarana
Multi Infrastruktur (PT.SMI). For the first phase implementation of the fund, World Bank and Asian Infrastructure Investment Bank (AIIB) will each provide USD 100 million for a combined total of USD 200 million which is equal to half of the initial capital of RIDF.
In the first phase, the total fund available for lending is USD 400 million. PT. SMI will use money from the fund to provide senior debt to subnational governments in Indonesia for economically viable infrastructure projects. RIDF had utilized a mix of debt and equity as a capital investment for the fund. The debt component in the fund was managed through a two-stage loan process: the Government of Indonesia (GoI) represented by the Ministry of Finance (MoF) borrowed fund from WB and AIIB in foreign currency and then lent it to PT.SMI. The exchange rate risk generated in the transaction was borne by MoF. RIDF had adopted a ‘cost plus’ pricing policy which means the interest rate charged to the subnational government was based on the yield rate of a 20-year Indonesian government bond called SUN.
ASEAN Infrastructure Fund: ASEAN Infrastructure Fund is a dedicated fund established by member nations of the ASEAN and ADB. The fund provides loan to finance infrastructure investment projects in transport, energy, water and sanitation, environment and rural development, and social infrastructure sectors. This fund is an integral part of ASEAN’s effort to strengthen regional connectivity. It provides financing to sovereign or sovereign-guaranteed projects in the ASEAN region. All ASEAN Infrastructure Fund-financed projects are also financed by ADB. Projects to be financed need to fulfill certain key criteria: financial sustainability indicators, clear environmental goal and targets, and a roadmap for attracting private capital investment.63
C. Infrastructure Development Financial Institutions: Such institutions with detailed workings of project prioritization, project selection, and project financing are needed to help finance infrastructure projects in Nepal.
nRB has relaxed the rules, which allow the infrastructure bank to issue loans up to 90% of its credit to core capital and domestic deposit ratio.
63. https://www.adb.org/site/funds/funds/asean-infrastructure-fund

N e p a l I N f r a s t r u c t u r e 2 0 3 0 : I n v e s t m e n t a n d F I n a n c I n g n e e d s
70
Nepal Infrastructure Bank Ltd. has received the operating license in 2019 from NRB. The bank was established with joint investment from the government along with commercial banks, insurance companies, private business firms, group entrepreneurs, etc. The government owns 10% of the bank’s stock. The central bank has relaxed the rules, which allow the infrastructure bank to issue loans up to 90% of its credit to core capital and domestic deposit ratio.
The bank will have an authorized capital NPR 40 billion (USD 0.4 billion), issued capital of NPR 20 billion (USD 0.2 billion), and paid up capital of NPR 12 billion (USD.12 billion).64
The bank will be investing in infrastructure, particularly in construction, transportation, energy, urban development, special economic zone, information technology, etc. by making the required equity investment, opening letters of credit, and mobilizing long-term deposit.
D. Private Equity/Private Equity Firms: This system of financing makes it possible to pool money from a group of investors to raise funds to invest in infrastructure. Mutual fund is an example of private equity.
Dolma Impact Fund: Dolma Impact Fund, a private equity fund from Europe, is investing in infrastructure in Nepal. The fund has investment commitment of USD 26 million in Nepal. The fund has investors from the Development Bank of Austria, Dutch Good Growth Fund, etc. The fund makes equity investment as a strategic partner in Nepal. Investment ranges from USD 500,000 to 4 million.
The fund, which invested USD 3.2 million in Lower Likhu Hydropower Project with 28.1 MW capacity, was developed by Swet Ganga at an estimated total cost of NPR 5 billion ( USD .05 billion). The fund founder has received 3.2 million units of share of the company for investment in the project.65
E. Foreign Direct Investment (FDI): FDIs in infrastructure projects can also be an important source to finance infrastructure investment in
Nepal. There is a need for reforming policies to attract FDI. All regulations that make it difficult for foreign banks to invest in the country have to be revised. For example: currently, foreign banks/institutions can invest in Nepal only with the prior approval of DoI and NRB. The law also requires institutions to be registered in Nepal in order to provide loans to infrastructure projects.
F. Diaspora Financing: Remittance received can be turned into infrastructure investment by providing additional means to finance infrastructure to governments and companies and, in turn, rewarding the migrant workers with financial return. Some ways to use remittance for infrastructure investment are: diaspora bonds, diaspora investment funds, diaspora insurance and pension funds, diaspora direct investment, securitization of future remittance inflows (where banks can be allowed to leverage future remittance receipts to obtain capital), etc.
Diaspora Bonds: They refer to the bonds issued by a country to its diaspora population to tap their wealth in the adopted developed countries, issued in different ways by countries such as the State of Israel Bonds, Resurgent India Bonds (RIB), and India Millennium Deposit (IMD) from India, and Diaspora bonds issued by Lebanon and Sri Lanka, etc. India has issued these bonds on three different occasions, raising almost 11.3 billion USD. The unique feature of the offer for investors living far from their land is that this investment represents their patriotism or desire to do “good” for their country.
The most recent issuance was as an IMD scheme by the State Bank of India, launched on October 21, 2000 with a total value worth 2 billion USD equal to IR 9000 crores at the prevalent exchange rate. It was issued as five-year foreign currency deposits, denominated in US dollars, pound sterling, and euro with an interest rate of 8.5%, 7.85%, and 6.85 % per annum payable half-yearly in the three currencies, respectively. Investment in these instruments was allowed only for non-resident Indians (NRIs)/overseas and corporate bodies
64. https://kathmandupost.ekantipur.com/news/2019-02-13/nepal-infrastructure-bank-receives-operating-licence.html65. https://myrepublica.nagariknetwork.com/news/dolma-impact-fund-becomes-swet-ganga-hydros-shareholder/
some ways to use remittance
for infrastructure investment
are: diaspora bonds, diaspora
investment funds, diaspora
insurance and pension funds, diaspora direct
investment, securitization of
future remittance inflows (where
banks can be allowed to
leverage future remittance
receipts to obtain capital), etc.

N e p a l I N f r a s t r u c t u r e 2 0 3 0 : I n v e s t m e n t a n d F I n a n c I n g n e e d s
71
(OCBS banks) acting in a fiduciary capacity on behalf of the NRIs/OCBs. Issued with the assurance that full repatriation of the principal and interest is possible, the transaction was managed by SBI Capital Markets who received an initial indicative commitment of 5 billion USD.
Out of the total fund collected (2 billion USD), 40% was invested in government securities and the remaining 60% was used to fund infrastructure projects. The fund was distributed through the list of participating banks who also worked to collect the funds. These collecting banks were given 50% of the amount mobilized by them as a five-year loan at 10% per annum and the funds so received by the participating banks were used to finance infrastructure projects. To further support successful implementation of the program, there were no statutory obligations other than 40% investment in government securities. There was also no CRR requirement on such funds.
G. Viability Gap Funding (VGF): VGF, is a grant to support projects economically justified but financially not viable, issued by the government for projects that will become feasible and commercially viable for the private sector. In particular, provision of funds not limited by annual budgetary allocation is ideal for private sector investment as it minimizes political risk.
VGF in Nepal: The government has decided to provide NPR 94 billion (USD .94 billion) as VGF for the development of the Budhi Gandaki Hydropower Project. This is a 1,200 MW storage type project with estimated cost of NPR 270 billion (USD 27 billion). With VGF from the government, the developer will have to invest NPR 176 billion (USD 17.6 billion).66
VGF in Vietnam: The Private Infrastructure Development Group (PIDG) through its Technical Assistance Facility (TAF) has provided Viability Gap Funding (VGF) for the construction of Coc San Hydropower project in Vietnam. This innovative gesture instrument provided support to offset the partial up-
front preparation cost listed as pro-poor infrastructure requirement that has to function in a challenging environment. The project was revitalized with a grant by TAF of 5 million USD in 2013. This worked to bridge the gap in funding of an infrastructure project at the time of financial closure. In addition to VGF grant, TAF also provided technical assistance and capacity building to the implementing agency, i.e. PIDG, to access the implementation of VGF grants.
Coc San hydropower project came to a halt in 2011 due to its high cost which made the project financially infeasible for the private investors. In 2012, InfraCo Asia Development (IAD) came in as a majority shareholder of the local developer of the project Lao Cai Renewable Energy (LCRE). TAF provided VGF grant to IAD to render the project financially viable. The grant was utilized by IAD to conduct an Environmental and Social Impact Assessment (ESIA) to meet the IFC standards, with specific considerations for pro-poor benefits. With these results, IAD secured 23 million USD debt financing from Saigon and Hanoi Commercial Bank. This debt funding and equity funding of investors allowed the project to reach its financial closure to successfully.
H. ADB Local Currency Borrowings: One of the financing tools introduced by ADB targeting its developing members includes local currency borrowings, introduced to develop the member and domestic capital market. ADB has launched a broad program titled ASEAN + 3 Bond Market Initiative with a primary goal to provide support for the development of the regional bond market. The mechanism established a 10 billion USD equivalent Asian Currency Note Program (ACNP) to issue notes in regional currencies.67 The program has thus been identified as a significant milestone for Asian Capital Market Development. By issuing bonds in local currency, ADB offers substantial benefits to potential investors, such as exposure to local currencies and interest rates along with a financial instrument of high credit quality, opportunity for investment diversification, and offer of longer-dated investment instruments.
the gon has decided to provide Usd .94 billion viability gap Funding for development of Budhi gandaki Hydropower Project.
66. https://kathmandupost.ekantipur.com/news/2018-0217/rs94b-viability-gap funding-okayed-for-budhi-gandaki.html67. https://www.adb.org/site/investors/adb-debt-products/local-currency-borrowings

N e p a l I N f r a s t r u c t u r e 2 0 3 0 : I n v e s t m e n t a n d F I n a n c I n g n e e d s
72
Since its introduction, it has already issued bonds in Hong Kong dollar, Malaysian ringgit, Philippine peso, Singapore dollar, Indian rupee, PRC yuan, etc. Most of the issues currently outstanding are in Indian rupee and PRC yuan.
Recently, in January 2019, it has raised around 80 million USD (equivalent to 30.4688 billion tenge) by issuing two tranches of local currency bonds in Kazakhstan. The terms and conditions of the bonds issued are: five and seven years of maturity with an option of early redemption “call” option from third and fifth years respectively. The bonds pay a floating interest
rate which was dependent on the Kazakhstan Consumer Price Index (CPI). To make the instrument attractive for local investors, it was also listed on the Kazakhstan Stock Exchange.68
I. Blended Financing: Blended financing is strategic use of concessional finance to catalyze additional private sector investment. Combining grants, budgetary support, and concessional assistance from development finance partners to create a bigger pool of fund to invest in infrastructure, it can help make project commercially viable by improving return of the investment.
Blended financing requires development finance institutions to work closely with commercial banks to enhance guarantee of products such as interest rate and foreign exchange swap guarantees, local currency guarantees, etc.
6.7. eFFectIve maNagemeNt aNd INgeNIous WaYsFor infrastructure development, the means of increasing the productivity of infrastructure (such as effective prioritization and selection of projects, effective management of existing infrastructures, and effective coordination among the parties involved) are as important as the formulation of new legal and financial policies. In general, countries tend to invest in poorly conceived projects, often influenced by political decisions, take long time to approve (possibly due to rent seeking opportunities), are not interested in innovation, incur time and cost overruns, and do not make most of the existing infrastructure assets. In this regard, Nepal is no exception.
A report published by the McKinsey Global Institute (MGI) in 2013 (Dobbs et al.) highlights the importance of making the most of infrastructure investment by increasing the productivity of infrastructure. The report argues that by improving and adopting the best practices in selecting and delivering new infrastructure projects and by effectively managing the existing infrastructure, countries
a survey of investors was conducted to assess the capacity, willingness, and constraints to the private sector, in investing in infrastructure. the objective was to survey major investors (mostly members of the cNi) in Nepal. a summary of findings from the survey:
n promising sectors: energy and urban development.
n Willing to invest in: solar, hydro, toll roads, road maintenance, construction of bridges, water utilities management, smart metering, urban traffic management, and urban real estate.
n current investment capacity: usD 5 to 50 million.
n preferred project duration: three to seven years.
n Duration required for approval, license, and permit: 12 to 36months.
n Major policy hurdles: public procurement act, land acquisition act, lack of clear fDi regulation, absence of a single window policy, delay in license and approval.
n Major non-policy hurdles: lack of input, lack of skilled labor.
n Major financial hurdles: exchange rate risk, high cost of capital, interest rate risk, absence of a single institution with the capacity to finance mega projects.
Box 12 capacItY, WIllINgNess, aNd coNstraINts oF tHe prIvate sector
68. https://www.adb.org/news/adb-issues-first-local-currency-bonds-kazakhstan

N e p a l I N f r a s t r u c t u r e 2 0 3 0 : I n v e s t m e n t a n d F I n a n c I n g n e e d s
73
could obtain the same amount of infrastructure for 40% less investment. This arises from improved infrastructure productivity. The report recommends improvement in project design and selection, streamlining delivery, and making most out of the existing infrastructures to optimize the infrastructural need. Nepal can also adopt it to derive maximum benefits from infrastructure investment. Some of the benefits that could accrue are:
Prioritization and selection of projectsEffective prioritization of projects and efficient procurement system are important for a healthy capital expenditure (Dobbs et al., 2013). Project prioritization is critical for Nepal also, due to the fact that the country faces a situation of huge demand but limited resources to finance the infrastructure.
The GoN in 2002 adopted the Medium Term Expenditure Framework (MTEF) for project selection and prioritization. But this framework is suffering from a number of inefficiencies and political interferences. There are cases where projects are listed in the yearly work plan and budgets but are not synchronized with the MTEF (Sigdel, 2014). Technically, under the MTEF, projects are categorized as P1, P2, and P3, where P1 projects are guaranteed for funding whereas the funding for P2 and P3 projects depends on the availability of funds.
The process of prioritization and selection of project should be free from political agenda and political rhetoric, and should be based on the capacity of the government to fund. The current practice of selecting numerous small projects with no significant impact on growth and welfare should be replaced by fewer effective mega projects with multiple benefits.
There is also a need to change the national discourse on prioritizing projects. One of the common discourses relates to Nepal’s hydropower potential. Here the question that looms large is: Does Nepal need to harness its full hydroelectricity potential? Around 4000-5000 MW of uninterrupted electricity should
be sufficient to meet our needs. But if we were to realize our full potential, what would we do with the surplus electricity? Would it serve for export? If so, are we capable of exporting it to India, China, and Bangladesh? If not, Nepal should focus on other infrastructure projects. Spending a billion dollars on the energy sector would yield results different from those yielded by spending the same amount on transport. Thus it is very important to come up with priority sectors to make appropriate investments and make the most of those investments.
Saving with better co-ordination among the parties involvedInfrastructure governance and delivery system need to be revised in Nepal for timely completion and effective benefit from the infrastructure projects. Authorities responsible for different types of infrastructure need to closely coordinate with each other with common understanding of the socio-economic goals and roles of the infrastructure projects. The political and technical responsibilities of those authorities must avoid conflicts of interests to reduce political interference in infrastructure development.
There is also need for a reliable database for oversight, long-term planning, and co-ordination among the stakeholders involved. The database can be centralized with information on the current state of infrastructure, ongoing projects, planned and proposed projects, and bids for proposals. This can speed up infrastructure delivery process.
Lack of coordination among the involved parties and poor design, selection, and execution of projects cause time and cost overruns. Even foreign contractors/companies with a good track record of completing mega projects in other countries are incurring time and cost overruns in Nepal. This clearly indicates lack of coordination among the parties involved. One solution to the problem is a system of one window effective coordination among the ministries. For example, hydropower and transmission lines projects require close coordination among the Ministry of Forest
By improving and adopting the best practices in selecting and delivering new infrastructure projects and by effectively managing the existing infrastructure, countries could obtain the same amount of infrastructure for 40% less investment.

N e p a l I N f r a s t r u c t u r e 2 0 3 0 : I n v e s t m e n t a n d F I n a n c I n g n e e d s
74
& Environment, and the Ministry of Energy, Water Resource & Irrigation. This would speed up the process of land acquisition and forest clearance, not just for hydropower projects but also for other infrastructure projects. Coordination with the parties involved can also put an end to the practice of late tender call, late payment to contractors, and delays in work.
Managing existing infrastructure Managing the existing infrastructure includes effective utilization of assets, prevention of leakages optimal repair and maintenance, and smart management of demands.
Recently, there have been numerous road widening projects in operation in Nepal. However, in the absence of proper traffic management, congestion will increase fast and the benefits of road expansion could vanish. Hence, instead of solely focusing on road expansion projects, attention to the management of current traffic and roads may achieve the results to be obtained by road expansion.
For the energy sector, smart management can entail prevention of leakage of electricity with smart metering technology and smart grid. Currently, about 30% of the electricity generated is lost due to leakages. Preventing this is equivalent to generating 30% more energy with the existing power plants. Energy efficiency can also be achieved by promoting energy-efficient household appliances such as refrigerators, light bulbs, television sets, etc.
With the increasing trend of privately owned vehicles (7.66% of total vehicle population) and motorcycles (constituting 78% of the total number of vehicle), traffic management in the core area of Kathmandu valley is worsening. to improve traffic management in Kathmandu valley, the possible options are: a) improving public transport; b) widening of streets with flyovers; c) staggering working hours; d) restricting motorcycles; e) imposing additional tax on private vehicles entering the core business areas; and, f ) promoting walking and bike riding. One of the initiatives taken is to establish mass transit systems in Kathmandu valley.
One study, done under the Kathmandu sustainable urban transport project (Ksutp) on mass transit options for selecting mass transit system and corridors (Metro, lrt, Brt cable car, etc.) has identified three mass transit corridors, namely: Budhanilkantha – tripureswor – Godavari (North south route), Bhaktapur- shahid Gate– Gongabu
(North- West- east route), and Jorpati – lazimpat – shahid Gate– NayaNaikap (North- east-West route). it has recommended an X-shape route operational plan, selecting the best one among the three alternatives to address equitable distribution of steel wheel metro rail service (elevated and underground) across different areas and in different directions at an optimized cost (both capex and Opex).
a full-scale feasibility study is now underway to examine the technical and financial viability of the route operation plan and the mode of transport recommended by the study. the mandate of the study is also to suggest options on policy, regulation, and institutional arrangements related to implementing mass transit in Kathmandu valley. in the meantime, the government is also talking to various development partners including asian infrastructure investment Bank (aiiB) and other bilateral development partners for possible funding for mass transit system in Kathmandu valley.
Box 13 maNagINg traNsport IN KatHmaNdu valleY
Nepal has witnessed a rapid growth of motorized transport vehicles. One of the much-sought strategies of sustainable transport program is to promote electric vehicles in the transport fleet. the Government aspires to induce 50% electric public transport by 2030.
as a part of the asian environmentally sustainable transport initiative, the united Nations centre for regional Development (uNcrD) has supported the Government of Nepal (GoN) in preparing a National sustainable transport strategy (Nsts). strategies to promote electric vehicles are some of the key features of the Nsts.
Box 14 electrIc veHIcles

N e p a l I N f r a s t r u c t u r e 2 0 3 0 : I n v e s t m e n t a n d F I n a n c I n g n e e d s
75
utilization of tBM is still considered an expensive proposition for construction projects in Nepal. this is true if we were to consider individual tunnel - based infrastructure projects.in hydropower, tunneling is essential but not feasible with tBM for single projects. However, economies of scale in the cost of tunneling can be achieved by using a single tBM for multiple projects. the use of single tBM for multiple projects is technically possible and economically viable if there are sufficient number of tunnel- based projects which have similar features – similar geographical conditions, similar shape and size of tunnel, and similar stages of project development.
Hence, a single tBM can be used for multiple projects for tunneling in various infrastructure sectors such as hydropower, road, and water and sanitation. this innovation raises efficiency by attaining early completion of construction work and better progress rate has the potential to save significant amounts of time and cost.
Source: Tunneling Process Innovation in Nepal (TuPIN) by
Bhattarai et al, published in Nepal Infrastructure Summit
2017 Souvenir.
Box 15utIlIZatIoN oF tuNNel BorINg macHINe (tBm) IN Nepal
Repair and maintenance can be optimized through proper inspection and by considering the value of assets over the lifetime of projects. This can be achieved by balancing long-term construction costs with short-term repair and maintenance costs. Considering such an approach during the construction of infrastructure projects can save short-term repair and maintenance costs. Such an approach is urgently needed in building roads in Nepal which suffer from frequent rework, repair, and maintenance problems.
Raising construction capacity using new technology69
The building capacity of the construction industry is essential to increase productivity, improve quality, and ensure timely completion of infrastructure projects. This can be done by encouraging them to use modern equipment and advanced construction techniques. For instance, promoting the use of tunneling technology in the construction of roads and pipeline for water supply can complete projects much sooner than through the traditional methods. The government has to provide subsidies and tax incentives to the construction companies on import of such modern equipment.
The government can also maintain a database of skilled and unskilled workers in the construction and project management sectors which enables the government to focus on particular sectors and skill sets to build up capacity to meet labor demand.
In the case of mega projects taken up by foreign companies in the country, the government has to negotiate to help and engage the domestic
contractors in technology and knowledge transfer. Among the 13,000 facilitating contractors registered in Nepal, 3,000 are actively involved. The policy of engaging domestic contractors can increase the capacity of local resources. Negotiations can also be used to promote domestic construction materials and domestic industries.
69. Outcome of discussion with Ram Sharan Deuja, Secretary General and Rudra Sharma, Vice President, Federation of Contractor’s Association of Nepal (FCAN)
economies of scale in the cost of tunneling can be achieved by using a single tBm for multiple projects.

N e p a l I N f r a s t r u c t u r e 2 0 3 0 : I n v e s t m e n t a n d F I n a n c I n g n e e d s
76
coNclusIoN
Investment and Financing Needs
N e pa l I N F r a s t r u c t u r e 2 0 3 0

N e p a l I N f r a s t r u c t u r e 2 0 3 0 : I n v e s t m e n t a n d F I n a n c I n g n e e d s
77
A well designed, constructed, and managed infrastructure is an important foundation for economic growth, reduction of poverty, and improvement of the standard of living in a country. In Nepal, however, the
infrastructure is not only inadequate, but also fragile and poorly managed. Inadequate generation and supply of energy, weak transport connectivity, poor water supply and sanitation, and haphazard urbanization are impeding the growth of the country. To provide impetus to economic growth and development of the country, investment in infrastructure is essential.
Despite the growing awareness of the importance of increased infrastructure investment in the country, investment needs and gaps in the priority sectors are not clear. It was in such a context that this study was conceived and prepared. In the course of estimating the investment needs and gaps, the study also makes a strong case for the role of the private sector to fill in the gap and provides a way forward.
Methods of estimationThe study estimates the investment needs for the country by 2030 using two methods– the top-down and the bottom-up. The first method uses the macroeconomic forecasting technique to estimate the infrastructure needs under three different GDP growth scenarios: normal growth at 5%, optimistic growth at 7.5%, and highly optimistic growth at 10% per annum. The estimation of investment is based on the relationship between GDP and variables that represent infrastructure investment (road density, energy generated per capita, percentage of population with access to water and sanitation services). The bottom-up method in this study estimates the investment needs by considering ongoing projects, projects in the pipeline, and projects required to meet the international target
(i.e., SDGs). For both methods, the study also estimates investment needs, factoring in climate change adjustment. In both methods the underlying assumption is that the project will not incur time and cost overruns. The study did not account for time and cost overruns due to time, data, and budget constraints.
Investment needsThe top-down method estimates (baseline estimate) investment requirement of USD 29.72 billion to maintain 5% growth, USD 36.92 billion to maintain 7.5% growth, and USD 45.25 billion to maintain 10% growth between 2019 and 2030, which translates to 8.14%, 8.74%, and 9.95% of the estimated GDP.
According to the bottom-up method for the energy sector, considering meeting power demands for 13,000 MW, 15,000 MWs, and 18,000 MW with different mixes of run-of-the river and storage projects by 2030, the investment need ranges from USD 23 to 36 billion. For the transport sector, which considers giving continuity to current projects and construction of additional 120,000 km of road, the figure comes to USD 84.88 billion by 2030. For the water and sanitation sector, which considers meeting the targets of the Sector Development Plan (SDP) and SDG, the figure is USD 31 billion. For the urban development sector, considering the four scenarios of meeting 60%, 75%, 90%, and 100% of the NUDS targets, the need ranges from USD 40.05 to 75.84 billion by 2030.
Minimum annual investment need under the top-down method (from 2019 to 2030) is USD 2.63 billion to maintain 5% growth and the maximum is USD 4.63 billion to maintain 10% growth. In the case of the bottom-up method, the minimum investment need is USD 16.54 billion and maximum is USD 20.54 billion.
7 Conclusion

N e p a l I N f r a s t r u c t u r e 2 0 3 0 : I n v e s t m e n t a n d F I n a n c I n g n e e d s
78
Investment gapsThe study also estimated the investment gap in the priority sectors. The gap was estimated on the basis of the current capacity of the government and other institutions to finance infrastructure projects. Over the period of 2019-30, the gaps in the energy, transport, water and sanitation, and urban development are: USD 4.39 to USD 19.06 billion, USD 48.88 billion, USD 11.77 billion, and USD 15.62 to 51.57 billion respectively.
Role of the private sectorGiven the size of the Nepalese economy (NPR 3007 billion (USD 30 billion) in 2017/18 and NPR 34643 billion (34 billion USD) in 2018/19) and the magnitude of the estimated investment gap considering availability of funding sources, the government alone cannot fill the gap through public expenditure. The capital expenditure, roughly 30% of the total budget of the country is not enough, given the significant size of estimated investment gap. There is also additional pressure on capital expenditure as a result of the new federal structure, which has increased the recurrent expenditure. The government also cannot fill the gap by borrowing more as the current debt to GDP ratio (27%) is already high, and increasing it would negatively affect capital formation and growth of the country. The viable option under such a scenario becomes leveraging the private sectors (domestic and foreign).
The private sector can help fill the gap by investing in infrastructure solely or through PPP arrangements. There are bottlenecks, however, that impede the involvement of both the public and private sectors in infrastructure investment. There are also major policy hurdles that pose major challenges to such investment. Institutional, policy, financing reforms and strategies to facilitate infrastructure investment in the country becomes therefore necessary. Hence, this study recommends the following measures:
n Formulation of a unified infrastructure policy with one window system to reduce the duration of the approval process as well as confusion and contradictions among the competing acts, policies, and concerned ministries
n Effective enforcement of the newly enacted Public Private Partnership and Investment Act (2019)
that has provisions for one stop center, unsolicited proposals, VGF, and revolving fund for land acquisition
n Effective enforcement of the newly enacted FITTA (2019) providing for FDI approval within a week, 100% foreign investment, venture capital fund, etc.
n Enactment of the new Land Acquisition Act to make land acquisition easier for infrastructure projects.
n Changes in the current process of awarding contract to the lowest bidder. This process does not consider quality and effective execution of the project. There is also a need for the system of calling for submission bids up and beyond the needs and capacity of government. This calls for a major revision of the Public Procurement Act/Rules (2007/08).
n Clearly defined roles and responsibilities as also coordination among the three tiers of government.
n Introduction of other modalities of infrastructure financing, such as Viability Gap Funding (VGF) and provision for project financing (or non-recourse financing), debt financing, infrastructure development fund, etc.
n Enhancement of the capacity of construction industry so that Nepal can build infrastructure with it’s own capital and human resources.
n Encourage the use of modern technology, such as tunnel boring machines.
n Effective design, planning, and execution of projects. For example, changing the current practice of road construction system which involves track opening, followed by upgrading and then surfacing.
Additionally, the study also recommends effective prioritization and selection of projects, better coordination among the parties involved, and effective management of the existing infrastructure to make the most of investments made in infrastructure.
A way forwardThe present study is the first of this kind to estimate infrastructure investment needs and gaps in the priority sectors (energy, transport, water and sanitation, and urban development) in Nepal using two methods namely: top- down and bottom- up. Following the study, next step is to update periodically the current state of infrastructure and the estimates of investment needs and gaps in Nepal.

N e p a l I N f r a s t r u c t u r e 2 0 3 0 : I n v e s t m e n t a n d F I n a n c I n g n e e d s
79
ADB. 2016. ADB Water Bonds. Manila: Asian Development Bank (ADB).
ADB. 2016. Asian development outlook 2016 update: Meeting the low-carbon growth challenge. Manila, Philippines: Asian Development Bank.
ADB. 2017. Meeting Asia’s infrastructure needs. Mandaluyong City, Philippines: Asian Development Bank.
ADB. 2018. ADB Water Bonds - Water for All. Manila: Asian Development Bank.
ADB and ADBI. 2009. Infrastructure for a seamless Asia. Manila, Philippines: Asian Development Bank and Tokyo, Japan: Asian Development Bank Institute.
Andrés, L., Biller, D., Dappe, M. H. 2014. Infrastructure gap in South Asia: Infrastructure needs, prioritization, and financing. Washington, DC: The World Bank.
Annez, P. C. and Buckley, R. 2009. Urbanization and growth: Setting the context. In M. Spence, P.
C. Annez, and R. M. Buckley (Eds.), Urbanization and growth. Commission on growth and development (pp. 1–45). Washington, DC: The World Bank.
Banister, D. and Berechman, Y. 2001. Transport investment and the promotion of economic growth. Journal of Transport Geography, 9(3), 209-218.
Basnett, Y., Henley, G., Howell, J., Jones, H., Lemma, A., and Pandey, P. R. 2014. Structural Economic Transformation in Nepal: A Diagnostic Study, submitted to DFID Nepal. London: Overseas Development Institute.
Bhattacharya, B. N. 2010. Estimating Demand for Infrastructure in Energy, Transport, Telecommunications, Water and Sanitation in Asia and the Pacific 2010-2020. Manila: Asian Development Bank Institute.
Bhattarai, S., Shah S., Sunwar S. C., Sharma, R. H., Bisht K. B., and Pandey B.R. 2017. Tunneling process innovation in Nepal. In Nepal Infrastructure Summit Souvenir. Kathmandu Nepal: Confederation of Nepalese Industries.
Bogetic, Z. and Fedderke, J. W. 2006. International benchmarking of infrastructure performance in the Southern African customs union countries. South African Journal of Economics, 74(3): 557-574.
CBS. 2012. National Population and Housing Census 2011: National Report. Kathmandu, Nepal: Central Bureau of Statistics.
Cosic, D., Dahal, S., and Kitzmuller, M. 2017. Climbing Higher: Toward a Middle-Income Nepal. Washington, DC: World Bank Group. Retrieved from: thttp://documents.worldbank.org/curated/en/358501495199225866/Climbing-higher-toward-a-middle-income-Nepal
Dethier, J. J. and Moore, A. 2012. Infrastructure in developing countries: An overview of some economic issues. ZEF- Discussion Papers on Development Policy No. 165. Bonn: Center for Development Research.
Dickey, D.A. and Fuller, W.A. 1979. Distribution of the estimators for autoregressive time series with a unit root. Journal of the American Statistical Association, 74(366), 427–431.
Dickey, D.A. and Fuller, W.A. 1981. Likelihood ratio statistics for autoregressive time series with a unit root. Econometrica, 49(4), 1057–1072.
Dixit, A. M. 2017. Infrastructure Finance Strategies for Sustainable Development in Nepal. Available at SSRN: https://ssrn.com/abstract=2924424.
Dobbs, R., Pohl, H., Lin, D. Y., Mischke, J., Garemo, N., Hexter, J., Matzinger, S., Palter, R., and Nanavatty, R. 2013. Infrastructure productivity: How to save $1 trillion a year. McKinsey Global Institute.
DoLIDAR. 2016. Statistics of Local Road Network 2016. Kathmandu, Nepal: Department of Local Infrastructure Development and Agriculture Roads.
References

N e p a l I N f r a s t r u c t u r e 2 0 3 0 : I n v e s t m e n t a n d F I n a n c I n g n e e d s
80
DoR. 2016. Statistics of Road Network 2015/16. Kathmandu Nepal: Department of Roads.
DUDBC. 2007. National Urban Policy, 2007. Kathmandu, Nepal: Ministry of Physical Planning and Works, Government of Nepal.
Engle, R. F. and Granger, C. W. 1987. Co-integration and error correction: Representation, estimation, and testing. Econometrica, 55 (2), 251-276.
Fay, M. 2000. Financing the future: Infrastructure needs in Latin America, 2000-05 (World Bank Working PaperNo. 2545). Retrieved from https://openknowledge.worldbank.org/bitstream/ handle/10986/19965/wps2545.pdf?sequence=1&isAllowed=y
Fay, M. and Yepes, T. 2003. Investing in infrastructure: What is needed from 2000 to 2010? (World Bank Policy Research Working Paper Series 3102). Retrieved from http://documents. worldbank.org/curated/en/502041468739488372/pdf/multi0page.pdf
GoN. 2017. Report to the committee to prepare investment modality for Budhigandaki Hydropower Project. Kathmandu, Nepal: Government of Nepal.
Hutton, G., Haller, L., Water, S., and World Health Organization. 2004. Evaluation of the costs and benefits of water and sanitation improvements at the global level (No. WHO/SDE/ WSH/04.04). Geneva: World Health Organization.
IBN. 2017. http://www.ibn.gov.np/our-projects. Retrieved on July 2, 2017.
IFC. 2017. Climate Investment Opportunities in South Asia: An IFC Analysis. Washington, D.C.: International Finance Corporation.
Johansen, S. 1991. Estimation and hypothesis testing of cointegrating vectors in Gaussian vector autoregressive models. Econometrica, 59 (6), 1551–1580.
Johansen, S. 1995. Likelihood-based inference in cointegrated vector autoregressive models. Oxford: Oxford University Press.
Kandel, K. 2018. A Comprehensive Study on Hydropower Potential of Nepal. Retrieved from: http://www.wecan.org.np/uploaded/Hydro%20Potential%20of%20Nepal.pdf
Kharas, H. 2010a. The emerging middle class in developing countries (OECD Working Paper. No. 285). Retrieved from https://www.oecd.org/dev/44457738.pdf
Kharas, H. 2010b. Latin America: Is average good enough? In H.S. Kohli, C. Loser, and A. Sood, (Eds.), Latin America 2040: Breaking Away from Complacency: An Agenda for Resurgence (pp. 71-100). Washington, DC: Sage.
Khatiwada, Y. R., Awasthi, G. D., Ghimire, K. D., Devkota, and Lal, K. 2015. Municipal Finance Framework for National Urban Development Strategy (NUDS) of Nepal. Kathmandu, Nepal: Ministry of Urban Development.
KUKL. 2017. Kathmandu Valley Waste Water Management Project: Semi-Annual Social Monitoring Report. Kathmandu, Nepal: Kathmandu Upatyaka Khanepani Limited.
Lee, C. C. 2005. Energy consumption and GDP in developing countries: Cointegrated panel analysis. Energy economics, 27(3), 415-427.
MacKinnon, J.G. 1996. Numerical distribution functions for unit root and cointegration tests. Journal of Applied Econometrics, 11(6), 601-618.
Margon Research and Consultancy. 2013. Nepal’s Electricity Crisis: Survey and Finding Updates for 2013. Lalitpur, Nepal: Margon Research and Consultancy, Center for Inclusive Growth.
MoF. 2016. Annual Budget Speech. Kathmandu, Nepal: Ministry of Finance, Government of Nepal
MoF. 2017. Economic Survey 2073/74. Kathmandu, Nepal: Ministry of Finance, Government of Nepal.
MoF. 2018. Annual Budget Speech. Kathmandu, Nepal: Ministry of Finance, Government of Nepal.
MoFA. 2015. ODA White Paper on Development Cooperation. Tokyo, Japan: Ministry of Foreign Affairs.

N e p a l I N f r a s t r u c t u r e 2 0 3 0 : I n v e s t m e n t a n d F I n a n c I n g n e e d s
81
MoPIT. 2016. Strategic Plan for 2073-2078. Kathmandu, Nepal: Ministry of Physical Infrastructure and Transport.
MoUD and Confederation of Indian Industry. n.d. Compendium on Public-Private Partnership in Urban Infrastructure - Case Studies. Haryana: Confederation of Indian Industry.
MoUD. 2017. National Urban Development Strategy, 2017. Kathmandu, Nepal: Ministry of Urban Development, Government of Nepal.
MoWSS. 2016. Water, Sanitation and Hygiene: Sector Status Report. Kathmandu, Nepal: Ministry of Water Supply and Sanitation, Government of Nepal.
Narayan, P. K. 2005. The saving and investment nexus for China: Evidence from cointegration tests. Applied Economics, 37(17), 1979-1990.
NEA. 2016. Nepal Electricity Authority: A Year in Review - Fiscal Year 2015/2016. Kathmandu, Nepal: Nepal Electricity Authority.
NEA. 2017. A Year in Review-Fiscal Year 2016/17. Kathmandu, Nepal: Nepal Electricity Authority.
NEA. 2018. A Year in Review-Fiscal Year 2017/18. Kathmandu, Nepal: Nepal Electricity Authority.
NOC. 2017. www.nepaloil.com. Retrieved on June 29, 2017.
NPC. and ADB. 2016. Envisioning Nepal 2030. Proceedings of International Seminar: Kathmandu, Nepal: National Planning Commission and Asian Development Bank.
NPC. 2011. Sanitation and hygiene master plan Nepal. Kathmandu, Nepal: National Planning Commission, Government of Nepal.
NPC. 2016a. Approach Paper of Fourteenth Three Year Plan 2016-2018. Kathmandu, Nepal: National Planning Commission, Government of Nepal.
NPC. 2016b. Nepal SDG Report. Kathmandu, Nepal: National Planning Commission, Government of Nepal.
NPC. 2016c. Fourteenth Plan (Fiscal Year2016/17-2018/19), Approach Paper. Kathmandu, Nepal: National Planning Commission, Government of Nepal.
NPC. 2017a. Fourteenth Plan (Fiscal Year 2073/74-2075/76) (in Nepali). Kathmandu, Nepal: National Planning Commission, Government of Nepal.
NPC. 2017b. Sustainable Development Goals Status and Roadmap: 2016-2030. Kathmandu, Nepal: National Planning Commission, Government of Nepal.
NPC. 2019. Fifteenth Five Year Plan ( 2019/20-2023/24). Kathmandu, Nepal: National Planning Commission, Government of Nepal.
NPC. and UNDP. 2013. Millennium Development Goals (MDG) Progress Report 2013. Kathmandu, Nepal: National Planning Commission, Government of Nepal.
NSHSC. 2011. Sanitation and Hygiene Master Plan. Kathmandu, Nepal: National Sanitation and Hygiene Steering Committee.
Pesaran, M.H. and Shin, Y. 1999. An autoregressive distributed lag modelling approach to cointegration Analysis. In S. Strom (Ed.). Econometrics and Economic Theory in the 20th Century: The Ragnar Frisch Centennial Symposium (pp. 371-413). Cambridge: Cambridge University Press.
Pesaran, M. H., Shin, Y., and Smith, R. J. 2001. Bounds testing approaches to the analysis of level relationships. Journal of Applied Econometrics, 16(3), 289-326.
Regmi, S. and Vinaik, J. 2017, Mechi to Mahakali. The Himalayan Times.
Ruiz-Nunez, F., and Wei, Z. 2015. Infrastructure investment demands in emerging markets and developing economies. World Bank Policy Research Working Paper. No. 7414. Retrieved from http://documents.worldbank.org/curated/en/141021468190774181/pdf/WPS7414.pdf

N e p a l I N f r a s t r u c t u r e 2 0 3 0 : I n v e s t m e n t a n d F I n a n c I n g n e e d s
82
Sigdel, S. 2014. A Description and Analysis of the Budget Formulation and Implementation Process in Nepal. Kathmandu, Nepal: Alliance for Social Dialogue.
Subedi, B. P. 2014. Urbanisation in Nepal: Spatial Pattern, Social Demography and Development. In Population Monograph of Nepal, Volume III (Economic Geography) (pp. 95-154). Kathmandu, Nepal: Central Bureau of Statistics.
Subedi, B. R. 2016. Government Revenue and Some Related Issues. Kathmandu, Nepal: Rupantaran - Nepal Rastra Bank Employees Association.
TDF. 2016. Municipal Finance Framework for the National Urban Development Strategy (NUDS) of Nepal. Kathmandu, Nepal: Town Development Fund.
UNCRD. 2015. National Sustainable Transport Strategy (NSTS) for Nepal (2015~2040). Nagoya, Japan: United Nations Centre for Regional Development.
UN DESA. 2015. World Urbanization Prospects - The 2014 Revision. United Nations Department of Economic and Social Affairs.
UNDP. 2012. One Planet to Share: Sustaining Human Progress in a Changing Climate. United Nations.
UN-ECOSOC. 2016. Smart cities and infrastructure: Report of the Secretary-General. United Nations Economic and Social Council.
UN-Habitat. 2013. State of the World’s Cities 2012/2013 – Prosperity of Cities. United Nations Human Settlements Programme.
WECS. 2005. National Water Plan. Kathmandu, Nepal: Water and Energy Commission Secretariat.
WECS. 2017. Electricity Demand Forecast Report (2015-2040). Kathmandu, Nepal: Water and Energy Commission Secretariat.
WHO and UNICEF. 2017. Progress on drinking water, sanitation and hygiene: 2017 update and SDG baselines. Geneva: World Health Organization and United Nations Children’s Fund.
Wilson, D. and Purushothaman, R. 2006. Dreaming with BRICs: The path to 2050. In S.C. Jain (Ed.),Emerging economies and the transformation of international business: Brazil, Russia, India and China (BRICs) (pp. 3-45). USA: Edward Elgar Publishing Limited.
World Bank. 2014. A vision for Nepal: Policy notes for the government: Three “I”s for growth- investment, infrastructure, inclusion. Washington, DC: World Bank Group. Retrieved from:http://documents.worldbank.org/curated/en/697511468292238000/Main-report
World Bank. 2018. Nepal Systematic Country Diagnostic. Washington, DC: World Bank Group. Retrieved from:http://documents.worldbank.org/curated/en/361961519398424670/Nepal- Systematic-country-diagnostic
World Health Organization. 2018. Nepal–WHO country cooperation strategy (CCS): 2018–2022. Kathmandu, Nepal: World Health Organization.
Yepes, T. 2008. Investment needs in infrastructure in developing countries: 2008-2015. Washington, DC: The World Bank, mimeo.

N e p a l I N f r a s t r u c t u r e 2 0 3 0 : I n v e s t m e n t a n d F I n a n c I n g n e e d s
83
a1: national Pride Projects in the priority sectors in nepal
PRoJects sectoRs RemaRKs
upper tamakoshi Hydropower project
energy the largest hydropower run-of-river project in Nepal (456 MW) entirely funded by domestic financial institutions and companies. set to be completed in 2018.
Budhigandaki Hydropower project
energy a storage type hydropower project with capacity of 1200 MW. cost usD 2.5 billion. it is at the planning stage.
West-seti Hydropower project
energy a 750 MW reservoir type project to cost usD 108 billion with 75% of cost borne by china’s three Gorges international (ctGi) corporation and the rest by Nepal electricity authority (Nea). in negotiation phase.a
Gautam Buddha regional international airport
transport aDB invested project. cost usD 59.5 million 42.75 billion in loan and the rest with as grant. contract awarded to china’s Northwest civil aviation airport construction Group in 2013. expected to be completed and resume test flights in 2019.b
pokhara regional international airport
transport the project designed to be built under the engineering, procurement and construction (epc) model was contracted to china caMc engineering by Nepal Government on October 27, 2014. Being financed by soft loan of usD 215.96 million from china exim Bank. set to complete by 2021.c
second international airport, Bara
transport the Ministry of culture, tourism and civil aviation (Moctca) has developed a proposal to develop this airport either under ppp or engineering, procurement, construction and finance (epcf) model. site clearance and infrastructure development works are under way at the planned site in Nijgadh, Bara.d estimated cost around usD 6.5 billion.
pushpa lal (Mid-Hill) Highway
transport this 1,776 km long, ongoing project runs through the mid-hills starting from easternmost hill at chiyabhanjyang of panchthar District in province 1 and ends at westernmost hill at Jhulaghat of Baitadi in far West in province 7. started in 2009. total cost usD 14.38 billion.e
east–West railway
transport Government plans to construct it under ppp model an ambitious 1,318km project, it would cost usD 8 billion. as per the government plan, another 185-km of railway track would be built from Kathmandu to pokhara.f
tarai Hulaki rajmarg (postal Highway)
transport running 20 to 30 kilometers south and parallel to the east-West highway, as an approach road connecting districts of tarai-Madhes, it begins from Bhadrapur, the headquarters of Jhapa in the east, and stretches all the way to the far-western border with india in Kanchanpur district. connecting all districts of tarai, it is regarded the lifeline of tarai, linking the major towns and bazaars in the region. total length 1,792.42 km.g
aNNeXes
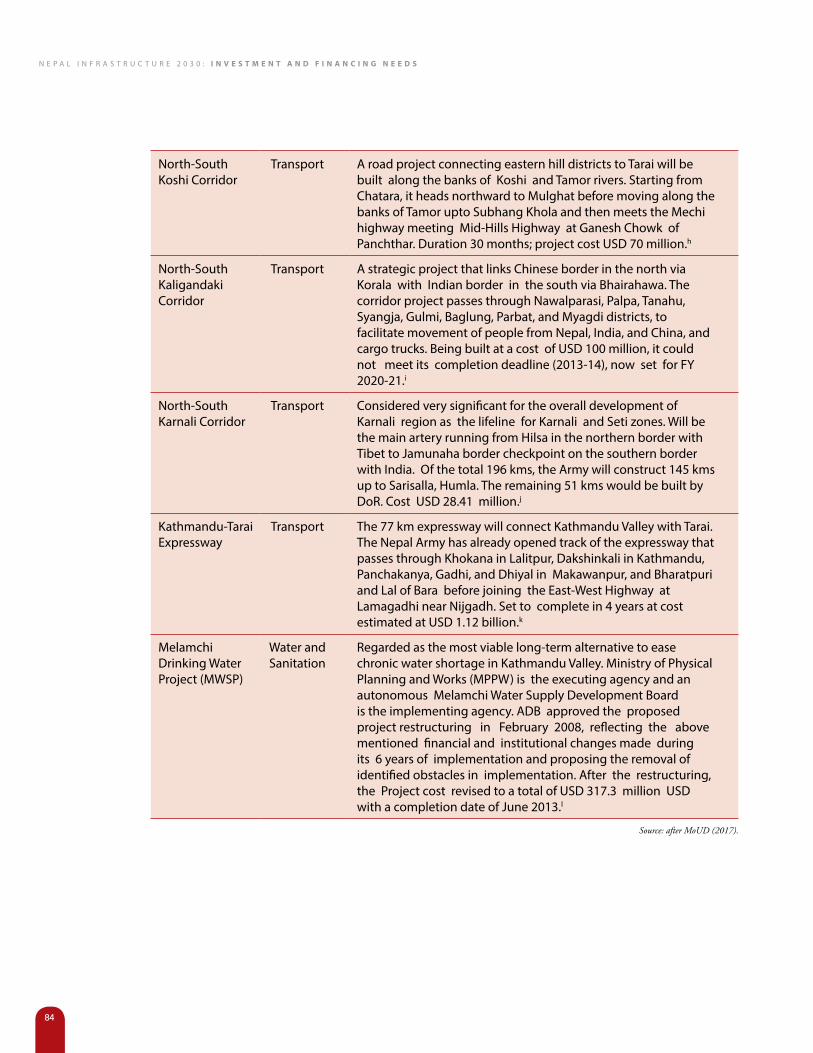
N e p a l I N f r a s t r u c t u r e 2 0 3 0 : I n v e s t m e n t a n d F I n a n c I n g n e e d s
84
North-south Koshi corridor
transport a road project connecting eastern hill districts to tarai will be built along the banks of Koshi and tamor rivers. starting from chatara, it heads northward to Mulghat before moving along the banks of tamor upto subhang Khola and then meets the Mechi highway meeting Mid-Hills Highway at Ganesh chowk of panchthar. Duration 30 months; project cost usD 70 million.h
North-south Kaligandaki corridor
transport a strategic project that links chinese border in the north via Korala with indian border in the south via Bhairahawa. the corridor project passes through Nawalparasi, palpa, tanahu, syangja, Gulmi, Baglung, parbat, and Myagdi districts, to facilitate movement of people from Nepal, india, and china, and cargo trucks. Being built at a cost of usD 100 million, it could not meet its completion deadline (2013-14), now set for fy 2020-21.i
North-south Karnali corridor
transport considered very significant for the overall development of Karnali region as the lifeline for Karnali and seti zones. Will be the main artery running from Hilsa in the northern border with tibet to Jamunaha border checkpoint on the southern border with india. Of the total 196 kms, the army will construct 145 kms up to sarisalla, Humla. the remaining 51 kms would be built by Dor. cost usD 28.41 million.j
Kathmandu-tarai expressway
transport the 77 km expressway will connect Kathmandu valley with tarai. the Nepal army has already opened track of the expressway that passes through Khokana in lalitpur, Dakshinkali in Kathmandu, panchakanya, Gadhi, and Dhiyal in Makawanpur, and Bharatpuri and lal of Bara before joining the east-West Highway at lamagadhi near Nijgadh. set to complete in 4 years at cost estimated at usD 1.12 billion.k
Melamchi Drinking Water project (MWsp)
Water and sanitation
regarded as the most viable long-term alternative to ease chronic water shortage in Kathmandu valley. Ministry of physical planning and Works (MppW) is the executing agency and an autonomous Melamchi Water supply Development Board is the implementing agency. aDB approved the proposed project restructuring in february 2008, reflecting the above mentioned financial and institutional changes made during its 6 years of implementation and proposing the removal of identified obstacles in implementation. after the restructuring, the project cost revised to a total of usD 317.3 million usD with a completion date of June 2013.l
Source: after MoUD (2017).

N e p a l I N f r a s t r u c t u r e 2 0 3 0 : I n v e s t m e n t a n d F I n a n c I n g n e e d s
85
a2: sustainable development goals
sDG tarGet aND iNDicatOrs ON iNfrastructure
fiscal year
2015 2019 2022 2025 2030
proportion of population with access to electricity (%) 74 80.7 85.7 90.7 99
installed capacity of hydropower (MW) 782 4,573 7,417 10,260 15,000
electricity consumption (KWh per capita) 80 458.7 742.7 10,26.7 1,500
Basic water supply coverage (%) 87 90.2 92.6 95 99
Households with access to piped water supply (%) 49.5 60.3 68.4 76.5 90
population using safe drinking water (%) 15 35 50 65 90
sanitation coverage (%) 70 77.7 77.5 83.3 99
urban households with toilets connected to sewer systems/proper fsM (%)
30 46 62 74 90
road density (km/sq km) 0.44 1.3 1.35 1.41 1.5
paved road density (km/sq km) 0.01 0.07 0.12 0.17 0.25
access to paved road within 30 minutes of walking (%) 51.4 59 64.7 70.5 80
planned new cities (number) 10 23 33 43 60
target GDp growth rate (%) 4 4.6 5.1 6.1 7
Source: NPC ( 2016b) .

N e p a l I N f r a s t r u c t u r e 2 0 3 0 : I n v e s t m e n t a n d F I n a n c I n g n e e d s
86
a3: data and methodology of top-down method
3.1. data
the required data such as the annual data for real GDp, share of agriculture value-added in GDp (aGr), share of industrial value-added in GDp (iND), share of population in urban areas (urBaN), and population density (pOpDeN), and the data for infrastructure stock variables– kw of installed electricity generation capacity per capita (electricity), km of road per 1,000 sq km of land area (rOaD), percentage of population with access to water (Water), and percentage of population with access to sanitation (saNitatiON), representing energy, transport, water, and sanitation sectors respectively, was ob-tained from the World Development indicators (WDi) of World Bank, annual report of Nepal electricity authority, and economic survey of Mof (GoN). the sample ranges from fy1971 to fy2016 for energy and transport, and from fy1992 to fy2015 for water and sanitation. the inception and end periods of sample are determined by the availability of data for infrastructure stock variables, representing these sectors. a more detailed description of the variables is presented in tables a3.1 and a3.2.
taBLe a3.1: Infrastructure stock by sectors
sectOr iNDicatOr iNfrastructure stOcK
availaBility (fy eNDiNG MiD-July)
sOurce
energy electricity Kw of installed electricity generation capacity per capita
1980-2016 WDi for 1971-2011 and Nepal electricity authority annual report for 2012-2016
transport rOaD Km of road per 1,000 sq km of land area
1975-2016 WDi and economic survey
Water and sanitation
Water % of population with access
1990-2015 WDi
saNitatiON % of population with access
1990-2015 WDi
Source: NPC ( 2016b)
taBLe a3.2: Independent variables
iNDepeNDeNt variaBle iNDicatOr sOurce
real GDp per capita (2010 usD) GDp WDi
share of agriculture value-added in GDp aGr WDi
share of industrial value-added in GDp iND WDi
share of population in urban area urBaN WDi
population density pOpDeN WDi
3.2. empirical methodology
the study follows aDB (2017) and use top-down econometric approach to estimate infrastructure investment needs which involves two major steps discussed in detail below.
3.2.1. Estimation of infrastructure investments without climate change adjustment (baseline estimates)
the approach for estimating infrastructure investments without climate change adjustment is similar to that used by aDB (2017), ruiz-Nunez and Wei (2015), aDB and aDBi (2009), Bogetic´and fedderke (2006), fay and yepes (2003), and fay (2000). these studies employ a panel model to forecast infrastructure investments. in this study, a time-series model focusing only on forecasting infrastructure investment for Nepal has been used, employing 3 stage approach to forecast infrastructure investment. this is discussed in detail below.

N e p a l I N f r a s t r u c t u r e 2 0 3 0 : I n v e s t m e n t a n d F I n a n c I n g n e e d s
87
3.2.2. Estimation of demand functions
in the first stage, the study uses a time series model and estimate separate demand equations for each physical infra-structure stock as follows:
It = α0 + α1 It −1 + α2GDPt + α3 AGRt + α4 INDt + α5URBANt + α6 POPDENt + εt (1)
where it is the physical infrastructure stock in year t (see table a3.1 for physical infrastructure stocks covered under each sector – energy, transport, and water and sanitation – and their sources), and εt the error term. the independent variables in equation 1 are (see table a3.2 for sources): real GDp per capita ( GDp ), share of agriculture value-added in GDp ( aGr), share of industrial value-added in GDp ( iND ), share of population in urban areas ( urBaN), and popula-tion density ( pOpDeN ). all the variables in equation 1 are expressed in natural logarithm.
the study uses the autoregressive distributed lag (arDl) bounds testing approach for cointegration of pesaran, shin, and smith (2001) to estimate the long-run demand function. this involves estimating the following conditional error correction model:
Nepal Infrastructure 2030: INVESTMENT AND FINANCING NEEDS
111
where tI is the physical infrastructure stock in year t (see Table A3.1 for the physical infrastructure stocks that are covered under each sector – energy, transport, and water and sanitation – and their sources), and tε is the error term. The independent variables in equation 1 are (see Table A3.2 for sources): real GDP per capita ( GDP ), share of agriculture value-added in GDP ( AGR), share of industrial value-added in GDP ( IND ), share of population in urban areas (URBAN), and population density ( POPDEN ). All the variables in equation 1 are expressed in natural logarithm.
We use the autoregressive distributed lag (ARDL) bounds testing approach for cointegration of Pesaran, Shin, and Smith (2001) to estimate the long-run demand function. This involves estimating the following conditional error correction model:
1 1 1 1 1 1
0 1 2 3 4 5 61 1 1 1 1 1
p p p p p p
t i t i i t i i t i i t i i t i i t ii i i i i i
I I GDP AGR IND URBAN POPDENβ β β β β β β− − − − − −
− − − − − −= = = = = =
∆ = + ∆ + ∆ + ∆ + ∆ + ∆ + ∆∑ ∑ ∑ ∑ ∑ ∑
7 1 8 1 9 1 10 1 11 1 12 1t t t t t t tI GDP AGR IND URBAN POPDENβ β β β β β ε− − − − − −+ + + + + + +
(2)
where ∆ is the first-difference operator and p is the lag length.
ARDL bounds testing approach provides at least three advantages over other cointegration methods (Engle & Granger, 1987; Johansen, 1991, 1995). These include: a) it is applicable regardless of whether the underlying variables are integrated of order zero (I(0)), integrated of order one (I(1)), or mutually cointegrated; b) it does not require identical lag length for each variable (Pesaran and Shin, 1999); c) it is suitable even if the sample size is small, as is the case in our study which has less than 50 observations. We can use F-test to assess whether the long-run relationship exists in equation 2. The F-test statistic tests the joint hypothesis that coefficients on the lagged level variables (I, GDP, AGR, IND, URBAN, and POPDEN) are jointly equal to zero. The null and alternative hypotheses are:
0 7 8 9 10 11 12:H β β β β β β= = = = =
1 7 8 9 10 11 12:H β β β β β β≠ ≠ ≠ ≠ ≠
where ∆ is the first-difference operator and p the lag length.
arDl bounds testing approach provides at least three advantages over other cointegration methods (engle & Grang-er, 1987; Johansen, 1991, 1995). these include: a) it is applicable regardless of whether the underlying variables are integrated of order zero (i(0)), integrated of order one (i(1)), or mutually cointegrated; b) it does not require identical lag length for each variable (pesaran and shin, 1999); c) it is suitable even if the sample size is small, as is the case in our study which has less than 50 observations. One can use f-test to assess whether the long-run relationship exists in equation 2. the f-test statistic tests the joint hypothesis that coefficients on the lagged level variables (i, GDp, aGr, iND, urBaN, and pOpDeN) are jointly equal to zero. the null and alternative hypotheses are:
Nepal Infrastructure 2030: INVESTMENT AND FINANCING NEEDS
111
where tI is the physical infrastructure stock in year t (see Table A3.1 for the physical infrastructure stocks that are covered under each sector – energy, transport, and water and sanitation – and their sources), and tε is the error term. The independent variables in equation 1 are (see Table A3.2 for sources): real GDP per capita ( GDP ), share of agriculture value-added in GDP ( AGR), share of industrial value-added in GDP ( IND ), share of population in urban areas (URBAN), and population density ( POPDEN ). All the variables in equation 1 are expressed in natural logarithm.
We use the autoregressive distributed lag (ARDL) bounds testing approach for cointegration of Pesaran, Shin, and Smith (2001) to estimate the long-run demand function. This involves estimating the following conditional error correction model:
1 1 1 1 1 1
0 1 2 3 4 5 61 1 1 1 1 1
p p p p p p
t i t i i t i i t i i t i i t i i t ii i i i i i
I I GDP AGR IND URBAN POPDENβ β β β β β β− − − − − −
− − − − − −= = = = = =
∆ = + ∆ + ∆ + ∆ + ∆ + ∆ + ∆∑ ∑ ∑ ∑ ∑ ∑
7 1 8 1 9 1 10 1 11 1 12 1t t t t t t tI GDP AGR IND URBAN POPDENβ β β β β β ε− − − − − −+ + + + + + +
(2)
where ∆ is the first-difference operator and p is the lag length.
ARDL bounds testing approach provides at least three advantages over other cointegration methods (Engle & Granger, 1987; Johansen, 1991, 1995). These include: a) it is applicable regardless of whether the underlying variables are integrated of order zero (I(0)), integrated of order one (I(1)), or mutually cointegrated; b) it does not require identical lag length for each variable (Pesaran and Shin, 1999); c) it is suitable even if the sample size is small, as is the case in our study which has less than 50 observations. We can use F-test to assess whether the long-run relationship exists in equation 2. The F-test statistic tests the joint hypothesis that coefficients on the lagged level variables (I, GDP, AGR, IND, URBAN, and POPDEN) are jointly equal to zero. The null and alternative hypotheses are:
0 7 8 9 10 11 12:H β β β β β β= = = = =
1 7 8 9 10 11 12:H β β β β β β≠ ≠ ≠ ≠ ≠
the f-test has a non-standard distribution under the null hypothesis of no long-run relationship and depends on: a) number of regressors; b) order of integration of regressors; and c) the deterministic model components (whether the arDl model contains an intercept and/or trend). pesaran, shin, and smith (2001) provide two sets of asymptotic crit-ical valuesm for cases when all variables are i(0) and cases when all variables are i(1). they call these values as critical value bounds: with lower critical bound corresponding to i(0) and upper critical bound corresponding to i(1) . if the calculated f-statistic falls outside these bounds, the inference is conclusive regardless of the order of integration of the variables. in particular, if the calculated f-statistic is higher than the upper bound critical value, we can reject the null hypothesis of no long-run relationship; if it is lower than the lower bound critical value, we cannot reject the null hypo thesis of no long-run relationship. However, if the calculated f-statistic falls inside the critical value bounds, inference is inconclusive and the order of integration of the variables needs to be determined for drawing a conclusive inference (pesaran, shin, and smith, 2001).
if the null hypothesis of no long-run relationship is rejected, pesaran, shin, and smith (2001) also suggest conduct-ing a t-test of β7 = 0 . similar to the f-test, the t-test has a non-standard distribution and depends on: a) number of regressors; b) order of integration of regressors; and c) the deterministic model components. analogous to the f-test, pesaran, shin, and smith (2001) provide two sets of asymptotic critical values for cases when all variables are i(0) and cases when all variables are i(1). if the absolute value of calculated t-statistic is greater than the absolute value of the critical value bounds, the null hypothesis is rejected. However, if the absolute value of calculated t-statistic is smaller than the absolute value of the critical value bounds, the null hypothesis is not rejected.

N e p a l I N f r a s t r u c t u r e 2 0 3 0 : I n v e s t m e n t a n d F I n a n c I n g n e e d s
88
3.2.3. Forecast of infrastructure stocks
in the second stage, the study uses the estimated coefficients from equation 2 and the projected inde-pendent variables in table a3.3 over the period 2019-2030 to forecast infrastructure physical stocks for the period 2019-2030. projected independent variables in table a3.3 are obtained from the following sources: (i) GDp forecasts (2016–2030) based on iiDs staff estimates. in particular, GDp growth projections were computed as follows. first, growth projections for fys 2017/18 and 2018/19 were taken from Nepal economic Outlook 2016-17. for fys 2019/20 to 2029/30, annual GDp growth rate was assumed to be 5% (normal growth scenario). this is similar to the growth rate assumed for Nepal by aDB (2017). the study also considers two additional growth scenarios: the optimistic one assumes the annual growth of 7.5%, and the highly optimistic assumes the annual growth rate of10%. annex 2 provides details for forecasting GDp. (ii) for agricultural share of GDp, we use actual data for the latest year (2016) and Briones and felipe (2013)’s projection for 2030, and derive values for in-between years (2017–2029) using linear interpolation; (iii) for industrial share of GDp, the study uses the data for the most recent year (2016) available from WDi across years due to absence of any projections; (iv) population projections (medium variant) come from 2017 revision of World population prospects, uN and, (v) for share of population in urban areas, the study uses 5-year projections of the World urbanization prospects, the 2014 revision, and derive values for in-between years using linear interpolation.
taBLe a3.3: Forecasts of independent variables over the period 2016-2030
iNDepeNDeNt variaBle sOurce
real GDp iiDs staff calculations: see annex i
share of agriculture value-added in GDp table 7 from Briones and felipe (2013)
share of industrial value-added in GDp WDi for 2016
population World population prospects of uN
share of population in urban areas World urbanization prospects of uN
3.2.4. estimate of the annual monetary value of new investment needs
in the third and final stage, the study uses the empirically-estimated unit cost of each type of infrastruc-ture from aDBn (see table a3.4) and the forecast infrastructure physical stocks to arrive at monetary values of new investment needs per year. further, the investment required for maintaining the existing infrastructure stock is computed as the product of the depreciation rate, previous year’s stock, and the unit cost of each type of infrastructure. the total investment need is calculated as follows:
it = M t + δ c It −1
where, c is the empirically-estimated unit cost of each type of infrastructure from aDB, it is the total investment need, Mt is the investment need in new infrastructure, δ is the depreciation rateo, and δ cit −1 is the investment required for maintaining the existing infrastructure stock.
taBLe a3.4: estimated unit cost of infrastructure (Usd)
sectOr iNDicatOr uNit uNit cOst (iN 2010 prices)
transport rOaD Km 600,000
energy electricity Kw 2,513
Water and sanitation
Water supply person 161
saNitatiON person 168Source: ADB (2017, p.100).

N e p a l I N f r a s t r u c t u r e 2 0 3 0 : I n v e s t m e n t a n d F I n a n c I n g n e e d s
89
a4: gdP growth projections
Nepal Infrastructure 2030: INVESTMENT AND FINANCING NEEDS
115
A4:GDP growth projections
The study follows ADB (2011, 2017), Kharas (2010a), and Wilson and Purushothaman (2006) to compute
GDP is a function of labor force (L), capital stock (K), and technological progress or total factor productivity growth (TFP).
1t t t tGDP TFP L Kα α−= × ×
whereα is the labor share and is assumed to be 2/3 as in Kharas (2010a). Similar to ADB (2017) and Wilson and Purushothaman (2006), the study uses the projection of International Labor Organization for L and assume capital stock (K) to evolve as:
111
1
(1 ) ( )tt t t
t
IK K GDP
GDPδ −
−−−
= − +
Where I1
1
t
t
IGDP
−
−is the long-run investment rate
(investment to GDP ratio, both in constant pricesp) assumed to be 21.49% (based on recent historical average from 2005-2015), and δ is the rate of depreciation assumed at 6% per annum.
For TFP, the study follows Kharas (2010a) and Wilson and Purushothaman (2006), and assume the following equation for TFP growth:
, 1
States,t-1
1.3% ln( )Nepal tt
United
GDPPCTFP Growth
GDPPCβ −= −
where tTFP Growth is the growth of total factor productivity1
( )t
t
TFPTFP−
, GDPPC is the GDP per capita, β is the speed of convergence (assumed to be 0 for Nepalq), and 1.3% is the TFP growth rate per annum for the United States.
GDP growth projections. Specifically, the study uses a Cobb-Douglas production function in which
a5: Unit cost of hydropower
a5.1. Unit hydropower cost (million Usd/mW -2017)
type Of HyDrOpOWer averaGe MiNiMuM MaXiMuM
run-of-the river 1.73 1.15 2.61
prOr* 2.64 - -
storage** 3.33 2.35 4.27
*Based on price of 144 MW Kaligandai-A. ** based of JICA study
a5.2. Unit cost of sub-station (million Usd-2017)
vOltaGe cOst
132 Kv 6.65
220 Kv 22.9
400 Kv 25

N e p a l I N f r a s t r u c t u r e 2 0 3 0 : I n v e s t m e n t a n d F I n a n c I n g n e e d s
90
a5.3. Unit cost of transmission line (million Usd/km 2017)
vOltaGe level cOst
132 Kv 0.61
220 Kv 0.56
400 Kv 0.50
a5.4. Unit cost of electrification
type cOst /HH
Grid 25,000
Off-grid 40,000 (at least tier 3)
a6: detail of bottom up calculation for the transport sector
aGeNDa actiON rOaD leNGtH* (apprOX.)
respONsiBle aGeNcy
reMarKs
establish economic connectivity to supplement economic growth and enhance mobility
• Develop standards for economic connectivity• Designate existing road sections under highways/
feeder roads to standards of economic connectivity.300
Dor
• upgrade new construction of the remaining section to the standard economic connectivity
700
• upgrade identified sections of economic connectivity to 4-lane standards or above
• ithari – Biratnagar – rani• eWH- rajbiraj – Kunauli• eWH- Janakpur – Dhalkebar• pathlaiya – Bigunj- sirsiya• eWH- thori – Border• Bhumahi – parasi - Bhairahawa• Butwal – Bhairahawa• chanouta – Krishnanager• Kohalpur – Nepalgunj• atariya – Dhangadi – Mohana
250 Dor
Designate at least one economic corridor with tibet autonomous region from each bordering province. identified sections of economic connectivity to be upgraded to 2- lane standards conforming to the standards of economic connectivity.• Mid Hill Highway (MHH) – Kimathanka• MHH-lamabager – lapchegaun• MHH – rasuwagadihi• MHH – Korala• Manma – Hilsa (single/intermediate)• MHH – tinker pass (single/intermediate)
450 Dor
improve and upgrade feeder roads
•ImproveandupgradeStrategicFeederRoadstohigher standards based on traffic projection and economic benefits
350 provinces
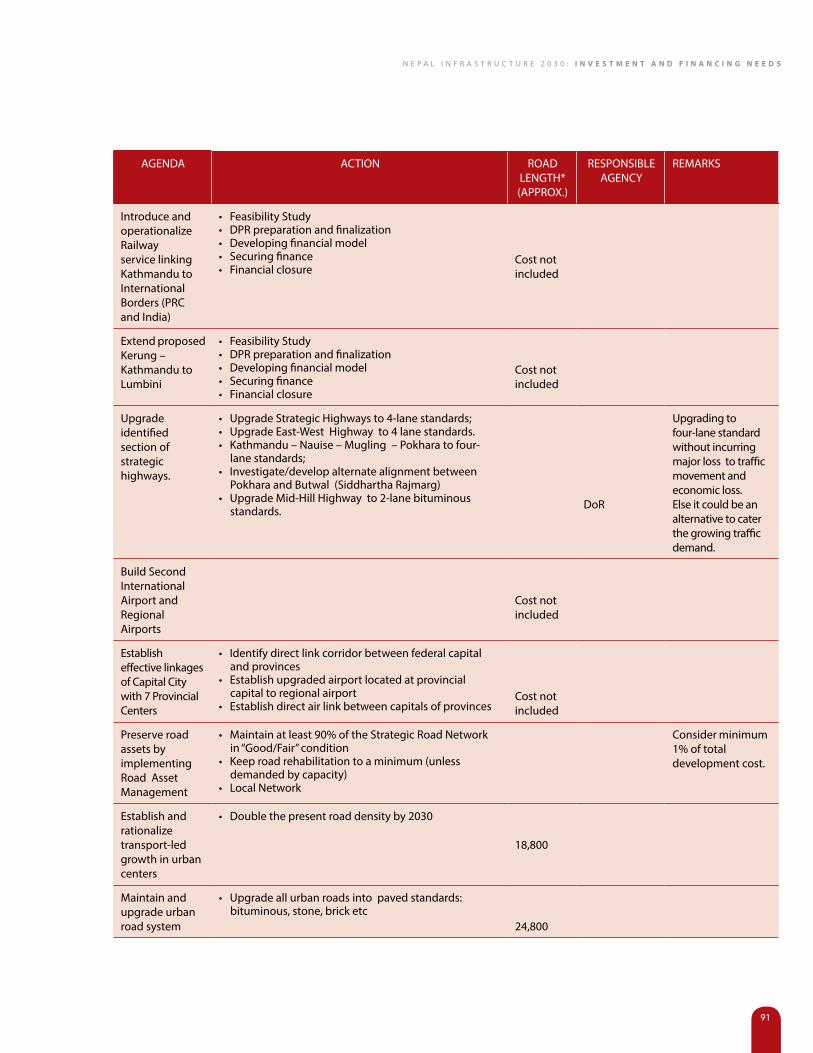
N e p a l I N f r a s t r u c t u r e 2 0 3 0 : I n v e s t m e n t a n d F I n a n c I n g n e e d s
91
aGeNDa actiON rOaD leNGtH* (apprOX.)
respONsiBle aGeNcy
reMarKs
introduce and operationalize railwayservice linking Kathmandu to international Borders (prc and india)
•FeasibilityStudy•DPRpreparationandfinalization•Developingfinancialmodel•Securingfinance•Financialclosure
cost not included
extend proposed Kerung – Kathmandu to lumbini
•FeasibilityStudy•DPRpreparationandfinalization•Developingfinancialmodel•Securingfinance•Financialclosure
cost not included
upgrade identified section of strategic highways.
•UpgradeStrategicHighwaysto4-lanestandards;•UpgradeEast-WestHighwayto4lanestandards.•Kathmandu–Nauise–Mugling–Pokharatofour-
lane standards;•Investigate/developalternatealignmentbetween
pokhara and Butwal (siddhartha rajmarg)•UpgradeMid-HillHighwayto2-lanebituminous
standards. Dor
upgrading to four-lane standard without incurring major loss to traffic movement and economic loss. else it could be an alternative to cater the growing traffic demand.
Build second international airport and regional airports
cost not included
establish effective linkages of capital city with 7 provincialcenters
•Identifydirectlinkcorridorbetweenfederalcapitaland provinces
•Establishupgradedairportlocatedatprovincialcapital to regional airport
•Establishdirectairlinkbetweencapitalsofprovincescost not included
preserve road assets by implementing road asset Management
•Maintainatleast90%oftheStrategicRoadNetworkin “Good/fair” condition
•Keeproadrehabilitationtoaminimum(unlessdemanded by capacity)
•LocalNetwork
consider minimum1% of total development cost.
establish and rationalize transport-led growth in urban centers
•Doublethepresentroaddensityby2030
18,800
Maintain and upgrade urban road system
•Upgradeallurbanroadsintopavedstandards:bituminous, stone, brick etc
24,800

N e p a l I N f r a s t r u c t u r e 2 0 3 0 : I n v e s t m e n t a n d F I n a n c I n g n e e d s
92
aGeNDa actiON rOaD leNGtH* (apprOX.)
respONsiBle aGeNcy
reMarKs
upgrade and extend local road Network to meet the target of sDG9.
•ExtendDRCNtocoverallruralmunicipalitiesandupgrade to bituminous standards 4,500
New construction
•UpgradeexistingDRCNtoall-weatherroadcondition 22,000 include bridge cost at 1.29 m/km
•UpgradeexistingDRCNtobituminousstandards 22,000
•ConstructVillageRoads(communitiesetc.) 88,200
Maintain road lrN (DrcN)
•Maintainroadsingood/faircondition 1 % of total road development cost
* in km.

N e p a l I N f r a s t r u c t u r e 2 0 3 0 : I n v e s t m e n t a n d F I n a n c I n g n e e d s
93
a6.
1: B
udge
t dem
and
for t
he tr
ansp
ort s
ecto
r (pr
ojec
tion
) in
billi
on n
PR
2019
- 20
2020
21 -
2025
2026
- 20
30
GD
p pr
ojec
ted
at 5
% G
row
th6,
109
18,1
5423
,170
47,4
33
GD
p pr
ojec
ted
at 7
.5%
Gro
wth
6,25
518
,587
23,7
2248
,564
GD
p pr
ojec
ted
at 1
0% G
row
th6,
868
24,1
6138
,911
69,9
40
acti
ON
KMcO
st /K
M
iN M
illi
ON
tOta
l cO
st iN
Bi
lliO
N N
prfy
201
9 -2
020
2021
-202
520
26-2
030
rOa
D
1u
pgra
ding
of t
he d
esig
nate
d se
ctio
ns
of h
ighw
ays/
fee
der r
oads
to th
e st
anda
rds
of e
cono
mic
con
nect
ivity
300
5015
10.0
05.
00
2N
ew c
onst
ruct
ion
of re
mai
ning
se
ctio
n to
the
stan
dard
s of
eco
nom
ic
conn
ectiv
ity
700
8056
30.0
026
.00
3id
enfy
ing
sect
ions
of e
cono
mic
co
nnec
tivity
(Nor
th-s
outh
link
ing
to
indi
an B
orde
r) to
be
upgr
aded
to fo
ur-
lane
sta
ndar
ds o
r abo
ve
250
4010
2.00
6.00
2.00
4co
nstr
uctio
n of
Kat
hman
du -
tara
i fa
st
trac
k76
1,50
011
4N
ot c
oste
d
5co
stru
ctio
n/up
grad
ing
of a
dditi
onal
5
Nor
th-s
outh
eco
nom
ic c
orrid
or
(con
nect
ivity
) to
tibe
t aut
onom
ous
regi
on o
f peo
ple’
s re
publ
ic o
f chi
na
450
7031
.55.
2513
.13
13.1
3
6im
prov
emen
t/up
grad
ing
of s
trat
egic
H
ighw
ays
(eas
t-W
est)
to fo
ur-la
ne
stan
dard
s an
d ab
ove
1,02
740
41.0
84.
1118
.49
18.4
9
7im
prov
emen
t/up
grad
ing
of s
trat
egic
H
ighw
ays
(Mid
-Hill
) to
two-
lane
st
anda
rds.
1,77
620
35.5
211
.84
23.6
8
8im
prov
emen
t/up
grad
ing
of s
trat
egic
H
ighw
ays
(pos
tal r
oads
with
as
soci
ated
nor
th-s
outh
link
road
s) to
tw
o- la
ne s
tand
ards
.
1,79
230
53.7
617
.92
35.8
4

N e p a l I N f r a s t r u c t u r e 2 0 3 0 : I n v e s t m e n t a n d F I n a n c I n g n e e d s
94
2019
- 20
2020
21 -
2025
2026
- 20
30
9im
prov
emen
t/up
grad
ing
of s
trat
egic
fe
eder
roa
ds to
inte
rmed
iate
/tw
o-la
ne s
tand
ards
bas
ed o
n ac
tual
traffi
c pe
ojec
tion
and
econ
omic
ben
efits
350
258.
758.
75
10u
pgra
ding
to re
mai
ning
str
ateg
ic
road
s to
all-
wea
ther
pav
ed s
tand
ards
4,00
025
100
50.0
050
.00
11st
rate
gic
road
Mai
nten
ance
12,0
0058
196
.83
242.
0824
2.08
12u
rban
roa
d co
nstr
uctio
n to
the
spec
ified
sta
ndar
ds18
,800
1018
831
.33
78.3
378
.33
13u
pgra
ding
all
urba
n ro
ads
to p
aved
st
anda
rds;
bitu
min
ous,
ston
e, b
ricks
etc
.24
,800
1537
231
.00
217.
0093
.00
14u
pgra
ding
Drc
N to
all-
wea
ther
road
s22
,000
722
036
.67
110.
0091
.67
15u
pgra
ding
Drc
N to
pav
ed s
tand
ards
22,0
003
110
55.0
022
.00
16M
aint
aini
ng D
rcN
& u
rban
roa
ds33
3.3
55.5
513
8.88
138.
88
17ad
ditio
nal r
oad
leng
th c
onst
ruct
ed to
m
eet s
DG
(tra
ck o
peni
ng)
101,
200
330
3.6
50.6
012
6.50
126.
50
18ad
ditio
nal r
oad
leng
th u
pgra
ded
to
mee
t sD
G25
,000
1075
12.5
031
.25
31.2
5
aIR
tR
an
sPo
Rt
19co
nstr
uctio
n of
sec
ond
inte
rnat
iona
l a
irpor
t at N
ijgra
hN
ot c
oste
d
20u
pgra
ding
of 5
exi
stin
g a
irpor
ts to
re
gion
al s
tand
ards
Not
cos
ted
21u
pgar
ding
of d
omes
tic a
irpor
t to
pave
d st
ndar
dsN
ot c
oste
d
364.
3511
86.1
793
8.32
2488
.84
ratio
to G
Dp
at 5
% G
row
th36
4.35
1186
.17
938.
3224
88.8
4
ratio
to G
Dp
at 7
.5%
Gro
wth
5.96
%6.
53%
4.05
%0.
052
ratio
to G
Dp
at 1
0% G
row
th5.
82%
6.38
%3.
96%
0.05
1
5.31
%4.
91%
2.41
%0.
036

N e p a l I N f r a s t r u c t u r e 2 0 3 0 : I n v e s t m e n t a n d F I n a n c I n g n e e d s
95
a7:
cos
t cal
cula
tion
for t
he w
ater
and
san
itat
ion
sect
or
TARG
ET O
F 20
30 A
ND
BU
DG
ETA
RY R
EQU
IREM
ENT
COM
PON
ENTS
BASE
LIN
E20
15M
UN
ICIP
ALIT
IES
PERC
ENTA
GES
IN
M
UN
ICIP
ALIT
Y AS
PER
SD
G
TARG
ET
PERC
ENTA
GES
IN
RU
RAL
MU
NIC
IPAL
ITY
(460
)AS
PER
SDG
TAR
GET
TOTA
L PO
PULA
TIO
N
TO B
E SE
RVED
PERC
ENTA
GES
AN
D P
OPU
LATI
ON
BUD
GET
ARY
REQ
UIR
EMEN
T (C
OST
PER
CA
PITA
AN
D P
ER
UN
IT) I
N U
SD
TOTA
L BU
DG
ET
(USD
)RE
MAR
KSCC
@ 1
0%+S
ocia
l dev
.cos
ts
@ 5
%=1
5% in
crem
ent
ever
y ye
ar
CC @
10%
+Soc
ial d
ev.
cost
s @
5%
=15%
in
crem
ent e
very
yea
r
Year
Pro
ject
ed
MU
NIC
IPAL
ITY
(276
) AN
D
SUB-
MET
ROPO
LITA
N (1
1) A
ND
M
ETRO
POLI
TAN
CIT
IES
(6)
8,9
02,3
71,5
81
3,9
32,3
70,1
26
2020
Safe
pip
ed
wat
er s
uppl
y sy
stem
15%
A. L
imite
d: P
artia
lly p
rote
cted
sou
rce,
no
dis
infe
ctio
n, p
artia
l sup
ply
in s
ome
vuln
erab
le a
reas
1020
4,7
01,7
60
100
470
,176
,003
7
87,5
17,4
86
B. B
asic
:Pip
ed o
n pr
emis
es, 6
5 lp
cd,
inte
rmitt
ent a
nd m
eetin
g N
DW
QS,
200
550
50 1
6,79
2,00
0 15
0 2
,518
,800
,017
9
05,6
45,1
09
C. Im
prov
ed: I
nter
nally
plu
mbe
d,
100
Lpcd
, con
tinuo
us a
nd m
eetin
g N
DW
QS,
200
5
4030
12,
090,
240
200
2,4
18,0
48,0
16
1,0
41,4
91,8
75
Was
tew
ater
w
ith tr
eatm
ent
syst
em
1%A.
Ons
ite s
yste
m20
10 5
,373
,440
10
537
,344
75
40,
300,
800
1,1
97,7
15,6
56
B. O
nsite
con
nect
ed to
sep
tage
tr
eatm
ent p
lant
90 4
,836
,096
10
0 4
83,6
09,6
03
1,3
77,3
73,0
05
13,
219,
144,
049
2025
C. S
ewer
ed (P
rim
ary
trea
tmen
t)35
25 1
0,41
1,04
0 70
7,2
87,7
28
200
1,4
57,5
45,6
10
1,5
83,9
78,9
56
D. S
ewer
ed (S
econ
dary
trea
tmen
t)30
3,1
23,3
12
300
936
,993
,606
1
,821
,575
,799
Indu
stri
al
was
tew
ater
tr
eatm
ent
Non
eIn
dust
rial
was
tew
ater
trea
ted
befo
re
trea
tmen
t sys
tem
100
Uni
ts10
0 1
00,0
00
10,
000,
000
Cost
per
uni
t of
trea
tmen
t sy
stem
in
indu
stri
al
stat
es
(ass
umed
100
un
its to
tal)
2,0
94,8
12,1
69
Publ
ic to
ilet
10%
One
Pub
lic to
ilet p
er 5
000
popu
latio
n60
20 1
4,77
6,96
0 2
,409
,033
,994
Num
ber
of p
ublic
toile
t to
be b
uilt
2,9
55
10,
000
29,
553,
920
Cost
per
uni
t of
pub
lic
toile
t
2,7
70,3
89,0
93
31,
898,
163,
528
2030
Dra
inag
e sy
stem
2%D
rain
age
syst
em b
uilt
in lo
w ly
ing
area
s 20
10 5
,373
,440
10
0 5
37,3
44,0
04
3,1
85,9
47,4
57
3,6
63,8
39,5
76
Tota
l 8
,902
,371
,581
4
,213
,415
,512
4,8
45,4
27,8
39
Tota
l 3
1,89
8,16
3,52
8

N e p a l I N f r a s t r u c t u r e 2 0 3 0 : I n v e s t m e n t a n d F I n a n c I n g n e e d s
96
a8:
net
infr
astr
uctu
re fi
nanc
ing
requ
irem
ents
for t
he u
rban
dev
elop
men
t se
ctor
(201
8/19
– 2
030/
31) (
Usd
bill
ion)
part
icu
lar
pHys
ica
l ta
rGet
NO
te
100%
90%
75%
60%
aPe
riod
: 201
5/16
-203
0/31
158
mun
icip
aliti
es3.
723.
352.
792.
23
221
7 (=
58+1
59) m
unic
ipal
ities
23.3
020
.97
17.4
713
.98
315
9 m
unic
ipal
ities
19.5
817
.62
14.6
811
.75
423
5 (=
293-
58) m
unic
ipal
ities
41.8
3*37
.64
31.3
725
.10
see
Not
e (a
)
Bpe
riod:
201
8/19
-203
0/31
(13
mon
ths)
158
mun
icip
aliti
es3.
58**
3.22
2.69
2.15
see
Not
e (b
)
223
5 (=
293-
58) m
unic
ipal
ities
41.8
337
.64
31.3
725
.10
see
Not
e (c
)
329
3 (=
58+2
35) m
unic
ipal
ities
:
3.1
Des
ired
leve
l of b
asic
infr
astr
uctu
re45
.41
40.8
734
.06
27.2
4to
tal o
f B(1
) and
B(2
)
3.2
unl
eash
ing
loca
l and
regi
onal
dev
elop
men
t po
tent
ial w
hich
may
als
o in
clud
e sp
ecia
lized
in
fras
truc
ture
nee
ds fo
r pro
vinc
ial c
apita
ls (2
5-35
%)
11.3
5 to
15.
8910
.22
to 1
4.30
8.51
to 1
1.92
6.81
to 9
.54
3.3
proj
ect p
repa
ratio
n, im
plem
enta
tion/
man
agem
ent s
afeg
uard
s, in
stitu
tion
deve
lopm
ent,
build
ing
com
mun
ity re
silie
nce,
an
d la
nd p
rovi
sion
ing
and
reha
bilit
atio
n su
ppor
t (2
2-32
%)
9.99
to 1
4.53
8.99
to 1
3.08
7.49
to 1
0.90
5.99
to 8
.72
3.4
tota
l inf
rast
ruct
ure
finan
cing
nee
ds66
.75
to 7
5.84
60.0
7 to
68.
2550
.06
to 5
6.87
40.0
5 to
45.
50
3.5
fina
ncin
g ne
eds
to b
e m
et th
roug
h m
unic
ipal
re
venu
e, iG
ft, a
nd m
arke
t bor
row
ing
32%
41%
53%
61%
3.6
net
fina
ncin
g re
quir
emen
t45
.39
to 5
1.57
35.4
4 to
40.
2723
.53
to 2
6.73
15.6
2 to
17.
74
3.7
ppp
(3%
)1.
36 to
1.5
51.
06 to
1.2
10.
71 to
0.8
00.
47 to
0.5
3
Exam
ple:
*41.
83=1
9.58
/22x
47. *
*3.5
8=3.
72/1
6x13
+3.7
2/16
x3x0
.8.
not
e: (a
) inc
reas
e in
num
ber
of m
unic
ipal
ities
fro
m 2
17 t
o 29
3 co
rres
pond
s to
a g
ain
in m
unic
ipal
pop
ulat
ion
shar
e fr
om 4
2% t
o 67
%. i
t is
ass
umed
the
old
58
mun
icip
aliti
es h
ave
20%
of t
he t
otal
pop
ulat
ion,
leav
ing
22%
in 1
59 m
unic
ipal
ities
or
47%
in 2
35 m
unic
ipal
ities
. (b)
ass
umin
g ca
rry-
over
of 8
0% o
f inf
rast
ruct
ure
inve
stm
ent n
eeds
from
the
prev
ious
thre
e ye
ars
(i.e.
, 20%
of t
he n
eeds
are
ass
umed
to b
e m
et).
(c) f
ull c
arry
-ove
r fro
m p
revi
ous
year
s co
nsid
ered
.

N e p a l I N f r a s t r u c t u r e 2 0 3 0 : I n v e s t m e n t a n d F I n a n c I n g n e e d s
97
a9:
Inst
itut
iona
l arr
ange
men
t and
maj
or p
olic
ies i
n pr
iori
ty in
fras
truc
ture
sect
ors
eNer
Gy
tr
aN
spO
rt
Wat
er a
ND
sa
Nit
atiO
Nr
urB
aN
Dev
elO
pMeN
t
• M
inis
try
of e
nerg
y, W
ater
res
ourc
e an
d irr
igat
ion
• a
ltern
ativ
e en
ergy
pro
mot
ion
cent
er•
Min
istr
y of
sci
ence
, tec
hnol
ogy
and
envi
ronm
ent
• N
atio
nal p
lann
ing
com
mis
sion
• M
inis
try
of p
hysi
cal i
nfra
stru
ctur
e an
d tr
ansp
ort
• M
inis
try
of f
eder
al a
ffairs
and
G
ener
al a
dmin
istr
atio
n•
Nat
iona
l pla
nnin
g co
mm
issi
on•
Min
istr
y of
cul
ture
, tou
rism
and
ci
vil a
viat
ion
• M
inis
try
of W
ater
sup
ply
and
sani
tatio
n•
Min
istr
y of
urb
an D
evel
opm
ent
• N
atio
nal p
lann
ing
com
mis
sion
• M
inis
try
of u
rban
D
evel
opm
ent
• M
inis
try
of f
eder
al a
ffairs
an
d lo
cal D
evel
opm
ent
• N
atio
nal p
lann
ing
com
mis
sion
Regu
lato
ry a
nd o
pera
tion
leve
l
• D
epar
tmen
t of e
lect
ricity
D
evel
opm
ent
• W
ater
and
ene
rgy
com
mis
sion
• ta
riff f
ixat
ion
com
mis
sion
• N
epal
ele
ctric
ity a
utho
rity
• in
depe
nden
t pow
er p
rodu
cers
• in
vest
men
t Boa
rd N
epal
• Bu
twal
pow
er c
ompa
ny
• D
epar
tmen
t of r
oad
• D
epar
tmen
t of l
ocal
in
fras
truc
ture
Dev
elop
men
t and
ag
ricul
ture
roa
ds (D
oliD
ar)
• D
epar
tmen
t of r
ailw
ay•
Dep
artm
ent o
f tra
nspo
rt
Man
agem
ent c
ivil
avia
tion
au
thor
ity o
f Nep
al•
road
Boa
rd N
epal
• D
epar
tmen
t of W
ater
sup
ply
and
sew
erag
e•
Wat
er s
uppl
y ta
riff f
ixat
ion
com
mis
sion
(Wst
fc)
• N
epal
Wat
er s
uppl
y co
rpor
atio
ns (NW
sc)
• Ka
thm
andu
upa
tyak
a Kh
anep
ani l
imite
d (K
uKl
)•
Kath
man
du v
alle
y W
ater
sup
ply
Man
agem
ent
Boar
d (K
vWsM
B)•
proj
ect i
mpl
emen
tatio
n D
irect
orat
e (p
iD)
• M
elam
chi W
ater
sup
ply
Dev
elop
men
t Boa
rd
(MW
sDB)
• D
epar
tmen
t of u
rban
D
evel
opm
ent a
nd
Build
ing
cons
truc
tion
(Du
DBc
)•
Dep
artm
ent o
f Wat
er
supp
ly a
nd s
ewer
age
Polic
y
• el
ectr
icity
act
204
9 (1
992)
• W
ater
reso
urce
act
204
9 (1
992)
• el
ectr
icity
reg
ulat
ion
2050
(19
93)
• el
ectr
icity
tar
iff f
ixat
ion
rule
s 20
50
(199
4)•
Nep
al e
lect
ricity
aut
horit
y ac
t 204
1 (1
984)
, am
endm
ent 2
049
(199
2)•
com
mun
ity e
lect
ricity
Dis
trib
utio
n By
law
s 20
60 (
2003
)•
elec
tric
ity t
heft
con
trol
act
205
8 (2
001)
• H
ydro
pow
er D
evel
opm
ent p
olic
y (2
001)
• ru
ral e
nerg
y p
olic
y (2
006)
• N
epal
ele
ctric
ity r
egul
ator
y co
mm
issi
on a
ct 2
074
(201
7)t
• pu
blic
roa
d a
ct (1
978)
• ve
hicl
e an
d tr
ansp
ort
Man
agem
ent a
ct (1
992)
• N
epal
civ
il av
iatio
n au
thor
ity a
ct
(199
6)•
loca
l sel
f-G
over
nanc
e ac
t (19
97)
• ro
ad s
ecto
r pol
icy
(199
9)•
Nat
iona
l tra
nspo
rt p
olic
y (2
001)
• Br
idge
Mai
nten
ance
pol
icy
(200
4)•
loca
l inf
rast
ruct
ure
Dev
elop
men
t po
licy
(200
4)•
prio
rity
inve
stm
ent p
lan
(199
7-20
07, 2
007-
201
6)•
stra
tegi
c ro
ad N
etw
ork
(srN
) M
aste
r pla
n (2
0-ye
ar M
aste
r pl
an)
• av
iatio
n p
olic
y (2
006)
• in
vest
men
t Boa
rd a
ct, (
2010
)
• so
lid W
aste
cen
ter a
ct (1
987)
• so
lid W
aste
reg
ulat
ion
(198
9)•
Nep
al W
ater
sup
ply
corp
orat
ion
act (
1989
)•
Wat
er r
esou
rce
act (
1992
)•
Wat
er r
esou
rce
regu
latio
n (1
993)
• D
rinki
ng W
ater
reg
ulat
ion
(199
8)•
loca
l sel
f-G
over
nanc
e ac
t and
reg
ulat
ion
(199
9)•
Wat
er r
esou
rce
stra
tegy
(200
2)•
rura
l Wat
er s
uppl
y an
d sa
nita
tion
Nat
iona
l pol
icy
(200
4)•
rura
l Wat
er s
uppl
y an
d sa
nita
tion
stra
tegy
(200
4)•
rura
l Wat
er s
uppl
y an
d sa
nita
tion
sect
oral
st
rate
gic
plan
(20
04)
• W
ater
sup
ply
Man
agem
ent B
oard
act
(200
6)•
urb
an W
ater
sup
ply
and
sani
tatio
n po
licy
(200
9)•
Nat
iona
l Wat
er s
uppl
y an
d sa
nita
tion
polic
y (2
014)
• lo
cal s
elf-
Gov
erna
nce
act,
2017
• N
atio
nal u
rban
pol
icy
(200
7)•
plan
for
act
ion
for N
ew
urb
an a
gend
a (2
016-
2036
)•
Nat
iona
l urb
an
Dev
elop
men
t str
ateg
y (2
017)

N e p a l I N f r a s t r u c t u r e 2 0 3 0 : I n v e s t m e n t a n d F I n a n c I n g n e e d s
98
eNDNOtesa https://kathmandupost.ekantipur.com/news/2017-11-17/nea-ctgi-seal-deal.html
b https://www.inheadline.com/news/gautam-buddha-international-airport-expected-to-miss-2019-deadline
c https://thehimalayantimes.com/nepal/chinese-contractor-vows-to-complete-pokhara-regional-intl-airport-on-time/
d https://thehimalayantimes.com/business/modalities-proposed-build-nijgadh-airport/
e http://admin.myrepublica.com/economy/story/23976/evaluation-of-western-part-of-mid-hill-highway-project.html
f https://www.ktm2day.com/2013/03/02/mechi-mahakali-railway-project-report-prepared/
g http://www.myrepublica.com/news/19745/
h http://www.myrepublica.com/news/35683/
i http://kathmandupost.ekantipur.com/news/2018-04-08/construction-of-north-south-highway-moves-ahead-swiftly. html
j http://www.myrepublica.com/news/13660/
k https://www.ktm2day.com/2017/05/29/kathmandu-tarai-expressway-foundation-stone-laid/
l http://www.melamchiwater.gov.np/about-us/melamchi-ws-project/project-description/
m These critical values are based on sample sizes of 500 and 1000 observations and 20,000 and 40,000 replications, respectively (Narayan, 2005). Narayan (2005) provides the corresponding critical values for small sample sizes ranging between 30-80 observations.
n This is computed using the project-level data on the total cost and quantity of the major output – such as additional kilometers of highway constructed under the project (ADB, 2017, p. 99).
o Similar to ADB (2017, p. 96), we assume a depreciation rate of 2% for electricity and 3 % for roads and water supply and sanitation.
p The data obtained from World Development Indicator (WDI).
q See Kharas (2010b) for details. Kharas (2010b) classifies Nepal as the poor non-converging country in the “Four-speed classification”.
r Apart from central institutional set-up, the institutional set-up for urban water supply is equally complex. Selected urban portions of the Kathmandu Valley receive water from the Kathmandu Upatyaka Khanepani Limited (KUKL) operated systems. KUKL, a government share-dominated company operates, under a 30 years lease license, through Kathmandu Valley Water Supply Management Board (KVWSMB), which is the asset owner of the systems. An independent Water Supply Tariff Fixation Commission oversees tariff determination and regulation. Many other cities and towns in the country are served by systems operated by Nepal Water Supply Corporation, established under the NWSC Act (1989). A few towns like Hetauda, Bharatpur, and Dharan, have their own water boards established under the Water Supply Management Board Act (2006).
s GoN restructured the Nepal Water Supply Corporation (NWSC) into two parts: operation system managed under the jurisdiction of NWSC inside Kathmandu valley – NWSC1, and inside valley – NWSC2. Water supply and sewerage system inside the valley (NWSC2) has been disintegrated into three separate entities, each for the role of asset ownership and policy setting (Kathmandu Valley Water Supply Management Board), operation and management of services (Kathmandu Upatyaka Khanepani Limited), and economic regulation of the services (Water Supply Tariff Fixation Commission).
t Parliament endorsed the Electricity Regulatory Commission Bill 2017 on August 11, 2017 which, will become a law in 91 days after the President signs it.

N e p a l I N f r a s t r u c t u r e 2 0 3 0 : I n v e s t m e n t a n d F I n a n c I n g n e e d s
99
N e p a l I N f r a s t r u c t u r e 2 0 3 0 : I n v e s t m e n t a n d F I n a n c I n g n e e d s
100
INstItute For INtegrated developmeNt studIes (IIds)P.O.Box No. 2254, Mandikhatar, Kathmandu
Tel: 977-01-4371006/4378831 | Fax: 977-01-4378809
Email: [email protected] | Website: www.iids.org.np
coNFederatIoN oF Nepalese INdustrIes (cNI)P.O.Box No. 21056, Trade Tower, 5th floor, Thapathali, Kathmandu
Tel: 977-01-5111122/5111123 | Fax: 977-01-5111125
Email: [email protected] | Website: www.cnind.org