Embed Size (px)
Citation preview
rsif.royalsocietypublishing.org
ResearchCite this article: Zhang H, Hou W, Henrot L,
Schnebert S, Dumas M, Heusele C, Yang J.
2015 Modelling epidermis homoeostasis and
psoriasis pathogenesis. J. R. Soc. Interface 12:
20141071.
http://dx.doi.org/10.1098/rsif.2014.1071
Received: 25 September 2014
Accepted: 10 December 2014
Subject Areas:systems biology, computational biology,
biophysics
Keywords:mathematical model, bimodal switch,
epidermal homoeostasis, psoriasis,
immune system
Author for correspondence:Jin Yang
e-mail: [email protected]
†These authors contributed equally to this
study.
Electronic supplementary material is available
at http://dx.doi.org/10.1098/rsif.2014.1071 or
via http://rsif.royalsocietypublishing.org.
& 2015 The Author(s) Published by the Royal Society. All rights reserved.
Modelling epidermis homoeostasis andpsoriasis pathogenesis
Hong Zhang1,2,†, Wenhong Hou1,†, Laurence Henrot3, Sylvianne Schnebert4,Marc Dumas4, Catherine Heusele4 and Jin Yang1
1CAS – MPG Partner Institute for Computational Biology, Shanghai Institutes for Biological Sciences,Shanghai 200031, People’s Republic of China2Naval Submarine Academy, Qingdao, Shandong 266000, People’s Republic of China3Sprim Advanced Life Sciences, 1 Daniel Burnham Court, San Francisco, CA 94109, USA4LVMH Research, 185 Avenue de Verdun, Saint-Jean-de-Braye 45804, France
We present a computational model to study the spatio-temporal dynamics
of epidermis homoeostasis under normal and pathological conditions.
The model consists of a population kinetics model of the central transition
pathway of keratinocyte proliferation, differentiation and loss and an
agent-based model that propagates cell movements and generates the
stratified epidermis. The model recapitulates observed homoeostatic cell
density distribution, the epidermal turnover time and the multilayered
tissue structure. We extend the model to study the onset, recurrence and
phototherapy-induced remission of psoriasis. The model considers psoriasis
as a parallel homoeostasis of normal and psoriatic keratinocytes origina-
ted from a shared stem cell (SC) niche environment and predicts two
homoeostatic modes of psoriasis: a disease mode and a quiescent mode.
Interconversion between the two modes can be controlled by interac-
tions between psoriatic SCs and the immune system and by normal and
psoriatic SCs competing for growth niches. The prediction of a quiescent
state potentially explains the efficacy of multi-episode UVB irradiation
therapy and recurrence of psoriasis plaques, which can further guide
designs of therapeutics that specifically target the immune system and/or
the keratinocytes.
1. IntroductionThe epidermis, the outermost layer of skin, provides the human body a physio-
logical barrier to the environment and protects the body from water loss,
pathogenic infection and physical injury. The epidermis organizes into a stratified
structure of keratinocytes at several differentiated stages [1], which constitute
95% cell population in the epidermis [2]. Like other regenerative tissues, the
epidermis constantly renews itself to replace desquamated and apoptotic
keratinocytes, repair tissue damage and establish homoeostasis. The renewal is
orchestrated by a cascade of cellular processes including proliferation, differen-
tiation, migration, apoptosis and desquamation [3–5]. A keratinocyte transits
spatially from the stratum basale to the stratum corneum during its lifespan
and meanwhile experiences multi-stage biochemical and morphological changes.
Many endogenous and exogenous factors (e.g. Ca2þ concentration, cytokines,
UV irradiation, etc.) affect epidermal dynamics and the homoeostasis of the
epidermis by regulating one or more cellular processes.
Mathematical and computational models have long been useful tools to pre-
dict cellular behaviours of epidermis renewal under normal or pathological
conditions. Previous models for epidermal dynamics have usually adopted
two approaches. One approach includes deterministic models that derived
analytical solutions to stationary cell populations. For example, the model by
Savill [6] described proliferation of stem cells (SCs) and transit-amplifying
(TA) cells and differentiation to post-mitotic cells, which predicted the influ-
ences of apoptosis, cell-cycle time and transit time on cell populations.

kstem cell
transit-ampl-ifying cell
growth-arre-sted cell
spinous cell
apoptosisapoptosis
proliferative compartment
stratum basale
non-proliferative compartment
corneocyte
desquamation
central transition pathway
granular cell
apoptosis apoptosis apoptosis
g1proliferation
b1
k1s, k1a
k–1 k–2
k3 k4 k5k2s, k2a
b2 b3 b4 b5 a
g2proliferation
stratumgranulosum
stratumcorneum
stratumspinosum
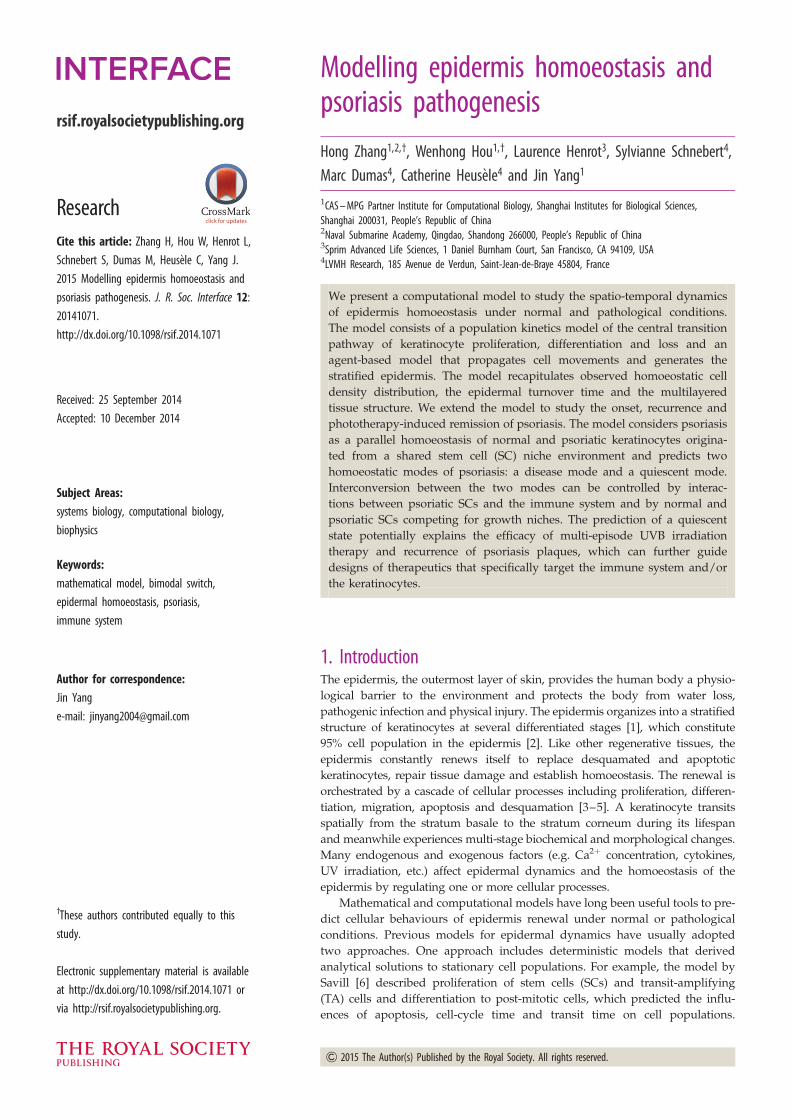
Figure 1. The central transition pathway of the epidermis renewal. The model describes proliferating and non-proliferating keratinocytes. SCs and TA cells proliferateby self-renewal and by symmetric division and asymmetric division. The TA cells differentiate into the GA cells in the non-proliferative compartment, which in turndifferentiate into keratinocytes of later stages, including SP cells, GC and CC. Nucleated cells undergo apoptosis and CC desquamate from the stratum corneum. Allcellular processes are parametrized by rate constants labelled on transitions.
rsif.royalsocietypublishing.orgJ.R.Soc.Interface
12:20141071
2
Gandolfi et al. [7] proposed a spatio-temporal model to inves-
tigate the evolution of the epidermis, which described cell
motion by a constitutive equation. The other approach
includes agent-based models that treat individual keratino-
cytes as computing entities operating under specific
physical and biological rules. Such models can simulate the
multi-layer epidermal structure organized by cell prolifer-
ation, differentiation, death and migration, in which non-
specific intracellular and extracellular biochemical factors
affected cell proliferation and differentiation, while physical
adhesive and repulsive forces governed cell motion [8–12].
In this paper, we present a hybrid model to combine
advantages of the above two approaches. The model uses a
mean-field cell population kinetics together with an agent-
based model for cell migration. The model computes popu-
lation dynamics of epidermal renewal without having to
compute the cell movements simultaneously, allowing fast
and analytical evaluations of modelling hypotheses and
results. The population kinetics model describes cellular pro-
cesses including cell division, differentiation, apoptosis and
desquamation. Either deterministic or stochastic simulation
can be used to generate the population dynamics of keratino-
cytes. Cell migration is described by a two-dimensional
agent-based model that tracks the cell movement driven by
cell–cell interactions. Simulation of cell migration can be
integrated with the stochastic population dynamics to visua-
lize tissue stratification and establishment of homoeostasis.
A properly parametrized model reproduces experimentally
observed epidermis growth, differentiation and desquamation
dynamics, homoeostatic density distribution over different
types of keratinocytes and the epidermis turnover times of
different cell compartments.
To investigate an important pathological condition of the
skin, we study the onset and recurrence of psoriasis plaques
and their recovery under phototherapy using UVB irradiation.
Psoriasis is a complex epidermal disorder characterized by
keratinocyte hyperproliferation and abnormal differentiation
due to intricate interactions with the immune system. The dis-
ease affects 2–4% of the general population and currently has
no cure [13,14]. Specifically, we hypothesize a novel mechanism
of SC–immune system interaction and predict the chronic dis-
order as a bimodal switch between a disease phenotypic and
a quiescent (seemingly normal) state. The model hypothesizes
a parallel epidermal homoeostasis simultaneously maintained
by the normal and the psoriatic keratinocytes. The psoriatic
homoeostasis is caused by permanent perturbations in cell div-
ision, apoptosis and differentiation, derived from defective SCs
and their interactions with a weakened immune system. For
treatment, the model predicts that to achieve a controlled remis-
sion, the effective treatment of UVB irradiation must reduce
the high-density psoriatic epidermis below a threshold level
by activating apoptosis in SCs, potentially explaining the
chronicity and recurrences of the disorder and providing a
guide to design feasible therapeutics.
2. The modelThe model consists of (i) a kinetics model, which tracks the
temporal evolution of the cell population of keratinocytes at
several differentiation stages, and (ii) a migration model,
which describes the motion of individual cells to generate the
stratified structure of the epidermis. One can choose the kinetic
model as a standalone module to compute the mean-field
population dynamics or can integrate the two models to
visualize the renewal kinetics and stratification of the tissue.
2.1. Model of cell population kineticsFigure 1 illustrates the central transition pathway of epidermis
renewal. The pathway considers the population dynamics
of six categories of keratinocytes stratified from the stratum
basale to the stratum corneum, including progenitors,
SCs and TA cells in the proliferative compartment, and
differentiated cells in the non-proliferative compartment
with growth-arrested (GA) cells, spinous (SP) cells, granular
cells (GC) and corneocytes (CC). The above classification is
primarily based on known histological structure and physio-
logical function of the human epidermis [15]. GA cells are
precursors for non-proliferating cells. SP cells and GC are
fully differentiated keratinocytes, and the non-nucleated CC
represent the end-stage differentiation and eventually des-
quamate. The central transition pathway incorporates
three main cellular processes: (i) proliferation of SCs and
TA cells, (ii) differentiation including several inter-category
cell conversions, and (iii) cell loss including apoptosis of
nucleated cells and desquamation of the CC.
How SCs maintain the epidermal homoeostasis remains
unresolved [16]. However, recent long-term in vivo lineage
tracing studies on mouse tail tissue by genetic labelling
revealed remarkable details about clonal dynamics of

SC TA GA
(i)
(ii)
(iii)
(i)
(ii)
(iii)
SC
SC SC
TATA
TA TA
TA
GA GA
Figure 2. Proliferation of SC and TA cell. Both SC and TA cell undergo threetypes of divisions: (i) self-proliferation, (ii) asymmetric division, and (iii) sym-metric division.
Table 1. Kinetic equations for the epidermal renewal and homoeostasis. psc, pta, pga, psp, pgc and pcc are cell densities.
cell type rate equation
SC dpsc=dt ¼ [g1(1� psc=pmaxsc )� k1s � b1] psc þ k�1pta
TA cell dpta=dt ¼ (g2 � k2s � b2 � k�1) pta þ (k1a þ 2k1s) psc þ k�2pga
GA cell dpga=dt ¼ (k2a þ 2k2s) pta � (k�2 þ k3 þ b3) pga
SP cell dpsp=dt ¼ k3 pga � (k4 þ b4) psp
GC dpgc=dt ¼ k4 psp � (k5 þ b5) pgc
CC dpcc=dt ¼ k5 pgc � a pcc
rsif.royalsocietypublishing.orgJ.R.Soc.Interface
12:20141071
3
epidermal progenitors, suggesting the existence of either
single (SC alone) or two progenitors (SC and committed
progenitor) [17–19]. As illustrated in figure 2, our model con-
siders a slow cycling SC population together with a faster
proliferating committed progenitors (or, TA cells). A SC
divides in one of three modes [20–22]: (i) self-proliferation,
by which a SC divides into two daughter SCs, (ii) asymmetric
division, by which a SC divides into a SC and a TA cell, or
(iii) symmetric division, by which a SC divides into two TA
cells. Considering a finite availability of SC niches [20,23],
we assume a logistic growth of SCs to limit the SC density
by a maximal growth capacity, which ensures the system
to reach a well-defined steady state (see [24] for a more
general model that guarantees a steady state). Previous
models [17,25] required a precise balance between SC self-
proliferation and symmetric division and were intolerable
to arbitrary perturbations such as population random drift
caused by intrinsic stochasticity in the three-mode SC div-
ision. Similarly, TA cells also divide in one of the three
modes of self-proliferation, symmetric and asymmetric div-
ision into the GA cells [17,26,27]. In addition, a TA cell may
resume the SC state and a GA cell may resume a TA cell
state by backconversions [28].
The rate of progenitor division is often characterized by
the cell-cycle time and by the subpopulation of cells that
are actively dividing (also known as the ‘growth fraction’).
Our mean-field model does not distinguish proliferative pro-
pensity in individual cells and therefore parametrizes cell
divisions with empirical rate constants that integrate
influences of the cell cycle and the growth fraction. Environ-
mental changes regulate the proliferation rate of SCs. For
example, the need to repair tissue damage promotes SC pro-
liferation [19,21,29]. A recent study of hair follicles showed
that TA cells may signal to SCs to regulate proliferation
[30]. To incorporate this feedback mechanism, we assume
an empirical dependence of SC division rate constants, g1,
k1a and k1s, on the density of TA cells and define
g1
g1,h
¼ k1a
k1a,h¼ k1s
k1s,h¼ v
1þ (v� 1)( pta= pta,h)n , (2:1)
where the subscript ‘h’ indicates a homoeostatic rate constant
(see table 3 for numerical values), and v ; rx,max/rx,h is the
ratio of the maximum division rate to the homoeostatic rate
and is assumed identical for all division processes. v reflects
the maximum increase in the growth fraction and/or decrease
in the cell-cycle time when SC proliferation accelerates. At homo-
eostasis of the normal epidermis, the reported growth fraction
varied from 20 to 70% [31,32]. A study in mice epidermis
found a more than 10-fold decrease in the cell-cycle time from
5–7 days to 11 h following tissue abrasion [33], whereas no sig-
nificant change in cell-cycle time was found in psoriasis [34,35].
The exponent n models the sensitivity to the deviation of TA cell
density from the homoeostasis. In the limit of a much reduced
TA cell density ( pta � pta,h), SCs divide at the maximum rate,
rx,max, whereas SCs divide at a minimal rate when TA cells over-
populate ( pta � pta,h). The total SC proliferating rate at
homoeostasis is set about 1022 per day, aligned with four to
six division events per year [19].
The non-proliferative compartment describes a cascade of
differentiations from GA cells to CC. The model also considers
an apoptosis process for all nucleated keratinocytes. Early
studies suggested that apoptosis was only significant for SCs
and TA cells in the proliferative compartment [36]. Recent exper-
iment [37] also showed that apoptosis was evident in the
differentiated keratinocytes. The extent of apoptosis is com-
monly characterized by the apoptotic index, which is typically
quantified using the transferase-mediated uridine nick end lab-
elling assay [36]. For a cell type i, the apoptosis index equals
the probability that a cell undergoes apoptosis, defined as the
ratio of apoptosis rate fapopi to the total outflux fout
i including
rates of apoptosis and transition to the downstream cell category
AI ¼ fapopi
fouti¼ bi
bi þ ki, i ¼ 1, . . . 5: (2:2)
For SCs and TA cells, k1¼ k1s and k2 ¼ k2s are symmetric division
rate constants. Experiments often reported global apoptosis indi-
ces that did not differentiate apoptotic activities in proliferative
and non-proliferative compartments. Apoptotic heterogeneities
of cells within a compartment are even less known. Here, each
cell category is assumed an identical apoptosis index that is
used to calculate the apoptosis rate constants b0is.
Governing system equations (ODEs) are listed in table 1
and computation of the model is described in the electronic
supplementary material, figure S1.

rsif.royalsocietypublishing.orgJ.R.Soc.Interface
12:20141071
4
2.2. Model of cell migrationThe agent-based migration model describes movement of allkeratinocytes in a two-dimensional (cross-sectional) epider-
mis volume. Keratinocytes once derived from SCs move
outward from the stratum basale to the outermost stratum
corneum, to compose a stratified epidermis. The model
describes cell mechanics that propels cell movement. An indi-
vidual cell is subject to three forces: (i) a viscous force due to
cells moving in the surrounding environment; (ii) a repulsive
force due to cell–cell compression, and (iii) an adhesive force
due to interactions among adhesive molecules on cell mem-
branes. Considering the sluggish keratinocyte motion (on a
scale of mm h21) in a fluidic environment with a low
Reynolds number (i.e. viscosity dominates inertia) [38], the
model neglects the acceleration due to inertia. The model
also considers keratinocytes as non-chemical tactic cells that
do not move by self-propulsion. The force balance for the
ith cell is
mdxi
dtþ Fr
i þ Fai ¼ 0, (2:3)
where vector xi is the cell-centre coordinate, and m is the vis-
cosity coefficient. The first term in equation (2.3) is the
viscosity of the epidermis. Fri and Fa
i are repulsive and
adhesive forces between neighbouring cells, which are
sums of forces derived from all individual pairwise contacts,
Fri ¼
Xj¼O(i)
Frij and Fa
i ¼X
j¼V(i)
Faij, (2:4)
where O(i) and V(i) denote sets of cells overlapping and
neighbouring with the ith cell, and Frij and Fa
ij are force vectors
produced onto cell i by interaction (repulsion or adhesion)
between cells i and j. By symmetry, Frij ¼ �Fr
ji and
Faij ¼ �Fa
ji. The model treats individual cells as rigid-body
agents and uses the extent of virtual cell overlap to deter-
mine the repulsive force (figure 3a). Adhesion between
two cells is a function of their spatial distance [39,40]
(figure 3b). Computation of Frij and Fa
ij is given in the
electronic supplementary material.
Previous agent-based models [9,11,41] treated keratino-
cytes as identically sized circles or spheres. However, cells
progressively adopt varied shapes and sizes at different
stages of differentiation. Cells in an outer layer generally
have a more flattened cell body and larger surface area, com-
pared with cells in layers underneath. Tissue location in the
body can also influence cell geometry. For example, com-
pared with the mean basal cell diameter of 6–8 mm at the
forearm and hand [42], at unexposed sites in adult tissue
[3], the average cell diameter in the proliferative compart-
ment is about 10 mm, whereas the average differentiated
cell diameter is about 16 mm. For simplicity, we use ellipsoids
to model geometric heterogeneity in cell morphology and
size. Cell types are distinguished by the mean major-to-
minor axis ratio and the mean nominal size.
The basement membrane of the epidermis is undulant
with rete ridges extending downward between the dermal
papillae (figure 3c). In the adult human epidermis, the aver-
age rete ridge height is about 40 mm, and about six rete ridges
along 1 mm cross-sectional tissue length were observed [43],
which changes with age. The basement membrane is mod-
elled by periodically repeating Gaussian functions (see the
electronic supplementary material). Parameters of cell sizes
and epidermis thickness are listed in table 2.
3. ResultsThe model recapitulates two important measures of epidermis
homoeostasis: cell counts in different layers and epidermal
turnover times in different compartments.
3.1. Homoeostatic cell density distributionMean homoeostatic cell densities can be analytically calcu-
lated from the ordinary differential equations in table 1 as
follows (see table 3 for definitions of parameters):
psc ¼ pmaxsc 1� 1
g1
�k1s þ b1�
�k�1(k1a þ 2k1s)
k�1 þ k2s þ b2 � g2 � k�2(k2a þ 2k2s)=(k�2 þ k3 þ b3)
��,
(3:1)
pta ¼k1a þ 2k1s
k�1 þ k2s þ b2 � g2 � k�2(k2a þ 2k2s)=(k�2 þ k3 þ b3)psc,
(3:2)
pga ¼k2a þ 2k2s
k�2 þ k3 þ b3
pta, (3:3)
psp ¼k3
k4 þ b4
pga, (3:4)
pgc ¼k4
k5 þ b5
psp (3:5)
and pcc ¼k5
apgc, (3:6)
and the total cell density is given as
ptot ¼ psc þ pta þ pga þ psp þ pgc þ pcc: (3:7)
The density of each cell category is proportional to the epider-
mis capacity of SCs, pmaxsc and the ratio between densities of
any pair of cell types is a constant. Therefore, the observed
cell density distribution can be used to identify kinetic
parameters. The homoeostatic TA-cell density is
pta,h ¼k1a,hþ 2k1s,h
k�1þ k2sþb2 � g2� k�2(k2a þ 2k2s)=(k�2þ k3 þb3)psc,h:
(3:8)
Kinetic parameters must satisfy two necessary conditions to
establish a physiologically proper steady state
g1,h . b1 þ k1s,h
� k�1(k1a,h þ 2k1s,h)
k�1 þ k2s þ b2 � g2 � k�2(k2a þ 2k2s)=(k�2 þ k3 þ b3)
(3:9)
and
k�1 þ k2s þ b2 . g2 þk�2(k2a þ 2k2s)
k�2 þ k3 þ b3
: (3:10)
Given the small backconversion rate (k21 and k22 assumed at
1026 per day, 3–5 orders of magnitude smaller than the SC
and TA cell proliferating rate constants, table 3), the above
conditions simplify to
g1,h . k1s,h þ b1 and g2 , k2s þ b2: (3:11)
The first condition ensures the establishment of a viable SC
population, whereas the second condition prevents an
unchecked growth of the epidermis because the proliferation
of TA cells is not limited by a maximum capacity in the
model. These conditions extend a previous treatment that
required a precise balance between self-proliferation and

epid
erm
isth
ickn
ess
rete
rid
gehe
ight
(c)
basementmembrane
Fr1
Fr13
Fr1 = Fr
12 + Fr13
Fr12
S13
S12q13
q12
h
w
cell centre
2
1
3
(a)
H
cell centre
2
1
(b)
3
dermis
Fr,x = kS13cosq1313
Fr,y = kS12sinq1212
Fr,y = kS13sinq1313
Fa1 = Fa
12 + Fa13
Fa,x = fadh(g12)cosq1212
Fa,y = fadh(g12)sinq12
Fa,x = fadh(g13)cosq1313
13Fa,y = fadh(g13)sinq13
12
q12
q13
g12
g13
y12x12
Fa13
Fa1
Fa12
Fr,x = kS12cosq1212
Figure 3. Mechanics of cell migration. Keratinocytes are geometrically modelled as irrotational ellipsoids with two principal axes staying horizontal or vertical. (a) Arepulsive force is generated due to an area overlap between neighbouring cells. The repulsion Fr
12 between cells 1 and 2 is proportional to the overlapping area S12
approximated by the corresponding overlap rectangle (electronic supplementary material). Fr13 is determined similarly. The net repulsion on cell 1 is calculated as the
vector sum Fr1 ¼ Fr
12 þ Fr13. (b) The adhesive force exists between two adjacent cells. The force Fa
12 is related to the distance between cell 1 and cell 2 (see theelectronic supplementary material). The net force on cell 1, Fa
1, is calculated by the vector sum of Fa12 and Fa
13. The direction of Fa12 or Fr
12 acting on cell 1 isparalleled to the line (dashed) connecting centres of cell 1 and cell 2. The repulsive force and adhesive force between two neighbouring cells are balancedby the force generated by viscosity due to cell motion. Cell motion is only translational without rotation. w and h denote the width and height of a cell.(c) Epidermis thickness, rete ridge height and undulant basement membrane geometrically configure the epidermis in the two-dimensional projection.
rsif.royalsocietypublishing.orgJ.R.Soc.Interface
12:20141071
5
symmetric division in progenitor cells when apoptosis
was neglected [17,25]. Apoptosis is a rare event compared
with progenitor self-proliferation and symmetric division
(e.g. b1 � g1,h and� k1s,h; see table 3) and plays a secondary
role in regulating epidermal homoeostasis.
A recent study of progenitors in mice interfollicular epi-
dermis by Mascre et al. [19] suggested that in homoeostasis
SCs proliferate by four to six division events per year,
10–20 times slower than proliferation and differentiation
(about 1.2 events per week) of committed progenitors (TA
cells in our model). This information is reflected such that
k1a,h þ 2k1s,h is an order of magnitude smaller than g2 þ2k2s. However, considering that TA cells have a much larger
population than SCs ( pta/psc � 5 [32]), rates of SC asym-
metric and symmetric divisions into TA cells (k1a,h þ 2k1s,h)
must be about fivefold greater than the difference between

Table 2. Parameters for cell size and the undulant rete ridge.
cell type w (mm) 3 h (mm) reference
SC 10 � 15 [3,42]
TA cell 10 � 15 [3,42]
GA cell 12 � 10 [3,42]
SP cell 12 � 8 [3,42]
GC 22.5 � 4 [3,42]
cornified cell 35 � 1 [44 – 47]
rete ridge parameters (see the electronic
supplementary materials):
A ¼ 63 mm, B ¼ 23 mm, ss ¼ 70 mm
[43]
rsif.royalsocietypublishing.orgJ.R.Soc.Interface
12:20141071
6
TA-cell self-proliferation and symmetric division, i.e. k2s þb2 2 g2 based on equation (3.2), assuming backconversion
rates (k21 and k22) are negligible. Therefore, the model pre-
dicts that mild perturbations on TA-cell dynamics including
proliferation and apoptosis may have substantial effects on
the homoeostatic keratinocyte population.
The model recapitulates the dynamics and the homoeostatic
cell density distribution and the epidermal turnover time, in
both deterministic and stochastic simulations (figure 4a). Start-
ing from an initial SC population, the cell density rapidly
increases to reach about 80% of the homoeostatic density
in the transient phase of the first 100 days and significantly
slows down when it approaches homoeostasis. The simulation
reached homoeostasis in about 2000 days to a total density at
101 684 cells mm22. The transient dynamics is more than an
order of magnitude slower than that in the model by Grabe &
Neuber [9,61], where the authors reported a near 2000 h transi-
ent dynamics from an initial SC population to homoeostasis.
This discrepancy is caused by a slow SC dynamics of four to
six cell events per year reported recently [19], which also
agrees with an early-reported cell cycle of 100–200 h in a 20%
growth fraction in an animal model [62]. Therefore, the SC
dynamics (equation (2.1)) becomes a rate-limiting step to the
dynamic establishment of homoeostasis, notably when the
system approaches homoeostasis.
Figure 4b shows a histogram of the simulated steady-state
cell density distribution over different cell types. SCs, TA cells
and GA cells in the stratum basale consist of 22% total cell
population, in which proliferating cells account for 13.2% of
the total cell population, consistent with the experimental
data [32,48,49]. Studies by Bergstresser et al. [50] also suggested
that 30% of nucleated keratinocytes were in the basal layer
where SCs occupied 10% of the population [32]. SP and GC
are the majority, consisting of 51.3% of the total keratinocytes
with the population of SP cells nearly two times that of GC, in
agreement with a previous prediction by Grabe & Neuber
[9,61]. CC consist of 26.6% of the total cell population. Bauer
et al. [48] measured a mean nucleated keratinocytes density
of 75 346 cells mm22, whereas that of the non-nucleated CC
was estimated to be about 18 000 cells mm22, consisting of
19.3% total cell population [49].
Figure 4c shows snapshots of temporal evolution of two-
dimensional epidermal stratification from an initial group of
SCs distributed along the basement membrane to homo-
eostasis. We compute the cell population dynamics and the
cell migration within an area of 1 mm in length by 10 mm
in width. The cell density is defined over a surface area
number of keratinocytes per mm2 without explicitly consider-
ing the epidermis height. The choice of 10 mm (approximately
mean cell size) is to visualize a two-dimensional single layer
of keratinocytes. The simulated tissue histology shows that
the thickness of the nucleated epidermis is about 60 mm,
aligning with observations ranging from 38 to 77 mm with
a mean of 60 mm in adult tissue, with little variation across
age groups [42,43,48]. A movie of the epidermis renewal pro-
cess of normal tissue is available at http://www.picb.ac.cn/
stab/epidermal.html.
3.2. The epidermal turnover timeAnother common measure of epidermis homoeostasis is the
epidermal turnover time t. At the tissue level, t is interpreted
as a time required for replacing the entire epidermis with new
keratinocytes. The epidermal turnover time varies signifi-
cantly with age groups, tissue locations and cell densities.
In earlier studies, t has been reported approximately six to
seven weeks in the volar forearm with a nucleated cell den-
sity of 44 000 mm22 [63,64]. Based on a more recent count
of nucleated cell density of 75 346 mm22 on breast skin [48],
Hoath & Leahy [49] suggested that t should be calculated
as 59.3 days. Renewal of a specific layer of keratinocytes
takes a shorter turnover time. The turnover times of the
stratum basale and the differentiated compartment were
reported as being approximately 22 and 12 days [64], whereas
the stratum corneum has a turnover time that varies from
14 days [51,64] to about 20 days in young adult [65]. Follow-
ing the convention [64], we calculate t as the ratio of total cell
density to the rate of cell loss including desquamation and
apoptosis, or alternatively, the ratio of total cell density to
the rate of cell birth by SC and TA cell divisions because
cell birth and death rates are balanced at homoeostasis
t ¼ ptot
rgrowth¼ ptot
rloss, (3:12)
where the rates of cell growth and cell loss are
rgrowth ¼ g1 1� psc
pmaxsc
� �þ k1a þ k1s
� �psc þ (g2 þ k2a þ k2s) pta
(3:13)
and
rloss ¼ b1 psc þ b2 pta þ b3 pga þ b4 psp þ b5 pgc þ a pcc: (3:14)
An analytical solution to t can be obtained by substituting
equations (3.1)–(3.6) into the above equation. Apoptosis
events represent rare ramifications from the central transition
pathway in normal epidermis renewal. Rate constant of an
apoptotic process bi (1024–1025 d21) is much smaller than
the differentiation and desquamation rate constants ki and a
(about 1021 d21, see table 3). We can approximate rloss by
the rate of desquamation. By also neglecting the
backconversions, we have
t ¼ tprolif þ tdiff þ tcorn, (3:15)
where
tprolif ¼k2s � g2
k1a þ 2k1sþ 1
� �1
k2a þ 2k2s, (3:16)
tdiff ¼1
k3þ 1
k4þ 1
k5(3:17)

Table 3. Model parameters.
parameter description notation (unit) value source
cell population kinetics model
SC growth capacity pmaxsc (mm22) 4.50 � 1023 assumed
nominal SC self-proliferation rate constant g1,h (d21) 3.30 � 1023 estimated
nominal symmetric SC division rate constant k1s,h (d21) 1.64 � 1023 [17,19]
nominal asymmetric SC division rate constant k1a,h (d21) 1.31 � 1022 [17,19]
TA cell self-proliferation rate constant g2 (d21) 1.40 � 1022 [32,48 – 50]
TA cell symmetric division rate constant k2s (d21) 1.73 � 1022 [32,48 – 50]
TA cell asymmetric division rate constant k2a (d21) 1.38 � 1021 [32,48 – 50]
GA-to-SP cell differentiation rate constant k3 (d21) 2.16 � 1021 [48,49]
SP-to-GC cell transit rate constanta k4 (d21) 5.56 � 1022 [48,49]
GC-to-CC cell transit rate constanta k5 (d21) 1.11 � 1021 [48,49,51]
CC cell desquamation rate constant a (d21) 7.14 � 1022 [48,49,51]
backconversion rate constant (TA to SC) k21 (d21) 1.00 � 1026 assumed
backconversion rate constant (GA to TA) k22 (d21) 1.00 � 1026 assumed
maximum fold increase of SC proliferation rate v 100 [31 – 33]
steepness SC proliferation rate regulation by TA cell population n 3 assumed
normal epidermal apoptosis index AIh 0.12% [36,48,49]
psoriatic epidermal apoptosis index AId 0.035% [36,48,49]
fold change of psoriatic SC proliferation rsc 4 [52]
fold change of psoriatic TA cell proliferation rta 4 [52]
fold change of psoriatic cell transit ratea rtr 5 [53,54]
fold change of psoriatic corneocyte desquamation rde 4 [51]
fold change of psoriatic SC growth capacity l 3.5 [55,56]
maximum immune killing rate Kp (mm22 d21) 6 assumed
immune half-activation psoriatic SC density Ka (mm22) 380 assumed
cell migration model
viscosity coefficient m (nN s mm21) 250 [39]
elasticity constant k (nN mm22) 0.04 estimated
adhesion factor of proliferating cells, SC and TA sp (nN) 50 [39,40]
adhesion factor of GA and SP and GC sd (nN) 5 [39,40,57]
adhesion factor of CC sc (nN) 0.5 [39,40,57]
mean cell radius r (mm) 5 estimated
time constant of rete ridge remodelling t (d) 1000 [58 – 60]
maximum rete ridges height of psoriatic epidermis Ymax (mm) 126 assumed
minimal rete ridges height of normal epidermis Ymin (mm) 40 [43]aIn the psoriasis model, due to lack of the granular layer k4 is the rate constant for SP to CC transition, k5 is unused and rtr is the fold change in k3 and k4.
rsif.royalsocietypublishing.orgJ.R.Soc.Interface
12:20141071
7
and tcorn ¼1
a: (3:18)
where t is the sum of contributions by sub-compartment
turnover times as keratinocytes migrate from the proliferative
compartment (tprolif ) through the differentiated compart-
ment (tdiff ) and then through the stratum corneum (tcorn).
We note that t is independent of SC self-proliferation
g1 and the SC capacity pmaxsc . These two parameters deter-
mine the steady-state SC density psc. Both cell density and
cell growth rate are proportional to psc, which masks the
effect of SC self-proliferation dynamics on the turnover
times. The turnover time of a single cell category is the
inverse of the rate constant for the transit to the next cell cat-
egory. Therefore, t can be dominated by a rate-limiting step
in the cell growth and differentiation cascade. From the calcu-
lation by equation (3.12) using parameters in table 3, t is
about 52.5 days, partitioned into 7, 31.5 and 14 days in the
proliferative compartment, differentiated compartment and
the stratum corneum, respectively, within the wide range of
reported adult-tissue measurements between 39 and 75
days [3,51,63].

stem cell corneocytegranular cellspinous cellgrowth-arrestedcell
transit-amplifyingcell
day 1
day 35
day 102
day 988
50µm
100 µm
40
30
20
10
0SC TA GA
cell typeSP GC CC
perc
enta
ge (
%)
2.2
11.08.8
34.2
17.1
26.6
(b)5
4
3
2
1
0
SCTAGASPGCCC
time (day)1 10 102 103 104
cell
dens
ity (
×10
4 m
m–2
)
(a)
(c)
Figure 4. Dynamic and homoeostatic keratinocytes density distribution. (a) Temporal evolutions of cell population of different types of keratinocytes by a deter-ministic simulation (smooth curves) and a stochastic simulation (fluctuated curves). Deterministic simulations started with an initial SC density of 1000 mm22, whichcorresponds to 10 cells under a skin area of 0.01 mm22 for the stochastic simulation. (b) The histogram of the steady-state cell density distribution. (c) Snapshots atday 1, 35, 102 and 988 of the visualization of the two-dimensional epidermis with a thickness of 10 mm. Simulation started with SCs randomly located along thebasement membrane (day 1). Parameter values used in simulations are listed in table 3.
rsif.royalsocietypublishing.orgJ.R.Soc.Interface
12:20141071
8
3.3. Pathogenesis of psoriasisTo investigate an important epidermis disorder, we extend the
above model to study the onset and recurrence of psoriasis
and its management. Psoriasis, an immune system-mediated
chronic skin condition, is characterized by an overproduction
of keratinocytes accompanied by inflammation [66], resem-
bling features found in many autoimmune diseases. Here, we
focus on studying the most prominent type of the disorder,
psoriasis vulgaris, a plaque-formed scaly silvery patch,
affecting the majority of psoriasis patients.
Current studies are inconclusive about whether psoria-
sis (i) arises from genetically hyperproliferative progenitor
keratinocytes, or (ii) is alternatively induced by a faulty
immune system, particularly the over-response of dendritic
cells and T lymphocytes to unresolved self-antigens, which in
turn produces excessive cytokines (such as TNFa) to promote
keratinocyte proliferation, or (iii) more likely an intricate
interplay between keratinocytes and the immune system [66,67].
To examine the pathogenesis of psoriasis, we emphasize
an interplay between keratinocytes overproduction and
responses by the immune system. Our fundamental hypoth-
esis is that a psoriatic epidermis assumes two groups of
keratinocytes: normal and psoriatic, maintaining a parallel
homoeostasis. The psoriatic keratinocytes are derived from
a hyperproliferative SC population co-residing with the
normal SCs at the basement membrane, which compete
for limited SC niches (see figure 5 for illustration). This
hypothesis can be justified by the existence of intrinsically
hyperproliferative SCs or SCs that are more responsive to
growth stimulants originated from an activated immune
system. We modify the above model to describe the com-
petition for niches between the normal and psoriatic SCs.
Dynamics of psoriatic TA and non-proliferative cells are
governed by rate equations as in table 1 for the normal kera-
tinocytes, however, with different parameter values to
generate known phenotypes in psoriatic plaques, with an
exception of GC, which are missing in psoriasis. The
dynamics of psoriatic SCs in our model is similar to the
model of a spruce budworm outbreak by Ludwig et al. [68],
which models the population growth of a single species
under predation.
dpsc
dt¼ g1 1� psc þ ~psc =l
pmaxsc
� �� k1s � b1
� �psc þ k�1 pta,
(3:19)
d~psc
dt¼ rscg1,h 1� psc þ ~psc
lpmaxsc
� �� rsck1s,h � ~b1
� �� ~psc�f( ~psc )þ ~k�1 ~pta (3:20)

growth factors + cytokines(TNF, IL23, IL17, etc.)
normal stem cell
quiescent mode psoriatic mode
psoriatic stem cell
cytotoxic
self antigens
proliferation
apoptosis psoriatic derivatives
healthy derivatives
psoriatic stem-cell niches
healthystem-cell niches
immuneresponses
(DC, T cells)
parallel homoeostasis
inflammation
(b)
(a)
Figure 5. Illustration of the psoriasis model. (a) A diagrammatic scheme of the psoriasis model. Healthy and psoriatic SCs compete for niches to maintain a parallelepidermal homoeostasis. The immune system responds to antigens associated with psoriatic SCs and produces cytokines and growth factors to stimulate hyper-proliferation in psoriatic SCs, staging up inflammation. (b) SC niche competition in the psoriatic tissue. At the quiescent mode, healthy SCs dominate in population,residing in the normal niche repertoire. At the psoriatic mode, psoriatic SCs dominate in population and the niche repertoire expands to accommodate an expandedpopulation of psoriatic SCs.
rsif.royalsocietypublishing.orgJ.R.Soc.Interface
12:20141071
9
and f( ~psc ) ¼Kp ~p2
sc
K2a þ ~p2
sc
: (3:21)
The psoriatic tissue activates the immune system to combat
disease cells. We assume that repertoires for normal psc and
psoriatic ~psc SCs are both limited by the available niche envi-
ronment and psoriatic SCs can acquire a larger growth
capacity. Parameter l (more than 1) accounts for the fold
increase in the growth capacity accessible to SCs. The density
of normal SCs remains limited by pmaxsc , which is invaded by a
fraction (1/l) of psoriatic SCs. Equation (3.21) models the
immune activities triggered by psoriatic SCs. An activated
immune system induces apoptosis of psoriatic SCs. The
activity of the immune system (the killing rate, f( ~psc)) is
directly regulated by the psoriatic SC density, under the
assumption that the immune system is activated in a faster
timescale than the tissue growth. The immune response is sig-
nificantly activated when ~psc exceeds a threshold parametrized
by Ka and is saturated at the maximum rate Kp at ~psc � Ka
when the psoriatic SC population overwhelms that of cytotoxic
T cells. This approach hypothesizes that the immune system
combats disease SCs, but does not exclude the commonly
believed role played by the immune system of inducing kera-
tinocyte overproduction, even though the model does not
explicitly couple the immune system to SC proliferation.
Proliferation rate constants g1, k1s and k1a for the normal
SCs are regulated by the total TA cells, pta þ ~pta, similar to
equation (2.1)
g1
g1,h
¼ k1a
k1a,h¼ k1s
k1s,h¼ v
1þ (v� 1)[( pta þ ~pta )=pta,h]n : (3:22)
In comparison, we assume that psoriatic SCs are not subject
to regulation by the TA cell population and proliferate with
rates rsc-fold higher than the homoeostatic rate constants
(g1,h, k1a,h and k1s,h) of normal SCs. We assume that the
immune response substantially switches on when the psoria-
tic SC population reaches 10% of the SC population in the
normal tissue. This assumption is used to parametrize the
steepest change in the removal rate f( ~psc ) in response to ~psc,
which sets the half-activation density at Ka ¼ffiffiffi3p
psc,h=10.
The model does not consider immune responses against
cells derived from psoriatic SCs by observing that reduction
in the SC population results in a subsequent reduction in
the derived keratinocyte population.
Despite its mechanistic uncertainties, psoriasis plaques
have well-defined tissue-level phenotypes, making it a good
candidate for study by a predictive model. Depending on
its severity, a plaque exhibits a two to five times increase in
the total cell density [52,53,69] with a relatively higher
growth in the proliferative compartment compared with the
non-proliferative compartment [55,56]. A disordered tissue
usually loses the granular layer due to abnormal differen-
tiation and contains a subset of nucleated CC. A psoriatic
plaque also has a turnover time several fold faster [51,70].
More specifically, studies of the cell kinetics of psoriasis
found (i) a significant increase of cell-cycle marker Ki-67 in

Table 4. Cell density distribution (mm22) and turnover times (day). Results are generated using parameters in table 3.
healthy tissue psoriasisa non-symptoma
SC 2268 362 þ 6459 2232 þ 124
TA 11 219 77 þ 32 098 10 715 þ 618
GA 8964 61 þ 20 536 8562 þ 395
SP 34 799 238 þ 79 788 33 236 þ 1536
GC 17 379 119 þ 0 16 598 þ 0
CC 27 055 185 þ 77 633 25 840 þ 1495
total 101 684 1042 þ 216 514 97 183 þ 4168
t ¼ tprolif þ tdiff þ tcorn 52.5 ¼ 7.0 þ 31.5 þ 14.0 9.8 ¼ 1.8 þ 4.5 þ 3.5 44.5 ¼ 6.0 þ 26.5 þ 12.0aNormal þ psoriatic ( px þ ~px ).
rsif.royalsocietypublishing.orgJ.R.Soc.Interface
12:20141071
10
psoriatic tissue without much change in cell-cycle time
[35,71], suggesting a substantial increase in growth fraction;
(ii) the transit time of keratinocytes through the differentiated
compartment is shortened to 48 h from 240 to 330 h, five to
seven times faster than in normal tissue [54]; (iii) the transit time
through the corneum is also shortened from 14 to 2 days [51].
These factors together result in a decrease in the epidermis
turnover time (equation (3.15)). In addition, the cell apoptotic
index decreases nearly fourfold from 0.12 to 0.035% [36],
making a further contribution to keratinocyte overproduction.
Table 3 lists parameter values based on the above observations,
where coefficients rta, rtr and rde are fold changes over rate con-
stants in normal kinetics of TA-cell proliferation (g2, k2a and
k2s), transit in the non-proliferative compartment (k3 and k4)
and desquamation (a), respectively. Similar to variations in
normal tissues, the severity and phenotype of psoriasis vary
widely across individuals and disease subtypes and there-
fore for any specific condition or study the model should be
parametrized accordingly.
As the main result, the model predicts two interconverting
homoeostatic modes of psoriatic tissue (see appendix A for
analytical details): (i) a disease state, which generates psoriasis
phenotypes of keratinocytes overproduction and a shortened
epidermal turnover time when psoriatic SCs outcompete
normal SCs for available niches and overwhelm the immune
system; and (ii) a quiescent state, which predicts a coexistence
of a small number of psoriatic cells with a dominant popu-
lation of normal keratinocytes when the immune system
keeps the psoriatic SC population low. The quiescent mode
with remanent psoriatic SCs is a symptomless state for a
psoriasis-susceptible tissue and may relapse into the disease
state given favourable conditions. On the other hand, the dis-
ease state may be reverted back to the quiescent state by a
properly designed treatment.
The model is parametrized (table 3) to produce a specific
psoriasis phenotype, in which the total cell density reaches
217 000 mm22 at homoeostasis, more than two times the
normal epidermis (101 600 mm22), with the pathological kera-
tinocytes consisting of 99.5% of the total population. The
relative growth of the proliferative compartment over the
non-proliferative compartment is about three versus two
times the normal densities (table 4). The epidermal turnover
time is shortened more than five times from 52.5 to 9.8 days.
The psoriatic epidermis may retreat to the ‘quiescent’ state
and achieve a remission provided that the psoriatic SC density
can be managed below a threshold value (see appendix A).
Narrow-band 311 nm controlled UVB irradiation is known as
an effective treatment for managing psoriasis [72]. For example,
a recent study by Weatherhead et al. [53] applied sequential
episodes of 0.75–3 minimal erythemal dose UVB irradiation
to achieve plaque remission by inducing strong apoptosis of
proliferative cells. Figure 6a shows a model simulation of psor-
iasis remission after a simulated sequence of seven-episode
UVB irradiations. Each UVB irradiation episode is simulated
by increasing apoptosis rate constants 60 000-fold indiscrimi-
nately for normal and psoriatic SCs and TA cells for 48 h
followed by a 8-h resting interval before starting the next epi-
sode. The entire treatment lasts 16 days. Model simulations
unveil an intriguing interplay between the dynamics of psoria-
tic and normal cells. Upon the initiation of irradiation, the total
cell population first declines due to the UVB-induced apoptosis
in SCs and TA cells. Each episode of UVB irradiation induced
apoptosis in about 22% of the SCs in the pre-episode population
(see figure 6a, inset). The population of TA cells declined more
substantially due to the combined effects of increased apoptosis
and reduced SC symmetric and asymmetric divisions. A mild
rebound of cell densities happens in each resting interval
because of a continuing hyperproliferation of psoriatic SCs
and TA cells. At the end of the treatment, the total keratinocyte
density dramatically drops more than 95% from 217 000 to 12
100 mm22, with normal and psoriatic SCs, respectively,
reduced to 260 and 960 mm22. Post-treatment the SC popu-
lation continues to decline to the ‘quiescent’ steady state due
to a relatively stronger immune response (figure 6b; electronic
supplementary material, figure S3c and related text), which
later brings down the psoriatic cell density to a minimum
(less than 0.5% of the total cell density, table 4). The GC
become visible during the recovery. The last phase indicates a
recovery of keratinocytes derived from the normal SCs that
reclaim their niche repertoire by a slower kinetics (figure 6c).
The downstream differentiated cells follow similar dynamics
of remission. Simulated dynamics are similar if the model
considers UVB-induced apoptosis in all nucleated cells (results
not shown).
A treatment with less UVB irradiation episodes and/or
inadequate intensity may fail to clear a psoriatic plaque,
which eventually returns to the disease state once the treat-
ment stops due to an insufficient loss in psoriatic SCs.
Figure 6b,c shows that after a six-episode UVB irradiation
treatment, the psoriatic SC and TA cell populations bounce

10−1
10−1 102 103 104 105101
102
102
103
104
105
103 1041010
2
4
6
8
10
time (day)
cell
dens
ity (
×10
4 m
m−
2 )
cell
dens
ity (
×10
4 m
m−
2 )
cell
dens
ity (
mm
−2 )
psoriasis
UVBirradiation
recovery
SCTAGASPGCCC
0 5 10 15 20time (day)
0
1
2
3
4
time (day)10−1 102 103 104
tprolif
tdifftcorn
105101time (day)
solid: 7-episodedashed: 6-episode
psoriatic progenitor
(b)
(a)
cell
dens
ity (
×10
3 m
m−
2 )
0
5
10
15
(c)
SCTA
normal progenitor
SCTA
0
2
4
6
8
10
cell
dens
ity (
×10
4 m
m−
2 )
healthypsoriatic
recovered
(d )
0
20
40
60
turn
over
tim
e (d
ay)
healthypsoriatic
recovered
(e)
Figure 6. Psoriasis and its management by phototherapy. (a) Three dynamical phases of cell densities from psoriasis, the UVB treatment and recovery. Trajectoriesare combined populations of psoriatic and normal cells. Both stochastic and deterministic trajectories are shown. The stochastic simulation was conducted in an areaof 0.05 mm22. Inset: zoomed details of the UVB irradiation phase (from day 1 to day 17). (b) Psoriatic and (c) normal SC and TA cell densities before and after six-or seven-episode treatment. The treatment started at time day 1. Each simulated UVB irradiation episode induces 60 000-fold increases in apoptosis rate constants forSCs and TA cells and lasts for 48 h. The time interval between two consecutive episodes is 56 h (48 h irradiation þ 8 h resting). (d,e) Homoeostatic cell densitydistributions and the epidermal turnover times for healthy, psoriatic and recovered tissues. Note that the granular layer is missing in the psoriatic population.
rsif.royalsocietypublishing.orgJ.R.Soc.Interface
12:20141071
11
back to the disease state after terminating the treatment.
The total cell density drops to 18 600 mm22 at the end of
the sixth episode with the normal and psoriatic SC densi-
ties as 247 and 1263 mm22, respectively. Interestingly, the
end-treatment normal SC count is slightly less than that
after a seven-episode treatment, implying that the increa-
sed normal SC proliferation rate due to loss of TA cells
well below the healthy level, offsets the cell loss caused by
apoptosis. Shortly after the treatment has stopped, both psor-
iatic and normal SCs and TA cells started to increase slowly,
but later the density of psoriatic cells (figure 6b) rapidly
expands and outcompetes the normal cells (figure 6c) that
retreat from a maximum to the steady state at a lower level.
During the entire course of the treatment, the cytotoxic rate
remains below the growth rate of psoriatic SCs, giving no
chance for the immune system to effectively reduce the psor-
iatic SC population (see electronic supplementary material,
figure S3d ).
Histograms in figure 6d,e show that a well-designed
treatment can manage the psoriatic tissue to the quiescent

rsif.royalsocietypublishing.orgJ.R
12
state that is almost phenotypically indistinguishable from thehealthy tissue regarding cell density distribution and the
turnover time. Histologically, psoriasis causes thickening in
the stratum corneum and the differentiated layer as well
as an expanded proliferating compartment with more pro-
truding rete ridges [73]. A dynamic model of rete ridge
remodelling, simulation snapshots of the homoeostatic psor-
iatic epidermis, tissue under treatment and recovered tissue
can be found in the electronic supplementary material,
figures S3 and S4). Movies of simulations (normal and
UVB-treated psoriatic tissues) are provided at http://www.
picb.ac.cn/stab/epidermal.html.
.Soc.Interface12:20141071
4. DiscussionWe presented a hybrid model that simulates and visualizes
spatio-temporal dynamics of epidermal homoeostasis. The
model represents an efficient approach that separates the
computation of cell kinetics from that of an agent-based
cell migration. Compared to previous agent-based models
[8,9,11,12], our population kinetics model describes cell pro-
liferation, differentiation and cell death as empirical rate
processes and can be simulated by integrating the governing
ordinary differential equations (table 1) or the master equations
by a kinetic Monte Carlo algorithm. The cell population kinetics
model can be combined with a two-dimensional cell migration
model to visualize dynamics of epidermis renewal and stratifi-
cation. The model reproduces observed characteristics of
the normal epidermis. Model analysis and simulations show
that balancing cell production and cell loss in each sub-
compartment is critical to establishing and maintaining
proper epidermis homoeostasis (figure 4).
The current model has some addressible limitations: (i) the
cell population kinetics does not explicitly incorporate specific
intracellular and extracellular factors that affect the dynamics
and steady state of the epidermis homoeostasis. However,
physiological and physical factors including age and UV
irradiation as well as many commonly investigated signalling
molecules can be coarsely coupled to model parameters such
as proliferation and differentiation rate constants and mor-
phology of keratinocytes and the epidermis. (ii) We neglected
the effects of backconversions from TA cells to SCs and from
differentiated cells to TA cells by assuming their minimal
impact. These processes could be worth a close examination
as suggested in a recent theoretical study [74] that showed
rare backward transitions may cause catastrophic outcomes
such as cancerous growth. (iii) Technically, as intensive model-
ling and computation is made possible by high-performance
hardware [75,76], our two-dimensional cross-sectional model
can be extended to simulate a more realistic three-dimensional
epidermis even though we expect that the qualitative results
obtained from the two-dimensional model remain valid in a
three-dimensional model.
As an important application, a non-trivial extension to the
above model allows us to investigate the pathogenesis of psoria-
sis, an immune-mediated skin disorder. Genetic origins of
psoriasis have been recently explored by an increasing number
of genome-wide association studies that identified a mult-
itude of psoriasis susceptibility loci [77–80]. Many psoriasis-
associated loci are connected to genes in the immune system
(e.g. MHC class I molecules) and proteins expressed in keratino-
cytes, suggesting a complex nature of the disease [81]. However,
the mechanistic epidermis–immune system interactions impli-
cated by these loci are yet to be resolved.
In this study, we propose an alternative hypothesis of
interactions between the immune system and keratinocytes,
in which the disordered epidermis maintains a parallel
homoeostasis of both normal and psoriatic keratinocytes,
derived from respective SC populations. We examine this
hypothesis in an extended model and demonstrate that treat-
ment by UVB irradiation with consecutive episodes can
potentially manage the disease and achieve a remission of
the psoriatic phenotype.
Psoriasis has recently been studied by agent-based models
[53,61]. The model by Grabe & Neuber [61] was able to gener-
ate the psoriasis phenotype of an increased cell density and a
shortened epidermal turnover time, by adjusting the fractional
time of TA cell proliferation. This parameter characterizes the
amount of time for proliferation during a constant life time of
a TA cell, which in our model is embedded in the TA cell
self-proliferation rate constant g2. Increasing g2 and keeping
symmetric division rate constant k2s unchanged (equivalent to
keeping a constant TA cell life time) does increase TA cell popu-
lation (equation (3.2)). To obtain a relative growth of the
proliferating compartment, rate constants for cell differentiation
must have relatively higher increases than g2, which was
achieved by modulating the Ca2þ gradient in the Grabe and
Neuber model. The model however did not propose possible
management that can target the hypothesized mechanism.
For example, it is not obvious how apoptosis induced by
episodes of UVB irradiation can attain a remission via recover-
ing the normal TA cell proliferating time. Weatherhead et al.[53] developed a model to simulate UVB-induced apoptosis
in SCs and TA cells, which was able to demonstrate psoriasis
remission after a few episodes of UVB irradiation. The
model assumed a constant pool of SCs that derived TA cells
by asymmetric division and the UVB-induced apoptotic hyper-
proliferative SCs were replaced with normal SCs by symmetric
divisions. This model assumption consequently led to a perma-
nent reduction in cell density after each UVB irradiation
treatment and therefore did not explain relapses of psoriatic
phenotypes once an ineffective treatment ends or recurrence
of the disorder.
Interactions between the immune system and keratino-
cytes considered in our model can serve as a conceptual
basis for interpreting the pathogenesis of psoriasis.
Especially, we showed that the act of the immune system
cytotoxicity against psoriatic keratinocytes plays a pivotal
role in the onset, remission and recurrence of the disease
phenotype. The most common paradigm considers that
faulty immune responses triggered by unknown self-antigens
or pathogens (introduced by injuries or trauma, known as
Koebner phenomenon) produce cytokines and growth factors
that promote keratinocyte hyperproliferation, immature
differentiation and skin inflammation, establishing the
psoriasis phenotype [14,70]. Drugs that inhibit T cell activity
and cytokine productions do improve psoriatic conditions
[82]. By contrast, our model demonstrates that a psoriasis
lesion develops when the immune system is genuinely wea-
kened or locally overwhelmed by a large population of
psoriatic keratinocytes, staging up a chronic condition. This
prediction may explain high occurrence and increasing sever-
ity of psoriasis in HIV-infected, especially late-stage AIDS
patients with substantially compromised immune systems
when CD4þ and naive CD8þ T cell counts substantially

rsif.royalsocietypublishing.orgJ.R.Soc.Interface
12:20141071
13
decrease [83,84]. Furthermore, the onset age of psoriasis hasbeen known to have two separate populations, type I (early
onset in patients younger than 40 with a peak at age 20)
and type II (late onset after age 40 with a peak at about 60)
[85]. Our model speculates that a vigorous immune system
at a younger age can stimulate a strong hyperproliferation
(a large rsc) in a psoriatic epidermis and causes manifesta-
tion of plaque phenotypes. One the other hand, a weak
immune system (a small kp) at an older age can also have
an equivalent effect.
The model prediction provides an alternative (a less
explained) perspective of the pathogenesis of psoriasis,
suggesting that psoriasis is a parallel epidermal homoeostasis
due to heterogeneity in SC clones and that the immune
system as a double-edged sword plays two essential however
opposing roles: (i) cytotoxic (CD8þ) T-cells recruited to the
epidermis induce apoptosis in psoriatic SCs, which is impli-
cated by studies that demonstrated CD8þ T cell (especially,
CD45ROþ memory subtype) count and cytotoxic proteins
including perforin and granyme B substantially increase in
psoriatic lesions [83]; and (ii) immune activities in the mean-
time promote progenitor keratinocytes proliferation by
producing a multitude of cytokines and growth factors
(TNF, IFN-a, IFN-g, IL-17, IL-22, IL-23, etc.). Balance between
the two acts determines the outcome of the disease. Our
model predicts that the psoriasis-susceptible tissue is a bi-
modal system and can switch between a non-symptom
state and a phenotypical state, potentially explaining the
recurring nature of the disorder and suggesting the feasibility
of disease management by an effective treatment. This per-
spective and the model could be in general applicable to
other autoimmune diseases in regenerative tissues.
We showed in UVB phototherapy simulation that psoria-
sis plaque clearance can be attained by inducing strong
apoptosis in keratinocytes. The model only considered
UVB-induced apoptosis in keratinocytes. UVB irradiation
may promote proliferation and differentiation in skin cells
[86,87] or may alter immune responses. These effects could
be incorporated and be examined in the model. For example,
as suggested in equation (3.20), rebalance in self-proliferation
g1,h and symmetric division k1s,h and change in immune
activities f( ~psc ) may affect the population of psoriatic SCs
and thus the therapeutic outcome. Experiments did not
demonstrate whether the UVB irradiation causes non-
apoptotic cell death that was not reflected by an apoptosis
marker [53]. Regardless of the actual mechanism, induced
cell deaths will result in a shift of the SC density from the dis-
ease state to the quiescent state across the phase boundary, an
important parameter that determines the design of a photo-
therapy regimen, including irradiation dosage in each
treatment episode, the number of episodes and the time
interval between consecutive episodes.
The model also suggests the limitation of UVB irradiation
or similar treatments that attempt to achieve plaque remis-
sion by killing keratinocytes below a critical threshold. First,
psoriasis plaques may recur under a temporally weakened
immune system or a transient burst of cell proliferation
caused by conditions such as wound healing. Second,
the psoriatic severity may be worsened under a genuinely
weak immune system (with a low Kp and/or a high thre-
shold Ka), in which the disease phenotype persists and
cannot be adequately reverted by simple reduction in psoria-
tic SCs because the system does not possess a quiescent state
(region I in figure 7b). In the latter case, other treatment
options such as cytokine-targeting biologic and small-
molecule drugs should be considered to at least shift the
disorder to the bimodal region where phototherapy becomes
effective. However, we note that phototherapy may be effec-
tive through alternatively mechanisms other than induction
of apoptosis [88,89], by which it alone may switch a plaque
from persistent disorder (region I) to bimodal (region II) or
symptomless (region III) as in figure 7b.
Further insight from the model is that the bimodal psoria-
sis exhibits hysteresis, by which a mode of the epidermis,
psoriatic or quiescent, once reached under a favourable
condition, will tend to be relatively stable. For example,
a symptomless epidermis as illustrated in figure 7b may
switch to the disease state when Kp is reduced beyond
its lower threshold because of weakening in the immune
system. However, restrengthening the immune system to
revert the disease state back to the quiescent mode requires
elevating Kp in the model beyond the upper threshold,
implying that the disease is resistant to mild natural or
induced perturbations.
One definitive experimental test of our model hypothesis
should aim at simultaneously tracing clones of psoriatic
and normal SC lineages. Because of recent advancement in
techniques, studies of epidermal SCs become central to
the understanding of epidermal homoeostasis. Especially,
emerging powerful in vivo lineage tracing technology allows
dynamic monitoring of SCs and progenitors clone formation
and differentiation and can achieve multicolour simultaneous
tracing of separate clones [27]. The technique has already
been pioneered to study progenitor fates in normal skin
tissue [17] and benign epidermal tumours [90] and can be
potentially applicable to identify the coexistence of normal
and psoriatic progenitors in psoriasis. One potential challenge
is that in either the quiescent or disease state, one type of SCs is
present as a small population (about a 1 : 20 ratio, according to
table 4), making it difficult for differential labelling. Alterna-
tively, an experiment may tend to identify and isolate the
two competing effects by the immune system on the epidermis:
(i) apoptosis in epidermal progenitors by T-cell cytotoxic activi-
ties and (ii) hyperproliferation due to elevated cytokines and
growth factors.
Acknowledgements. We thank Weiren Cui, Eric Perrier, Michael Shleifer,Gallic Beauchef and Delphine de Queral for helpful discussions.
Funding statement. This work was supported by LVMH Recherchethrough Sprim Inc. and institutional fund to J.Y.
Appendix A. Analytical details of the psoriasismodelA.1. Psoriasis as a bimodal switchTo illustrate the principle and simplify the analysis, we only
present a two-dimensional model that describes dynamic
interactions between normal and psoriatic SCs. The complete
model that produced the results (figure 6) is more complex
and of a higher dimension because of the feedback regulation
by the TA cell population on the proliferation of normal
SC (equation (3.22)), requiring analysis of the dynamics of
normal and psoriatic TA cells together. Again, for convenience
in the analysis, we neglect the influences of backconversions
and apoptosis. This simplification allows us to show insights

u
w
1− xu
x1 + x2
disease
transition
quiescent
(a)
x 0 159 440 570 760
10
20
25
III II I
rsc/kp (day)
norm
aliz
ed c
ell d
ensi
ty
(b)
(c)
psoriatic stem cellnormal stem cell
norm
al s
tem
cel
l den
sity
(p sc
)
disease
transition
quiescent
I II
psoriatic stem cell density (psc)~
w
Figure 7. Steady states of the psoriasis model. (a) Intersections of the two functions give the steady states (equation A 2) and can be modulated with w bychanging kp within the range of two bifurcation points (indicated by dashed lines). The ‘quiescent’ and ‘disease’ states (filled circles) are stable steady states.The ‘transition’ state (empty circle) is unstable (i.e. arbitrarily small perturbations deviate the system away from it). (b) Bifurcation diagram under varyingration rsc/kp with three regions: (I) persistent disorder, (II) bimodal and (III) symptomless. (c) Trajectories (arrow-headed) from basins of attraction: I and II, sep-arated by the boundary (dashed line), converge to the quiescent and disease states, respectively. Blue and red curves are nullclines (equations A 2 and A 3).Parameter values used for generating the trajectories are listed in table 3.
rsif.royalsocietypublishing.orgJ.R.Soc.Interface
12:20141071
14
of the behaviours of the model without much mathematical
complication. We work with normalized quantities
x ¼~psc
Ka, y ¼ psc
Ka, ymax ¼ pmax
sc
Kaand kp ¼
Kp
Ka: (A 1)
Ratios between the normal SC proliferation rate constants
remain constant despite their dynamic modulations by the
TA cell population (equation (2.1)), i.e. k1s/g1 ¼ k1s,h/g1,h.
Ignoring the trivial steady states of zero density (x ¼ 0 and/
or y ¼ 0), based on equations (3.19)–(3.21) we have the
steady-state equations for SC densities as
w 1� xu
� �� x
1þ x2¼ 0 (A 2)
and
y ¼ u� xl
, (A 3)
where
w ¼ rsc
kp1� 1
l
� �(g1,h � k1s,h) (A 4)
and
u ¼ lymax 1� k1s,h
g1s,h
� �: (A 5)
Equation (A 2) can solve for one or three steady-state psoriatic
SC densities, only depending on choices of two parameters, wand u, which is illustrated in figure 7a.
To study plaque remission and relapse, we are interested
in the region where the system has two stable steady states,
‘quiescent’ and ‘disease’, and one unstable ‘transition’
steady state. This scenario is illustrated in figure 7a with
three intersections between the line w(1 2 x/u) and the
non-parametric curve x/(1 þ x2). Determination of the stab-
ility of these fixed points requires analysis similar to the
spruce budworm model by Ludwig et al. [68]. Figure 7ashows that the ‘quiescent’ state is more sensitive to w,
whereas the ‘disease’ state is determined by both u and w.
This observation provides a guideline to parametrize the
model to attain appropriate psoriatic phenotypes by identify-
ing disease-related parameters rsc, l and kp. The ratio rsc/kp
emerges as the key parameter that characterizes the interplay
between proliferation of keratinocytes and activity of the
immune system (magnitude Kp and threshold Ka), playing
a critical role in the interpretation of the pathogenesis
of psoriasis.
Bifurcation diagrams in figure 7b of steady-state SC
densities shows three classes of behaviours as rsc/kp varies.
A small population of psoriatic SCs survive in the ‘quiescent’
state (rsc/kp , 159 day) under a vigorous cytotoxic activity (a
large kp, i.e. a low threshold Ka and/or a high magnitude Kp)
and/or a moderate SC proliferation (a small rsc). By contrast,
a weak immune system (a small kp, i.e. a high threshold Ka
and/or a low magnitude Kp) cannot adequately counter-
balance the psoriatic hyperproliferation (a large rsc) and
thus the epidermis assumes a persistent ‘disease’ state

rsif.royalsocietypublishing.org
15
(rsc/kp . 440 day). A bimodal system with an intermediatersc/kp has the potential to switch between the quiescent
and disease modes when conditions change. Figure 7cshows a two-dimensional phase plane of normal and psoria-
tic SC densities. Starting from initial SC densities, located
inside region I or II, a temporal trajectory will be attracted
to the quiescent or the disease state, respectively. Those start-
ing on the boundary of the two regions will in theory
converge to the transition state, which is unsustainable
because slight perturbations will dislocate a trajectory into
either region I or II.
J.R.Soc.Interface12:20141071
A.2. Cell density and turnover timeBelow, we provide equations for homoeostatic cell densities
and the turnover time in the psoriatic model. As shorthands,
we define
g ¼ k1a þ 2k1s
k2s � g2
and gh ¼k1a,h þ 2k1s,h
k2s � g2
: (A 6)
The ratio j ¼ g/gh is a function of the steady-state TA cell
population ( pta þ ~pta) by equation (3.22). The total steady-
state cell density is given as
ptot ¼ psc(1þ jghW)þ ~psc 1þ rsc
rta
gheW� �
, (A 7)
where
W ¼ 1þ (k2a þ 2k2s)1
k3þ 1
k4þ 1
k5þ 1
a
� �(A 8)
and
eW ¼ 1þ (k2a þ 2k2s)1
rtrk3þ 1
rtrk4þ 1
rdea
� �rta: (A 9)
Note the lack of the GC layer in the psoriatic cell population.
The proliferative and differentiated cell populations are
pprolif ¼ psc(1þ jgh)þ 1þ rsc
rta
gh
� �~psc (A 10)
and
pdiff ¼ gh(k2a þ 2k2s) pscjþrsc
rtr
~psc
� �1
k3þ 1
k4
� �
þ pscjgnk2a þ 2k2s
k5:
(A 11)
CC are not included in the differentiated compartment. By
comparison, the cell densities in the healthy tissue are
pprolif,h ¼ psc,h(1þ gh) (A 12)
and
pdiff,h ¼ gh(k2a þ 2k2s) psc,h1
k3þ 1
k4þ 1
k5
� �: (A 13)
We can calculate the growth of the proliferative compartment
relative to that of the non-proliferative compartment as
pprolif= pprolif,h
pdiff= pdiff,h¼ psc(1þ jgh)þ (1þ (rsc=rta)gh) ~psc
(1þ gh)
� 1=k3 þ 1=k4 þ 1=k5
( pscjþ (rsc=rtr) ~psc )(1=k3 þ 1=k4)þ pscj=k5
.psc(1þ jgh)þ (1þ (rsc=rta)gh) ~psc
(1þ gh)( pscjþ (rsc=rtr) ~psc ): (A 14)
A relative increase in the proliferative population requires
the above ratio to be greater than 1. In psoriasis, j , 1, reflect-
ing a decreased proliferation rate in the cohabitating normal
SC population due to a much elevated TA cell population.
It is unclear whether SCs and TA cells have differential
increases in proliferation rates. For the lack of information,
we assume rsc/rta � 1. Therefore, rtr . rsc becomes a suffi-
cient (but not a necessary) condition to produce a relative
increase in the proliferative compartment, requiring that the
fold increase of transit rate in the differentiated compartment
is higher than the fold increase of division rates in the prolif-
erative compartment. This result agrees with an earlier
prediction from Heenen et al. [55], showing that a relative
growth in the proliferative compartment requires keratino-
cyte hyperproliferation and in the meantime an increased
transit time in the differentiated compartment. A pro-
portional increase in both TA-cell proliferation rate and
transit rate (rsc ¼ rtr) does not cause relatively differential
growth of the two compartments unless difference exists
between increases of proliferating rates of SCs and TA cells,
rsc = rta. Fast migration of differentiated keratinocytes also
offsets overgrowth in the proliferative compartment. An
important insight from the model is that increasing keratino-
cyte population in psoriasis is not merely caused by elevated
proliferation rates but also requires the increase in growth
capacity in the progenitor repertoire. Observed morpho-
logical remodelling of the psoriatic epidermis suggests
increased growth niches for SCs [73].
Similarly to equation (3.15), the epidermal turnover time
can be approximated as the ratio of the total cell density to
the rate of desquamation
~ttot �ptot
a( pcc þ rde ~pcc )
¼ psc þ ~psc
pscjþ rsc ~psc
1
ghþ pscjþ (rsc=rta) ~psc
pscjþ rsc ~psc
� �1
k2a þ 2k2s
þ pscjþ (rsc=rtr) ~psc
pscjþ rsc ~psc
1
k3þ 1
k4
� �
þ pscj
pscjþ ~psc rsc
1
k5þ pscjþ (rsc=rde) ~psc
pscjþ rsc ~psc
1
a,
(A 15)
which can be analysed for the two psoriasis modes (quiescent
or disease). At the quiescent mode, j � 1 and psc � ~psc, the
turnover time is approximated by
~ttot �k2s � g2
k1a þ 2k1sþ 1
� �1
k2a þ 2k2sþ 1
k3þ 1
k4þ 1
k5þ 1
a, (A 16)
converging back to ttot. At the disease mode, j , 1 and
psc � ~psc. The turnover time is close to
~ttot�1
rscghþ 1
rta
� �1
k2aþ2k2sþ 1
rtr
1
k3þ 1
k4
� �þ 1
rde
1
a: (A17)
Both cases do not account for the relatively much smaller cell
loss by the cytotoxic effect from the immune system. Com-
pared to the turnover time of the healthy tissue ttot
(equation (3.15)), ~ttot of the psoriatic tissue is clearly shor-
tened at each stage from the proliferative compartment (the
first term) to the differentiated compartment (the second
term) and to the corneum (the third term). The turnover
time of the granular layer is ignorable because of the minimal
normal cell population.

16
Referencesrsif.royalsocietypublishing.orgJ.R.Soc.Interface
12:20141071
1. Montagna W, Kligman AM, Carlisle KS. 1992 Atlasof normal human skin. New York, NY: Springer.
2. Burns T, Breathnach S, Cox N, Griffiths C (eds). 2010Rook‘s textbook of dermatology, 8 edn. Oxford, UK:Wiley-Blackwell.
3. Weinstein GD, McCullough JL, Ross P. 1984 Cellproliferation in normal epidermis. J. Invest. Dermatol.82, 623 – 628. (doi:10.1111/1523-1747.ep12261462)
4. Loeffler M, Potten CS, Wichmann HE. 1987Epidermal cell proliferation. II. A comprehensivemathematical model of cell proliferation andmigration in the basal layer predicts some unusualproperties of epidermal stem cells. Virchows Arch. BCell Pathol. Incl. Mol. Pathol. 53, 286 – 300. (doi:10.1007/BF02890255)
5. Milstone LM. 2004 Epidermal desquamation.J. Dermatol. Sci. 36, 131 – 140. (doi:10.1016/j.jdermsci.2004.05.004)
6. Savill NJ. 2003 Mathematical models of hierarchicallystructured cell populations under equilibrium withapplication to the epidermis. Cell Prolif. 36, 1 – 26.(doi:10.1046/j.1365-2184.2003.00257.x)
7. Gandolfi A, Iannelli M, Marinoschi G. 2011 An age-structured model of epidermis growth. J. Math. Biol.62, 111 – 141. (doi:10.1007/s00285-010-0330-3)
8. Stekel D, Rashbass J, Williams ED. 1995 A computergraphic simulation of squamous epithelium.J. Theor. Biol. 175, 283 – 293. (doi:10.1016/S0022-5193(95)80011-5)
9. Grabe N, Neuber K. 2005 A multicellular systemsbiology model predicts epidermal morphology,kinetics and Ca2þ flow. Bioinformatics 21,3541 – 3547. (doi:10.1093/bioinformatics/bti585)
10. Sutterlin T, Huber S, Dickhaus H, Grabe N. 2009Modeling multi-cellular behavior in epidermaltissue homeostasis via finite state machines inmulti-agent systems. Bioinformatics 25, 2057 –2063. (doi:10.1093/bioinformatics/btp361)
11. Sun T, McMinn P, Coakley S, Holcombe M,Smallwood R, MacNeil S. 2007 An integrated systemsbiology approach to understanding the rules ofkeratinocyte colony formation. J. R. Soc. Interface 4,1077– 1092. (doi:10.1098/rsif.2007.0227)
12. Adra S, Sun T, MacNeil S, Holcombe M, Smallwood R.2010 Development of a three dimensional multiscalecomputational model of the human epidermis. PLoSONE 5, e8511. (doi:10.1371/journal.pone.0008511)
13. Parisi R, Symmons DPM, Griffiths CEM, Ashcroft DM.2013 Global epidemiology of psoriasis: a systematicreview of incidence and prevalence. J. Invest.Dermatol. 133, 377 – 385. (doi:10.1038/jid.2012.339)
14. Di Meglio P, Villanova F, Nestle FO. 2014 Psoriasis.Cold Spring Harb. Perspect. Med. 4, a015354.(doi:10.1101/cshperspect.a015354)
15. Denecker G, Ovaere P, Vandenabeele P, Declercq W.2008 Caspase-14 reveals its secrets. J. Cell Biol. 180,451 – 458. (doi:10.1083/jcb.200709098)
16. De Rosa L, De Luca M. 2012 Cell biology: dormantand restless skin stem cells. Nature 489, 215 – 217.(doi:10.1038/489215a)
17. Clayton E, Doupe DP, Klein AM, Winton DJ, SimonsBD, Jones PH. 2007 A single type of progenitor cellmaintains normal epidermis. Nature 446, 185 – 189.(doi:10.1038/nature05574)
18. Doupe DP, Klein AM, Simons BD, Jones PH. 2010 Theordered architecture of murine ear epidermis ismaintained by progenitor cells with random fate. Dev.Cell 18, 317– 323. (doi:10.1016/j.devcel.2009.12.016)
19. Mascre G, Dekoninck S, Drogat B, Youssef KK,Brohee S, Sotiropoulou PA, Simons BD, Blanpain C.2012 Distinct contribution of stem and progenitorcells to epidermal maintenance. Nature 489,257 – 262. (doi:10.1038/nature11393)
20. Watt FM, Hogan BLM. 2000 Out of eden: stem cellsand their niches. Science 287, 1427 – 1430. (doi:10.1126/science.287.5457.1427)
21. Simons BD, Clevers H. 2011 Strategies forhomeostatic stem cell self-renewal in adult tissues.Cell 145, 851 – 862. (doi:10.1016/j.cell.2011.05.033)
22. Simons BD, Clevers H. 2011 Stem cell self-renewalin intestinal crypt. Exp. Cell Res. 0, 2719 – 2724.(doi:10.1016/j.yexcr.2011.07.010)
23. Tumbar T, Guasch G, Greco V, Blanpain C, Lowry WE,Rendl M, Fuchs E. 2004 Defining the epithelial stemcell niche in skin. Science 303, 359 – 363. (doi:10.1126/science.1092436)
24. Warren PB. 2009 Cells, cancer, and rare events:homeostatic metastability in stochastic nonlineardynamical models of skin cell proliferation. Phys.Rev. E 80, 030903. (doi:10.1103/PhysRevE.80.030903)
25. Klein AM, Doupe DP, Jones PH, Simons BD. 2007Kinetics of cell division in epidermal maintenance.Phys. Rev. E 76, 021910. (doi:10.1103/PhysRevE.76.021910)
26. Roshan A, Jones PH. 2012 Act your age: tuning cellbehavior to tissue requirements in interfollicularepidermis. Semin. Cell Dev. Biol. 23, 884 – 889.(doi:10.1016/j.semcdb.2012.08.013)
27. Alcolea MP, Jones PH. 2013 Tracking cells in theirnative habitat: lineage tracing in epithelialneoplasia. Nat. Rev. Cancer 13, 161 – 171, 2013.
28. Okuyama R, LeFort K, Dotto GP. 2004 A dynamicmodel of keratinocyte stem cell renewal anddifferentiation: role of the p21WAF1 ¼ Cip1 andNotch1 signaling pathways. J. Invest. Dermatol.Symp. Proc. 9, 248 – 252. (doi:10.1111/j.1087-0024.2004.09308.x)
29. Blanpain C, Fuchs E. 2009 Epidermal homeostasis: abalancing act of stem cells in the skin. Nat. Rev.Mol. Cell Biol. 10, 207 – 217. (doi:10.1038/nrm2636)
30. Hsu YC, Li L, Fuchs E. 2014 Transit-amplifying cellsorchestrate stem cell activity and tissueregeneration. Cell 157, 935 – 949. (doi:10.1016/j.cell.2014.02.057)
31. Heenen M, Thiriar S, Noel J-C, Galand P. 1998 Ki-67immunostaining of normal human epidermis:comparison with 3H-thymidine labelling and PCNAimmunostaining. Dermatology 197, 123 – 126.(doi:10.1159/000017982)
32. Heenen M, Galand P. 1997 The growth fractionof normal human epidermis. Dermatology 194,313 – 317. (doi:10.1159/000246122)
33. Morris R, Argyris TS. 1983 Epidermal cell cycle andtransit times during hyperplastic growth induced byabrasion or treatment with 12-otetradecanoylphorbol-13-acetate. Cancer Res. 43, 4935 – 4942.
34. Castelijns FACM, Ezendam J, Latijnhouwers MAHE, VanVlijmen-Willems IMJJ, Zeeuwen PLJM, Gerritsen MJP,Van De Kerkhof PCM, Van Erp PEJ. 1998 Epidermal cellkinetics by combining in situ hybridization andimmunohistochemistry. Histochem. J. 30, 869 – 877.(doi:10.1023/A:1003457709690)
35. Castelijns FA, Gerritsen MJ, van Erp PE, van deKerkhof PC. 2000 Cell-kinetic evidence for increasedrecruitment of cycling epidermal cells in psoriasis:the ratio of histone and Ki-67 antigen expression isconstant. Dermatology 201, 105 – 110. (doi:10.1159/000018471)
36. Laporte M, Galand P, Fokan D, de Graef C, HeenenM. 2000 Apoptosis in established and healingpsoriasis. Dermatology 200, 314 – 316. (doi:10.1159/000018394)
37. Gagna CE et al. 2009 Localization and quantificationof intact, undamaged right-handed double-strandedB-DNA, and denatured single-stranded DNA innormal human epidermis and its effects onapoptosis and terminal differentiation(denucleation). Arch. Dermatol. Res. 301, 659 – 672.(doi:10.1007/s00403-009-0965-3)
38. Purcell EM. 1977 Life at low Reynolds number.Am. J. Phys. 45, 3 – 11. (doi:10.1119/1.10903)
39. Palsson E. 2008 A 3-D model used to explore howcell adhesion and stiffness affect cell sorting andmovement in multicellular systems. J. Theor. Biol.254, 1 – 13. (doi:10.1016/j.jtbi.2008.05.004)
40. Li X et al. 2013 Skin stem cell hypotheses and longterm clone survival-explored using agent-basedmodelling. Sci. Rep. 3, 1904.
41. Schaller G, Meyer-Hermann M. 2007 A modellingapproach towards epidermal homoeostasis control.J. Theor. Biol. 247, 554 – 573. (doi:10.1016/j.jtbi.2007.03.023)
42. Corcuff P, Bertrand C, Leveque JL. 1993Morphometry of human epidermis in vivo by real-time confocal microscopy. Arch. Dermatol. Res. 285,475 – 481. (doi:10.1007/BF00376820)
43. Giangreco A, Goldie SJ, Failla V, Saintigny G, WattFM. 2009 Human skin aging is associated withreduced expression of the stem cell markers b1integrin and MCSP. J. Invest. Dermatol. 130,604 – 608. (doi:10.1038/jid.2009.297)
44. Plewig G, Marples RR. 1970 Regional differences of cellsizes in the human stratum corneum. I. J. Invest.Dermatol. 54, 13 – 18. (doi:10.1111/1523-1747.ep12551482)
45. Plewig G. 1970 Regional differences of cell sizes inthe human stratum corneum. II. Effects of sex andage. J. Invest. Dermatol. 54, 19 – 23. (doi:10.1111/1523-1747.ep12551488)

rsif.royalsocietypublishing.orgJ.R.Soc.Interface
12:20141071
17
46. Kashibuchi N, Hirai Y, O’Goshi K, Tagami H. 2002Three-dimensional analyses of individual corneocyteswith atomic force microscope: morphological changesrelated to age, location and to the pathologic skinconditions. Skin Res. Technol. 8, 203 – 211. (doi:10.1034/j.1600-0846.2002.00348.x)47. Marks R, Nicholls S, King CS. 1981 Studies onisolated corneocytes. Int. J. Cosmet. Sci. 3,251 – 259. (doi:10.1111/j.1467-2494.1981.tb00289.x)
48. Bauer J, Bahmer FA, Worl J, Neuhuber W, Schuler G,Fartasch M. 2001 A strikingly constant ratio existsbetween Langerhans cells and other epidermal cellsin human skin. A stereologic study using the opticaldisector method and the confocal laser scanningmicroscope. J. Invest. Dermatol. 116, 313 – 318.(doi:10.1046/j.1523-1747.2001.01247.x)
49. Hoath SB, Leahy DG. 2003 The organization of humanepidermis: functional epidermal units and phiproportionality. J. Invest. Dermatol. 121, 1440 – 1446.(doi:10.1046/j.1523-1747.2003.12606.x)
50. Bergstresser PR, Pariser RJ, Taylor JR. 1978 Countingand sizing of epidermal cells in normal human skin.J. Invest. Dermatol. 70, 280 – 284. (doi:10.1111/1523-1747.ep12541516)
51. Weinstein GD, van Scott EJ. 1965 Autoradiographicanalysis of turnover times of normal and psoriaticepidermis. J. Invest. Dermatol. 45, 257 – 262.(doi:10.1038/jid.1965.126)
52. Weinstein GD, McCullough JL, Ross PA. 1985 Cellkinetic basis for pathophysiology of psoriasis.J. Invest. Dermatol. 85, 579 – 583. (doi:10.1111/1523-1747.ep12283594)
53. Weatherhead SC, Farr PM, Jamieson D, Hallinan JS,Lloyd JJ, Wipat A, Reynolds NJ. 2011 Keratinocyteapoptosis in epidermal remodeling and clearance ofpsoriasis induced by UV radiation. J. Invest. Dermatol.131, 1916 – 1926. (doi:10.1038/jid.2011.134)
54. Weinstein GD, McCullough JL. 1973 Cytokinetics indiseases of epidermal hyperplasia. Annu. Rev. Med.24, 345 – 352. (doi:10.1146/annurev.me.24.020173.002021)
55. Heenen M, Galand P, Maertelaer V, Heenen P-H. 1987Psoriasis: hyperproliferation cannot induce characteristicepidermal morphology. Cell Prolif. 20, 561 – 570.(doi:10.1111/j.1365-2184.1987.tb01365.x)
56. Simonart T, Heenen M, Lejeune O. 2010 Epidermalkinetic alterations required to generate the psoriaticphenotype: a reappraisal. Cell Prolif. 43, 321 – 325.(doi:10.1111/j.1365-2184.2010.00672.x)
57. Skerrow CJ, Clelland DG, Skerrow D. 1989 Changesto desmosomal antigens and lectin-binding sitesduring differentiation in normal human epidermis: aquantitative ultrastructural study. J. Cell Sci. 92,667 – 677.
58. Dawe RS, Wainwright NJ, Cameron H, Ferguson J. 1998Narrow-band (TL-01) ultraviolet B phototherapy forchronic plaque psoriasis: three times or five timesweekly treatment? Br. J. Dermatol. 138, 833 – 839.(doi:10.1046/j.1365-2133.1998.02221.x)
59. Trehan M, Taylor CR. 2002 Medium-dose 308-nmexcimer laser for the treatment of psoriasis. J. Am.
Acad. Dermatol. 47, 701 – 708. (doi:10.1067/mjd.2002.125075)
60. Hartman M, Prins M, Swinkels OQJ, Severens JL, DeBoo Th, Van Der Wilt GJ, Van De Kerkhof PCM, VanDer Valk PGM. 2002 Cost-effectiveness analysis of apsoriasis care instruction programme with dithranolcompared with UVB phototherapy and inpatientdithranol treatment. Br. J. Dermatol. 147, 538 –544. (doi:10.1046/j.1365-2133.2002.04920.x)
61. Grabe N, Neuber K. 2007 Simulating psoriasis byaltering transit amplifying cells. Bioinformatics 23,1309 – 1312. (doi:10.1093/bioinformatics/btm042)
62. Morris GM, Hopewell JW. 1990 Epidermal cell kineticsof the pig: a review. Cell Prolif. 23, 271 – 282. (doi:10.1111/j.1365-2184.1990.tb01124.x)
63. Bergstresser PR, Taylor JR. 1977 Epidermal ‘turnovertime’: a new examination. Br. J. Dermatol. 96,503 – 506. (doi:10.1111/j.1365-2133.1977.tb07152.x)
64. Iizuka H. 1994 Epidermal turnover time. J. Dermatol. Sci.8, 215 – 217. (doi:10.1016/0923-1811(94)90057-4)
65. Grove GL, Kligman AM. 1983 Age-associated changesin human epidermal cell renewal. J. Gerontol. 38,137 – 142. (doi:10.1093/geronj/38.2.137)
66. Lowes MA, Bowcock AM, Krueger JG. 2007Pathogenesis and therapy of psoriasis. Nature 445,866 – 873. (doi:10.1038/nature05663)
67. Griffiths CEM, Barker JNWN. 2007 Pathogenesis andclinical features of psoriasis. Lancet 370, 263 – 271.(doi:10.1016/S0140-6736(07)61128-3)
68. Ludwig D, Jones DD, Holling CS. 1978 Qualitativeanalysis of insect outbreak systems: the sprucebudworm and forest. J. Anim. Ecol. 47, 315 – 332.(doi:10.2307/3939)
69. Van Scott EJ, Ekel TM. 1963 Kinetics of hyperplasiain psoriasis. Arch. Dermatol. 88, 373 – 381. (doi:10.1001/archderm.1963.01590220005001)
70. Lowes MA, Suarez-Farinas M, Krueger JG. 2014Immunology of psoriasis. Annu. Rev. Immunol.32, 227 – 255. (doi:10.1146/annurev-immunol-032713-120225)
71. Doger FK, Dikicioglu E, Ergin F, Unal E, Sendur N,Uslu M. 2007 Nature of cell kinetics in psoriaticepidermis. J. Cutan. Pathol. 34, 257 – 263. (doi:10.1111/j.1600-0560.2006.00719.x)
72. Menter A, Griffiths CEM. 2007 Current and futuremanagement of psoriasis. Lancet 370, 272 – 284.(doi:10.1016/S0140-6736(07)61129-5)
73. Iizuka H, Takahashi H, Ishida-Yamamoto A. 2004Psoriatic architecture constructed by epidermalremodeling. J. Dermatol. Sci. 35, 93 – 99. (doi:10.1016/j.jdermsci.2004.01.003)
74. Chang JY, Lai PY. 2012 Uncontrolled growthresulting from dedifferentiation in a skin cellproliferation model. Phys. Rev. E 85, 041926.(doi:10.1103/PhysRevE.85.041926)
75. Christley S, Lee B, Dai X, Nie Q. 2010 Integrativemulticellular biological modeling: a case study of3D epidermal development using GPU algorithms.BMC Syst. Biol. 4, 107. (doi:10.1186/1752-0509-4-107)
76. Gord A, Holmes WR, Dai X, Nie Q. 2014Computational modelling of epidermal stratification
highlights the importance of asymmetric celldivision for predictable and robust layer formation.J. R. Soc. Interface 11, 20140631. (doi:10.1098/rsif.2014.0631)
77. Liu Y et al. 2008 A genome-wide association studyof psoriasis and psoriatic arthritis identifies newdisease loci. PLoS Genet. 4, e1000041. (doi:10.1371/journal.pgen.1000041)
78. Nair RP et al. 2009 Genome-wide scan revealsassociation of psoriasis with IL-23 and NF-kB pathways.Nat. Genet. 41, 199 – 204. (doi:10.1038/ng.311)
79. Jordan CT et al. 2012 Rare and common variants inCARD14, encoding an epidermal regulator of NF-kBin psoriasis. Am. J. Hum. Genet. 90, 796 – 808.(doi:10.1016/j.ajhg.2012.03.013)
80. Tsoi LC et al. 2012 Identification of 15 new psoriasissusceptibility loci highlights the role of innateimmunity. Nat. Genet. 44, 1341 – 1348. (doi:10.1038/ng.2467)
81. Roberson E, Bowcock AM. 2010 Psoriasis genetics:breaking the barrier. Trends Genet. 26, 415 – 423.(doi:10.1016/j.tig.2010.06.006)
82. Nestle FO, Kaplan DH, Barker J. 2009 Psoriasis. NewEngl. J. Med. 361, 496 – 509. (doi:10.1056/NEJMra0804595)
83. Fife DJ, Waller JM, Jeffes EW, Koo JY. 2007Unraveling the paradoxes of HIV associatedpsoriasis: a review of T-cell subsets and cytokineprofiles. Dermatol. Online J. 13, 4.
84. Morar N, Willis-Owen SA, Maurer T, Bunker CB. 2010HIV-associated psoriasis: pathogenesis, clinicalfeatures, and management. Lancet Infect. Dis. 10,470 – 478. (doi:10.1016/S1473-3099(10)70101-8)
85. Queiro R, Tejon P, Alonso S, Coto P. 2014 Age atdisease onset: a key factor for understandingpsoriatic disease. Rheumatology 53, 1178 – 1185.(doi:10.1093/rheumatology/ket363)
86. Lee JH, An HT, Chung JH, Kim KH, Eun HC, Cho KH.2002 Acute effects of UVB radiation on theproliferation and differentiation of keratinocytes.Photodermatol. Photoimmunol. Photomed.18, 253 – 261. (doi:10.1034/j.1600-0781.2002.02755.x)
87. Del Bino S, Vioux C, Rossio-Pasquier P, Jomard A,Demarchez M, Asselineau D, Bernerd F. 2004Ultraviolet B induces hyperproliferation andmodification of epidermal differentiation in normalhuman skin grafted on to nude mice.Br. J. Dermatol. 150, 658 – 667. (doi:10.1111/j.0007-0963.2004.05886.x)
88. Wong BST, Hsu BAL, Liao MDW. 2013 Phototherapyin psoriasis: a review of mechanisms of action.J. Cutan. Med. Surg. 17, 6 – 12.
89. Racz E et al. 2011 Effective treatment of psoriasiswith narrow-band UVB phototherapy is linkedto suppression of the IFN and th17 pathways.J. Invest. Dermatol. 131, 1547 – 1558. (doi:10.1038/jid.2011.53)
90. Driessens G, Beck B, Caauwe A, Simons BD,Blanpain C. 2012 Defining the mode of tumourgrowth by clonal analysis. Nature 488, 527 – 530.(doi:10.1038/nature11344)


![Psoriasis in Children and Adolescents: Diagnosis ......Guttate psoriasis is the second most common type of psoriasis in children [21, 29]. Griffiths and Barker defined guttate psoriasis](https://img.pdfslide.us/doc/110x75/5f501dea60f5a266c60b268c/psoriasis-in-children-and-adolescents-diagnosis-guttate-psoriasis-is-the.jpg)