Embed Size (px)
Citation preview

N E T W O R K E C O N O M I C S C O N S U L T I N G G R O U P P T Y L T D A B N 7 2 0 0 6 8 1 9 9 6 9
CONFERENCE PAPER
Modelling Airline Competition
Olivier RENARD
PRESENTED AT THE ANU/NECG CONFERENCE ONTHE PERFORMANCE OF AIR TRANSPORT MARKETS
24 & 25 JUNE 2004

N E T W O R K E C O N O M I C S C O N S U L T I N G G R O U P
CONFERENCE PAPER
© Network Economics Consulting Group Pty Ltd 2004
This work is copyright. The Copyright Act 1968 permits fair dealing for study, research, news reporting, criticism or review. Selected passages, tables or charts may be reproduced for such purposes provided acknowledgment of the source is included. Permission must be obtained from Jane Thorn on (02) 9965 4100. Please cite report number 0777.0237.
For information on this report, please contact:
Olivier Renard Phone (03) 9655 1600 Email [email protected]
Network Economics Consulting Group offices
CANBERRA
Level 1, 29 Jardine Street Kingston ACT 2604 Australia
Phone (+61 2) 6232 6522 Fax (+61 2) 6232 6188
SYDNEY
Level 7, 90 Mount Street North Sydney NSW 2060 Australia
Phone (+61 2) 9965 4100 Fax (+61 2) 9954 4284
MELBOURNE
Level 50, 120 Collins Street Melbourne VIC 3000 Australia
Phone (+61 3) 9655 1600 Fax (+61 3) 9655 1616
INTERNET
www.necg.com.au
Network Economics Consulting Group Pty Ltd is incorporated in Victoria ABN 72 006 819 969 ACN 007 083 570
MODELLING AIRLINE COMPETITION Page 2 of 21

N E T W O R K E C O N O M I C S C O N S U L T I N G G R O U P
CONFERENCE PAPER
Contents
1 Introduction 4
2 The economics of hub-and-spokes 5 2.1.1 Benefits of hub-and-spoke 6 2.1.2 Competitive advantages of Asian airlines versus British Airways
and Qantas 10 2.1.3 Conclusion 12
3 The economics of interlining pricing 13 3.1.1 Analysis 13 3.1.2 Test and conclusion 17
4 Concluding remarks 18
A Appendix 1: Queuing 19
Boxes, charts and tables Chart 1 Point-to-point vs. hub-and-spoke 6 Chart 2 Network structure; Example 1 8 Chart 3: Network Structure; Example 2 14 Table 1 Implications of hub-and-spoke networks 9 Table 2 Percentiles 21
MODELLING AIRLINE COMPETITION Page 3 of 21

N E T W O R K E C O N O M I C S C O N S U L T I N G G R O U P
CONFERENCE PAPER
1 Introduction
Joseph Schumpeter described economics as ‘a recognized field of tooled knowledge’. In his view, economic theory is ‘a box of tools’, made up of concepts, causalities and the methods of arranging them, which enables the construction of simple models. These are mere instruments or tools framed for the purpose of establishing interesting results. 1
The objective of this paper is to discuss some of the impacts that coordination between airlines may have on competition. We argue that cooperation, even when it involves price cooperation, may have some pro-competitive effects
In deregulated airline markets, carriers are free to choose the values of (most of) the variables affecting their profits. Of all the variables of choice, the decisions on flight frequencies and prices are typically the focus of most attention. Frequency determines consumer welfare by affecting not only the gap between the most preferred and actual departure times, but also the transfer time of connecting passengers. Also, since in particular business travellers typically value frequency, the frequency decision affects their willingness to pay and the number of passengers. On the other hand, frequency – given aircraft size, a parameter that also has to be chosen – is a major determinant of airlines’ costs, and thus, in turn, influences prices.
A further characteristic of the airline industry is that the number of competitors in each market is relatively small (i.e. there are oligopolistic markets). Pricing in an oligopoly is influenced both by the limited number of competitors and their interdependence:
Because their numbers are small, sellers in an oligopoly perceive that their interdependent action will be more profitable than independent action. Interdependence suggests that each seller takes into account the actual or potential market reactions of competitors before output or price decisions are made.2
In other words, airlines have to design strategies that involve many dimensions, and they have to do that while incorporating in their strategies the responses of their rivals (both actual and potential). Modelling airline competition is an attempt to describe these strategic interactions and to explain how airlines make their choices.
Modelling airline competition has a wide range of purposes. For example, concerns with mergers, alliances and joint ventures have led to significant modelling work to assess the welfare impact of such proposals. Similarly, models of fare wars have been used in the assessment of predatory pricing claims in the airline industry. While antitrust policy has been a heavy user of competition models, other public policy areas, such as safety,
1 Schumpeter J A, 1954, History of Economic Analysis, Oxford University Press, New York. 2 Sullivan E T and Harrison J L, 2003, Understanding Antitrust and its Economic Implications,
Legal Text Series, New York.
MODELLING AIRLINE COMPETITION Page 4 of 21

N E T W O R K E C O N O M I C S C O N S U L T I N G G R O U P
CONFERENCE PAPER
environmental, and public health, have also drawn on the analysis of airlines’ behaviour. In the face of this multitude of applications, the choice of a specific competition model is guided not only by the specific market conditions but also by the question to be addressed, as is typically the case in all modelling exercises. That is, the analytical steps that consist of summarising a complex reality into a manageable model involve the preliminary question of what is to be understood.
It is beyond the scope of this paper to cover all the models of competition or to review every issue that they attempt to address. Rather, we intend to discuss some issues relating to:
• the economics of hub-and-spoke networks (section 2); and
• international alliances and interlining pricing (section 3);
The analysis of both topics relies on the use of competition models and our objective is to establish the following conclusion:
cooperation between airlines, even when it extends to pricing decisions, can have pro-competitive effects.
We believe that this result is ‘interesting’ since cooperation between firms, which would otherwise compete, would normally seem undesirable. Such coordination would normally be presumed to create or enhance market power, either by creation of a dominant firm or by enabling multiple firms to engage in tacit or overt collusion. To have market power, a firm must be in a position where its consumers cannot turn to close substitutes.3 The ease with which consumers can turn to substitutes is indicated by how readily they reduce their purchases from the firm when it increases its price. If two or more airlines coordinate their prices and outputs so that these are no longer substitutes for the purpose of market power analysis, it may follow that parties to the alliance (and eventually other competitors) may have the incentive and the ability to increase their prices significantly and persistently above the levels that would otherwise prevail4.
2 The economics of hub-and-spokes
In this section, we analyse the main costs and benefits of hub systems for both passengers and airlines, in order to characterise the competition between airlines operating hub-and-spoke networks.
3 Two products are substitutes if the demand for one increases when the price of the other
decreases. 4 In Australia, price-fixing is a per se offence, but may be authorised if it delivers net benefits.
MODELLING AIRLINE COMPETITION Page 5 of 21

N E T W O R K E C O N O M I C S C O N S U L T I N G G R O U P
CONFERENCE PAPER
Following the deregulation of the US airline industry and the freedom offered to airlines to choose their route structures and prices, American Airlines was the first to pursue a strategy of “hubbing”. Since that time, hub-and-spoke network structures have been adopted by many airlines throughout the world. In a hub and spoke system, flights are concentrated to, and from, a limited number of airports that are used as collection and distribution centres for passengers. These airports are called hubs. The routes that channel passengers to the hubs are referred to as spokes. Unless they travel between two hubs, passengers travel to their final destination via a hub.
This cost-benefit analysis is then applied (and adapted) to the so-called Kangaroo Route (i.e. the routes between Australia and Europe).
2.1.1 Benefits of hub-and-spoke
Airlines
Hub-and-spoke systems allow higher traffic densities than would not be possible in a system of direct flights. This is because channelling passengers through a hub airport concentrates passengers onto a limited number of routes, and hence generates higher densities – the alternative would be to spread passengers over the larger number of aircraft that may be required in a system of direct flights. As an the marginal cost to an airline of a passenger on a flight with unallocated seats is very small, any arrangement that increases traffic density reduces average cost per passenger-trip.
The effect of hub-and-spoke systems on operation costs can easily be illustrated. Suppose an airline provides air transport services between a set of n cities. Under a point-to-point system, the airline could provide these services with direct connecting flights between each pair of cities, serving n(n-1)/2 routes. The same n cities, however, can be served with just n-1 routes, reducing the total number of routes served and increasing the average traffic on each route by a factor of n/2. The following diagram applies this result to a six-city network.
Chart 1 Point-to-point vs. hub-and-spoke
MODELLING AIRLINE COMPETITION Page 6 of 21

N E T W O R K E C O N O M I C S C O N S U L T I N G G R O U P
CONFERENCE PAPER
MODELLING AIRLINE COMPETITION Page 7 of 21
Reducing the number of routes (and hence saving the fixed costs of linking two cities) and increasing traffic on the remaining routes (and hence benefiting form the economies of density) are two of the main advantages for airlines of implementing a hub-and-spoke strategy.
The economic literature provides extensive support for the importance of traffic density in determining airline cost efficiency. For example, in a study of airline comparative productivity Windle5 found that the largest driver of differences in productivity was traffic density. McShan and Windle6 go further and estimate the importance of hub-and-spoke networks for cost savings. In their study of the impact of deregulation of the US airline industry, they found that between 1977 and 1984 hub-and-spoke routing grew by 48%. They estimate that for every 1% increase in hubbing there was a 0.1% fall in airline costs.
Still another cost advantage associated with hubs is the scale effect in aircraft usage, their maintenance and turnaround. For an airline, a hub is an optimal location to establish its main maintenance operations. First, the density at a hub is higher and hence the fixed cost associated with maintenance operations are spread over a larger number of aircraft. For example, equipment and buildings, specialised engineers and technicians and stocks of spare parts are more efficiently managed if the maintenance facilities are located at one airport rather than being duplicated at each city. Second, the location of maintenance infrastructure is optimally situated in a hub rather than at the end of a spoke. This is because an aircraft is more likely to go through a hub rather than stoping at a specific end-of–line destination – and to save the costs of moving the aircraft to the maintenance site.7
Passengers
From a traveller’s perspective, the main benefits of hub-and-spoke network are, first, that smaller cities are connected to the network and, second, higher flight frequencies (greater choice of flight time to most cities)8. These demand effects correspond to the cost savings achieved by airlines through hubbing. This is because given the joint effects of minimum
5 Windle R J, 1991, “A Cost and Productivity Comparison of the World’s Airlines” Journal of
Transport Economics and Policy, 25-1:31-49. 6 McShan S and Windle R J, 1989, “The Implications of Hub-and-Spoke Routing for Airline
Costs and Competitiveness”, Logistics and Transportation Review, 25-3:209-230. 7 This point is even stronger when an airline has a unique hub. 8 The line of reasoning for higher frequencies is the same: instead of connecting an additional
city, the question is about connecting a city-pair at an additional time of the day or day of the week.

N E T W O R K E C O N O M I C S C O N S U L T I N G G R O U P
CONFERENCE PAPER
A
B
CA
B
Cefficient scale and higher densities, the concentration of passengers makes possible the service of thin markets. To see this, consider the following example.
Chart 2 Network structure; Example 1
Assume that the minimum efficient for a city-pair is 70 passengers per week. Assume that the weekly demands from city A to B and from A to C are 50 passengers respectively. Under such assumptions, neither direct flight out of A is economically profitable and hence A would not be connected. On the other hand, channelling all the passengers originating from A to, say, B – a hub – makes the connection of A to the network9. possible (i.e. profitable). Further, the addition of a new spoke to a hub-and-spoke network significantly increases the city-pair combinations served by the network, at a minimal additional cost. For example, connecting an additional city in the previous 6-city example necessitates 6 routes in a point-to-point system while one spoke only is sufficient in a hub-and-spoke network. Therefore, travellers from, and to, smaller communities directly benefit from these higher densities since otherwise they would not be served.
Before analysing its costs, we note that the benefits of the hub system for passengers and for airlines may have positive two-way feedback effects. Indeed, when economies of density are passed on to customers in the forms of lower fares and higher frequencies, resulting in a higher demand for air travel, it fuels further economies of density10.
Relative cost of hub-and-spoke
While the hub-and-spoke system offers some benefits to both passengers and airlines, in most circumstances, some additional costs and/or lower passenger welfare may, at least
9 The underlying assumption is that B and C are cities large enough to generate a sufficient
demand. City A is the smaller community. 10 A comprehensive study of domestic airline competition by the US Department of Transportation
found that the development of multiple competing hub-and-spoke networks had produced positive service and pricing benefits for most air travellers. See U.S. Department of Transportation, 1990, Report of the Secretary's Task Force on Competition in the U.S. Domestic Airline Industry, February 1990. The analysis refers to the 1976-1990 (that is, before the entry of Value-Based Airlines).
MODELLING AIRLINE COMPETITION Page 8 of 21

N E T W O R K E C O N O M I C S C O N S U L T I N G G R O U P
CONFERENCE PAPER
partially, diminish the net social benefit derived from air travel through hubs. We present these shortcomings in what follows.11
First, while travellers may benefit from higher frequencies and a larger number of destinations, their actual travel time is usually longer through a hub compared to a direct flight. Since most travellers have a preference for non-stop shorter flights, a hub-and-spoke network imposes a time cost to travellers going though a hub. Travel time is also longer via a hub rather than a direct flight as the chance of being delayed is higher. This is not only because the number of legs is higher but also because of a “domino effect”– a delay in the first leg may cause passengers to miss their connection, creating further delays.
Second, even if airlines achieve substantial cost-saving thanks to a hub-and-spoke network, they usually incur some additional costs over the alternative point-to-point system. Indeed, the hub-and-spoke system typically results in a concentration of flights in peak hours in congested airports. While, as explained above, the concentration of aircraft provides some beneficial scale effects in the aircraft usage and turnaround in the hub airport, there may be some extra-costs associated, for example the congestion of slots, ground crews and, handling equipment. Further, going from one city to another through a hub adds, by definition, one take-off and one landing compared to the alternative direct flight. Given that the costs of a take-off and a landing represent a substantial share of the total cost of flight, the cost of a direct flight is then lower than the cost of a two-leg flight12.
Summary
The following table provides a summary of the implications for airlines and passengers of hub-and-spoke network.
Table 1 Implications of hub-and-spoke networks
Benefits Costs
Pooling passengers at the hub increases density and load factors
Concentration of flights in peak hours in congested airports (slot, ground crew, handling equipment)
Scale effect in the aircraft maintenance and turnaround in the hub airport
Additional take-off and landings For airlines
Higher frequencies results in higher demand
11 The low-cost point-to-point service developed by Southwest Airlines may illustrate the relative
costs associated with hub-and-spoke operations. 12 The total distance and block-hours are also higher for a two-leg flight than for a direct flight.
MODELLING AIRLINE COMPETITION Page 9 of 21

N E T W O R K E C O N O M I C S C O N S U L T I N G G R O U P
CONFERENCE PAPER
Higher frequencies, greater choice of flight time to most cities
Fewer non-stop flights, and hence longer travel time
For Passengers Even smaller cities are connected to the network
Higher chance of being delayed (domino effect)
2.1.2 Competitive advantages of Asian airlines versus British Airways and Qantas
In this subsection, we analyse the Kangaroo route (i.e. the routes between Australia and Europe) as it relates to the economics of hub-and-spoke. To do so, we assume a situation where British Airways and Qantas do not have a Joint Services Agreement (by which they coordinate their operations and code-share)13.
First, consider the routes between Europe and Australia individually. For simplicity, let us focus on the route between Sydney and London via Singapore, for which Qantas, BA and Singapore Airlines compete. This view is admittedly incomplete as it ignores flights from, and to, Melbourne, Perth, Brisbane, and Frankfurt. It also ignores alternative routes (for example, through Bangkok, Hong Kong or Kuala Lumpur) and other carriers. Nonetheless, it is sufficient to establish our argument.
The distance between Europe and Australia is such that all flights must stop for technical reasons – to re-fuel, to change crew and to service the aircraft. This stop affects the competition between carriers and the economics of hubs described above.
Consider first, the position of Singapore Airlines. A London-Singapore-Sydney flight is, for Singapore Airlines, a spoke-to-hub-to-spoke. In other words, this is to be analysed as a route serviced by a hub-and-spoke network. Now, consider the same flight for British Airways. Since London is the British Airways hub, the flight London-Sydney would be appropriately described as a hub-to-spoke. Ignoring for the moment the necessary stop in Singapore, this is a point-to-point route (i.e. not through British Airways’ hub14). Therefore, the competition between Singapore Airlines and British Airways would be presumably based on the trade-off between the pros and the cons of a hub-and-spoke network.
The non-stop assumption is, however, nonsensical. The consequence of this stop is that the comparative disadvantages faced by Singapore Airlines – the ‘cons’ – do not exist. Indeed,
13 Under the Joint Services Agreement (JSA), the parties are able to coordinate schedules on the
Kangaroo route, and jointly set related prices and manage yields. One of the arguments put forward in favour of the JSA is that, as we shall explain, Qantas and Australia would suffer from a large competitive disadvantage compared to the Asian carriers. This counterfactual is therefore relevant to analyse the welfare impact of the JSA.
14 Recall that under our counterfactual, there is no JSA and hence British Airways operates independently.
MODELLING AIRLINE COMPETITION Page 10 of 21

N E T W O R K E C O N O M I C S C O N S U L T I N G G R O U P
CONFERENCE PAPER
British Airways incurs the same costs from the stopover (additional take-off and landing), in the same congested airport and does not offer a shorter travel time. A similar analysis leads to the same conclusion when applied to Singapore Airlines competing with Qantas and its hub in Sydney15. On the London-Singapore city-pair analysed separately, Singapore Airlines does not face the costs of hubbing, relative to either Qantas or British Airways.
The second step is to include in our analysis the markets from, and to, other European and Australian cities mentioned earlier16 and South-East Asian cities. When these flights are included, South-East Asian carriers have a competitive advantage that relates to the pros of a hub-and-spoke network.
Consider once again the competition between Qantas and Singapore Airlines. On the leg from Singapore to London, Singapore Airlines can rely on the feed from travellers arriving from Sydney, Melbourne, Perth, Brisbane and from travellers arriving from South-East Asia – for example, Malaysia, Thailand and Indonesia. On the same city-pair (from Singapore to London), Qantas transports passengers originating from Sydney, Melbourne, Perth and Brisbane but would not benefit from significant feed from South Asia. This is because, comparing the two-stop alternatives through Singapore from, say, Kuala Lumpur to London, a traveller is, other things being equal, more likely to choose the seamless travel offered by Singapore Airlines rather than the interlining option Singapore airlines and then Qantas. In other words, Singapore Airlines enjoys the advantages of having a hub in Singapore, and Qantas would not.
Similarly, consider the Singapore-Sydney city-pair. Both Singapore Airlines and British Airways can feed their aircraft with travellers from London, Paris, Frankfurt and Rome but Singapore Airlines benefits from Asia-originating travellers more than British Airways could, for the same reason of preference for seamless trip.
The same competitive advantage of Singapore Airlines relative to British Airways applies to the routes Singapore-Melbourne, Singapore-Perth and Singapore-Brisbane. Finally, Singapore Airlines would also benefit from a competitive advantage over Qantas on Singapore-Frankfurt.
These competitive advantages can be further illustrated by the difficulty for British Airways and Qantas to replace the travellers who end their journey in Asia. For example,
15 The same analysis would also apply to the competition between British, Qantas and other Asian
carriers like Thai Airways, Cathay, Garuda and their respective Asian hubs. 16 We shall stress two points. First, the inclusion of these flights does not invalidate the previous
arguments for which the focus was on the London-Sydney route analysed separately. Second, if the markets like Perth-Paris or Rome-Brisbane were analysed individually the same line of reasoning would apply.
MODELLING AIRLINE COMPETITION Page 11 of 21

N E T W O R K E C O N O M I C S C O N S U L T I N G G R O U P
CONFERENCE PAPER
British Airways would find it more difficult than Singapore Airlines to fill a seat emptied by a traveller from London to Singapore with a traveller from Singapore to Sydney. This is because British Airways would not have the same hub presence in Singapore as Singapore Airlines.17
2.1.3 Conclusion
Based on this analysis, if British Airways and Qantas had to compete independently against, say, Singapore Airlines, the geographical position of the latter coupled with the distance between Europe and Australia would be such that:
• Singapore Airlines would benefit from the pros of a hub network, in particular, the passenger feed from South East Asian countries;
• neither Qantas nor British Airways would enjoy these benefits;
• Singapore Airlines would not suffer from the costs associated with hubbing relative to British Airways and Qantas, which must have a stop-over in South East Asia.
The JSA, through the cooperation of carriers who have hubs at each end of the Kangaroo Route - Qantas and British Airways - counterbalances, at least partially, the competitive disadvantage the hub effect otherwise creates on the Kangaroo Route. By combining their demands through coordination of schedules and prices, the JSA:
• allows the carriers to more efficiently secure traffic at the terminal ends (as each carrier can benefit from the complementary network reach and home country benefits of the other carrier);
• permits the carriers to aggregate each other’s traffic to terminating points at each end, and hence to offer service to a greater range of destinations at the terminating ends; and as a result,
• creates scope for the intermediate point to act as a hub, albeit a small one compared to those operated by the Asian and Middle Eastern carriers, in which passengers are transferred from the flight servicing their originating point to the flight servicing their terminating point.
In other words, the JSA makes Qantas and British Airways more effective competitors to the Asian and Middle Eastern airlines than they would otherwise be; this, in turn, may ensure stronger competition than could otherwise prevail.18
17 If British Airways does replace the leaving travellers, it is likely to be with passengers who have
had a stopover in South East Asia; typically, tourists travelling economy class. 18 The overall effect of the JSA should rely on a more complete competition analysis. For such an
analysis, see NECG, 2003, “A report by NECG on economic issues relating to the pending application for reauthorisation of the Joint Services Agreement between Qantas and British
MODELLING AIRLINE COMPETITION Page 12 of 21

N E T W O R K E C O N O M I C S C O N S U L T I N G G R O U P
CONFERENCE PAPER
3 The economics of interlining pricing
In the second section, we analyse the impact of the cooperation among international carriers on the pricing of interline trips19. Cooperation between airlines differs markedly. For example, they can cooperate on arrangements such as coordination of frequent flyer programs, flight scheduling, baggage handling, catering, ground services, airport lounges, maintenance and in some cases, joint selling of seats and fare determination. Many alliances allow for code sharing whereby an airline is able to sell seats on its partner’s airline rather than serve those destinations directly. This would not normally give carrier’s access to each other’s yield management system. Sometimes, alliances include equity holding arrangements that may further strengthen the partnership between the airlines.
Cooperation between international carriers provides international passengers with the benefits of “seamless” travel20. For example, schedule coordination by the alliance partners and gate proximity at hub airports, eases passenger connections between the carriers, as well as minimising the potential for the domino effects, described above in the analysis of hub-and-spoke networks. Alliances also enable traveller to obtain boarding cards for connecting flights with any member airline, have luggage checked through, and take advantage of services that the other airlines may provide, such as lounges. In many cases, a merger of the partners’ frequent flyer programs adds to the travellers’ benefits since points (or miles) earned on travel on foreign airlines can be redeemed for award trips on the domestic carrier 21.
However, cooperation may also extend to pricing decisions; that is, allied airlines can collaborate in the determination of fares. In other words, it may involve a strategy of price-fixing between the alliance partners, which therefore no longer compete.
3.1.1 Analysis
Economic theory predicts that cooperative pricing may reduce the fare for an interline trip. In other words, when carriers can collaborate in setting interline fares, the result nay be a lower dollar amount than would emerge from a non-cooperative process.
Airways”, available at www.necg.com.au/pappub/NECG_qantas_ airways_british_airways_report_2003.pdf
19 In an interline trip, the passenger must travel on, at least, two carriers, for example, to go from Canberra to Bordeaux.
20 While these benefits may be substantial, they are typically hard to quantify; that is, it is indeed difficult to put a dollar values on the benefit from less ‘inconvenient’ travel.
21 For Australian resident, Qantas Frequent Flyer would earn some points on a American Airlines flight from Los Angeles to Miami and could redeem them for a Qantas trip. Without the merger of frequent flyers programs, the points would be lost if the US trip were a one-off.
MODELLING AIRLINE COMPETITION Page 13 of 21

N E T W O R K E C O N O M I C S C O N S U L T I N G G R O U P
CONFERENCE PAPER
The analysis of horizontal relationships provides the traditional framework to assess the impact of price coordination. For example, an international alliance, when it is authorised to price coordinate, may be viewed as a form of horizontal merger, that is involving two or more firms that deliver substitute products.22 In this case, the general framework involves analysing market power resulting from the alliance (eg: market share, entry barriers, intensity of competition and performance), and possibly a trade-off between anticompetitive effects and efficiency gains. This analysis would be relevant to the analysis of the price coordination between firms providing substitutes, for example, if American Airlines and Qantas jointly optimise their pricing decision on the Sydney-Los Angeles city pair, instead of competing.
That said, the economics of interline pricing, also involves some elements of vertical relation, in that the carriers providing the interline trip are selling complements23. As we shall explain, this ‘complementarity’ means that price coordination can solve the so-called double-marginalisation issue, and reduce, rather than, increase prices.
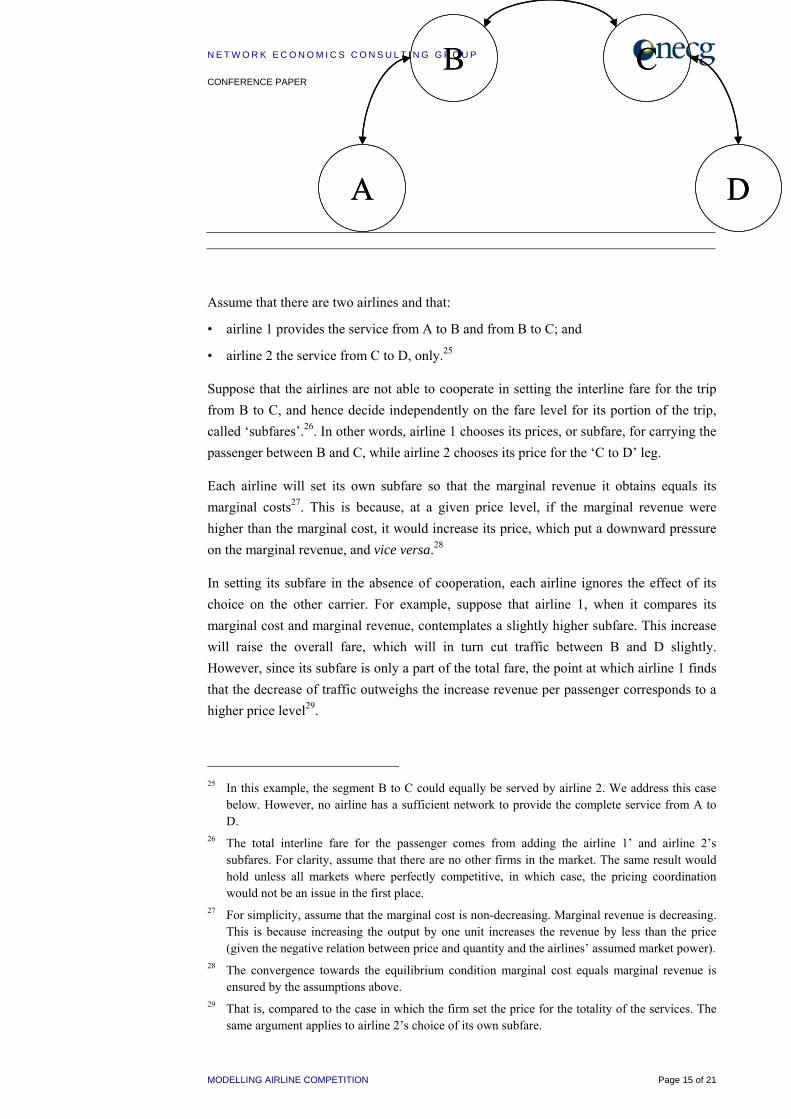
As explained earlier interline trips involve, by definition, at least two carriers. In turn, this means that for at least one segment of the trip, the airlines’ networks are not overlapping. In this case, the airlines are providing complements – i.e. if the fare of one segment increases, the demand for the other segment segments decreases. This complementarity is the main driver of the specific dimension of fare determination for interline trips, as modelled by Brueckner24. Consider the example, illustrated in the following diagram.
Chart 3: Network Structure; Example 2
22 See footnote 3. 23 Two products are complements if the demand for one decreases when the price of the other
decreases. 24 Brueckner J K, 2001, “The economics of international codesharing: An analysis of airline
alliances”, International Journal of Industrial Organization, 19-10:1478–98.
MODELLING AIRLINE COMPETITION Page 14 of 21
N E T W O R K E C O N O M I C S C O N S U L T I N G G R O U P
CONFERENCE PAPER
MODELLING AIRLINE COMPETITION Page 15 of 21
A D
B C
A D
B C
Assume that there are two airlines and that:
• airline 1 provides the service from A to B and from B to C; and
• airline 2 the service from C to D, only.25
Suppose that the airlines are not able to cooperate in setting the interline fare for the trip from B to C, and hence decide independently on the fare level for its portion of the trip, called ‘subfares’.26. In other words, airline 1 chooses its prices, or subfare, for carrying the passenger between B and C, while airline 2 chooses its price for the ‘C to D’ leg.
Each airline will set its own subfare so that the marginal revenue it obtains equals its marginal costs27. This is because, at a given price level, if the marginal revenue were higher than the marginal cost, it would increase its price, which put a downward pressure on the marginal revenue, and vice versa.28
In setting its subfare in the absence of cooperation, each airline ignores the effect of its choice on the other carrier. For example, suppose that airline 1, when it compares its marginal cost and marginal revenue, contemplates a slightly higher subfare. This increase will raise the overall fare, which will in turn cut traffic between B and D slightly. However, since its subfare is only a part of the total fare, the point at which airline 1 finds that the decrease of traffic outweighs the increase revenue per passenger corresponds to a higher price level29.
25 In this example, the segment B to C could equally be served by airline 2. We address this case
below. However, no airline has a sufficient network to provide the complete service from A to D.
26 The total interline fare for the passenger comes from adding the airline 1’ and airline 2’s subfares. For clarity, assume that there are no other firms in the market. The same result would hold unless all markets where perfectly competitive, in which case, the pricing coordination would not be an issue in the first place.
27 For simplicity, assume that the marginal cost is non-decreasing. Marginal revenue is decreasing. This is because increasing the output by one unit increases the revenue by less than the price (given the negative relation between price and quantity and the airlines’ assumed market power).
28 The convergence towards the equilibrium condition marginal cost equals marginal revenue is ensured by the assumptions above.
29 That is, compared to the case in which the firm set the price for the totality of the services. The same argument applies to airline 2’s choice of its own subfare.

N E T W O R K E C O N O M I C S C O N S U L T I N G G R O U P
CONFERENCE PAPER
In contrast, suppose that airline 1 and airline 2 can cooperate in setting the overall fare for the B-C trip. Cooperation means that airline 1 and airline 2 set the fare so as to maximize their combined profit from the route. In other words, airline 1 takes into account that an increase in its own subfare hurts airline 2, and vice versa. As a result, each airline lowers its subfare, relative to the non-cooperative case and hence the overall interline fare falls as a result of the price coordination. It should be noted that this fare reduction is beneficial not only to passengers, but also to the carriers, whose total profit rises as a result of cooperation30.
Overall, the delivery of complementary products, such as the different segments of an interlining trip may involve the sharing of common inputs, promotional needs, or distribution channels. Therefore the production of complements may be associated with important economies of scope when brought under common control. Now, in addition to these efficiency effects, there is perhaps a less obvious reason why a merger that combines complements under common control could lead to lower prices. Such pricing cooperation could internalise the effects of lowering the price of one complement on sales and profits earned on another31.
Now, the analysis so far has relied on the assumption that airline 2 was not providing the B-C service, which may not be realistic if these airports are the international gateway airports, for example Sydney and Los Angeles. The significance of the assumption is most obvious for alliance passengers, who make non-stop trips between international gateway airports. For them, the price coordination between the international airlines may cause a fare increase on B-C (i.e. the alliance may be anticompetitive, as explained above in our discussion of horizontal relationships).
While this may indeed be the case in theory, the final analysis should rely on three steps explained above:
• competition analysis; that is, the analysis of the market characteristics (market definition and market power) to assess whether the parties of the alliance have the incentive and the ability to restrict output (increase price);
• analysis of the efficiency gains achieved by the coordination of their activities; and of the extent to which these efficiency gains are passed through on to travellers in the form of lower prices and/or higher quality of service; and
• the trade-off between the elimination of the double marginalisation and the possible increase in market power on overlapping services in gateway city-pair markets.
30 This is because by definition, when they cooperate to maximise the total profit. This result is
what economists refer to as “double marginalisation”. 31 This is the so-called ‘Cournot effect’
MODELLING AIRLINE COMPETITION Page 16 of 21

N E T W O R K E C O N O M I C S C O N S U L T I N G G R O U P
CONFERENCE PAPER
This last point – the trade-off – arises because two types of passengers are travelling on the overlapping services: (1) those for which the price coordination, in terms of market power, only reduces the availability of substitutes; and (2) those for which the coordination involves the internalisation of pricing decision for complements.
3.1.2 Test and conclusion
The analysis of the economics of interlining pricing has shown that price coordination does not necessarily result in enhanced market power or price increases. That said, this might remain, at least, in principle, a possible outcome. To investigate the actual impact of international alliance, some empirical tests have been devised.
Brueckner32 provides some empirical evidence on the effect of airline cooperation on the level of interline fares paid by international passengers. His analysis focuses on two measures of cooperation:
• code-sharing; and
• antitrust immunity (that is, the ability to price coordinate).
The results show that the partial effects of code-sharing and immunity are both negative.
• The presence of code-sharing on an international interline itinerary reduces the fare by at least 8 percent and up to 17 percent33.
• Moreover, the presence of antitrust immunity reduces the fare by 13-21 percent. Brueckner finds that code-sharing and immunity to price coordinate are substitutes34 and their combined effect ranges between 17 and 30 percent.
In another paper, Brueckner and Whalen35 analyse the same topic (using a different data set) but also provide some results on the possible anticompetitive effect in gateway-to-gateway markets (that is, where the allied airlines deliver substitute services). They find that alliance partners charge interline fares that are approximately 25 per cent those charged by non-allied carriers. They attribute the main source of this fare reduction to the elimination of the double marginalisation that arises from uncoordinated choice of interline subfares. In gateway-to-gateway markets, they estimate that an alliance between two carriers, which would otherwise compete, raise fares by about 5 per cent. However,
32 Brueckner J K, 2000, International Airfares in the Age of Alliances: The Effects of Codesharing
and Antitrust Immunity, IGPA Working Paper, available at
http://www.igpa.uillinois.edu/publications/workingPapers/WP83-immunity.pdf 33 The estimated price decrease depends on the data sample used and the estimation method. 34 Their combined effect is smaller than the sum of their partial effects 35 J. Brueckner, W. Whalen, 2000, “The Price Effects of International Airline Alliances”, Journal
of Law and Economics, 43-503:545.
MODELLING AIRLINE COMPETITION Page 17 of 21

N E T W O R K E C O N O M I C S C O N S U L T I N G G R O U P
CONFERENCE PAPER
this point estimate is found to be statistically insignificant. This means that hypothesis of absence of anti-competitive effect cannot be rejected.
4 Concluding remarks
Competition means economic rivalry. It connotes a situation where the conduct of each rival affects and constrains the behaviour of others. In that sense, effective rivalry involves an absence of power, i.e. of the ability to impose one’s will or more generally, act in a manner that is relatively unconstrained. The power that is relevant to economic rivalry is market power. By this is meant the ability to act in a manner that is free, or relatively free, of the constraint that would otherwise come from rivals. Market power is therefore the antithesis of competition – i.e. of a situation in which no rival can impose its will and hence escape market constraints.
When firms coordinate their activities, especially when this involves price-coordination or price-fixing, airlines seem to escape, at least to some degree, market constraints and hence acquire unilateral or coordinated market power. While this basic principle has some support in economic theory, an analysis of the economics of airline competition illustrate the possible dangers associated with an unqualified approach such as that ‘airline cooperation is anticompetitive’.
In this paper, we analysed two reasons why airline cooperation may have some potentially beneficial impacts:
• First, the economics of hub-and-spoke network, applied to the so-called Kangaroo Route, reveals that Qantas and British Airways would suffer from severe competitive disadvantage without the present JSA. An cooperative agreement makes them more effective competitors to the Asian and Middle Eastern airlines than they would otherwise be; which, in turn, may ensure stronger competition than could otherwise prevail;
• Second, coordination of international carriers jointly delivering interline services can, and according to the empirical evidence presented above effectively does, reduce the total fare they charge for these trips. The idea beyond this theoretical and empirical result is that price coordination involves complements, as against substitutes, and hence does not necessarily reduce competition.
MODELLING AIRLINE COMPETITION Page 18 of 21

N E T W O R K E C O N O M I C S C O N S U L T I N G G R O U P
CONFERENCE PAPER
A Appendix 1: Queuing
An important benefit of an agreement between two air carriers is the opportunity to achieve better results in their yield management when they integrate their strategies compared to independent planning decisions. In other words, scale matters for yield management. The reason for this scale effect lies in the non-linearity of optimisation programs to maximise value from air travel. Two independent air carriers cannot achieve the same yield as the same carriers gathering their fleet under common management. A whole is not identical to the sum of its parts.36
An important channel through which scale matters is the ability of air carriers to extract value from travellers – typically business travellers – who have a high willingness-to-pay and tend to book their flights not long before their travel. Let’s call them late-passengers37.
Although a strategy involving “extracting value from those passengers” seems to benefit only the airline, it is often these passengers that make the whole flight profitable and hence achieving this strategy may enable other passengers to obtain cheaper fares. This pricing strategy, according to the consumer’s willingness to pay, is generally welfare-enhancing. In addition to this price effect, there is also a quantity effect. As we shall explain, securing these late-passengers involves some idle capacity. Better yield management, by reducing idle capacity, frees seats for other passengers.
To manage the seat allocation of these passengers, airlines optimise the terms of the following trade-off:
• allocating a high percentage of seats to these customers in case they do arrive at the ticketing counter, in order to maximise the revenue per occupied seat; and
• allocating a low percentage of seats to these customers in case they do not show up, in order to maximise the load factor.
Typically the larger the customer base and capacity are, the more efficient the yield management. In other words, compared to separate capacity strategies, two air carriers combining their fleet can carry more late-passengers for the same allocation (or equivalently, can reduce the allocation for potential late-passengers and carry the same number high-yield passengers.)
36 Often mistranslated as “ the whole is bigger than the sum of its parts”, Durkheim makes no a
priori assumption on the scale effect. “Un tout n'est pas identique à la somme de ses parties”. Emile Durkheim, 1895, Les règles de la méthode sociologique.
37 Implicitly, it is too late to rely on other passengers to occupy seats left vacant number of late passengers is lower that the expected number.
MODELLING AIRLINE COMPETITION Page 19 of 21

N E T W O R K E C O N O M I C S C O N S U L T I N G G R O U P
CONFERENCE PAPER
In what follows, we illustrate this scale effect by two examples. One is based on the theory of statistical variance; the other is from the queuing theory governing the arrival of high-yield passengers.
First, assume that two air carriers operate one 400-seat plane each. Assume that, on average, each of the carriers receives 100 demands for travel from yield-passengers. Finally, suppose that these demands are normally distributed with a standard deviation equal to 50.
Using standard statistical inference theory, we estimate that, for each carrier to be certain, in 95% of cases, to have enough seats to accommodate all the demand from late-passengers, they need to allocate 183 seats 38 – that is, 45.6% of their seats. Since on average the demand for these seats is 100, the average load factor is 79%.
Now assume that the two carriers jointly manage their fleet and their customer base. We compute the standard deviation of the sum of the (independent) demands for travel from late-passengers addressed to each carrier. The result is 70.7. We note that it is significantly lower than the sum of the standard deviations.
Using the same methodology as above, we find that to comply with the same condition (to be certain, in 95% of cases, to have enough seats to accommodate the demand from late-passengers) the airlines have to allocate 317 seats – that is, 39% of their joint seats (instead of 45.6%). More importantly, the average load factor is increased to 85% from 79% for the same level of service.
While this first example, illustrates the benefit of taking advantage of the law of large numbers, we abandon the normality assumption and we simply assume that arrivals of late-passengers are random. As explained by Tanner39, random arrivals in precisely defined in queuing theory:
• The number of arrivals in a particular time interval is independent of how many arrivals there were in some other intervals; and
• If the intervals are made small enough, the probability of one arrival is proportional to the length of the interval, and the probability of more than one arrival in negligible.
For random arrivals, the distribution is called Poisson distribution. If the time periods are
of length t, and the average arrival rate is λ per unit of time, the probability of a specific number of arrivals k during t is
38 %9050
100Pr =⎟⎠⎞
⎜⎝⎛ −
>AX , with A the number of allocated seats and X an standardised
normal variable. 39 Tanner M, 1994, Practical Queueing Analysis, McGraw-Hill, at pages 64ff.
MODELLING AIRLINE COMPETITION Page 20 of 21

N E T W O R K E C O N O M I C S C O N S U L T I N G G R O U P
CONFERENCE PAPER
( )k!λtearrivals)(kProb
kλt−
=
and the average number of arrivals per period is λt
Assume that the average number of demands from late-passengers is 50 for each flight – that is the average arrivals. Assuming late customers arrive at random, and hence have a Poisson distribution arrival pattern, we can say that for, say, 95 percent of the flights, no more than a particular number of customers will appear. This number is the 95th percentile, and is given in the table 2 for a range of values of means.
Table 2 Percentiles
Mean 95th percentile Mean/95th percentile
1 3 33.33%
2 5 40.00%
3 6 50.00%
5 9 55.56%
10 15 66.67%
30 39 76.92%
50 62 80.65%
100 117 85.47%
To be certain, in 95% of cases, to have enough seats to accommodate all the demand from late-passengers, each carrier (with a 50 average arrivals) must allocate 62 seats – that is, 15.5% of the total capacity.
Now assume that the two carriers jointly manage their fleet and their customer base, such that the average number of arrivals at their common counters is 100. Using table 2, carriers must allocate 117 seats to be certain, in 95% of cases, to have enough seats to accommodate all the demand from late-passengers. Therefore, for the same proportion of late-travellers served, only 14.6% of the total capacity has to be allocated, which is indeed an improvement compared to the independent yield-management.40
40 The third column of table 2 shows that this scale effect is found at each level of arrival rate.
MODELLING AIRLINE COMPETITION Page 21 of 21