Embed Size (px)
Citation preview

65
2▼
Airline Competition at Hub Airports and
Complaints of Unfair Conduct
High average fares in many of the city-pair markets involving the hub air-ports of major airlines have been a recurrent subject of public concern andpolicy debate during the past two decades. In recent years, these marketsalso have served as main entry points for many new, low-fare airlines.However, new entrants have reported highly aggressive responses by hub-bing incumbents, prompting the Department of Transportation (DOT)to propose criteria for identifying and taking enforcement action againstunfair, exclusionary practices. Trends in fares and competition at hub air-ports, the competitive concerns expressed by new entrants, and DOT’senforcement proposal are considered in this chapter.
COMPETITION IN CITY-PAIR MARKETS GENERALLY
Spread of Hub-and-Spoke Systems
Airlines compete for passengers at the city-pair level. There are thousandsof combinations of origin and destination (O-D) points that constitute
9310-02 Chapter 2 10/12/99 14:59 Page 65
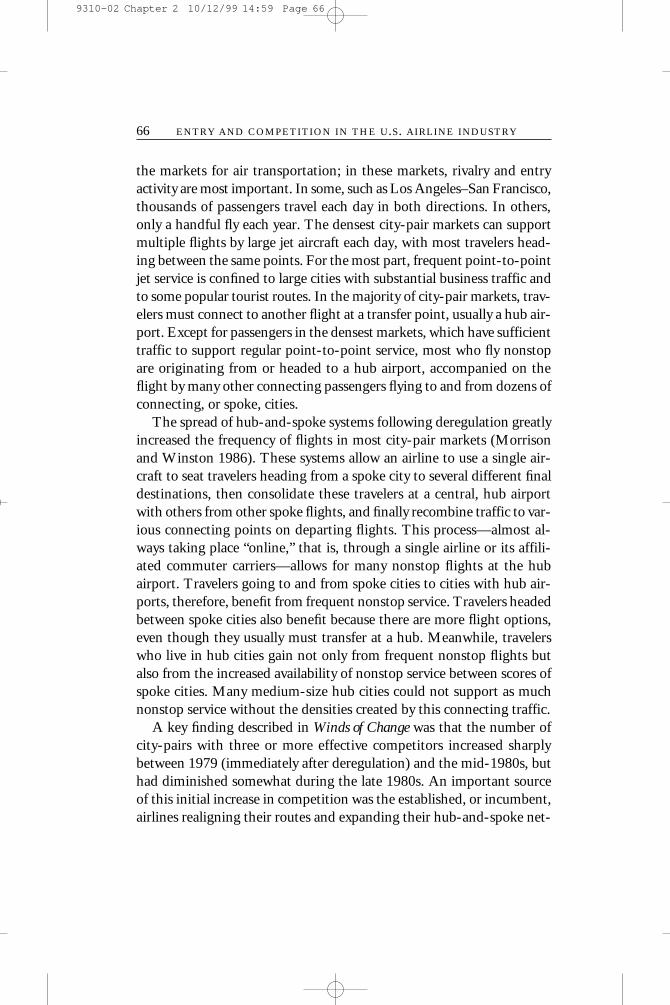
the markets for air transportation; in these markets, rivalry and entry activity are most important. In some, such as Los Angeles–San Francisco,thousands of passengers travel each day in both directions. In others,only a handful fly each year. The densest city-pair markets can supportmultiple flights by large jet aircraft each day, with most travelers head-ing between the same points. For the most part, frequent point-to-pointjet service is confined to large cities with substantial business traffic andto some popular tourist routes. In the majority of city-pair markets, trav-elers must connect to another flight at a transfer point, usually a hub air-port. Except for passengers in the densest markets, which have sufficienttraffic to support regular point-to-point service, most who fly nonstopare originating from or headed to a hub airport, accompanied on theflight by many other connecting passengers flying to and from dozens ofconnecting, or spoke, cities.
The spread of hub-and-spoke systems following deregulation greatlyincreased the frequency of flights in most city-pair markets (Morrisonand Winston 1986). These systems allow an airline to use a single air-craft to seat travelers heading from a spoke city to several different finaldestinations, then consolidate these travelers at a central, hub airportwith others from other spoke flights, and finally recombine traffic to var-ious connecting points on departing flights. This process—almost al-ways taking place “online,” that is, through a single airline or its affili-ated commuter carriers—allows for many nonstop flights at the hubairport. Travelers going to and from spoke cities to cities with hub air-ports, therefore, benefit from frequent nonstop service. Travelers headedbetween spoke cities also benefit because there are more flight options,even though they usually must transfer at a hub. Meanwhile, travelerswho live in hub cities gain not only from frequent nonstop flights butalso from the increased availability of nonstop service between scores ofspoke cities. Many medium-size hub cities could not support as muchnonstop service without the densities created by this connecting traffic.
A key finding described in Winds of Change was that the number ofcity-pairs with three or more effective competitors increased sharply between 1979 (immediately after deregulation) and the mid-1980s, buthad diminished somewhat during the late 1980s. An important sourceof this initial increase in competition was the established, or incumbent,airlines realigning their routes and expanding their hub-and-spoke net-
66 ENTRY AND COMPETITION IN THE U.S. AIRLINE INDUSTRY
9310-02 Chapter 2 10/12/99 14:59 Page 66
Airline Competition at Hub Airports and Complaints of Unfair Conduct 67
works.1 Added to that, the increased entry from startup airlines and theexpanded operations by formerly intrastate and charter operators mademany city-pair markets competitive battlegrounds. The largest increasesin competition occurred in the long-haul markets. Hub-and-spoke sys-tems multiplied the routing options for long-distance travelers, whocould choose to fly using the hubs of several competing carriers to reachtheir final destinations. The late-1980s dip in competition, most evidentin short-haul markets, was attributed to mergers and failures among air-lines that had started service soon after deregulation.
Update of Competition Analyses
Any update of trends in competition in the airline industry will be affectedby the specific time periods selected for comparison. The base year selected, 1992, was right after Winds of Change was released, as the air-line industry was emerging from the effects of a national recession. Thecomparison year, 1997, was the last full year for which complete datawere available when the analyses were conducted in early 1999. It islikely that comparisons using other years as beginning and end pointswould have yielded somewhat different outcomes. The results presentedhere, therefore, should be viewed as a snapshot comparison of competi-tion levels.
Market Distance
An update of the analyses in Winds of Change reveals that the majority oftravelers in long-distance markets continue to experience—and benefitfrom—the most competition. As shown in Table 2-1, about 35 percentof all travel occurred in city-pair markets with three or more effectivecompetitors (as defined in Table 2-1). This percentage has declinedsomewhat since 1992, when the figure was 39 percent. However, of allair travelers in the longer-haul markets, slightly more than half had the
1 Hub-and-spoke systems were difficult to construct when the Civil Aeronautics Boardlimited the ability of airlines to enter and exit routes. However, some airports, such asChicago O’Hare and Atlanta Hartsfield operated as major hubs even before deregulation.
9310-02 Chapter 2 10/12/99 14:59 Page 67

Tab
le 2
-1P
asse
nger
Tri
ps b
y M
arke
t Dis
tanc
e an
d N
umbe
r of E
ffec
tive
Com
peti
tors
, 19
92 a
nd 1
997
9310-02 Chapter 2 10/12/99 15:00 Page 68

Airline Competition at Hub Airports and Complaints of Unfair Conduct 69
benefit of choosing among three or more competitors in 1997—similarto the level in 1992.
Travelers in shorter-haul markets (under 1,000 miles) have had fewercompeting airlines from which to choose. This should be expected,since the closer two points are geographically, the less economical orpractical it is to offer connecting service. Few rival hubs are likely to bewithin sufficient proximity to offer practical transfer service, and fewtravelers are interested in paying the time penalty for making connec-tions on shorter-haul trips. There has been a decline in competition inthese markets, however. About 75 percent of short-haul travelers flewin markets with fewer than three competitors in 1997, compared with68 percent in 1992.
Market Density
The Winds of Change study also examined market-level competition withrespect to market traffic density. During the 1980s, high-volume mar-kets experienced the most competition. More rivalry might be expectedin dense city-pair markets, where the traffic volumes can support moreand varied, competing services. The Winds of Change analyses combineddata from airports in metropolitan areas to obtain a more complete pic-ture of the competitive options available to travelers in a region. A similarexamination of competition levels in 1997 reveals single-carrier marketsaccounted for only 14 percent of travel when market densities surpassed500 passengers per day (Table 2-2). A comparable level (12 percent) wasfound in 1992. As might be expected, travelers in low-density markets(under 20 passengers per day) continued to experience the least compe-tition; a slightly higher share (32 percent) of these travelers had only onecarrier to choose from in 1997 than in 1992 (28 percent). Overall, thedata presented in Table 2-2 show that a higher share of air travel was occurring in one- and two-carrier markets in 1997 than in 1992.
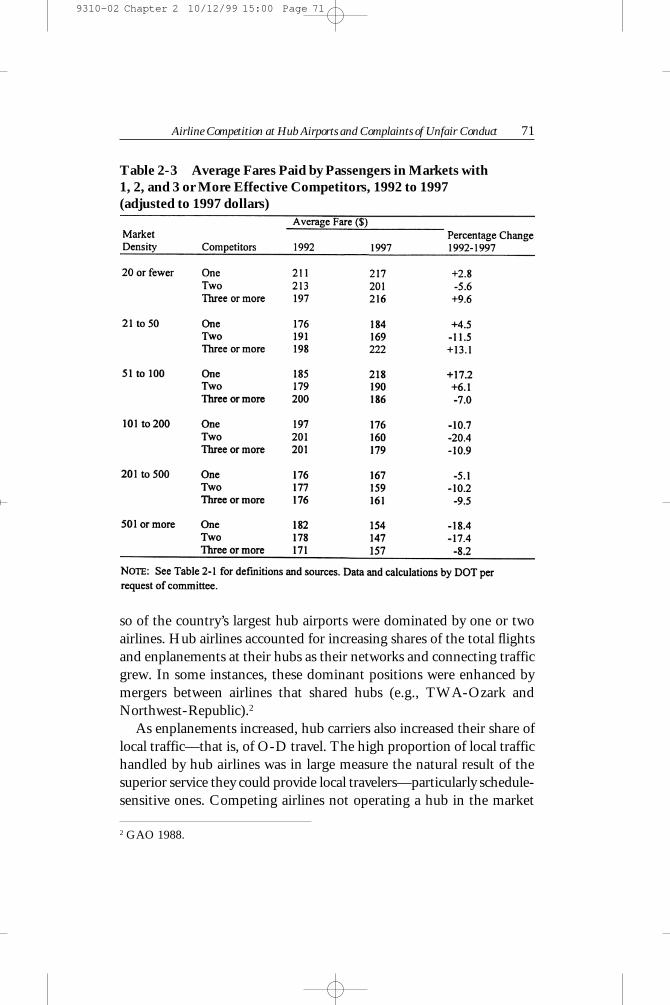
As shown in Table 2-3, travelers in the densest markets (more than100 passengers per day) have experienced declining average fares in recentyears irrespective of the number of competitors. Passengers in morelightly-traveled routes, by comparison, have experienced rising fares. Although there are likely to be some markets that have migrated upwardin density during the time period simply because of growing aggregate
9310-02 Chapter 2 10/12/99 15:00 Page 69

travel demand, the observed differences may have other explanations aswell. One possible reason is that Southwest Airlines and most other newlow-fare challengers have entered only the densest city-pair markets. Of-fering mostly point-to-point service, these jet airlines are not well suitedto more lightly-traveled routes.
COMPETITION IN HUB MARKETS
Concerns Over Hub Concentration
Competition in hub markets was a topic of interest in Winds of Change.Throughout the 1980s, it became apparent that operations at a dozen or
70 ENTRY AND COMPETITION IN THE U.S. AIRLINE INDUSTRY
Table 2-2 Passenger Trips in Markets by Density and Number of Competitors, 1992 and 1997
9310-02 Chapter 2 10/12/99 15:00 Page 70
Airline Competition at Hub Airports and Complaints of Unfair Conduct 71
so of the country’s largest hub airports were dominated by one or twoairlines. Hub airlines accounted for increasing shares of the total flightsand enplanements at their hubs as their networks and connecting trafficgrew. In some instances, these dominant positions were enhanced bymergers between airlines that shared hubs (e.g., TWA-Ozark andNorthwest-Republic).2
As enplanements increased, hub carriers also increased their share oflocal traffic—that is, of O-D travel. The high proportion of local traffichandled by hub airlines was in large measure the natural result of the superior service they could provide local travelers—particularly schedule-sensitive ones. Competing airlines not operating a hub in the market
Table 2-3 Average Fares Paid by Passengers in Markets with 1, 2, and 3 or More Effective Competitors, 1992 to 1997 (adjusted to 1997 dollars)
2 GAO 1988.
9310-02 Chapter 2 10/12/99 15:00 Page 71

could not achieve the high traffic densities to schedule the frequentnonstop flights desired by local business travelers. This scheduling advan-tage, boosted by marketing innovations—such as offering commissionoverrides to local travel agents and frequent-flier programs, which buildbrand loyalty—tended to strengthen the carrier’s hold on local traffic,particularly for business travel (Levine 1987; Borenstein 1989).
Concern over hub concentration has persisted. Anecdotal evidence ofhigh fares at hubs has prompted many studies of the effect of hub-and-spoke systems on fares and service, including analyses of fare differen-tials—or “hub premia”—between hub and nonhub markets. Resultsfrom some of these earlier studies 3 were reviewed in Winds of Change, forwhich additional analyses also were conducted. The findings led the ear-lier committee to comment favorably on the overall benefits of hub-and-spoke systems, including consumer gains from increased competition in most connecting markets. At the same time, however, the committee observed higher average fares in city-pair hub markets in comparison withother markets, when applying controls for distance and traffic density.
For nearly two decades now, the literature consistently has shownhigher fares in city-pair markets that include a concentrated hub as eitherthe origin or destination point; this especially applies to short-haul mar-kets in which one or two hubbing carriers handle most of the local traf-fic. Such findings, persisting over time, have prompted observers to question whether adequate conditions exist for free entry in many hubmarkets, particularly considering the many advantages hubbing carriersenjoy. Although some of these advantages exploit the preferences of travelers (e.g., frequent–flier programs), others seem unrelated to the efficiency or service of the carrier, such as the ability to offer commissionoverrides to local travel agents.4 Moreover, Winds of Change commentedextensively on the ability of hubbing airlines to benefit from longstand-ing financial agreements with hub airports and to affect entry by limitingthe availability of critical infrastructure such as airport gates (as discussedin Chapter 3).
In response, incumbent airlines—which operate most of the majorhubs—have long held that higher average fares in hub markets mainly
72 ENTRY AND COMPETITION IN THE U.S. AIRLINE INDUSTRY
3 GAO 1990; DOT 1990; Borenstein 1989.4 For an insightful review of these advantages, see Levine 1987.
9310-02 Chapter 2 10/12/99 15:00 Page 72

Airline Competition at Hub Airports and Complaints of Unfair Conduct 73
are the result of differences in traveler preferences among hub and non-hub markets. They point out that hub airports are located in major busi-ness centers, which attract many more time-sensitive business travelers.The airlines claim that comparisons between hub and nonhub marketsexaggerate fare differences, because many nonhub city-pairs includemore leisure destinations.
Thus, two main reasons have been offered by airlines for why analy-ses of aggregate fare data consistently show that major hub markets tendto have higher fares, on average, than nonhub markets. Both stem fromthe notion that hubs have a disproportionate share of business travelers.The first reason, which is not especially controversial, is that few, if any,major hub cities are important tourist destinations; any aggregate com-parisons of average fares at hub and nonhub markets are likely to includemore leisure markets in the nonhub data. This alone could account forsome of the fare differential at hubs, since leisure travelers tend to be lesscostly to serve than business travelers, who demand greater schedule fre-quency (as discussed in Chapter 1). Another possible reason is that mosthub airports are in cities that are major centers of businesses, centrallylocated (e.g., Chicago), and attractive to large, travel-intensive busi-nesses, in part because of the superb nonstop service.
To the extent that hubs serve a higher proportion of business travel-ers, higher average fares could be expected in hub markets because of thecost differences in serving time-sensitive travelers. By the same token,however, the higher proportion of price-inelastic business travelers in hubmarkets also provides greater opportunity for hubbing airlines to exercisetheir market power by price discriminating and possibly raising faresabove the cost of efficiently providing the schedule-intensive service. Asdiscussed in Chapter 1, fare differentials are necessary for airlines to payfor the frequent and convenient service desired by business travelers. Theissue, which cannot be empirically assessed here, is whether higher faresat hubs are the result of major airlines exploiting market power in theirhub markets.
Update of Hub Analyses
The Winds of Change study defined “concentrated hubs” as those largecities in which either a hubbing carrier accounted for more than 50
9310-02 Chapter 2 10/12/99 15:00 Page 73

percent of all local traffic or two hubbing carriers together accounted formore than 75 percent.5 The following 10 cities were classified as concen-trated hubs: Atlanta, Charlotte, Cincinnati, Dayton, Denver,6 Memphis,Minneapolis, Pittsburgh, Salt Lake City, and St. Louis. In addition, fiveother hub cities were defined as relatively unconcentrated, even thoughin each case a single hubbing carrier accounted for 40 to 50 percent of the local traffic. These were Dallas, Chicago, Detroit, Nashville, andRaleigh-Durham. Dallas and Chicago were deemed unconcentrated because the calculations included significant traffic from the two sec-ondary airports, Midway and Love Field.
Comparisons of average fares in city-pair markets involving these tenconcentrated and five unconcentrated hubs consistently found higherfares in the concentrated hubs, especially in short-haul markets (con-trolling for distance and density). Also, to control for the effects of price-sensitive leisure (i.e., tourist) markets, Winds of Change excluded fromthe city-pairs all O-D points involving California, Florida, Nevada, andArizona. Nevertheless, average fares were higher in the concentratedhubs than in the other markets.
Hub City Analyses
To update some of these earlier analyses, the current committee trackedtrends in the market shares of the largest carriers in those 15 hubs since1990. The updated results in Figure 2-1 show that most of the hub car-riers continue to handle 50 percent or more of the airport’s local traffic,although there is no discernible upward trend in concentration. In three
74 ENTRY AND COMPETITION IN THE U.S. AIRLINE INDUSTRY
5 It is important to avoid using a carrier’s share of total enplanements as the main mea-sure of market share or to identify concentrated hubs. Carriers using an airport as a maintransfer point can account for a large share of enplanements regardless of their share oflocal traffic. Delta, for instance, would still account for more than 35 percent of enplane-ments at Cincinnati even if it carried no local traffic. The share of local passenger trafficcarried by the major carrier in a hub airport (or on an individual route) is a more infor-mative measure.6 Denver was the only airport that was defined as a concentrated hub because it had twocarriers (United and Continental) together accounting for more than 75 percent of localtraffic.
9310-02 Chapter 2 10/12/99 15:00 Page 74

Fig
ure
2-1
Mar
ket s
hare
of l
arge
st c
arri
er a
t 15
curr
ent a
nd fo
rmer
hub
s, 1
990
to 1
998.
9310-02 Chapter 2 10/12/99 15:01 Page 75

instances—Dayton, Nashville, and Raleigh-Durham—the hubs sincehave been abandoned by the incumbent carriers and no airline accountsfor more than 35 percent of local traffic. In Salt Lake City, the domi-nance of Delta Airlines has declined somewhat as Southwest has gaineda significant share of many city-pair markets. Charlotte and Pittsburgh,main hubs of US Airways, continue to be among the most concentratedairports. In this case, the figures shown for Chicago and Dallas do notreflect competition from airlines in the secondary airports, Midway andLove Field. It is important to note, however, that whereas AmericanAirlines accounts for nearly 60 percent of local traffic at DFW, it accounts for less than 40 percent of Dallas-area traffic when Love Fieldis included. Likewise, United accounts for 45 percent of traffic at ChicagoO’Hare but less than 35 percent of Chicago-area traffic when Midwayis included.
Trends in average fares in these 12 current and 3 former hub airports,from 1990 to mid-1998, show a general decline when adjusted for infla-tion (Figure 2-2). Noteworthy, however, is that most of this decline occurred during the first half of the 1990s, before the general improve-ment in the economy. From the second quarter of 1995 to the secondquarter of 1998, fares fell in only 5 of the 15 markets—Atlanta, Dayton,Detroit, Memphis, and Nashville. Two of these markets are former hubs(Dayton and Nashville) and the others have experienced significant low-fare new entry.
The updates reveal other notable changes. The sharpest fare declinesover the entire period occurred in Salt Lake City (−40 percent) and Atlanta (−33 percent), probably because of entries by Morris Air andSouthwest in Salt Lake City and by ValuJet and later by AirTran in Atlanta. When adjusted for inflation, average fares also have fallen by 20percent or more in St. Louis (−24 percent) and Memphis (−22 percent),both served extensively by Southwest and some other low-fare airlines.Travelers in the three former hubs of Dayton, Raleigh-Durham, andNashville also experienced average fares that were 20 percent lower; a decline that is at odds with the hypothesis that higher average fares athubs reflect a naturally (and disproportionately) high percentage of busi-ness travel in hub cities. Meanwhile, in the highly concentrated hubs ofCharlotte and Pittsburgh—neither a location for lasting, low-fareentry—average fares have declined by less than 5 percent.
76 ENTRY AND COMPETITION IN THE U.S. AIRLINE INDUSTRY
9310-02 Chapter 2 10/12/99 15:01 Page 76

Fig
ure
2-2
Ave
rage
fare
s at 1
5 cu
rren
t and
form
er h
ubs,
199
0 to
199
8 (a
djus
ted
to 1
998
dolla
rs).
9310-02 Chapter 2 10/12/99 15:01 Page 77

Hub City-Pair Analyses
More relevant are fare differentials in city-pair markets. A comparisonof average fares in the most heavily traveled city-pair markets was madefor the second quarter of 1998.7 City-pairs that involved one or more ofthe 12 concentrated hubs were defined as hub markets and all other pairswere defined as nonhubs. Average fares were calculated for more than800 of the country’s busiest city-pair markets.
The results of this comparison, grouped by short-, medium-, andlong-haul markets are shown in Figure 2-3. Each data point representsthe average fare of a hub or nonhub city-pair market with distance indi-cated on the horizontal axis. In all three groupings, the hub marketstended to have higher fares than nonhub markets; the trend lines showthe least–square fit.
To control more precisely for the effects of distance and other possi-ble variables affecting average fares, several multiple regression analyseswere performed for the 1,000 top airport-pair markets.8 For a full yearending in the second quarter of 1998, average fares were regressed ondistance, population, and income variables (in logarithmic and linearforms). As shown in Table 2-4, the highest-fare markets—irrespectiveof regression form—consistently involved hub or slot–controlled airportsas either origin or destination points. The 12 concentrated hub airportswere involved in 54 of the 75 highest-fare markets.9 Of the 75, 29 involved at least one of the four slot-controlled airports (see Chapter 3).Airports repeatedly in the high-fare markets were LaGuardia (19 per-cent of city pairs), Philadelphia (15 percent), Detroit (15 percent),Newark (13 percent), Atlanta (12 percent), Chicago O’Hare (12 per-cent), and Boston (11 percent). Seven other airports—Dallas–Ft. Worth,Minneapolis, St. Louis, Washington (Reagan National), Charlotte,Baltimore, and Cincinnati—also appeared in 5 to 10 percent of the 75highest-fare markets.
78 ENTRY AND COMPETITION IN THE U.S. AIRLINE INDUSTRY
7 These were the most recent data available for the analyses.8 To save time, the committee tasked DOT to run the regressions in accord with thecommittee’s instructions.9 Newark and Philadelphia, which are important but unconcentrated hubs for Conti-nental and US Airways (respectively), also were involved in a large number of high-farecity-pair markets.
9310-02 Chapter 2 10/12/99 15:01 Page 78
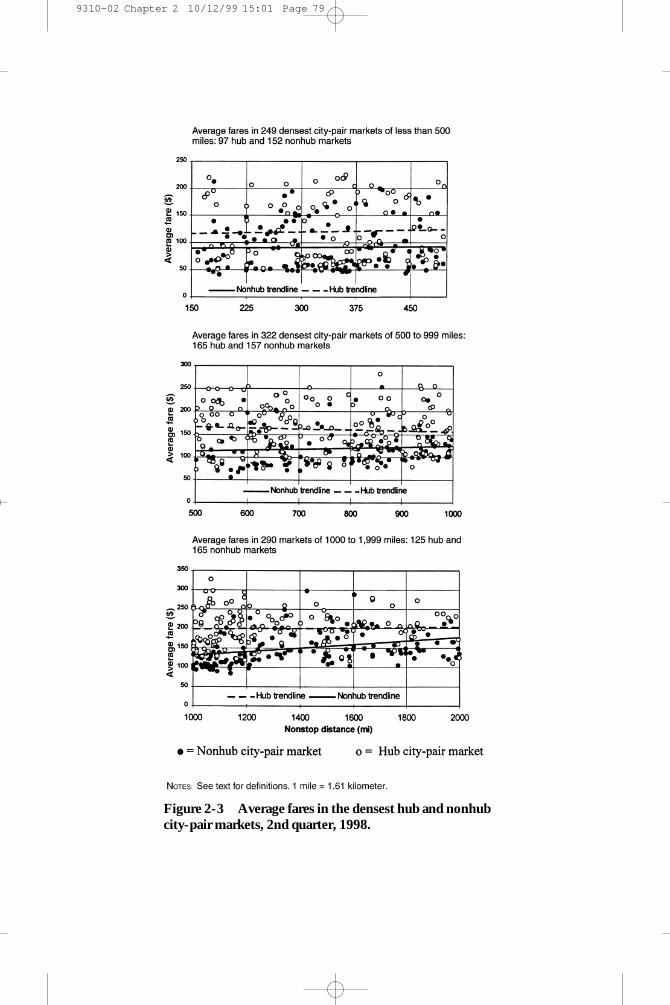
Figure 2-3 Average fares in the densest hub and nonhubcity-pair markets, 2nd quarter, 1998.
9310-02 Chapter 2 10/12/99 15:01 Page 79

Table 2-4 Seventy-five Highest- and Lowest-Fare Markets Among Densest 1,000 in 1997, Controlling for Effects of Population, Income, and Distance
9310-02 Chapter 2 10/12/99 15:02 Page 80

Airline Competition at Hub Airports and Complaints of Unfair Conduct 81
These results illustrate the magnitude of the fare differentials at hubs,which have spurred so much public concern. Of course, many of thehighest-fare markets in Table 2-4 are among the nation’s most popularfor business travel; thus many of the unexplained fare residuals mightbe related not only to market power and the low price elasticity for busi-ness travelers, but also to the higher costs of meeting service-orienteddemand.
Also evident from the analyses is that many of the high-fare marketsinvolve airports in the East and Midwest, where airway and airport capacity constraints contribute to costly traffic congestion, and conse-quently higher fares. Consistently missing from the highest-fare mar-kets are western cities, including some city pairs (e.g., Los Angeles–SanFrancisco) that might be expected to generate a significant amount ofbusiness traffic. Presumably, the influence of business traffic on averagefares should be manifest through higher average fares in some marketsoutside the East and Midwest. The geographic concentration of high-fare city-pair markets in the Midwest and East raises questions about thecauses.
The presence of Southwest and other low-fare airlines in many west-ern markets is cited frequently to explain this geographic pattern. Moreinteresting, however, are the underlying factors that attract discount air-lines to these markets. Less airport congestion and fewer air traffic delaysare possible reasons. Another possibility is the differing demand charac-teristics among eastern and western travelers—perhaps because the longerdistances between population centers in the West can make flying thepreferred mode for leisure travelers, leisure-oriented airlines can be moreviable. Whatever the reasons for this pattern, they merit further explo-ration in future studies.
ALLEGATIONS OF UNFAIR COMPETITIVERESPONSES TO NEW ENTRY
Growing concern over higher fares at hub airports was tempered some-what with the emergence of many low-fare carriers during the early 1990sand by the continued expansion of Southwest Airlines. As noted inChapter 1, many start–up airlines began service at hub airports or at sec-ondary airports in hub cities. The new entrants would schedule a
9310-02 Chapter 2 10/12/99 15:02 Page 81
few flights per day on dense routes, operating point-to-point service toachieve high load factors on narrow-body aircraft designed for short-haul,high-volume markets. Although not the only markets selected by thestartups, nonstop routes from major hubs such as Chicago O’Hare, Dal-las–Fort Worth, Denver, and Atlanta were targets of much new entry.
To fill planes without feed traffic from connecting flights, the new entrants offered fares below those of the hubbing airlines. The idea wasto stimulate pent-up demand not being met by the hubbing airlines withtheir restricted offerings of discount fares, although diversion from incumbents also was anticipated. Whatever the particular strategy, theeffect of new entry in reducing fares and increasing leisure traffic in manyhub markets quickly became evident, not only to incumbents but also toDOT, which began to promote the entry of low-fare airlines to challengethe dominant positions of hub carriers.
In its April 1996 report, The Low–Cost Airlines Service Revolution,DOT characterized the resurgence of low-fare airlines as a “watersheddevelopment in domestic aviation” that was having “a profound effect onefficiency, competition, consumers, and industry structure” (DOT 1996,1). The report estimated annual consumer savings of $6 billion from newairlines that had based their operations in hub airports and focused onservice in city-pair routes having above-average fares. Complaints bythese new entrants pointed to highly aggressive responses by incum-bents, prompting DOT to consider whether the larger carriers were try-ing to drive out their smaller rivals and exclude them from markets. Inits 1996 report, DOT announced its intention to review carefully alle-gations of anticompetitive conduct and to cooperate with the Depart-ment of Justice (DOJ) to enforce violations of antitrust law. In addition,DOT noted its own statutory authority to prohibit unfair methods ofcompetition (49 U.S.C. §41712), stating that it would consider pro-ceeding independently to deter conduct that could be characterized asanticompetitive under antitrust principles.
DOT’s Proposed Enforcement Policy Against Unfair,Exclusionary Practices
In the April 10, 1998, Federal Register, DOT published a proposed“Enforcement Policy Regarding Unfair Exclusionary Behavior in the
82 ENTRY AND COMPETITION IN THE U.S. AIRLINE INDUSTRY
9310-02 Chapter 2 10/12/99 15:02 Page 82

Airline Competition at Hub Airports and Complaints of Unfair Conduct 83
Air Transport Industry.”10 The statement, contained in Appendix A, described DOT’s perception of the problem, as well as its authority andits means to address it. In a preface, DOT maintained that its main inter-est was to discourage incumbents (referred to as “major carriers”) fromengaging in unfair conduct designed to exclude new entrants from competing in hub markets. Although DOT acknowledged that “unfair exclusionary conduct” might encompass various tactics airlines employto suppress competition in other kinds of markets, its policy statementfocused on the pricing and capacity responses by incumbents whenchallenged by new entrants in hub markets. It is in these markets thatDOT indicated it had received the most complaints about aggressiveprice-cutting responses by incumbents.
DOT singled out new entrants—which it defined as independent air-lines starting jet service during the past 10 years—as the most likely andsusceptible targets for exclusionary conduct, since these new entrants fre-quently operated from hubs and had limited resources and staying powerto withstand a prolonged offensive. DOT noted that the establishedlow-fare airlines, namely Southwest Airlines, were seldom the targets foraggressive price-cutting responses in markets in which they competedagainst hubbing carriers.
DOT stated that its informal investigations of complaints revealedthat incumbent airlines had both the opportunity and the motive to engage in exclusionary conduct. The opportunity was provided by theavailability of comprehensive and “real time” information on competitorprices (obtained through computer reservation systems [CRSs]) and bytheir ability to change prices quickly and to shift aircraft and seats amongcity-pair markets, without incurring significant, additional fixed or over-head costs. According to DOT, the incumbent’s motive was to protectits dominant position in the hub market and its long-term ability tocharge higher fares to price-inelastic business travelers.
DOT identified three pricing and capacity responses to screen outpotentially exclusionary conduct by an incumbent; if any of the follow-ing actions resulted in lower local revenue to the incumbent than woulda “reasonable alternative response,” DOT would investigate:
10 See Federal Register. 1998. Vol. 63, No. 9, (April 10) pp. 17919–17922.
9310-02 Chapter 2 10/12/99 15:02 Page 83

1. The incumbent added capacity and sold a large number of seats atvery low fares;
2. The number of local passengers that the incumbent carried at thenew entrant’s low fares—or at fares substantially below its own previouspricing—exceeded the new entrant’s total seat capacity; or
3. The number of local passengers that the incumbent carried at thenew entrant’s low fares—or at fares substantially below its own previouspricing—exceeded the number of low-fare passengers carried by the newentrant.
DOT explained that a reasonable alternative response could be the incumbent matching the low-fare offerings of its new competitor on arestricted basis—for instance, without greatly increasing the number of low-fare seats made available. This presumes that the incumbent responding in such a restrained manner could retain much of its high-fare, business traffic because of its service and marketing advantages. InDOT’s view, incumbent airlines were protecting and strengthening theirability, gained through market power, to set prices well above cost whenthey responded to low-fare entry in the unreasonable manner of sharplyreducing fares and increasing the number of unrestricted low-fare seatsavailable.
Using these three criteria to guide its investigations, DOT warned itwould pursue cases that strongly suggested exclusionary behavior, throughhearings before administrative law judges. It concluded its proposed pol-icy statement by noting that in addition to examining questionable pric-ing and capacity responses, it also would consider other indicators of unfair competition by airlines, such as actions reducing opportunities for—or raising the cost of—entry and competition. Reports of incumbent car-riers hoarding gate space, using their contractual agreements with hub air-ports to bar access by rivals or to increase the price of airport services, andoffering travel agents extra commissions to discourage bookings on newentrants also were identified as actions that would prompt further inquiry.
Rationale for DOT’s Criteria
In its proposed criteria, DOT’s focus was on responses to new entry bymajor airlines involving pricing and capacity assignments that it be-
84 ENTRY AND COMPETITION IN THE U.S. AIRLINE INDUSTRY
9310-02 Chapter 2 10/12/99 15:02 Page 84
Airline Competition at Hub Airports and Complaints of Unfair Conduct 85
lieved could reasonably be construed as having predatory aims. Thereis no universally accepted theory about what constitutes predation orhow best to detect and prove its occurrence. The fundamental concernis that the dominant firm will reduce prices specifically to drive out ri-vals or to discourage future entry or reentry, expecting to recoup anylosses incurred by subsequently raising and keeping its prices above com-petitive levels.11 In general, predation is believed to have occurred whena firm with dominant market position has priced its products below mar-ginal cost, so that the additional revenue generated from the sale of onemore unit would be less than the incremental cost of making the sale.12
It is presumed that a rational firm would not incur such avoidable lossesfor very long—for instance, by continuing to add capacity—unless it hadsome other aim such as strengthening its market power and its potentialto raise fares charged to price-inelastic travelers in the future.
The traditional view is that such losses may be an investment intendedto generate higher future returns in those markets. Recent economictheories, however, point to the possibility that predation also has other recoupment objectives. For instance, a dominant firm might engage inpredatory behavior to send a signal to current and prospective rivals thatits costs are low and the potential for profitable entry is slight.13 The pur-pose of predation also might be to develop the firm’s reputation as atough competitor and to suggest that entry will spur prolonged andcostly price cutting.14 The price-cutting incumbent also might be try-ing to build a larger wall to deter entry into the business generally—for instance by compelling prospective competitors to amass more credit orcash reserves to remain solvent until achieving profitability. According
11 Joskow, P.L., and A.K. Klevorick. 1979. A Framework for Analyzing Predatory Pric-ing Policy. Yale Law Journal, Vol. 89, No. 2, Dec.12 Exceptions include instances in which the firm cuts prices for promotional reasons,such as introducing a new product, and other reasons that bring benefits, such as an increase in the sale of a complementary product.13 Milgrom, P., and J. Roberts. 1990. New Theories on Predatory Pricing. In IndustrialStructure in the New Industrial Economics, Clarendon Press, Oxford.14 See Kreps, D., and R. Wilson. 1982. Reputation and Imperfect Information. Journalof Economic Theory, Vol. 27, pp. 253–79. Also, Comanor, W.S., and H.E. Frech. 1993.Predatory Pricing and the Meaning of Intent. Antitrust Bulletin. Vol. 38, No. 2, Sum-mer, pp. 293–308.
9310-02 Chapter 2 10/12/99 15:02 Page 85

to these theories, a single act of predation can have effects that transcendthe specific market in which the price cutting has occurred.
One significant difficulty in proving predation is determining whenand how the firm is likely to recoup its investment in predatory losses.Theories about predatory tactics suggest a variety of possibilities, includ-ing many that would be formidable to quantify—such as the effect ofpredation in deterring entry in other markets or the industry generally.Moreover, a firm’s marginal cost function may not be evident. Becauseof the many practical difficulties of quantifying marginal costs, the fed-eral courts in recent years have adopted the short-run average variablecost (AVC) as a proxy.15 AVC is an accounting measure of the avoidable(i.e., nonfixed) costs of producing output during a period—such as ex-penses for labor, fuel, and material. These variable costs are totaled anddivided by the output during the period to calculate the AVC.
Economists, however, also view opportunity costs as an appropriatecomponent of marginal cost. More profitable opportunities forgone bydeploying resources in a particular way constitute a true cost. A firm thatneglects opportunities for more profitable uses of its resources, and thathas the information to ascertain these opportunities, is presumably act-ing against its own interest. Thus, to the extent that AVC mainly reflectsthe direct expenses incurred in production, it is an unsatisfactory proxyfor marginal cost—since it does not account for more profitable oppor-tunities forgone.
By emphasizing revenue “self diversion,” DOT seemingly was tryingto incorporate opportunity costs into its method of detecting predation.DOT’s three screening criteria presumed that an incumbent that wassubstantially reducing fares and adding seating capacity to a route in re-sponse to new entry was sacrificing higher-fare sales in that market andpossibly in other markets by diverting seats from connecting passengersor redeploying aircraft from other routes. DOT seemed to be implyingthat the profits sacrificed from these other possible uses should be in-cluded in calculations of marginal cost, since they represented opportu-nity costs.
86 ENTRY AND COMPETITION IN THE U.S. AIRLINE INDUSTRY
15 The average variable cost measure, adopted by the federal courts to test for preda-tion, was first proposed by Areeda, P.E., and D.F. Turner. 1975. Predatory Pricingand Related Practices Under Section 2 of the Sherman Act, Harvard Law Review, Vol.88, pp. 697–733. The test is commonly referred to as the Areeda-Turner Test.
9310-02 Chapter 2 10/12/99 15:02 Page 86

Airline Competition at Hub Airports and Complaints of Unfair Conduct 87
One of the difficulties with DOT’s approach for detecting predation,however, is ascertaining opportunity costs. In the airline industry, amajor airline can operate in thousands of markets that vary widely inprofitability at any given time; it is likely, therefore, that the airline hasexcess or idle capacity somewhere in its system. Determining retrospec-tively if and where this capacity could have been employed more prof-itably can be speculative and hypothetical. Dynamic analyses of responseoptions also might suggest many reasonable alternatives. An incumbentairline, challenged by a low-fare entrant, might find it unprofitable tocontinue its discriminatory pricing—for instance, by continuing to chargehigh fares to time-sensitive travelers while matching the new entrant’slow fares on a limited basis. One reason is that time-sensitive businesstravelers might find the discounted—and often unrestricted—fares ofthe new entrant to be sufficiently low to be appealing, despite the sacri-fice of frequent flier benefits and schedule intensity. In this regard, theincumbent may not have a realistic option—at least in the short-term—of continuing to offer higher unrestricted fares, as DOT presumes.
Because of the complexities of airline pricing and network operations,distinguishing between legitimate and questionable competitive responsesposes significant challenges, and raises the possibility of false charges of predation, and the risk that some genuine predatory conduct will go un-detected. While particular theories of predation that are more or less rele-vant to the airline industry could not be judged in this study (with its broader charge), the committee did consider specific complaints of ex-clusionary practices received by DOT and some of the risks and challengesinvolved in trying to spot and prohibit such conduct in the airline industry.
Reports of Exclusionary Conduct
DOT submitted to the committee a total of more than 40 complaintsfrom new entrants alleging exclusionary or anticompetitive conduct byincumbents between March 1993 and May 1999; these are listed inAppendix C. A few of the complaints were not relevant. Some, for instance, concerned nonpassenger services. In addition, there were alsomultiple complaints by the same carrier against another. The first typewas disregarded, while the repeated complaints were combined into single cases. In the end, there were 32 individual and combined cases.DOT believed this list was not comprehensive, and that other similar—but unreported—occurrences were likely.
9310-02 Chapter 2 10/12/99 15:02 Page 87
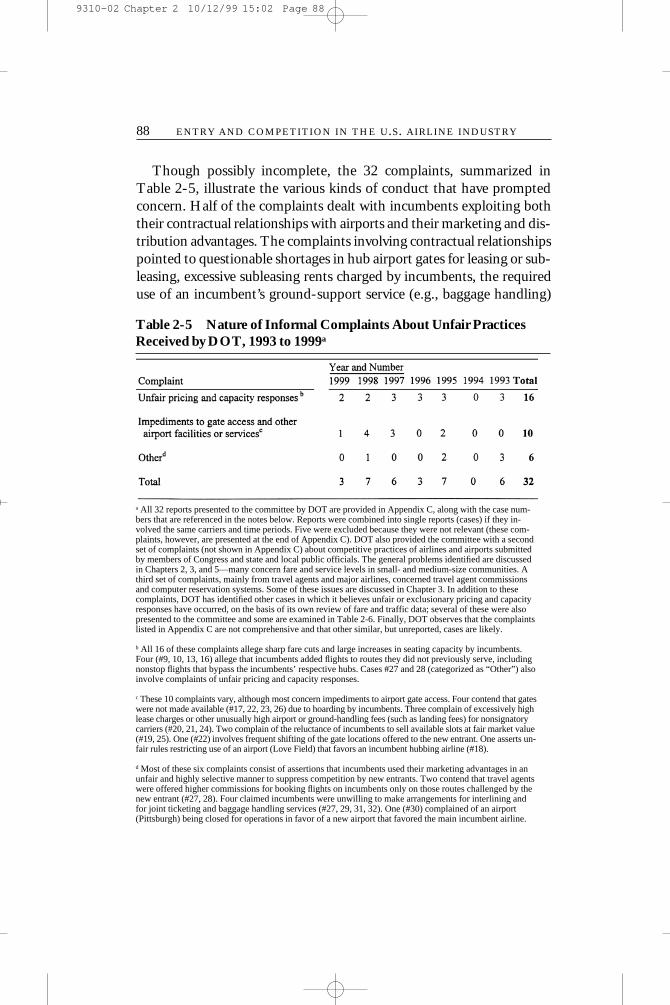
Though possibly incomplete, the 32 complaints, summarized inTable 2-5, illustrate the various kinds of conduct that have promptedconcern. Half of the complaints dealt with incumbents exploiting boththeir contractual relationships with airports and their marketing and dis-tribution advantages. The complaints involving contractual relationshipspointed to questionable shortages in hub airport gates for leasing or sub-leasing, excessive subleasing rents charged by incumbents, the requireduse of an incumbent’s ground-support service (e.g., baggage handling)
88 ENTRY AND COMPETITION IN THE U.S. AIRLINE INDUSTRY
Table 2-5 Nature of Informal Complaints About Unfair PracticesReceived by DOT, 1993 to 1999a
a All 32 reports presented to the committee by DOT are provided in Appendix C, along with the case num-bers that are referenced in the notes below. Reports were combined into single reports (cases) if they in-volved the same carriers and time periods. Five were excluded because they were not relevant (these com-plaints, however, are presented at the end of Appendix C). DOT also provided the committee with a secondset of complaints (not shown in Appendix C) about competitive practices of airlines and airports submittedby members of Congress and state and local public officials. The general problems identified are discussedin Chapters 2, 3, and 5—many concern fare and service levels in small- and medium-size communities. Athird set of complaints, mainly from travel agents and major airlines, concerned travel agent commissionsand computer reservation systems. Some of these issues are discussed in Chapter 3. In addition to thesecomplaints, DOT has identified other cases in which it believes unfair or exclusionary pricing and capacityresponses have occurred, on the basis of its own review of fare and traffic data; several of these were alsopresented to the committee and some are examined in Table 2-6. Finally, DOT observes that the complaintslisted in Appendix C are not comprehensive and that other similar, but unreported, cases are likely.
b All 16 of these complaints allege sharp fare cuts and large increases in seating capacity by incumbents.Four (#9, 10, 13, 16) allege that incumbents added flights to routes they did not previously serve, includingnonstop flights that bypass the incumbents’ respective hubs. Cases #27 and 28 (categorized as “Other”) alsoinvolve complaints of unfair pricing and capacity responses.
c These 10 complaints vary, although most concern impediments to airport gate access. Four contend that gateswere not made available (#17, 22, 23, 26) due to hoarding by incumbents. Three complain of excessively highlease charges or other unusually high airport or ground-handling fees (such as landing fees) for nonsignatorycarriers (#20, 21, 24). Two complain of the reluctance of incumbents to sell available slots at fair market value(#19, 25). One (#22) involves frequent shifting of the gate locations offered to the new entrant. One asserts un-fair rules restricting use of an airport (Love Field) that favors an incumbent hubbing airline (#18).
d Most of these six complaints consist of assertions that incumbents used their marketing advantages in anunfair and highly selective manner to suppress competition by new entrants. Two contend that travel agentswere offered higher commissions for booking flights on incumbents only on those routes challenged by thenew entrant (#27, 28). Four claimed incumbents were unwilling to make arrangements for interlining andfor joint ticketing and baggage handling services (#27, 29, 31, 32). One (#30) complained of an airport(Pittsburgh) being closed for operations in favor of a new airport that favored the main incumbent airline.
9310-02 Chapter 2 10/12/99 15:02 Page 88

Airline Competition at Hub Airports and Complaints of Unfair Conduct 89
at excessive rates, and the frequent shifting of the gates available to newentrants. In two cases, new entrants complained that incumbents wereunwilling to sell airport slots at fair market value.
There were six complaints focusing on incumbents’ use of marketingand distribution advantages. Two claimed that incumbents offered travelagents higher commission overrides for booking flights in markets chal-lenged by new entrants. Three complained that incumbent-affiliatedCRSs listed new entrant flights in a biased manner. Others claimed thatincumbents were unwilling to participate in joint ticketing and baggagetransfer arrangements for passengers interested in interlining (i.e., trans-ferring between the two airlines for connecting service).
Because of the limited information, it was not possible for the com-mittee to assess the validity of all these complaints. Certainly the vague andinformal nature of some complaints weakened their credibility. Never-theless, the committee recognized that incumbents could use all of thesetactics—limiting access to airports by restricting the availability of slotsand gates; influencing CRS listings; and offering special travel agent incentives—to the detriment of smaller rivals, possibly denying them theopportunity to compete fully on the basis of relative costs and the attrac-tiveness of their offerings. Recommendations for correcting these par-ticular matters are offered in Chapters 3 and 4.
The committee reviewed more closely the complaints that involved in-cumbents sharply reducing fares and increasing flights and seating capac-ity on specific routes challenged by new entrants. Such actions were themain target of DOT’s proposed enforcement policy. About half of the for-warded complaints involved this general kind of response; however, thecommittee could examine only seven. DOT also forwarded to the com-mittee several additional examples of pricing and capacity responses by in-cumbents that appeared suspicious based on its informal application of theproposed enforcement criteria. The committee reviewed five of these casesin detail; making a total of 12 cases examined, as listed in Table 2-6. Thereview was by no means intended to be systematic or conclusive, but toprovide insight into the kinds of problems that have caused concern.
All 12 involved a short- to medium-haul market (less than 1,000 mi)and a major carrier’s hub at one or both ends. All of the alleged aggres-sors were incumbent airlines and all of the alleged victims were airlinesformed during the past 10 years, also characterized by DOT as low-fare
9310-02 Chapter 2 10/12/99 15:02 Page 89
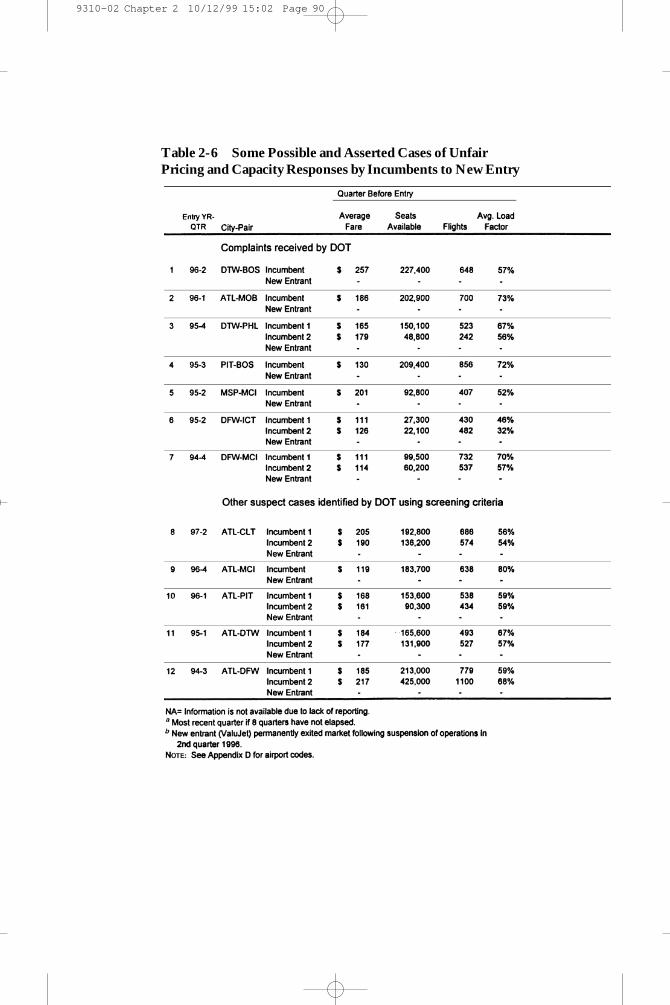
Table 2-6 Some Possible and Asserted Cases of UnfairPricing and Capacity Responses by Incumbents to New Entry
9310-02 Chapter 2 10/12/99 15:02 Page 90

carriers. The committee reviewed the chronology of average fares, pas-senger traffic, load factors, flights, and exit and entry activity.
By the second quarter after the lower-priced entry,
• In 10 of the 12 cases, the new entrant’s average fares in the marketwere at least 50 percent lower than the average fare of the incumbentwith the highest market share during the quarter preceding entry.
Table 2-6 continued
9310-02 Chapter 2 10/12/99 15:02 Page 91
• In 9 of these cases, average fares for one or more of the incumbentsin each market fell by one-third or more.
• In 4 cases the incumbents’ total seats in the market increased byone-third or more.
• As might be expected, the sharply lower fares resulted in higherload factors for the incumbents, as demand was spurred.
Eight quarters after the entry,
• The new entrant had exited in half the cases, although in one casebecause of an unrelated circumstance (ValuJet’s exit following the sus-pension of its operations in the summer of 1996).
• In the other 6 cases, the new entrant and incumbent were stillcompeting.
• In 5 of these cases, average fares for both the incumbent and newentrant were much lower than they were during the quarter before new entry.
It would thus appear that travelers in these 12 markets benefited, atleast initially, from the low-fare new entry and subsequent price-cuttingby incumbents. Of the five cases in which the new entrant exited withintwo years (excluding the ValuJet case), at least two involved the incum-bent sharply reducing fares and increasing capacity during the entrant’schallenge and then returning to much higher fares shortly after the entrant had exited. In these cases, the fare savings to travelers appear tohave been fleeting.
Though limited, this sample offers some insight into the problemslikely to arise in detecting predation. For instance, it would have been dif-ficult to predict in which of the 12 markets competition would have beendriven out and fares restored to previous levels and in which markets com-petition would have continued to the lasting benefit of consumers.
Among all 32 complaints, the most difficult to reconcile with normalcompetition occurred when incumbents “overlaid” the routes of new entrants, particularly by introducing new nonstop jet flights. Four of thecomplaints forwarded by DOT involved such responses, as noted inTable 2-5. Some involved the incumbent (see complaints 10 and 16 inAppendix C), or its commuter affiliate, introducing point-to-point ser-
92 ENTRY AND COMPETITION IN THE U.S. AIRLINE INDUSTRY
9310-02 Chapter 2 10/12/99 15:02 Page 92
Airline Competition at Hub Airports and Complaints of Unfair Conduct 93
vice in a market by bypassing its own hub-and-spoke system. For in-stance, in March 1996, Air South complained that both Continental’sand Delta’s commuter affiliates had attempted to overlay its new servicein three markets: Charleston–Newark, Columbia–Newark, and MyrtleBeach–Newark. Three years earlier, DOT had questioned the motives ofNorthwest Airlines when it announced plans for nonstop service betweenReno and Seattle, Los Angeles, and San Diego. These plans were un-veiled shortly after Reno Air began service from Reno to Minneapolis,which is Northwest’s main hub. Since point-to-point service is unusualfor a hubbing carrier in moderate-density markets, the introduction ofthis service, coupled with low fares, certainly suggests exclusionary inten-tions and deserves further review by antitrust enforcers.16
Agency Enforcement Roles
The nation’s antitrust laws consist mainly of the Sherman Act—the firstfederal antitrust law—and the Federal Trade Commission (FTC) andClayton Acts. Predatory pricing is most commonly analyzed under Section2 of the Sherman Act, which makes it unlawful for a business to “monop-olize, or attempt to monopolize” trade or commerce. As this law has beeninterpreted, it is violated only if a firm tries to maintain or acquire a monopoly position through unreasonable methods. For a court, a keyfactor in determining what is unreasonable is whether the practice has alegitimate business justification. DOJ, FTC, state attorneys general, andprivate plaintiffs can bring suit under the Sherman Act. Civil rather thancriminal suits have been the norm for suspected predation violations.The act allows treble damage awards for civil violations, penalties thatare generally considered to be a significant deterrent to unlawful con-duct. Antitrust litigation, whether public or private, can take many yearsto pursue and at significant legal expense.
To further deter anticompetitive conduct, FTC was established byCongress. FTC is a consumer protection agency with two basic mandates
16 For economic reasons, major carriers tend to add flights only through their hubs, because the additional flights will connect traffic and raise load factors on other flights.New service that bypasses the hub will divert some passengers from hub flights, reduc-ing load factors. The addition of bypass service, therefore, is unusual, and deservesscrutiny when coincidental with new entry.
9310-02 Chapter 2 10/12/99 15:02 Page 93

under the FTC Act: to guard the marketplace from unfair methods ofcompetition, and to prevent unfair or deceptive acts or practices that harmconsumers. FTC can file cases both in federal court and in a special ad-ministrative forum. Section 5 of the FTC Act outlaws “unfair methodsof competition” but does not define “unfair.” The Supreme Court hasruled that violations of the Sherman Act also are violations of Section 5,which also can cover some practices that are beyond the scope of theSherman Act. Section 5 empowers FTC to prevent unfair methods ofcompetition and business practices that restrain competition. FTC alsoshares with DOJ (along with private plaintiffs and states) responsibilityfor enforcing Section 7 of the Clayton Act, which prohibits mergers andacquisitions when the effect “may be substantially to lessen competition,or to tend to create a monopoly.” The two federal enforcement agenciestherefore work together on many matters, for instance in developingguidelines for horizontal mergers and in enforcing Section 7A of theClayton Act (called the Hart-Scott-Rodino Act of 1976), which requiresthat firms give both agencies prior notification of planned mergers.
It is important to note that the airline industry is not subject to FTCoversight under Section 5 of the FTC Act. The Civil Aeronautics andFederal Aviation Acts gave comparable competition and consumer pro-tection authorities to the Civil Aeronautics Board (CAB). These author-ities later were transferred to DOT in 1984, when CAB was abolished.Specifically, the law (49 U.S.C 41712) now states that DOT, on its owninitiative or after receiving a complaint, can investigate and decidewhether an air carrier or ticket agent has been or is engaged in an unfairor deceptive practice or an unfair method of competition. If DOT, afternotice and an opportunity for a hearing, finds that an air carrier is en-gaged in an unfair or deceptive practice or unfair method of competi-tion, it can order a stop to the practice or method.
An issue that underlies the current debate over predation in the airlineindustry is whether enforcement should be handled primarily by DOJunder the Sherman Act. The controversy hinges in part on whether theactions targeted by DOT can and should be forbidden through adminis-trative procedures. As discussed in Chapter 3, DOT has used its admin-istrative authorities to prohibit unfair methods of competition by regu-lating the listing of competing fare and service offerings on CRSs. DOThas defined as unfair and illegal certain CRS information displays thatfavor particular carriers. DOT’s proposed criteria for spotting potential
94 ENTRY AND COMPETITION IN THE U.S. AIRLINE INDUSTRY
9310-02 Chapter 2 10/12/99 15:03 Page 94
Airline Competition at Hub Airports and Complaints of Unfair Conduct 95
predatory conduct, however, differ from this usual regulatory approach.The incumbent pricing and capacity responses that the criteria focus onare not types of behavior that are prohibited per se. They are instead de-scribed by DOT as screening criteria for triggering further inquiry.
A concern that many major airlines have is that these criteria willevolve into, or have the practical effect of, regulatory standards, causingthe pricing and capacity responses they describe to become the defini-tions of unfair methods of competition, possibly inhibiting some trulycompetitive pricing and capacity responses. Underlying this concern is asense that administrative rules tend to become increasingly restrictiveand rigid over time, in part because of the agency’s well-intended ef-forts to be objective and evenhanded in applying the rules and to providethe industry and public officials with guidance about acceptable conduct.A related concern is that such bureaucratic specifications might not dis-tinguish sufficiently among different marketplace circumstances; alsothat those applying the rules might lose sight of their broader purposeand pursue other, narrower goals—for instance, protecting individualcompetitors rather than the competitive process.
Consideration was not given in this study to FTC’s possible role in pre-dation enforcement, since this option falls outside the current framework;however, DOJ’s involvement was considered. DOJ’s Antitrust Divisionemploys hundreds of lawyers, economists, and industry experts to identify,investigate, and prosecute monopoly practices and other antitrust viola-tions. Because of the breadth of its coverage, it is also expected—and com-pelled—to remain distant from the day-to-day issues and policy concernsof individual industries and sectors of the economy.17 This detachment isgenerally viewed as beneficial, reducing the chances that the agency willbecome too close to the industries it watches over, and making it less sus-ceptible to pressures for favorable treatment from industry constituencies.
The involvement of industry- or sector-specific agencies—such asDOT—in antitrust matters is controversial in part because of this con-cern over industry influences. These agencies are immersed in the mostroutine industry matters, charged not only with regulation but often withdispersing federal aid, operating vital infrastructure, and sometimes withpromoting the general welfare of the industry. While this closeness has
17 However, it can participate in regulatory hearings advising agencies on the antitrustimplications of their proposed actions.
9310-02 Chapter 2 10/12/99 15:03 Page 95

the benefit of allowing agency personnel to develop expertise in indus-try operations, a concern is that this same attribute, over time, will causethe agency to become overly deferential to industry viewpoints.
The extent to which these risks might apply to DOT’s proposed involvement in developing and enforcing prohibitions against predation isa matter of judgment. As explained in the Executive Summary, all of thecommittee members recognized the risks but differed in assessing them.
SUMMARY
Domestic airlines compete for travelers in thousands of city-pair marketsacross the United States. The expansion of hub-and-spoke systems sincederegulation has led to more competition in more city-pair markets, es-pecially in longer-haul markets. Because of the traffic densities created byhub networks, however, airlines have been able to dominate local trafficon many of the short-haul, nonstop routes, or spokes, emanating fromtheir hubs. It is not unusual for hub-based, nonstop markets to account fortwo-thirds or more of an airline’s total passengers. To be sure, various ef-ficiencies and service advantages are usually the main reasons hubbing air-lines have attained dominant positions. Nevertheless, other factors, suchas marketing and ticket distribution advantages, as well as preferential con-tracts with airport operators, also have contributed.
The possibility that incumbent carriers are exploiting their dominantpositions at hubs and charging monopoly fares has been a concern of pol-icy makers for nearly two decades. Higher average fares in concentratedhub markets compared with unconcentrated hub and nonhub marketshave been observed in several studies, including some simplified compar-isons made here. Whether the fare differential is related more or less to in-herent differences in market characteristics and costs or to dominant car-riers exploiting market power cannot be conclusively determined from thedata. Nevertheless, the consistency with which hub markets appear amongthe highest-fare markets is noteworthy and raises the possibility that hubcarriers are exploiting market power in ways that would not be sustainedif they were subject to more effective competition.
The reemergence of low-fare carriers early in the 1990s—and theirtargeting of high-fare hub markets—seemed to offer a timely check onthis problem. Hub markets subjected to significant and lasting low-fare
96 ENTRY AND COMPETITION IN THE U.S. AIRLINE INDUSTRY
9310-02 Chapter 2 10/12/99 15:03 Page 96

Airline Competition at Hub Airports and Complaints of Unfair Conduct 97
entry have experienced large reductions in fares during the past 10 years.DOT officials, concerned about high fares at hub airports, have viewedlow-fare entry as an antidote to hub dominance, and have therefore ex-pressed alarm about incumbent behavior that might suppress or inhibitentry. This concern motivated DOT to propose a means of spottingpredatory conduct in the airline industry.
The committee could not conduct a thorough review of the complaintsand evidence regarding anticompetitive conduct, although a cursory review revealed some actions that were difficult to reconcile with fair andefficient competition. Particularly difficult to reconcile were cases inwhich incumbent carriers added nonstop service in low- to moderate-density markets they had not previously served directly, coincident witha new entry. In some of these cases, the incumbent bypassed its own hubto initiate the service, a strategy seldom employed outside of high-den-sity markets. The logical inference is that such responses are probablytemporary—possibly calculated to protect the incumbent’s hub trafficand to dissuade similar challenges elsewhere—and would seem to war-rant additional scrutiny.
Incumbents also have been charged with using frequent-flier pro-grams, travel agent incentives, and other marketing advantages to targetand disadvantage new entrants. Other complaints cited incumbents forusing their preferential contracts with airports to restrict or withholdgates from challengers and to make airport operations otherwise expen-sive and burdensome. Some also have suggested that incumbents havemanipulated CRS listings to put new entrants at a disadvantage in mar-keting and distributing their fare and service offerings. Although thecommittee was unable to assess the details and validity of these specificcomplaints, it believes they merit further investigation by DOT.
In otherwise exercising its statutory authority to prevent unfair com-petition with regard to predation, DOT must be mindful of the chal-lenges involved in identifying and proving predation and of the risk thatits enforcement efforts might become increasingly regulatory and pro-tective of individual competitors rather than of the competitive process.With respect to these risks, the committee is concerned that DOT’s pres-ent enforcement proposal contains flaws. These include the arbitrary definitions of the specific types of new entrants that deserve special at-tention or scrutiny; moreover, DOT’s empirical means of detecting or
9310-02 Chapter 2 10/12/99 15:03 Page 97

testing for predation depend too much on hypothetical scenarios andspeculation about alternative responses. Although consideration of op-portunity cost is important in testing for predation, the difficulty of de-veloping such tests should not be underestimated.
Committee members’ differing opinions on the seriousness of theserisks and challenges, and the best enforcement role for DOT, are explainedin the Executive Summary. Notwithstanding these differences, the com-mittee unanimously believes DOT’s strategic role should be positive,fostering marketplace conditions that are conducive to entry and morecompetition. Chapter 3 identifies several such opportunities and recom-mends actions to exploit them.
REFERENCES
ABBREVIATIONSDOT Department of TransportationGAO General Accounting Office
Areeda, P.E., and D.F. Turner. 1975. Predatory Pricing and Related Practices UnderSection 2 of the Sherman Act, Harvard Law Review, Vol. 88, pp. 697–733.
Borenstein, S. 1989. Hubs and High Fares: Dominance and Market Power in the U.S.Airline Industry. RAND Journal of Economics, Vol. 20, Autumn, pp. 344–365.
Comanor, W.S., and H.E. Frech. 1993. Predatory Pricing and the Meaning of Intent.Antitrust Bulletin. Vol. 38, No. 2, Summer, pp. 293–308.
DOT. 1990. Secretary’s Task Force on Competition in the U.S. Domestic Airline Industry:Pricing. Volumes I and II.
DOT. 1996. The Low Cost Airline Service Revolution. Office of Aviation and Inter-national Economics. April, Washington, D.C.
GAO. 1988. Airline Competition: Fare and Service Changes at St. Louis Since the TWA-Ozark Merger. Report RCED-88-217BR, Washington, D.C.
GAO. 1990. Airline Competition: Industry Operating and Marketing Practices Limit Mar-ket Entry. Report RCED 90-147. Washington, D.C.
Joskow, P.L., and A.K. Klevorick. 1979. A Framework for Analyzing Predatory PricingPolicy. Yale Law Journal, Vol. 89, No. 2, Dec.
Levine, M.E. 1965. Is Regulation Necessary? California Air Transportation and NationalRegulatory Policy. Yale Law Journal, Vol. 74, July, pp. 1416–1447.
Levine, M.E. 1987. Airline Competition in Deregulated Markets: Theory, Firm Strat-egy and Public Policy. Yale Journal on Regulation, Vol. 4, Spring, pp. 393–494.
Milgrom, P., and J. Roberts. 1990. New Theories on Predatory Pricing. In IndustrialStructure in the New Industrial Economics, Clarendon Press, Oxford.
Morrison, S.A., and C. Winston. 1986. The Economic Effects of Airline Deregulation. TheBrookings Institution, Washington, D.C.
98 ENTRY AND COMPETITION IN THE U.S. AIRLINE INDUSTRY
9310-02 Chapter 2 10/12/99 15:03 Page 98