Embed Size (px)
Citation preview

Modeling the Propagation of Inflammation in Atherosclerosis
Zachary Haiman Hao Mu
University of California, San Diego
Department of Bioengineering
BENG 221 Project
11/28/17

I
Abstract
Atherosclerosis is an inflammatory disease that can block blood flow in the arteries as the
disease progresses. We modeled the development of atherosclerosis with the concentration of
monocytes and pro-inflammatory cytokines in three initial conditions: the low, intermediate, and
high level of LDL in the intima of the arterial wall. The result of the simulation predicts the
behavior of the system. The inflammatory response in the low LDL level scenario decays
rapidly; the response from the intermediate LDL level depends on the strength of the stimulus;
the high LDL level will proceed to chronic inflammation regardless of the strength of the
stimulus. This model can be a good starting point for the future research of atherosclerosis.

Table of Contents
Abstract....................................................
1. Introduction..........................................
2. Methods................................................
2.1 Parameterization..........................
2.2 One-dimensional model...............
2.3 Two-dimensional model..............
3. Results..................................................
3.1 Stability Analysis.........................
3.2 Bistable Conditions......................
3.2.1 One-dimensional model......
3.2.2 Two-dimensional model.....
3.3 Monostable Conditions................
3.3.1 One-dimensional model......
3.3.2 Two-dimensional model.....
4. Discussion............................................
5. References............................................
6. Appendix..............................................
6.1 Stability Analysis Calculations....
6.2 MATLAB Code...........................
6.2.1 One-dimensional model......
6.2.2 Two-dimensional model.....
6.2.3 Obtained from BENG 260..
....................................I
....................................1
....................................2
....................................2
....................................3
....................................3
....................................4
....................................4
....................................6
....................................6
....................................6
....................................8
....................................8
....................................9
....................................9
....................................10
....................................11
....................................11
....................................12
....................................12
....................................16
....................................18

2
1. Introduction
Inflammation is the process of eliminating pathogens, foreign bodies or necrotic cells in the
vascularized tissue. Once the tissue is damaged, the cells surrounding the site of injury release
cytokines and other signal molecules to the extracellular space to trigger the immune system.
The local capillaries dilate and become more permeable, allowing both leukocytes and plasma
proteins to enter the intercellular space. The phagocytes (neutrophils, monocytes, and
macrophages) clear the pathogen or cell debris by phagocytosis, which accounts for the antigen
recognition of the acquired immunity. The acute inflammation often involves swelling and heat
of the affected tissue, and if the inflammation proceeds to chronic inflammation, the tissue can
experience permanent change like fibrosclerosis. [1]
In atherosclerosis, the accumulation of low density lipoprotein (LDL) in the intima of the
arteries activates the endothelial cells and triggers monocyte recruitment to the intima. After
entering the intima, the monocytes convert to macrophages and engulf LDL. The phagocytosis of
LDL transform macrocytes into foam cells, which need to be cleared by immune system. At the
same time, the pro-inflammatory cytokines also amplify the monocyte recruitment. As
atherosclerosis propagates, a fibrous cap forms on top of inflammation site, isolating the system
and reducing inflammation. [2] The fibrous cap may break as the inflammation progresses to
form thrombus. The thrombus can either stay at the site or travel with blood to block arteries in
different parts of the body, leading to heart diseases, stroke, or angina. [3]
Figure 1. Propagation of Atherosclerosis. Image adapted from [4]
According to American Heart Association, heart disease is the leading cause of death in
America, which accounts for over 360,000 deaths annually and $199.6 billion cost in 2012-2013.
Stroke is the second-leading cause of death worldwide in 2013, and it causes 0.5 % of death in
the US. [5] Although the mortality of the two diseases declined, they still have a great burden on
the global health system. [3]
Computational models are currently being explored as a means of integrating predictive
modeling technology with patient data to create personalized plans for managing the
multifactorial development process of atherosclerosis in patients [6]. Because inflammation is
both central to wound healing and a key driver of chronic tissue injury, models of inflammation
propagation in atherosclerosis can provide mechanistic insights, explore treatment possibilities

3
(1)
(3)
(4)
(2)
and improved outcomes for individual patients [7]. Our purpose is to model the inflammation
process in the atherosclerosis in order to examine how the disturbance of inflammatory
parameters affect the propagation of the inflammation.
2. Methods
2.1 Parameterization:
To model the inflammation process in the atherosclerosis, a reaction-diffusion system of
equations was utilized to determine the density of monocytes and cytokines in the intima over
time[8][2]. The equations for the density of monocytes (𝑀) and cytokines 𝐴 in the intima over
time can be simplified down to three key terms: a recruitment/production term, degradation term,
and cell displacement term.
The recruitment of monocytes from the blood flow, promoted by the current
inflammatory cytokines density and amplified by the monocyte secretion of inflammatory
cytokines, continually increases until the monocyte density reaches a mechanical saturation due
to the formation of the fibrous cap. Therefore, the monocyte recruitment was defined as the
function 𝑓1(𝐴) with the following constraint:
𝑓1(𝐴) = 𝛼1 + 𝛽1𝐴
1 + 𝐴 𝜏1⁄ (
𝑅𝑒𝑐𝑟𝑢𝑖𝑡𝑚𝑒𝑛𝑡
𝑆𝑎𝑡𝑢𝑟𝑎𝑡𝑖𝑜𝑛)
𝜏1 > 𝛼1
𝛽1
where by 𝛼1 represents the recruitment of monocytes due to the presence of oxidized LDL, 𝛼1
represents the auto-amplification of monocyte recruitment due to the secretion of inflammatory
cytokines by the monocytes, and the simplified mechanical saturation is given by the term 1 +𝐴/𝜏1, with 𝜏1 representing the characteristic time of fibrous cap formation via smooth muscle
cells. The constraint on 𝜏1 ensures that 𝑓1(𝐴) remains an increasing function.
The cytokine production rate per each individual monocyte, promoted by the
inflammatory cytokines, can be represented as a ratio of secretion of inflammatory cytokines to
the inhibition of that secretion. Therefore, the cytokine production rate per monocyte was
defined as the function 𝑓2(𝐴):
𝑓2(𝐴) = 𝛼2𝐴
1 + 𝐴 𝜏2⁄ (
𝑆𝑒𝑐𝑟𝑒𝑡𝑖𝑜𝑛
𝐼𝑛ℎ𝑖𝑏𝑖𝑡𝑖𝑜𝑛)
where 𝛼2 represents the secretion of inflammatory cytokines, and the simplified inhibition of
inflammatory cytokine secretion is given by 1 + 𝐴 𝜏2⁄ , with 𝜏2 representing the characteristic
The degradation of monocytes and cytokines can be represented by the term 𝜆1𝑀 and
𝜆2𝐴 respectively, where 𝜆1is the monocyte degradation coefficient and 𝜆2is the cytokine
degradation coefficient. The displacement of monocytes and cytokines over the length of the
intima can be represented by 𝑑1∆𝑀 and 𝑑2∆𝐴, where 𝑑1 is the diffusion coefficient for
monocytes, 𝑑2 is the diffusion coefficient for cytokines. The length of the intima is represented
by the parameter L. All parameters are assumed to be non-negative in order to accurately reflect
the physiology of the system.
To determine the conditions that reflect the various states of the inflammation process, a
kinetic model based on mass action kinetics was formed using the following ordinary differential
equations: 𝑑𝑀
𝑑𝑡= 𝑓1(𝐴) − 𝜆1𝑀

4
(5)
(6)
(7)
𝑑𝐴
𝑑𝑡= 𝑓2(𝐴)𝑀 − 𝜆2𝐴
Stability analysis was then performed on the kinetic to highlight the relationship between the
variables and how they affect the state of the model (See Appendix: Stability Analysis
Calculations for step-by-step calculations). From the results of the stability analysis, the
numerical values of the parameters for each case of interest were determined.
2.2 One-dimensional model:
In order to simplify the inflammation process in the atherosclerosis into a one-
dimensional diffusion process, the assumption was made that the width of the blood vessel wall
is infinitesimally small such that the density of monocytes and cytokines across the vessel wall
can be considered constant. Therefore the monocyte recruitment function 𝑓1(𝐴) can be
considered a source term, leading to the following reaction-diffusion system of equations for
monocyte and cytokine density for the domain of x [0, L]:
𝜕𝑀
𝜕𝑡= 𝑑1
𝜕2𝑀
𝜕𝑥2+ 𝑓1(𝐴) − 𝜆1𝑀
𝜕𝐴
𝜕𝑡= 𝑑2
𝜕2𝐴
𝜕𝑥2+ 𝑓2(𝐴)𝑀 − 𝜆2𝐴
The constant density across the vessel wall also implies no flux across the vessel wall, leading to
Neumann boundary conditions for the model. Both the initial monocyte density and cytokine
density are considered uniform and represent the steady non-inflammatory state of the system.
The initial monocyte is therefore given by the ratio of monocyte recruitment to degradation (M(x,
0) = 𝛼1 / 𝜆1), while the initial cytokine density is significantly smaller (A(x, 0) = 10-3).
2.3 Two-dimensional model
To represent the inflammation process in the atherosclerosis as a two-dimensional
process, no assumption is made about the width of the blood vessel wall. Therefore, the
recruitment of monocytes from the blood flow can be described as a boundary condition for the
intima and blood flow and not as a source term, leading to the following reaction-diffusion
system of equations for monocyte and cytokine density: 𝜕𝑀𝜀
𝜕𝑡= 𝑑1∆𝑀𝜀 − 𝜆1𝑀𝜀
𝜕𝐴𝜀
𝜕𝑡= 𝑑2∆𝐴𝜀 + 𝑓2(𝐴𝜀)𝑀𝜀 − 𝜆2𝐴𝜀
The intima for the model is represented by a rectangle of length L and width , where the
boundary between the intima and the blood flow occurs on the upper side of the model.
Therefore, all boundary conditions for the model are homogenous Neumann with the exception
of the boundary condition between the blood flow and the intima, given by: 𝜕𝑀𝜀(𝑥, 𝜀)
𝜕𝑦 =
𝑓1(𝐴𝜀)
𝑑1 𝜀 𝑓𝑜𝑟 𝑥 𝜖[0, 𝐿]

5
(8)
(9)
3. Results
3.1 Stability Analysis
Figure 1: Phase planes of the three different cases of stability for the inflammatory process
found by examining the intersections of the nullclines derived from Eq. (4). (a) The phase plane
for the bistable case, where A and B are stable and C is unstable. (b) The phase plane for the
monostable case, where A is unstable and B is stable. (c) The phase plane for the case with no
inflammatory reaction, with only a single stable fixed point A.
The results of the stability analysis indicate the following critical values for existence of
B and C, and the stability of A (see Appendix: Stability Analysis Calculations).
𝐸𝑥𝑖𝑠𝑡𝑒𝑛𝑐𝑒 𝑓𝑜𝑟 𝐵 𝑎𝑛𝑑 𝐶: 𝜆2
𝛼2𝜏2 = (√
𝛽1
𝜆1−
𝛼1
𝜏1𝜆1 − √
𝜆2
𝛼2𝜏1−
𝛼1
𝜏1𝜆1 )
2
𝐸𝑞𝑢𝑖𝑙𝑖𝑏𝑟𝑖𝑢𝑚 𝑠𝑡𝑎𝑏𝑖𝑙𝑖𝑡𝑦: 𝜆2
𝛼2 =
𝛼1
𝜆1
(a)
(b) (c)

6
The existence of A is guaranteed for every parameter choice, for it is the equilibrium of a
non-inflammatory state for which the density of inflammatory cytokines is zero, leaving the
monocyte density as the ratio of monocyte recruitment to monocyte degradation. However, the
stability of A is dependent on relation seen in Eq. (9): when the cytokine degradation to
recruitment ratio is larger than the monocyte recruitment to degradation ratio, i.e. 𝜆2
𝛼2>
𝛼1
𝜆1 ,
cytokines are degraded faster than the rate at which they are recruited, preventing the auto-
amplification phenomenon that results in the chronic inflammation and therefore corresponds to
a stable, non-inflammatory state (Fig. 1a, c). However, when 𝜆2
𝛼2<
𝛼1
𝜆1, cytokine recruitment is
greater than the degradation, a small increase in cytokine density can stimulate the auto-
amplification phenomenon, thus causing A to become unstable (Fig. 1b).
Unlike A, the existence of B and C are not guaranteed for every parameter choice. For B
to exist, the condition 𝜆2
𝛼2𝜏2< (√
𝛽1
𝜆1−
𝛼1
𝜏1𝜆1 − √
𝜆2
𝛼2𝜏1−
𝛼1
𝜏1𝜆1 )
2
must be met. When this
condition is not met, there are no positive solutions that correspond to a stable inflammatory state
(Fig. 1c). However, when the condition has been met, the equilibrium point B will exist and will
always correspond to a stable inflammatory state (Fig. 1a,b). Furthermore, when the condition 𝜆2
𝛼2>
𝛼1
𝜆1 is also fulfilled, the equilibrium point C will exist and correspond to an unstable state
where a large enough perturbation can create chronic inflammation. Therefore, C corresponds to
the threshold which must be surpassed in order for the model to exists in a chronic inflammatory
state.
Based on the results of the stability analysis, the numerical values for parameters were
chosen such that the numerical solutions for both the one and two-dimensional models can
replicate the bistable case and the monostable case (Table 1).
Parameter Value
Bistable System Monostable System
𝜶𝟏 2 2
𝜶𝟐 7 2
𝝀𝟏 1 1
𝝀𝟐 26 1.95
𝒅𝟏 1-D: 1 2-D: 0.001 1-D: 1 2-D: 0.001
𝒅𝟐 1-D: 1 2-D: 0.001 1-D: 1 2-D: 0.001
𝝉𝟏 1 1
𝝉𝟐 13/2 42/43
𝜷𝟏 8 8
Table 1: Numerical values of the parameters for the 1-D and 2-D models. One set of parameters
correspond to the values necessary to represent bistable conditions for the model, while the
other set of parameters correspond to the values necessary to represent monostable conditions
for the model.
The stability can also be analyzed biologically. In Figure. 2, the plot (a) represents the
scenario of intermediate cytokine level at time zero. In this situation, the introduction of
monocytes into the intima will produce two results: a small number of monocytes will not

7
sustain the inflammatory response (Fig 2. a); a large number of monocytes triggers chronic
inflammation. This is the median risk situation, and one example of this will be the population
with elevated blood cholesterol level but has no sign of atherosclerosis. The plot (b) is the high-
risk scenario of atherosclerosis where the accumulation of LDL and cytokines is in the alarming
level. This high level of LDL will produce a large chemotactic signal, and any number of
monocytes will initiate the inflammation. The plot (c) shows the low initial cytokine
concentration in healthy population. The intima will not easily inflame because the site will not
attract enough monocyte to amplify the inflammation. The monocytes entered intima will cease
rapidly and never evolve to the chronic inflammation in plot (b).
3.2 Bistable Conditions:
3.2.1 One-dimensional model
Figure 2: Monocyte and cytokine density for the one-dimensional model under bistable
conditions. A small perturbation over x ϵ [45,55] does not surpass the threshold requirement for
chronic inflamation, and therefore no wave propgation can be seen in the (a) monocyte density
and (b) cytokine density. However, a large perturbation over x ϵ [45,55] can pass the threshold
requirement for chronic inflamation, causing wave propgation that can be seen in the (c)
monocyte density and (d) cytokine density.
(a) (b)
(c) (d)

8
The bistable condition has two fates: the small surge of monocytes will cease as in
Figure. 3 (a)(b); a large surge of monocytes leads to inflammation in Figure.3 (c)(d). There is a
delay between the peak of cytokine concentration and the monocyte concentration, indicating the
monocytes produce new cytokines in the intima. The small number of monocyte in (a) and (b)
cannot produce enough cytokines to sustain the monocyte recruitment, and the existing cytokines
degrade and return the intima to healthy state. However, the large number of monocytes in (c)
and (d) produces enough cytokines to overcome the degradation, thus producing the
inflammation.
3.2.2 Two-dimensional model
Figure 3: Monocyte and cytokine density for the two-dimensional model under bistable
conditions. For a large perturbation over x ϵ [45,55], the propogation of waves corresponding to
chronic inflammation was observed at (a) t =0, (b) t =1, (c) t =3, (d) t =5, (e) t =7, (f) t =10.
Due to the low rate of diffusion, the sustained inflammation is limited to the boundary of
arterial lumen and the intima as time to the infinity. This simulation result explains the
localization of atherosclerosis in Figure. 1: the inflamed tissue thickens and narrows the artery.
(a) (b) (c)
(d) (f) (e)

9
3.3 Monostable Conditions:
3.3.1 One-dimensional model
Figure 4: Monocyte and cytokine density for the one-dimensional model under monostabl;e
conditions. A small perturbation over x ϵ [45,55] can cause chronic inflamation, causing wave
propgation that can be seen in the (a) monocyte density and (b) cytokine density.
When there are no cytokines in the model, the one-dimensional model at monostable
conditions remained in an the unstable state that corresponds to no inflammation (Fig. 2b, Fixed
Point A)/ However, a small perturbation causes a large surge of monocytes and cytokines,
leading to the propogation of waves that represent a stable, chronic inflammatory state (Fig. 2b,
Fixed Point B). As seen in Fig. 3(c), (d), there is a delay between the peak of cytokine
concentration and the monocyte concentration due to monocyte production of new cytokines,
and the intima rapidly reaches a state of inflammation.
(a) (b)

10
3.3.2 Two-dimensional model
Figure 5: Monocyte and cytokine density for the two-dimensional model under monostable
conditions. For a small perturbation over x ϵ [45,55], the propogation of waves corresponding
to chronic inflammation was observed at (a) t =0, (b) t =1, (c) t =3, (d) t =5, (e) t =7, (f)
t=10.
The results of the two-dimensional model agree with the results observed in the one-
dimensional model. The small perturbation of the model with monostable conditions causes the
increase in monocytes, and as seen in Fig. 4, the low rate of diffusion sustaining the
inflammation is limited to the boundary of arterial lumen and the intima as time approaches
infinity. The simulation result can also explain the localization of atherosclerosis seem in Figure.
1: the inflamed tissue thickens, narrowing the artery.
4. Discussion
According to NIH National Heart, Lung, and Blood Institute, the risk factors for
atherosclerosis include smoking, obesity, unhealthy blood cholesterol levels, stress, high serum
C-reactive protein level, and family history of early heart disease [8]. The above risk factors are
related to both inflammation and abnormal lipid level in blood, and the simulation results of our
model match the risk factor. Although the current model is simple and does not cover all factors
in the progression of atherosclerosis, this model can potentially help doctors determine the risk
of having atherosclerosis quantitatively by comparing the patient’s LDL level with the stability
points.
The model indicates the development of atherosclerosis is affected by production,
diffusion, inhibition, and degradation of leukocytes and pro-inflammatory cytokines, and each of
the four terms are affected by the patient’s condition. For instance, periodontitis, the infection of
(a) (b) (c)
(d) (f) (e)

11
gum, has been linked to cardiovascular diseases. [9] Patients with periodontitis could have
activated innate immune system and raise of cytokine level, which can elevate the blood
leukocyte level and may promote atherosclerosis. If precise values of the parameters are
measured, the model can predict the time delay between a simulation (periodontitis) and the
worsen of atherosclerosis. This prediction could be a valuable reference for doctors to determine
which therapy, mild or aggressive, should be chosen for certain patients.
There are several ways in which this model can be expanded upon in the future. The
model only considers the density of monocytes and cytokines; however, LDL accumulation
triggers the monocyte recruitment and is engulfed by macrophages. Because LDL is associated
with various arterial diseases, expansion of the model to include LDL density and separate
monocyte and macrophage populations to explore their dynamics during the inflammatory
process. The model can also be refined to include the injection of anti-inflammatory therapeutics
to observe their ability to reduce chronic inflammation.
Due to lack of available data for the parameterization of the model, we decided to only
use pseudo-values for our simulation. Though utilizing pseudo-values may limit the quantitative
insight the model could provide, the pseudo-values still allow for qualitative analyses. Lack of
data also indicates possible directions of future research. For example, in order to obtain the
diffusivity of the cytokines in the extracellular space, the researcher must consider the structure
of the extracellular matrix, the interaction between cytokines and cells, and the flow of
extracellular fluid. In addition, the diffusivity could be different in different tissue or in different
diseases, and the small dimension simulated in the model makes a small uncertainty of
diffusivity value obvious in the simulation results. By pursuing the accurate measurements of the
parameters and expansion of the model, various studies simulations can be performed, and the
acquired knowledge can be applied toward understanding the inflammatory process of
atherosclerosis and other similar diseases.
5. References
[1] Elsevier.com. (2017). Robbins & Cotran Pathologic Basis of Disease - 9th Edition. [online]
Available at: https://www.elsevier.com/books/robbins-and-cotran-pathologic-basis-of-
disease/kumar/978-1-4557-2613-4 [Accessed 29 Nov. 2017].
[2] El Khatib, N., Génieys, S. and Volpert, V. (2007). Atherosclerosis Initiation Modeled as an
Inflammatory Process. Mathematical Modelling of Natural Phenomena, 2(2), pp.126-141.
[3] Herrington, W., Lacey, B., Sherliker, P., Armitage, J. and Lewington, S. (2016).
Epidemiology of Atherosclerosis and the Potential to Reduce the Global Burden of
Atherothrombotic Disease. Circulation Research, 118(4), pp.535-546.
[4] Moore, K. and Tabas, I. (2017). Macrophages in the Pathogenesis of Atherosclerosis.
[5] Heart.org. (2017). Available at: http://www.heart.org/idc/groups/ahamah-
public/@wcm/@sop/@smd/documents/downloadable/ucm_491265.pdf [Accessed 29 Nov.
2017].
[6] Díaz-Zuccarini, V., Agu, O., Di Tomaso, G. and Pichardo-Almarza, C. (2014). Towards
personalised management of atherosclerosis via computational models in vascular clinics:
technology based on patient-specific simulation approach. Healthcare Technology Letters,
1(1), pp.13-18.
[7] Ziraldo, C., Mi, Q., An, G. and Vodovotz, Y. (2013). Computational Modeling of
Inflammation and Wound Healing. Advances in Wound Care, 2(9), pp.527-537.
12
[8] El Khatib, N., Genieys, S., Kazmierczak, B. and Volpert, V. (2009). Mathematical modelling
of atherosclerosis as an inflammatory disease. Philosophical Transactions of the Royal
Society A: Mathematical, Physical and Engineering Sciences, 367(1908), pp.4877-4886.
[9] Nhlbi.nih.gov. (2017). Atherosclerosis | NHLBI, NIH. [online] Available at:
https://www.nhlbi.nih.gov/health-topics/atherosclerosis#Risk-Factors. [Accessed 13 Dec.
2017].
[10] Bartova J, Sommerova P, Lyuya-Mi Y, et al. Periodontitis as a Risk Factor of
Atherosclerosis. Journal of Immunology Research. 2014;2014:636893.
doi:10.1155/2014/636893.
6. Appendix
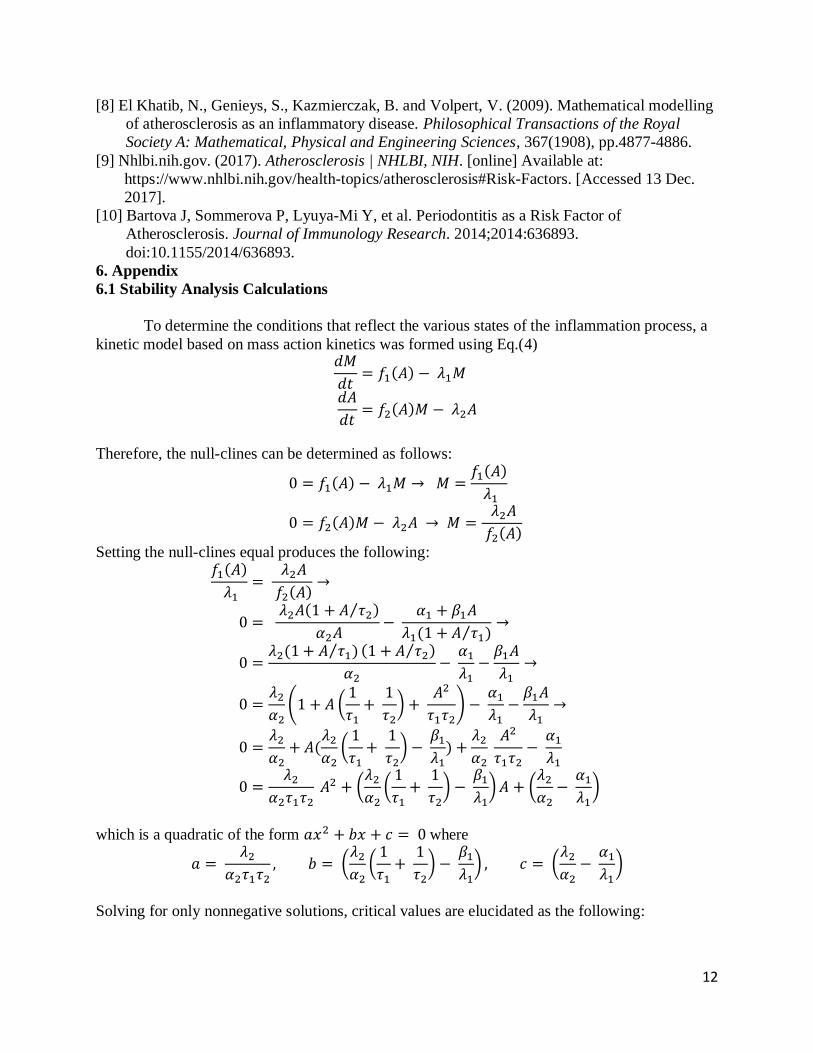
6.1 Stability Analysis Calculations
To determine the conditions that reflect the various states of the inflammation process, a
kinetic model based on mass action kinetics was formed using Eq.(4) 𝑑𝑀
𝑑𝑡= 𝑓1(𝐴) − 𝜆1𝑀
𝑑𝐴
𝑑𝑡= 𝑓2(𝐴)𝑀 − 𝜆2𝐴
Therefore, the null-clines can be determined as follows:
0 = 𝑓1(𝐴) − 𝜆1𝑀 → 𝑀 =𝑓1(𝐴)
𝜆1
0 = 𝑓2(𝐴)𝑀 − 𝜆2𝐴 → 𝑀 = 𝜆2𝐴
𝑓2(𝐴)
Setting the null-clines equal produces the following: 𝑓1(𝐴)
𝜆1=
𝜆2𝐴
𝑓2(𝐴)→
0 = 𝜆2𝐴(1 + 𝐴 𝜏2⁄ )
𝛼2𝐴−
𝛼1 + 𝛽1𝐴
𝜆1(1 + 𝐴 𝜏1)⁄→
0 =𝜆2(1 + 𝐴 𝜏1)⁄ (1 + 𝐴 𝜏2⁄ )
𝛼2−
𝛼1
𝜆1−
𝛽1𝐴
𝜆1→
0 =𝜆2
𝛼2(1 + 𝐴 (
1
𝜏1+
1
𝜏2) +
𝐴2
𝜏1𝜏2) −
𝛼1
𝜆1−
𝛽1𝐴
𝜆1→
0 =𝜆2
𝛼2+ 𝐴(
𝜆2
𝛼2(
1
𝜏1+
1
𝜏2) −
𝛽1
𝜆1) +
𝜆2
𝛼2
𝐴2
𝜏1𝜏2−
𝛼1
𝜆1
0 =𝜆2
𝛼2𝜏1𝜏2 𝐴2 + (
𝜆2
𝛼2(
1
𝜏1+
1
𝜏2) −
𝛽1
𝜆1) 𝐴 + (
𝜆2
𝛼2−
𝛼1
𝜆1)
which is a quadratic of the form 𝑎𝑥2 + 𝑏𝑥 + 𝑐 = 0 where
𝑎 = 𝜆2
𝛼2𝜏1𝜏2, 𝑏 = (
𝜆2
𝛼2(
1
𝜏1+
1
𝜏2) −
𝛽1
𝜆1) , 𝑐 = (
𝜆2
𝛼2−
𝛼1
𝜆1)
Solving for only nonnegative solutions, critical values are elucidated as the following:

13
𝐶𝑟𝑖𝑡𝑖𝑐𝑎𝑙 𝑉𝑎𝑙𝑢𝑒 𝑓𝑜𝑟 𝑒𝑥𝑖𝑠𝑡𝑒𝑛𝑐𝑒: 𝜆2
𝛼2𝜏2 = (√
𝛽1
𝜆1−
𝛼1
𝜏1𝜆1 − √
𝜆2
𝛼2𝜏1−
𝛼1
𝜏1𝜆1 )
2
𝐶𝑟𝑖𝑡𝑖𝑐𝑎𝑙 𝑉𝑎𝑙𝑢𝑒 𝑓𝑜𝑟 𝑒𝑞𝑢𝑖𝑙𝑖𝑏𝑟𝑖𝑢𝑚 𝑠𝑡𝑎𝑏𝑖𝑙𝑖𝑡𝑦 𝜆2
𝛼2 =
𝛼1
𝜆1
6.2 MATLAB Code:
6.2.1 One-dimensional model
%% Setup
global alpha_1 alpha_2 lambda_1 lambda_2 ...
d_1 d_2 f_1 f_2 A_pert M_pert M_0 A_0 ...
tau_1 tau_2 beta L
% Length of segment
L = 1;
% Diffusion (or cell displacement) constants
d_1 = 1;
d_2 = 1;
% Degredation constnats for immune cells and cytokines respecticely.
lambda_1 = 1;
lambda_2 = 1.95;
% lambda_2 = 26; % Stable
% lambda_2 = 1; % Unstable
% Recruitment of monocytes due to the presence of ox-LDL, promoted by
% endothelial adhesion molecules, chemoattractants and growth factors.
alpha_1 = 2;
% alpha_2 .* A represents the secretion of pro-inflammatory cytokines promoted
% by the pro-inflammatory cytokines themselves
alpha_2 = 1;
% alpha_2 = 7; % Stable
% alpha_2 = 1; % Unstable
% Characteristic time for the fibrous cap formation
tau_1 = 1;
% Characteristic time for inhibition of the pro-inflammatory cytokines
% secretion mediated by the anti-inflammatory cytokines to act.
tau_2 = (42./43);
% tau_2 = (13./2); % Stable
% tau_2 = (42./43); % Unstable
% Represents the auto-amplification of the recruitment of monocytes
% due to the inflammatory cytokines secreted by the monocytes themselves

14
beta = 8;
% The function f_1(A) models recruitment of the immune cells from the
% blood flow, promoted by the inflammatory cytokines
f_1 = @(A) (alpha_1 + beta .* A)./(1 + A./tau_1);
% The term f_2(A).* M models the cytokines production rate
f_2 = @(A) (alpha_2 .* A)./(1 + A./tau_2);
% Perturbation
pert = 0.25;
A_pert = 1 * (1 + pert);
M_pert = 1 * (1 + pert);
% Initial Conditions
M_0 = alpha_1 ./ lambda_1;
A_0 = 1 .* 10^-3;
%% PDE Solution 1-D
close all
tstart = 0;
xstart = 0;
xfinal = 100;
tfinal = 100;
numpoints = 201;
tmesh = linspace(tstart,tfinal,numpoints);
xmesh = linspace(xstart,xfinal,numpoints);
% Solution
sol = pdepe(0,@pdefun,@ic,@bc,xmesh,tmesh);
M_sol = sol(:,:,1);
A_sol = sol(:,:,2);
figure(1)
surf(tmesh,xmesh,M_sol','EdgeColor','none')
title('Monocyte Density')
xlabel('t')
ylabel('x')
zlabel('M(x,t)')
axis([tstart tfinal xstart xfinal 0 10])
figure(2)
surf(tmesh,xmesh,A_sol','EdgeColor','none')
title('Cytokine Density')
xlabel('t')

15
ylabel('x')
zlabel('A(x,t)')
axis([tstart tfinal xstart xfinal 0 10])
% For stability
a = linspace(0, 10, numpoints);
m = linspace(0, 10, numpoints);
dMdt = @(A, M) f_1(A) - lambda_1 .* M;
dAdt = @(A, M) f_2(A) .* M - lambda_2 .* A;
[Amesh, Mmesh] = meshgrid(a, m);
[X_null_m, Y_null_m] = getNullcline(dMdt(Amesh, Mmesh), a, m);
[X_null_a, Y_null_a] = getNullcline(dAdt(Amesh, Mmesh), a, m);
[xint, yint] = getCrossings(X_null_m, Y_null_m, X_null_a, Y_null_a);
figure(3)
hold on
plot(X_null_m, Y_null_m)
plot(X_null_a, Y_null_a)
xlabel('A')
ylabel('M')
title('Stability Phase Plane: Monostable Case')
axis([-.5 10 -.5 10])
lgnd = {'Nullcline @ dM/dt = 0', 'Nullcline @ dA/dt = 0'};
c = {'A', 'B', 'C'};
for i = 1:length(xint)
lgnd{i+2} = sprintf('Fixed Point %s @ (%.2f, %.2f)', c{i}, ...
xint(i), yint(i));
plot(xint(i), yint(i), 'x', 'MarkerSize', 10)
J = getJacobian(Amesh, Mmesh, dMdt(Amesh, Mmesh), dAdt(Amesh, Mmesh), ...
xint(i), yint(i));
fprintf('Fixed Point %s @ (%.2f, %.2f)\n', c{i}, xint(i), yint(i))
disp(eig(J))
end
legend(lgnd, 'Location', 'Best')
hold off
%%%%% PDE ASSOCIATED FUNCTIONS %%%%%
function [c,f,s] = pdefun(x,t,u,DuDx)
global d_1 d_2 lambda_1 lambda_2 f_1 f_2

16
c = [1; 1];
f = [d_1; d_2] .* DuDx;
S_1 = f_1(u(2)) - lambda_1 .* u(1);
S_2 = f_2(u(2)).*u(1) - lambda_2 .* u(2);
s = [S_1; S_2];
end
% --------------------------------------------------------------------------
% Initial Conditions
function u0 = ic(x)
global M_pert A_pert M_0 A_0
u0 = [M_0; A_0].*([M_pert;A_pert].*((x>=45) && (x<=55)) + 1);
end
% --------------------------------------------------------------------------
% Boundry Conditions
function [pl,ql,pr,qr] = bc(xl,ul,xr,ur,t)
pl = [0; 0]; ql = [1; 1];
pr = [0; 0]; qr = [1; 1];
end
6.2.2 Two-dimensional model
%% Setup
clear all
global epsilon N alpha_1 lambda_1 lambda_2 d_1 d_2 f_1 f_2 A_pert M_pert M_0 A_0
L = 1;
epsilon = 10^-3;
% Diffusion (or cell displacement) constants
d_1 = 10^-3;
d_2 = 10^-3;
% Degredation constnats for immune cells and cytokines respecticely.
lambda_1 = 1;
lambda_2 = 1.95;
% lambda_2 = 26; % Stable
% lambda_2 = 1; % Unstable
% Recruitment of monocytes due to the presence of ox-LDL, promoted by
% endothelial adhesion molecules, chemoattractants and growth factors.
alpha_1 = 2;
% alpha_2 .* A represents the secretion of pro-inflammatory cytokines promoted
% by the pro-inflammatory cytokines themselves
alpha_2 = 1;

17
% alpha_2 = 7; % Stable
% alpha_2 = 1; % Unstable
% Characteristic time for the fibrous cap formation
tau_1 = 1;
% Characteristic time for inhibition of the pro-inflammatory cytokines
% secretion mediated by the anti-inflammatory cytokines to act.
tau_2 = (42./43);
% tau_2 = (13./2); % Stable
% tau_2 = (42./43); % Unstable
% Represents the auto-amplification of the recruitment of monocytes
% due to the inflammatory cytokines secreted by the monocytes themselves
beta = 8;
% The function f_1(A) models recruitment of the immune cells from the
% blood flow, promoted by the inflammatory cytokines
f_1 = @(A) (alpha_1 + beta .* A)./(1 + A./tau_1);
% The term f_2(A).* M models the cytokines production rate
f_2 = @(A) (alpha_2 .* A)./(1 + A./tau_2);
pert = .25;
A_pert = 1 * (1 + pert);
M_pert = 1 * (1 + pert);
M_0 = alpha_1 ./ lambda_1;
A_0 =1 .* 10^-6;
%% PDE Solution 2-D
close all
tstart = 0;
tfinal = 10;
n = 100 + 1;
tmesh = linspace(tstart,tfinal,n);
N = 2;
model = createpde(N);
rectangle = [3; 4; 0; L; L; 0; 0; 0; epsilon; epsilon];
geometryFromEdges(model,decsg(rectangle));
G = [0;0];
applyBoundaryCondition(model,'neumann','edge',[1,2 4],'g', G);
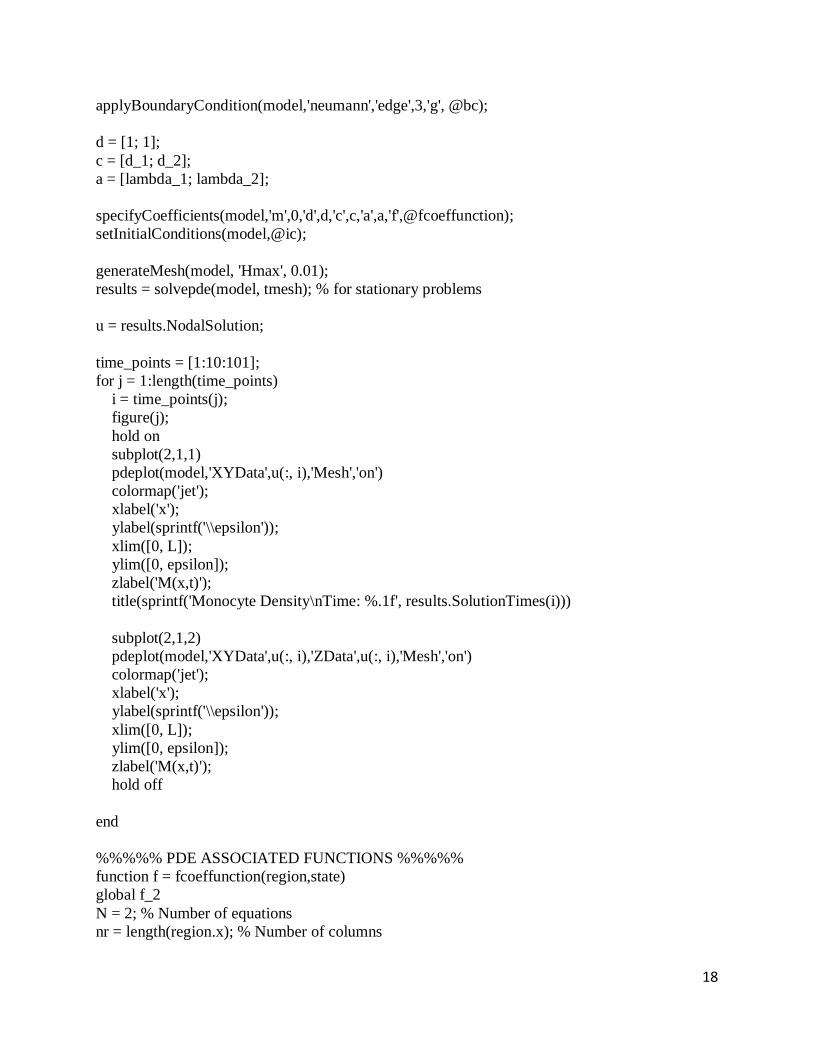
18
applyBoundaryCondition(model,'neumann','edge',3,'g', @bc);
d = [1; 1];
c = [d_1; d_2];
a = [lambda_1; lambda_2];
specifyCoefficients(model,'m',0,'d',d,'c',c,'a',a,'f',@fcoeffunction);
setInitialConditions(model,@ic);
generateMesh(model, 'Hmax', 0.01);
results = solvepde(model, tmesh); % for stationary problems
u = results.NodalSolution;
time_points = [1:10:101];
for j = 1:length(time_points)
i = time_points(j);
figure(j);
hold on
subplot(2,1,1)
pdeplot(model,'XYData',u(:, i),'Mesh','on')
colormap('jet');
xlabel('x');
ylabel(sprintf('\\epsilon'));
xlim([0, L]);
ylim([0, epsilon]);
zlabel('M(x,t)');
title(sprintf('Monocyte Density\nTime: %.1f', results.SolutionTimes(i)))
subplot(2,1,2)
pdeplot(model,'XYData',u(:, i),'ZData',u(:, i),'Mesh','on')
colormap('jet');
xlabel('x');
ylabel(sprintf('\\epsilon'));
xlim([0, L]);
ylim([0, epsilon]);
zlabel('M(x,t)');
hold off
end
%%%%% PDE ASSOCIATED FUNCTIONS %%%%%
function f = fcoeffunction(region,state)
global f_2
N = 2; % Number of equations
nr = length(region.x); % Number of columns

19
f = zeros(N,nr); % Allocate f
f(1, :) = 0;
f(2, :) = f_2(state.u(2, :)).*state.u(1, :);
end
% --------------------------------------------------------------------------
% Initial Conditions
function uinit = ic(locations)
global M_pert A_pert M_0 A_0
M = length(locations.x);
uinit = zeros(2,M);
uinit(1,:) = M_0.*(M_pert.*((locations.x>=.45) & (locations.x<=.55))+ 1);
uinit(2,:) = A_0.*(A_pert.*((locations.x>=.45) & (locations.x<=.55))+ 1);
end
% --------------------------------------------------------------------------
% Boundry Conditions
function bcMatrix = bc(region,state)
global d_1 f_1 epsilon
bcMatrix = [epsilon.*f_1(state.u(2, :))./d_1; 0];
end
6.2.3 Obtained from BENG 260:
function [X,Y] = getNullcline(d,x,y)
%[X,Y] = getNullcline(d,x,y)
%
% getNullcline takes a matrix, the x and y scales, and returns the x and y
% values of the null-cline.
%
% Simplification of getContours to do only the null-cline
%
%Parameters:
% d : A matrix approximating a two-dimensional function.
% x : The x-values for the columns of f.
% y : The y-values for the rows of f.
% [X,Y] : The x and y values of the null-cline.
cn = contourc(x, y, d, [0 0]);
len = cn(2, 1);
X = cn(1, 2:1+len);
Y = cn(2, 2:1+len);
function c = getContours(d,x,y,V)
% c = getContours(f,x,y,V)
%
% getContours takes a function and a set of contour values, and returns the
% x and y values of that contour.
%

20
% Parameters:
% f : A matrix approximating a two-dimensional function.
% x : The x-values for the columns of f.
% y : The y-values for the rows of f.
% V : A vector of desired contour values.
% c : If length(V) = 1, c(1,:) and c(2,:) are the x and y values of
% the contour. Otherwise, c is a cell, and c{i}(1,:) and
% c{i}(2,:) are the x and y values of the ith contour.
Vflag = 0;
if(length(V) == 1)
V = [V V];
Vflag = 1;
end
cn = contourc(x,y,d,V);
lencn = size(cn,2);
lenV = length(V);
c = cell(1,max([2 lenV]));
done = 0;
next = 1;
indcn = 1;
nextorder = 0;
lastheight = nan;
while(~done)
len = cn(2,indcn);
height = cn(1,indcn);
poly = cn(:,indcn+1:indcn+len);
if(height ~= lastheight)
nextorder = nextorder + 1;
lastheight = height;
end
c{next} = poly;
next = next + 1;
indcn = indcn + len + 1;
if(indcn >= lencn)
done = 1;
end
end
if(Vflag)
c = c{1};
end
function J = getJacobian(x,y,f,g,x0,y0)
% J = getJacobian(x,y,f,g,x0,y0)
%

21
% getJacobian takes a grid of derivative values and a point in phase space,
% and returns the Jacobian around that point.
%
%Parameters:
% x : The x-values of f and g.
% y : The y-values of f and g.
% f : A matrix approximating the derivative wrt x.
% g : A matrix approximating the derivative wrt y.
% x0 : The x-value for the point.
% y0 : The y-value for the point.
%
%Jacobian output:
% J(1,1) : Derivative of f wrt x evaluated at x0, y0.
% J(1,2) : Derivative of f wrt y evaluated at x0, y0.
% J(2,1) : Derivative of g wrt x evaluated at x0, y0.
% J(2,2) : Derivative of g wrt y evaluated at x0, y0.
dx = gradient(x);
[temp dy] = gradient(y);
[dfx dfy] = gradient(f);
[dgx dgy] = gradient(g);
x = flatten(x);
y = flatten(y);
dx0 = griddata(x,y,flatten(dx),x0,y0);
dy0 = griddata(x,y,flatten(dy),x0,y0);
dfdx0 = griddata(x,y,flatten(dfx),x0,y0);
dfdy0 = griddata(x,y,flatten(dfy),x0,y0);
dgdx0 = griddata(x,y,flatten(dgx),x0,y0);
dgdy0 = griddata(x,y,flatten(dgy),x0,y0);
dx0;
dy0;
dfdx0;
dfdy0;
dgdx0;
dgdy0;
J = [dfdx0/dx0 dfdy0/dy0; dgdx0/dx0 dgdy0/dy0];
end
%%%%%%%%%%%%%%%%%%%%%%%%%%%%%%%%%%%%%%%%%%%%%%
%%%%%%%%%%%%%%%%%%%%%%%%%%%%%
%%%%%%%%%%%%%%%%%%%%%%%%%%%%%%%%%%%%%%%%%%%%%%
%%%%%%%%%%%%%%%%%%%%%%%%%%%%%

22
function x = flatten(x)
%y = flatten(x)
%
%flatten compresses all data to one dimension
x = squeeze(x(1:numel(x)));
end
%%%%%%%%%%%%%%%%%%%%%%%%%%%%%%%%%%%%%%%%%%%%%%
%%%%%%%%%%%%%%%%%%%%%%%%%%%%%
%%%%%%%%%%%%%%%%%%%%%%%%%%%%%%%%%%%%%%%%%%%%%%
%%%%%%%%%%%%%%%%%%%%%%%%%%%%%
function [xi, fxi] = getCrossings(x1,fx1,x2,fx2)
% pos = getCrossings(x1,fx1,x2,fx2)
%
% getCrossings approximates the places where two functions cross. pos(1,:)
% and pos(2,:) are the x and y coordinates of those crossing points.
[xi fxi] = intersections(x1,fx1,x2,fx2);
end
%%%%%%%%%%%%%%%%%%%%%%%%%%%%%%%%%%%%%%%%%%%%%%
%%%%%%%%%%%%%%%%%%%%%%%%%%%%%
%%%%%%%%%%%%%%%%%%%%%%%%%%%%%%%%%%%%%%%%%%%%%%
%%%%%%%%%%%%%%%%%%%%%%%%%%%%%
function [x0,y0] = intersections(x1,y1,x2,y2)
%INTERSECTIONS Intersections of curves.
% Computes the (x,y) locations where two curves intersect. The curves
% can be broken with NaNs or have vertical segments.
%
% Example:
% [X0,Y0] = intersections(X1,Y1,X2,Y2,ROBUST);
%
% where X1 and Y1 are equal-length vectors of at least two points and
% represent curve 1. Similarly, X2 and Y2 represent curve 2.
% X0 and Y0 are column vectors containing the points at which the two
% curves intersect.
%
% ROBUST (optional) set to 1 or true means to use a slight variation of the
% algorithm that might return duplicates of some intersection points, and
% then remove those duplicates. The default is true, but since the
% algorithm is slightly slower you can set it to false if you know that
% your curves don't intersect at any segment boundaries. Also, the robust
% version properly handles parallel and overlapping segments.
%

23
% The algorithm can return two additional vectors that indicate which
% segment pairs contain intersections and where they are:
%
% [X0,Y0,I,J] = intersections(X1,Y1,X2,Y2,ROBUST);
%
% For each element of the vector I, I(k) = (segment number of (X1,Y1)) +
% (how far along this segment the intersection is). For example, if I(k) =
% 45.25 then the intersection lies a quarter of the way between the line
% segment connecting (X1(45),Y1(45)) and (X1(46),Y1(46)). Similarly for
% the vector J and the segments in (X2,Y2).
%
% You can also get intersections of a curve with itself. Simply pass in
% only one curve, i.e.,
%
% [X0,Y0] = intersections(X1,Y1,ROBUST);
%
% where, as before, ROBUST is optional.
% Version: 1.10, 25 February 2008
% Author: Douglas M. Schwarz
% Email: dmschwarz=ieee*org, dmschwarz=urgrad*rochester*edu
% Real_email = regexprep(Email,{'=','*'},{'@','.'})
% Theory of operation:
%
% Given two line segments, L1 and L2,
%
% L1 endpoints: (x1(1),y1(1)) and (x1(2),y1(2))
% L2 endpoints: (x2(1),y2(1)) and (x2(2),y2(2))
%
% we can write four equations with four unknowns and then solve them. The
% four unknowns are t1, t2, x0 and y0, where (x0,y0) is the intersection of
% L1 and L2, t1 is the distance from the starting point of L1 to the
% intersection relative to the length of L1 and t2 is the distance from the
% starting point of L2 to the intersection relative to the length of L2.
%
% So, the four equations are
%
% (x1(2) - x1(1))*t1 = x0 - x1(1)
% (x2(2) - x2(1))*t2 = x0 - x2(1)
% (y1(2) - y1(1))*t1 = y0 - y1(1)
% (y2(2) - y2(1))*t2 = y0 - y2(1)
%
% Rearranging and writing in matrix form,
%

24
% [x1(2)-x1(1) 0 -1 0; [t1; [-x1(1);
% 0 x2(2)-x2(1) -1 0; * t2; = -x2(1);
% y1(2)-y1(1) 0 0 -1; x0; -y1(1);
% 0 y2(2)-y2(1) 0 -1] y0] -y2(1)]
%
% Let's call that A*T = B. We can solve for T with T = A\B.
%
% Once we have our solution we just have to look at t1 and t2 to determine
% whether L1 and L2 intersect. If 0 <= t1 < 1 and 0 <= t2 < 1 then the two
% line segments cross and we can include (x0,y0) in the output.
%
% In principle, we have to perform this computation on every pair of line
% segments in the input data. This can be quite a large number of pairs so
% we will reduce it by doing a simple preliminary check to eliminate line
% segment pairs that could not possibly cross. The check is to look at the
% smallest enclosing rectangles (with sides parallel to the axes) for each
% line segment pair and see if they overlap. If they do then we have to
% compute t1 and t2 (via the A\B computation) to see if the line segments
% cross, but if they don't then the line segments cannot cross. In a
% typical application, this technique will eliminate most of the potential
% line segment pairs.
% x1 and y1 must be vectors with same number of points (at least 2).
if sum(size(x1) > 1) ~= 1 || sum(size(y1) > 1) ~= 1 || length(x1) ~= length(y1)
error('X1 and Y1 must be equal-length vectors of at least 2 points.')
end
% x2 and y2 must be vectors with same number of points (at least 2).
if sum(size(x2) > 1) ~= 1 || sum(size(y2) > 1) ~= 1 || length(x2) ~= length(y2)
error('X2 and Y2 must be equal-length vectors of at least 2 points.')
end
% Force all inputs to be column vectors.
x1 = x1(:);
y1 = y1(:);
x2 = x2(:);
y2 = y2(:);
% Compute number of line segments in each curve and some differences we'll
% need later.
n1 = length(x1) - 1;
n2 = length(x2) - 1;
xy1 = [x1 y1];
xy2 = [x2 y2];
dxy1 = diff(xy1);
dxy2 = diff(xy2);

25
% Determine the combinations of i and j where the rectangle enclosing the
% i'th line segment of curve 1 overlaps with the rectangle enclosing the
% j'th line segment of curve 2.
[i,j] = find(repmat(min(x1(1:end-1),x1(2:end)),1,n2) <= ...
repmat(max(x2(1:end-1),x2(2:end)).',n1,1) & ...
repmat(max(x1(1:end-1),x1(2:end)),1,n2) >= ...
repmat(min(x2(1:end-1),x2(2:end)).',n1,1) & ...
repmat(min(y1(1:end-1),y1(2:end)),1,n2) <= ...
repmat(max(y2(1:end-1),y2(2:end)).',n1,1) & ...
repmat(max(y1(1:end-1),y1(2:end)),1,n2) >= ...
repmat(min(y2(1:end-1),y2(2:end)).',n1,1));
% Find segments pairs which have at least one vertex = NaN and remove them.
% This line is a fast way of finding such segment pairs. We take
% advantage of the fact that NaNs propagate through calculations, in
% particular subtraction (in the calculation of dxy1 and dxy2, which we
% need anyway) and addition.
remove = isnan(sum(dxy1(i,:) + dxy2(j,:),2));
i(remove) = [];
j(remove) = [];
% Initialize matrices. We'll put the T's and B's in matrices and use them
% one column at a time. AA is a 3-D extension of A where we'll use one
% plane at a time.
n = length(i);
T = zeros(4,n);
AA = zeros(4,4,n);
AA([1 2],3,:) = -1;
AA([3 4],4,:) = -1;
AA([1 3],1,:) = dxy1(i,:).';
AA([2 4],2,:) = dxy2(j,:).';
B = -[x1(i) x2(j) y1(i) y2(j)].';
% Loop through possibilities. Trap singularity warning and then use
% lastwarn to see if that plane of AA is near singular. Process any such
% segment pairs to determine if they are colinear (overlap) or merely
% parallel. That test consists of checking to see if one of the endpoints
% of the curve 2 segment lies on the curve 1 segment. This is done by
% checking the cross product
%
% (x1(2),y1(2)) - (x1(1),y1(1)) x (x2(2),y2(2)) - (x1(1),y1(1)).
%
% If this is close to zero then the segments overlap.
for k = 1:n
[L,U] = lu(AA(:,:,k));
T(:,k) = U\(L\B(:,k));

26
end
% Find where t1 and t2 are between 0 and 1 and return the corresponding
% x0 and y0 values.
in_range = T(1,:) >= 0 & T(2,:) >= 0 & T(1,:) < 1 & T(2,:) < 1;
x0 = T(3,in_range).';
y0 = T(4,in_range).';
end