Embed Size (px)
Citation preview
Engineering Journal of the University of Qatar, Vol. 17, 2004, pp.11-28
11
MODELING APPROACH FOR PREDICTING PVT DATA
Eissa M. El-M Shokir*, Hussam M. Goda**, Khaled A. Fattah*, and Mohamed H. Sayyouh***
* Petroleum Engineering Dept., King Saud University ** Petroleum Engineering Dept., Curtin University of Technology, Australia
*** Petroleum Engineering Dept., Cairo University
ABSTRACT Neural networks are tested successfully in so many fields as pattern recognition or intelligent classifier,
prediction, and correlation development. Recently, artificial neural network has gained popularity in petroleum applications. In this paper, two directly connected neural networks are designed, using Matlab5.3, for PVT parameters determinations. The first neural network predicts the bubble point pressure values using the four following variables: reservoir temperature, APIo, relative gas density, and solution gas oil ratio. These estimated values directly used with the same four input variables in the second network to determine oil Formation Volume Factor (FVF). A comparison study between the designed Neural Network Model and other published correlations displayed excellent performance, smallest average absolute relative error, and highest correlation coefficient for the designed Networks among all other correlations.
Keywords: Modeling, Bubble Point Pressure, Formation Volume Factor, PVT, and Neural Network
I. INTRODUCTION
PVT properties are always determined experimentally based on actual samples collected from either well bore or at the surface. Such samples may be very expensive to obtain. Hence, in case of the absence of the experimental measurements of PVT properties, it is necessary to use the empirically derived correlation to predict the PVT data [1].
Many correlations already exist in the oil and gas industry such as: Standing, Glaso, Beggs and Vasquez correlations, etc. Many investigators recognize that the neural network can serve the petroleum industry to create a more accurate predicated PVT correlation. Therefore, there are a number of papers in this area.
R. B. Gharbi, and A. M. El- Sharkawy [2, 3], in 1997, published two papers in this field. The first paper use the neural system to estimate the PVT data for Middle East crude oil reservoirs, while the second paper was oriented to developing a universal neural network for predicting PVT properties for any oil reservoir [3].
In the first paper [2], two networks are trained separately to estimate the bubble point pressure and oil formation volume factor respectively. The input data were solution gas-oil ratio, reservoir temperature, oil gravity, and gas relative density. They used two hidden layers in each network. The bubble point pressure network had eight neurons in the first hidden layer, and four neurons in the second one. The formation volume factor network had six neurons in each hidden layer. The two networks were trained using around 498 data sets and tested with other 22 data sets, whereas all the data points are collected from Middle East area. In addition, the authors compare the response of the neural system with a three empirical correlations, namely: Al-Mahroun, Standing, and Glaso correlations. The comparison displayed the powerful of the neural network over the conventional correlations in the prediction of PVT properties.
The same approach is also studied in the second paper [3], but on a large scale of data set covering additional area such as: North and South America, North Sea, South East Asia, with the Middle East region. They developed a three layers network, trained with 5200 data sets representing around 350 different crude oil systems. The neural system tested with other 234 data sets. The average error was lower than that of conventional correlation for bubble point pressure with higher correlation coefficient. In addition, a lower average error, and highest correlation coefficient are obtained in the prediction of the formation volume factor with respect to the traditional correlations.
Recently, in 2001, Osman, et al. [1] used the technique of artificial neural network in the field of PVT in order to estimate the formation volume factor at the bubble point pressure. Their model was developed using 803 published
Eissa M. Shokir et al. / Modeling Approach for Predicting PVT Data
12
data gathered from Malaysia, Middle East, Gulf of Mexico, and Colombia. They designed a three layers network; input layer has four neurons covering the input data of gas-oil ratio, API gravity, relative gas density, and reservoir temperature; one hidden layer with five neurons and a single neuron for the formation volume factor in the output layer. This model results with a higher accuracy than the empirical correlations.
II. NEURAL NETWORK SYSTEM
The Theory that inspires neural network systems is drawn from many disciplines: primarily from neuroscience; engineering, and computer science; but also from psychology, mathematics, and physics. These sciences are working toward the common goal of building intelligent system [4, 5].
Artificial neural network is that technology initially grew from the full understanding of some ideas and aspects about how biological systems work, especially the human brain. Neural systems are typically organized in layers. Layers are made up of a number of interconnected nodes (artificial neurons), which contain activation functions. Patterns are presented to the network via the input layer, which communicates to one or more hidden layers where the actual processing is done through a system of fully or partially weighted connections. The hidden layers then linked to the output layer. Neural network contains some sort of learning rule that modifies the weights of the connections according to the input patterns [6, 7].
Neural networks have the capacity to learn, memorize and create relationships between the input and output variables. There are many different types of Neural Network. The most widely used network is known as the Back Propagation Neural Network (which is in use in this paper). This type of neural network is excellent at prediction and classification tasks [8, 9]. In his network, both input data and corresponding desired output data are given to the network (data of training phase). As the network starts to training, the input layer receives the input signals, then processing the data through the hidden layers until reaching the output layer, and yielding the resulted outputs. These outputs are then compared with the desired outputs and computing the error, which is back propagated through the system to adjust the weights, which control the network. Once a neural network is trained to a satisfactory level, it may be then used as an analytical tool on other hidden data. To do this, the user no longer specifies any training runs and instead allows the network to only work in forward propagation mode. Inputs are presented to the network through input layer and processed by the middle layers as the training was taking place, however, at this point, the output is retained, and no back propagation occurs [4, 9].
The same type of neural network could be named in many ways. Neural networks are described as connectionist system, because of the connections between the individual processing nodes. They are also called parallel-distributed processing system, which emphasize the way in which the many nodes or neurons in a network operate in parallel. Sometimes they are referred as adaptive system, because the values of these connections can change so that the network is performing more effectively and efficiently [7, 9].
III. NEURAL NETWORK MODEL
The designed model was able to estimate the bubble point pressure, and oil formation volume factor through two linked neural networks. The first network architecture was selected as a four-layer network. The input layer receives the following parameters: reservoir temperature, API gravity, gas relative density, and solution gas oil ratio. Two hidden layers each one has ten neurons activated by the log sigmoid transfer function [4]. Log sigmoid transfer functions calculate a layer's output from its net input. Log sig (N) takes one input, N
S variable numbers x Q observation numbers matrix of net input (column) vectors and returns each element of N squashed between 0 and
1.
log sig (N) = 1 / (1 + exp (-N))
a = log sig (N), while the output layer has one neuron with pure linear transfer function (purelin (N) = N & a = purelin (N)). The output of this network is the bubble point pressure. The network is trained with a 160 data set and tested with other 20 data sets collected from the Middle East oil systems.
Engineering Journal of the University of Qatar, Vol. 17, 2004, pp.11-28
13
The second network has four layers and its target is to predict the oil formation volume factor. The input layer has
five neurons for five inputs which are: reservoir temperature; gas oil ratio; API gravity; gas relative density, and the estimated bubble point pressure from the first network.
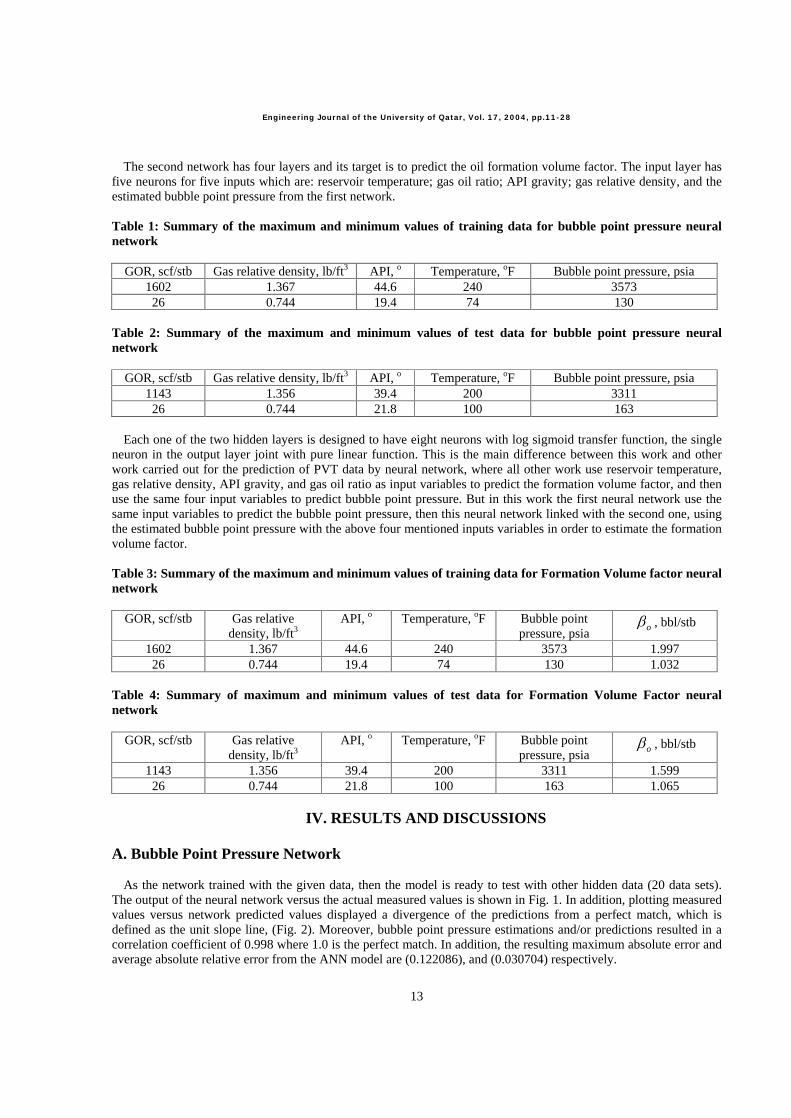
Table 1: Summary of the maximum and minimum values of training data for bubble point pressure neural network
GOR, scf/stb Gas relative density, lb/ft3 API, o Temperature, oF Bubble point pressure, psia 1602 1.367 44.6 240 3573
26 0.744 19.4 74 130
Table 2: Summary of the maximum and minimum values of test data for bubble point pressure neural network
GOR, scf/stb Gas relative density, lb/ft3 API, o Temperature, oF Bubble point pressure, psia 1143 1.356 39.4 200 3311
26 0.744 21.8 100 163
Each one of the two hidden layers is designed to have eight neurons with log sigmoid transfer function, the single neuron in the output layer joint with pure linear function. This is the main difference between this work and other work carried out for the prediction of PVT data by neural network, where all other work use reservoir temperature, gas relative density, API gravity, and gas oil ratio as input variables to predict the formation volume factor, and then use the same four input variables to predict bubble point pressure. But in this work the first neural network use the same input variables to predict the bubble point pressure, then this neural network linked with the second one, using the estimated bubble point pressure with the above four mentioned inputs variables in order to estimate the formation volume factor.
Table 3: Summary of the maximum and minimum values of training data for Formation Volume factor neural network
GOR, scf/stb Gas relative density, lb/ft3
API, o Temperature, oF Bubble point pressure, psia
o , bbl/stb
1602 1.367 44.6 240 3573 1.997 26 0.744 19.4 74 130 1.032
Table 4: Summary of maximum and minimum values of test data for Formation Volume Factor neural network
GOR, scf/stb Gas relative density, lb/ft3
API, o Temperature, oF Bubble point pressure, psia
o , bbl/stb
1143 1.356 39.4 200 3311 1.599 26 0.744 21.8 100 163 1.065
IV. RESULTS AND DISCUSSIONS
A. Bubble Point Pressure Network
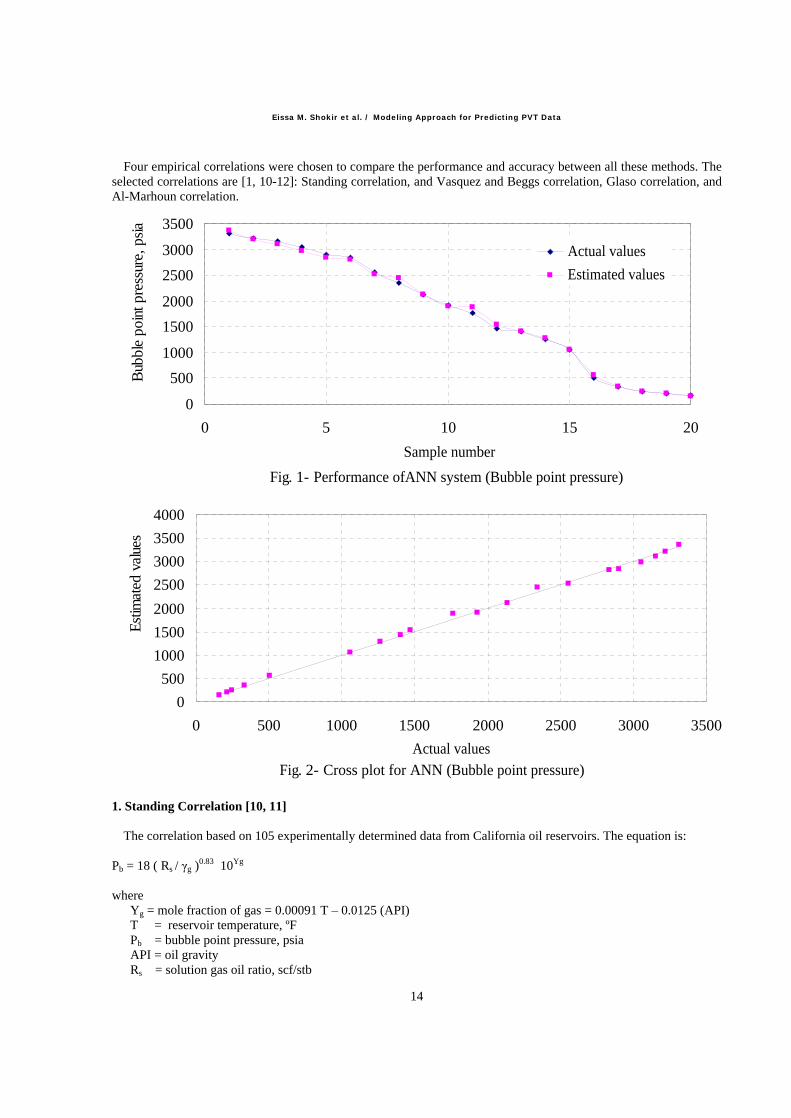
As the network trained with the given data, then the model is ready to test with other hidden data (20 data sets). The output of the neural network versus the actual measured values is shown in Fig. 1. In addition, plotting measured values versus network predicted values displayed a divergence of the predictions from a perfect match, which is defined as the unit slope line, (Fig. 2). Moreover, bubble point pressure estimations and/or predictions resulted in a correlation coefficient of 0.998 where 1.0 is the perfect match. In addition, the resulting maximum absolute error and average absolute relative error from the ANN model are (0.122086), and (0.030704) respectively.
Eissa M. Shokir et al. / Modeling Approach for Predicting PVT Data
14
Four empirical correlations were chosen to compare the performance and accuracy between all these methods. The
selected correlations are [1, 10-12]: Standing correlation, and Vasquez and Beggs correlation, Glaso correlation, and Al-Marhoun correlation.
1. Standing Correlation [10, 11]
The correlation based on 105 experimentally determined data from California oil reservoirs. The equation is:
Pb = 18 ( Rs / g )0.83 10Yg
where Yg = mole fraction of gas = 0.00091 T
0.0125 (API) T = reservoir temperature, ºF Pb = bubble point pressure, psia API = oil gravity Rs = solution gas oil ratio, scf/stb
Fig. 1- Performance ofANN system (Bubble point pressure)
0
500
1000
1500
2000
2500
3000
3500
0 5 10 15 20
Sample number
Bub
ble
poin
t pre
ssur
e, p
sia
Actual values
Estimated values
Fig. 2- Cross plot for ANN (Bubble point pressure)
0
500
1000
1500
2000
2500
3000
3500
4000
0 500 1000 1500 2000 2500 3000 3500
Actual values
Est
imat
ed v
alue
s
Engineering Journal of the University of Qatar, Vol. 17, 2004, pp.11-28
15
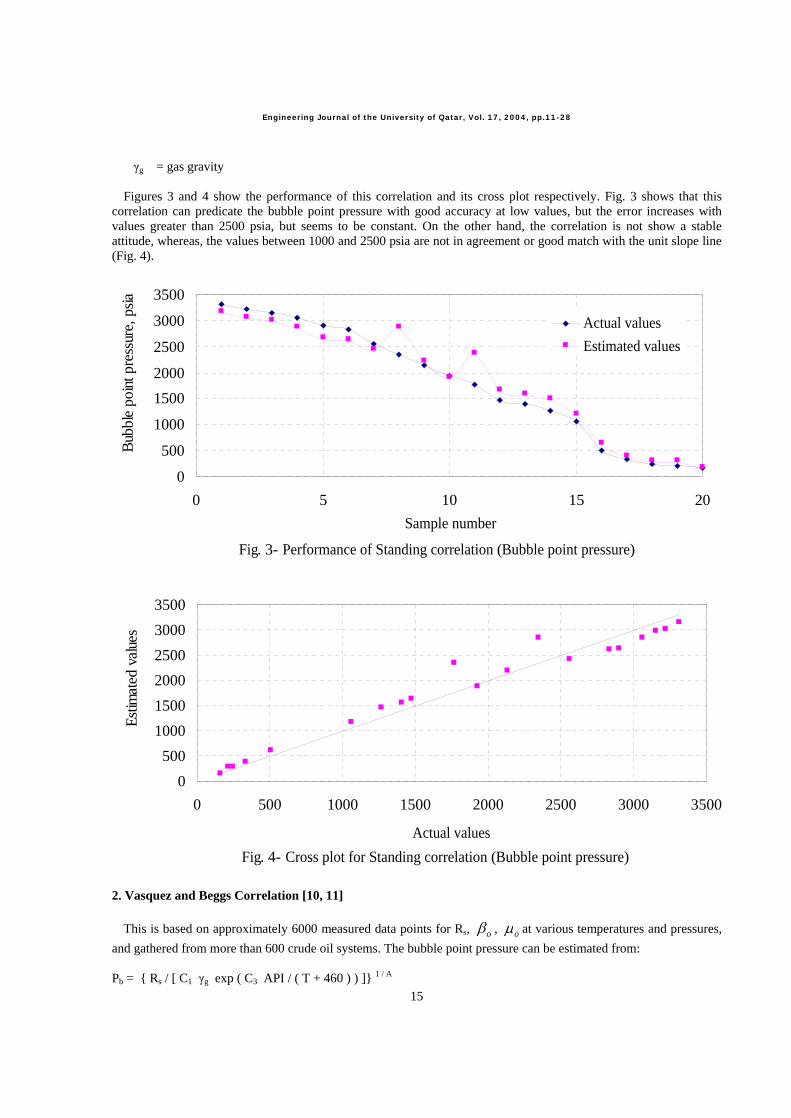
g = gas gravity
Figures 3 and 4 show the performance of this correlation and its cross plot respectively. Fig. 3 shows that this correlation can predicate the bubble point pressure with good accuracy at low values, but the error increases with values greater than 2500 psia, but seems to be constant. On the other hand, the correlation is not show a stable attitude, whereas, the values between 1000 and 2500 psia are not in agreement or good match with the unit slope line (Fig. 4).
2. Vasquez and Beggs Correlation [10, 11]
This is based on approximately 6000 measured data points for Rs, o , o at various temperatures and pressures,
and gathered from more than 600 crude oil systems. The bubble point pressure can be estimated from:
Pb = { Rs / [ C1 g exp ( C3 API / ( T + 460 ) ) ]} 1 / A
Fig. 4- Cross plot for Standing correlation (Bubble point pressure)
0
500
1000
1500
2000
2500
3000
3500
0 500 1000 1500 2000 2500 3000 3500
Actual values
Est
imat
ed v
alue
s
Fig. 3- Performance of Standing correlation (Bubble point pressure)
0
500
1000
1500
2000
2500
3000
3500
0 5 10 15 20
Sample number
Bub
ble
poin
t pre
ssur
e, p
sia
Actual values
Estimated values
Eissa M. Shokir et al. / Modeling Approach for Predicting PVT Data
16
Values of constants depend on the oil API gravity:
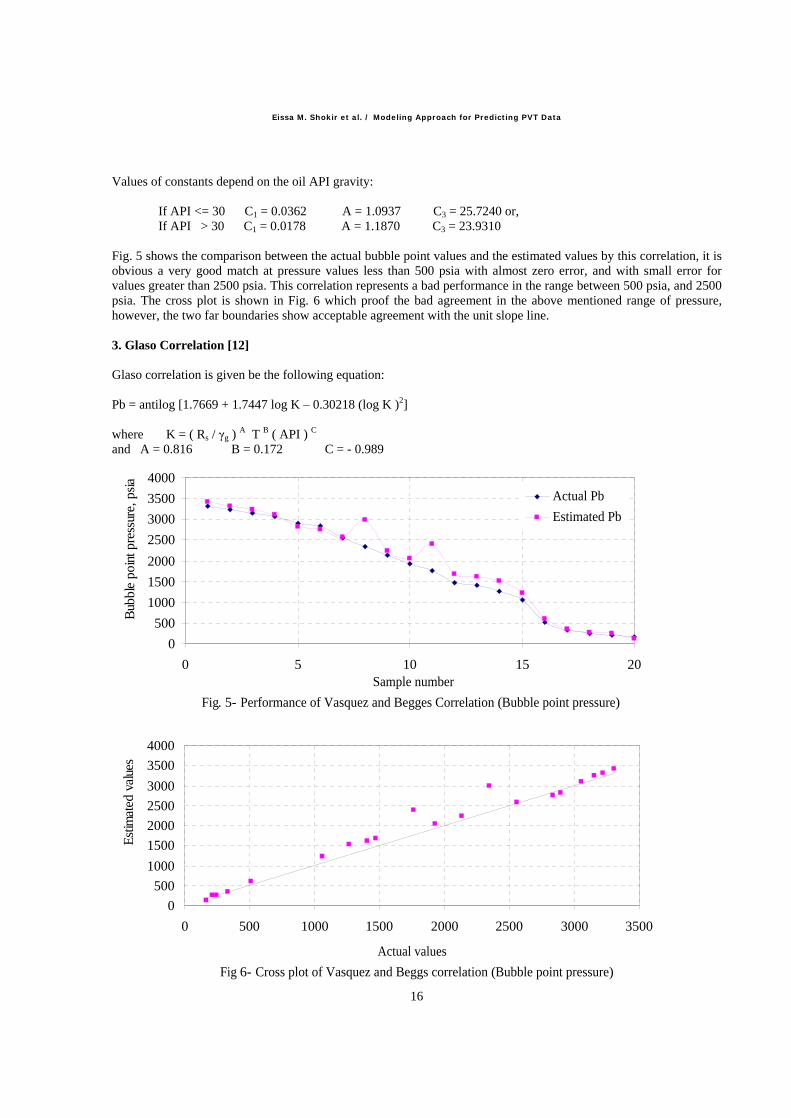
If API <= 30 C1 = 0.0362 A = 1.0937 C3 = 25.7240 or, If API > 30 C1 = 0.0178 A = 1.1870 C3 = 23.9310
Fig. 5 shows the comparison between the actual bubble point values and the estimated values by this correlation, it is obvious a very good match at pressure values less than 500 psia with almost zero error, and with small error for values greater than 2500 psia. This correlation represents a bad performance in the range between 500 psia, and 2500 psia. The cross plot is shown in Fig. 6 which proof the bad agreement in the above mentioned range of pressure, however, the two far boundaries show acceptable agreement with the unit slope line.
3. Glaso Correlation [12]
Glaso correlation is given be the following equation:
Pb = antilog [1.7669 + 1.7447 log K 0.30218 (log K )2]
where K = ( Rs / g ) A T B ( API ) C
and A = 0.816 B = 0.172 C = - 0.989
Fig. 5- Performance of Vasquez and Begges Correlation (Bubble point pressure)
0
500
1000
1500
2000
2500
3000
3500
4000
0 5 10 15 20Sample number
Bub
ble
poin
t pre
ssur
e, p
sia
Actual Pb
Estimated Pb
Fig 6- Cross plot of Vasquez and Beggs correlation (Bubble point pressure)
0
500
1000
1500
2000
2500
3000
3500
4000
0 500 1000 1500 2000 2500 3000 3500
Actual values
Est
imat
ed v
alue
s
Engineering Journal of the University of Qatar, Vol. 17, 2004, pp.11-28
17
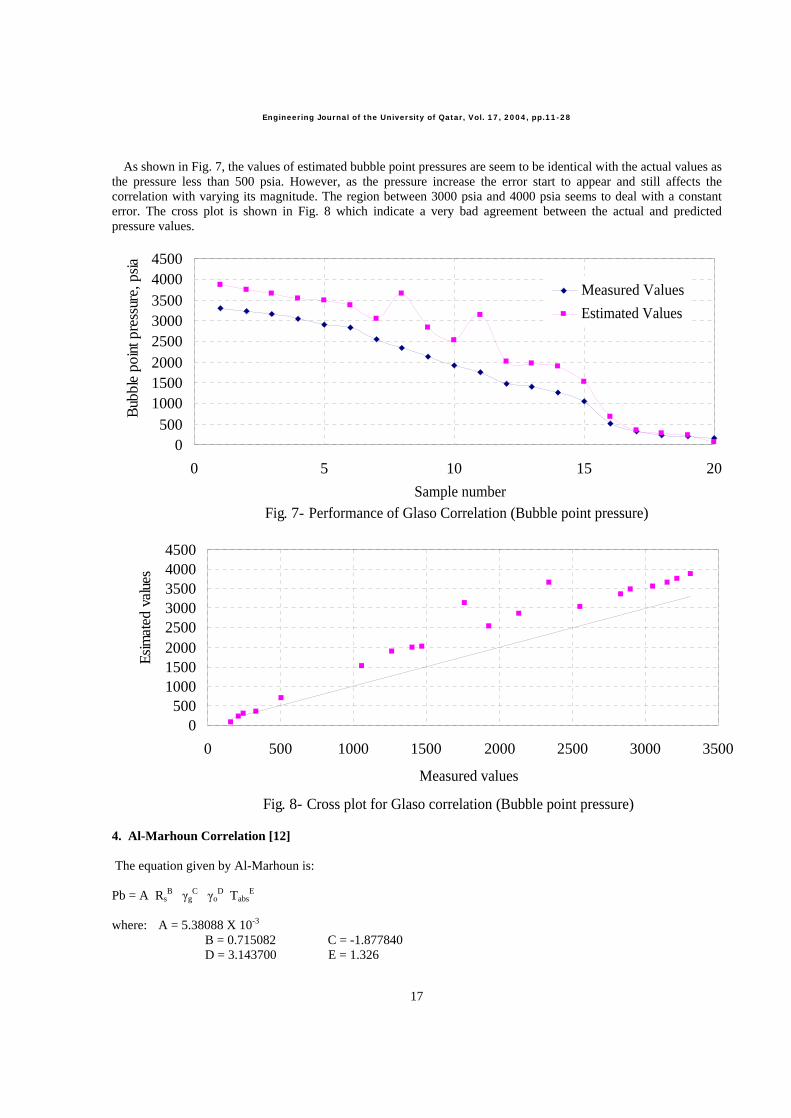
As shown in Fig. 7, the values of estimated bubble point pressures are seem to be identical with the actual values as
the pressure less than 500 psia. However, as the pressure increase the error start to appear and still affects the correlation with varying its magnitude. The region between 3000 psia and 4000 psia seems to deal with a constant error. The cross plot is shown in Fig. 8 which indicate a very bad agreement between the actual and predicted pressure values.
4. Al-Marhoun Correlation [12]
The equation given by Al-Marhoun is:
Pb = A RsB g
C oD Tabs
E
where: A = 5.38088 X 10⁻³ B = 0.715082 C = -1.877840 D = 3.143700 E = 1.326
Fig. 7- Performance of Glaso Correlation (Bubble point pressure)
0500
10001500200025003000350040004500
0 5 10 15 20
Sample number
Bub
ble
poin
t pre
ssur
e, p
sia
Measured Values
Estimated Values
Fig. 8- Cross plot for Glaso correlation (Bubble point pressure)
0500
10001500200025003000350040004500
0 500 1000 1500 2000 2500 3000 3500
Measured values
Esi
mat
ed v
alue
s
Eissa M. Shokir et al. / Modeling Approach for Predicting PVT Data
18
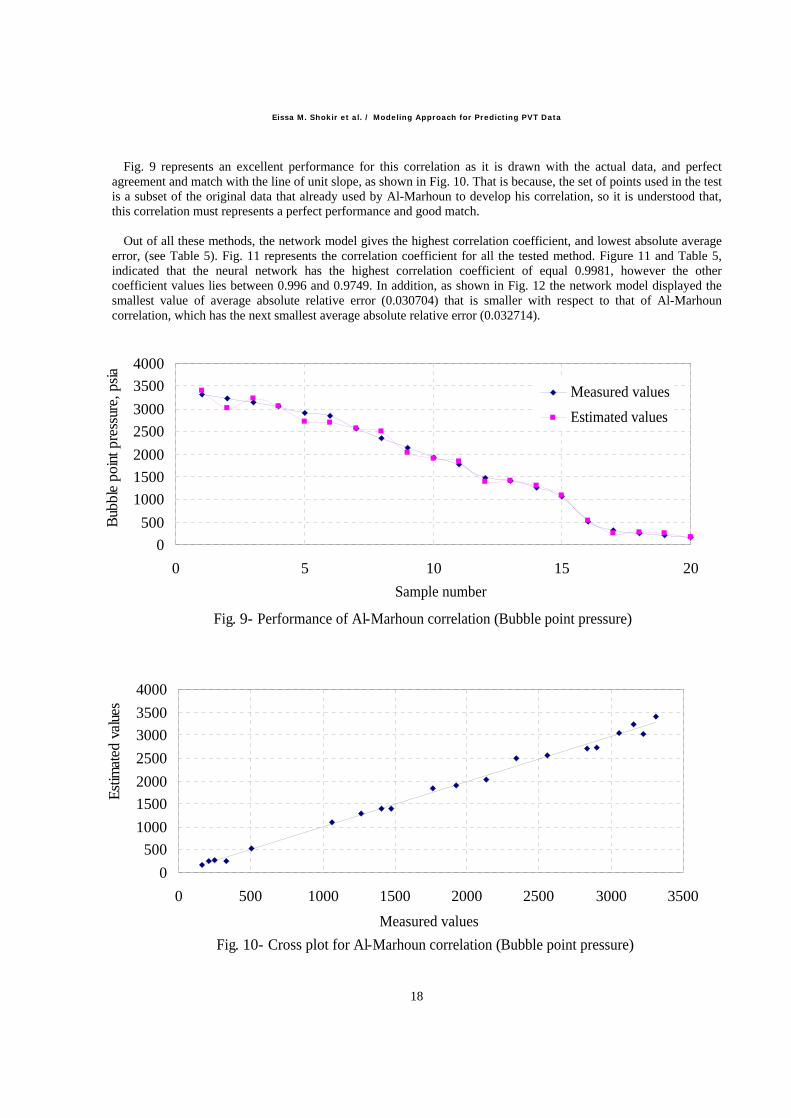
Fig. 9 represents an excellent performance for this correlation as it is drawn with the actual data, and perfect
agreement and match with the line of unit slope, as shown in Fig. 10. That is because, the set of points used in the test is a subset of the original data that already used by Al-Marhoun to develop his correlation, so it is understood that, this correlation must represents a perfect performance and good match.
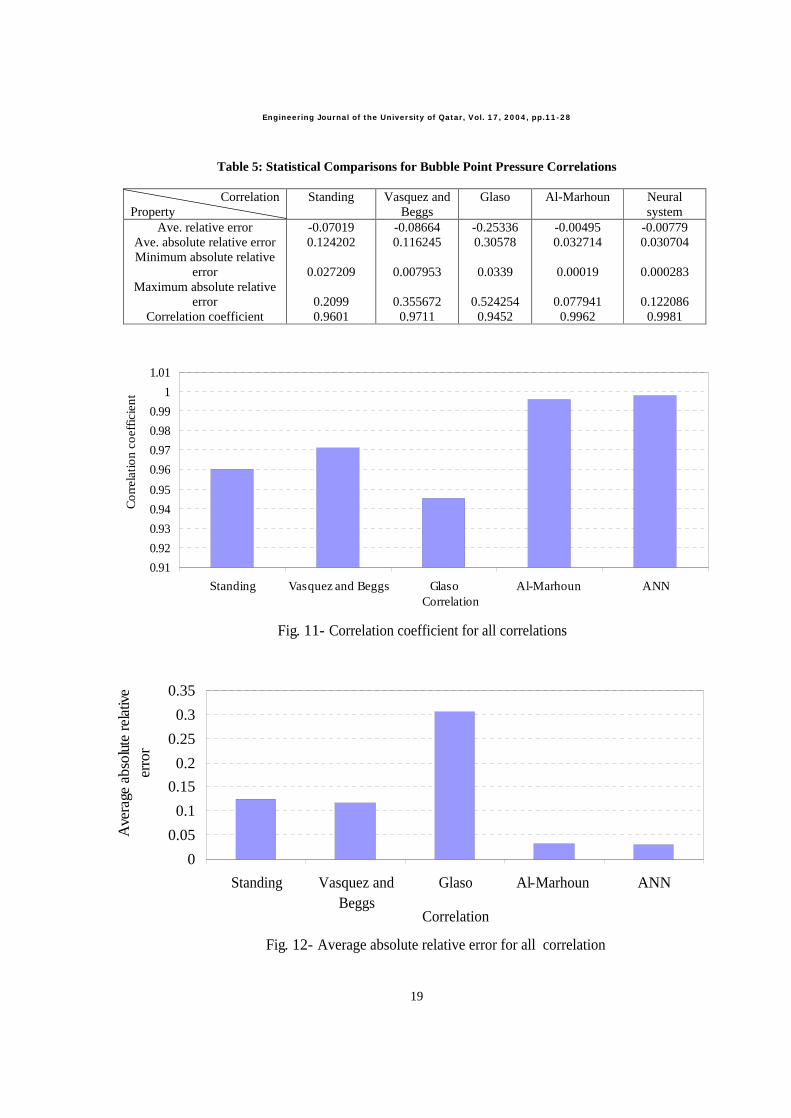
Out of all these methods, the network model gives the highest correlation coefficient, and lowest absolute average error, (see Table 5). Fig. 11 represents the correlation coefficient for all the tested method. Figure 11 and Table 5, indicated that the neural network has the highest correlation coefficient of equal 0.9981, however the other coefficient values lies between 0.996 and 0.9749. In addition, as shown in Fig. 12 the network model displayed the smallest value of average absolute relative error (0.030704) that is smaller with respect to that of Al-Marhoun correlation, which has the next smallest average absolute relative error (0.032714).
Fig. 9- Performance of Al-Marhoun correlation (Bubble point pressure)
0
500
1000
1500
2000
2500
3000
3500
4000
0 5 10 15 20
Sample number
Bub
ble
poin
t pre
ssur
e, p
sia
Measured values
Estimated values
Fig. 10- Cross plot for Al-Marhoun correlation (Bubble point pressure)
0
500
1000
1500
2000
2500
3000
3500
4000
0 500 1000 1500 2000 2500 3000 3500
Measured values
Est
imat
ed v
alue
s
Engineering Journal of the University of Qatar, Vol. 17, 2004, pp.11-28
19
Table 5: Statistical Comparisons for Bubble Point Pressure Correlations
Correlation Property
Standing Vasquez and Beggs
Glaso Al-Marhoun Neural system
Ave. relative error Ave. absolute relative error Minimum absolute relative
error Maximum absolute relative
error Correlation coefficient
-0.07019 0.124202
0.027209
0.2099 0.9601
-0.08664 0.116245
0.007953
0.355672 0.9711
-0.25336 0.30578
0.0339
0.524254 0.9452
-0.00495 0.032714
0.00019
0.077941 0.9962
-0.00779 0.030704
0.000283
0.122086 0.9981
Fig. 11- Correlation coefficient for all correlations
0.91
0.92
0.93
0.94
0.95
0.96
0.97
0.98
0.99
1
1.01
Standing Vasquez and Beggs Glaso Al-Marhoun ANNCorrelation
Cor
rela
tion
coef
ficie
nt
Fig. 12- Average absolute relative error for all correlation
0
0.05
0.1
0.15
0.2
0.25
0.3
0.35
Standing Vasquez andBeggs
Glaso Al-Marhoun ANN
Correlation
Ave
rage
abs
olut
e re
lativ
e er
ror
Eissa M. Shokir et al. / Modeling Approach for Predicting PVT Data
20
B. Oil Formation Volume Factor (FVF) Network
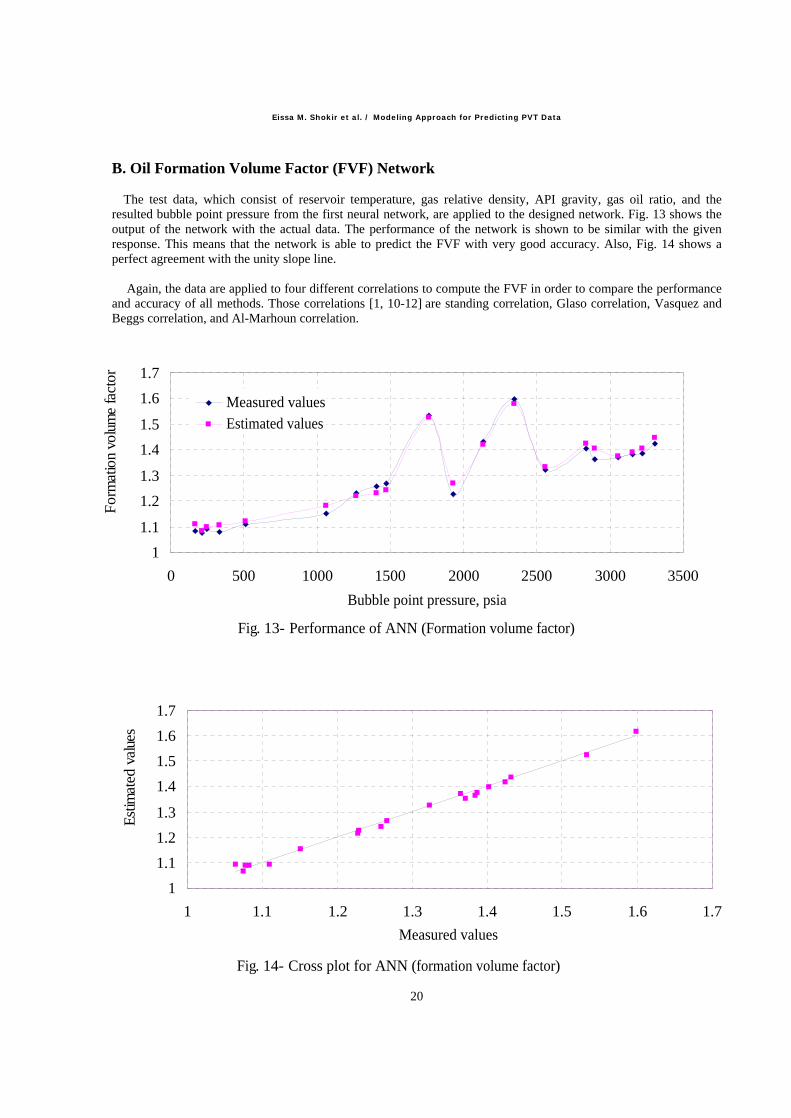
The test data, which consist of reservoir temperature, gas relative density, API gravity, gas oil ratio, and the resulted bubble point pressure from the first neural network, are applied to the designed network. Fig. 13 shows the output of the network with the actual data. The performance of the network is shown to be similar with the given response. This means that the network is able to predict the FVF with very good accuracy. Also, Fig. 14 shows a perfect agreement with the unity slope line.
Again, the data are applied to four different correlations to compute the FVF in order to compare the performance and accuracy of all methods. Those correlations [1, 10-12] are standing correlation, Glaso correlation, Vasquez and Beggs correlation, and Al-Marhoun correlation.
Fig. 13- Performance of ANN (Formation volume factor)
1
1.1
1.2
1.3
1.4
1.5
1.6
1.7
0 500 1000 1500 2000 2500 3000 3500
Bubble point pressure, psia
For
mat
ion
volu
me
fact
or
Measured valuesEstimated values
Fig. 14- Cross plot for ANN (formation volume factor)
1
1.1
1.2
1.3
1.4
1.5
1.6
1.7
1 1.1 1.2 1.3 1.4 1.5 1.6 1.7
Measured values
Est
imat
ed v
alue
s
Engineering Journal of the University of Qatar, Vol. 17, 2004, pp.11-28
21
1. Standing Correlation [1, 10]
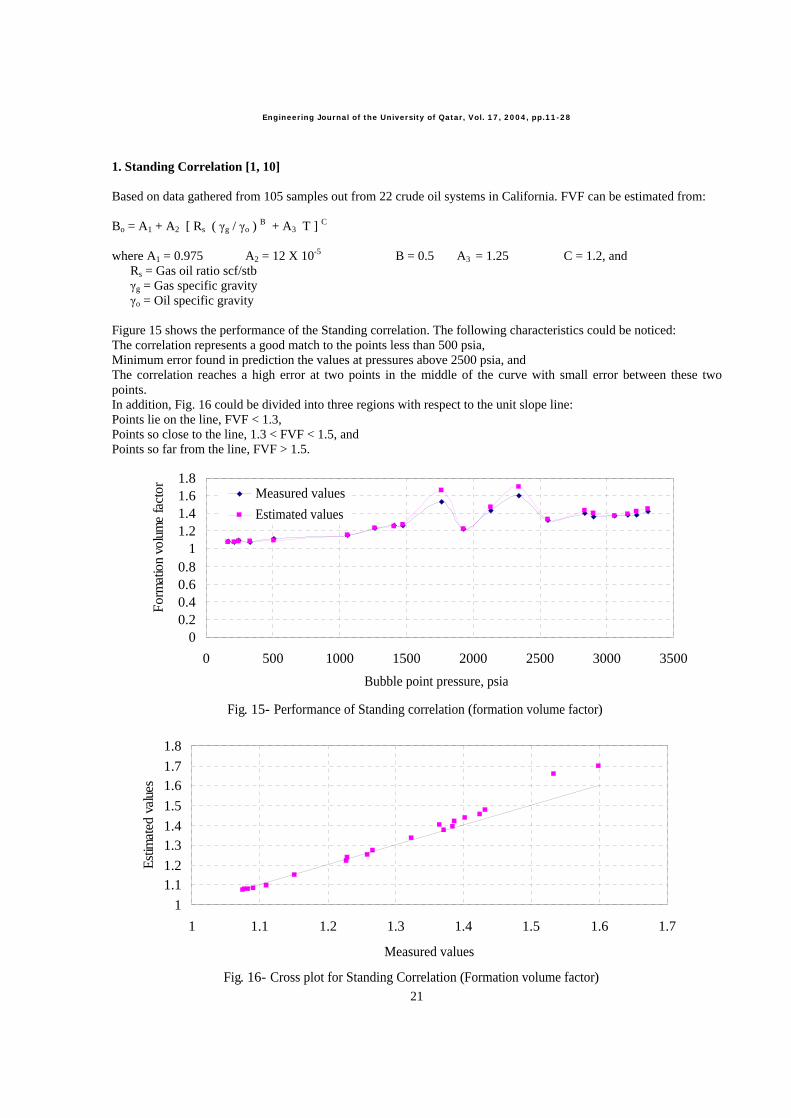
Based on data gathered from 105 samples out from 22 crude oil systems in California. FVF can be estimated from:
Bo = A1 + A2 [ Rs ( g / o ) B + A3 T ] C
where A1 = 0.975 A2 = 12 X 10-5 B = 0.5 A3 = 1.25 C = 1.2, and Rs = Gas oil ratio scf/stb
g = Gas specific gravity o = Oil specific gravity
Figure 15 shows the performance of the Standing correlation. The following characteristics could be noticed: The correlation represents a good match to the points less than 500 psia, Minimum error found in prediction the values at pressures above 2500 psia, and The correlation reaches a high error at two points in the middle of the curve with small error between these two points. In addition, Fig. 16 could be divided into three regions with respect to the unit slope line: Points lie on the line, FVF < 1.3, Points so close to the line, 1.3 < FVF < 1.5, and Points so far from the line, FVF > 1.5.
Fig. 15- Performance of Standing correlation (formation volume factor)
00.20.40.60.8
11.21.41.61.8
0 500 1000 1500 2000 2500 3000 3500
Bubble point pressure, psia
For
mat
ion
volu
me
fact
or Measured values
Estimated values
Fig. 16- Cross plot for Standing Correlation (Formation volume factor)
1
1.11.2
1.31.4
1.5
1.61.7
1.8
1 1.1 1.2 1.3 1.4 1.5 1.6 1.7
Measured values
Est
imat
ed v
alue
s
Eissa M. Shokir et al. / Modeling Approach for Predicting PVT Data
22
2. Glaso Correlation [1, 12]
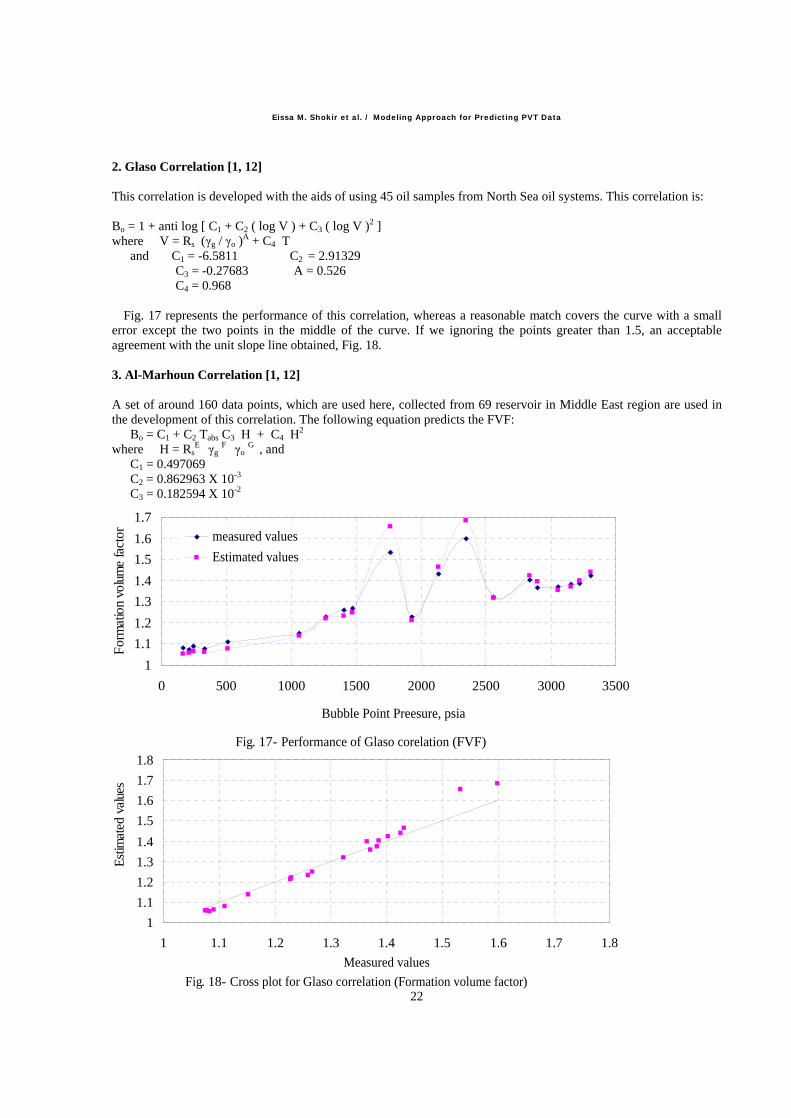
This correlation is developed with the aids of using 45 oil samples from North Sea oil systems. This correlation is:
Bo = 1 + anti log [ C1 + C2 ( log V ) + C3 ( log V )2 ] where V = Rs ( g / o )
A + C4 T and C1 = -6.5811 C2 = 2.91329 C3 = -0.27683 A = 0.526 C4 = 0.968
Fig. 17 represents the performance of this correlation, whereas a reasonable match covers the curve with a small error except the two points in the middle of the curve. If we ignoring the points greater than 1.5, an acceptable agreement with the unit slope line obtained, Fig. 18.
3. Al-Marhoun Correlation [1, 12]
A set of around 160 data points, which are used here, collected from 69 reservoir in Middle East region are used in the development of this correlation. The following equation predicts the FVF:
Bo = C1 + C2 Tabs C3 H + C4 H2
where H = RsE g
F o G , and
C1 = 0.497069 C2 = 0.862963 X 10⁻³ C3 = 0.182594 X 10⁻²
Fig. 17- Performance of Glaso corelation (FVF)
1
1.1
1.2
1.3
1.4
1.5
1.6
1.7
0 500 1000 1500 2000 2500 3000 3500
Bubble Point Preesure, psia
For
mat
ion
volu
me
fact
or measured values
Estimated values
Fig. 18- Cross plot for Glaso correlation (Formation volume factor)
1
1.1
1.2
1.3
1.4
1.5
1.6
1.7
1.8
1 1.1 1.2 1.3 1.4 1.5 1.6 1.7 1.8
Measured values
Est
imat
ed v
alue
s
Engineering Journal of the University of Qatar, Vol. 17, 2004, pp.11-28
23
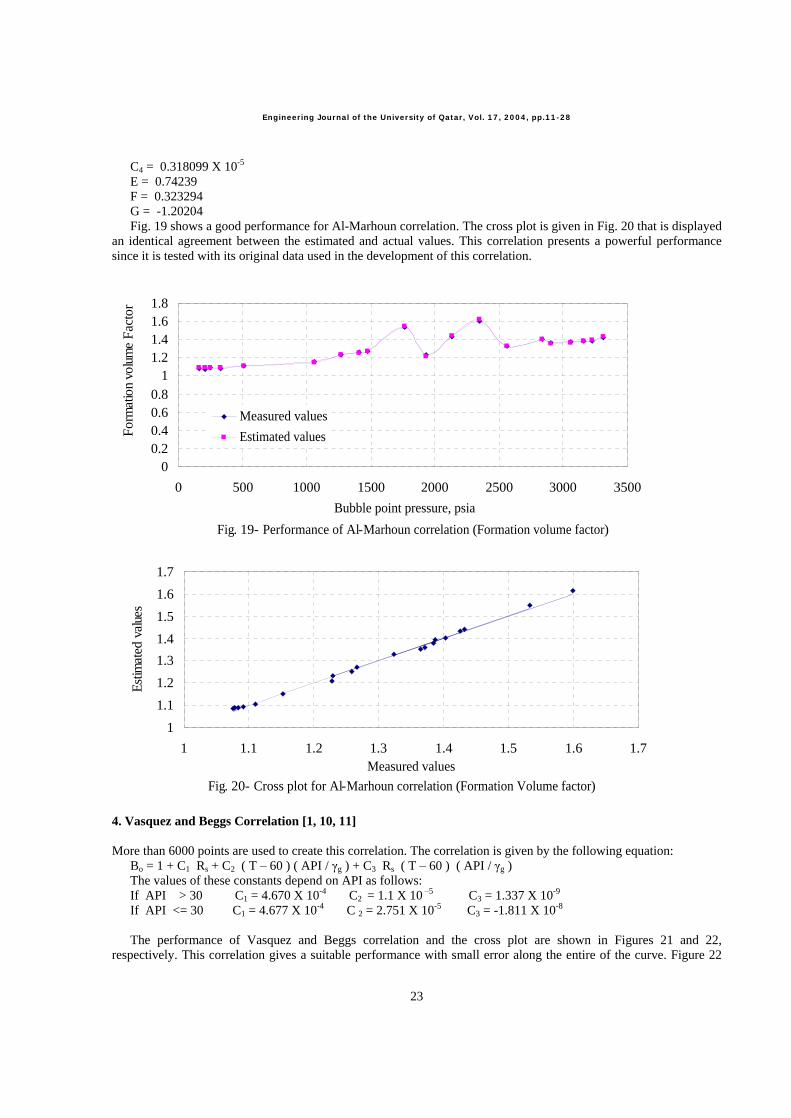
C4 = 0.318099 X 10⁻⁵
E = 0.74239 F = 0.323294 G = -1.20204 Fig. 19 shows a good performance for Al-Marhoun correlation. The cross plot is given in Fig. 20 that is displayed
an identical agreement between the estimated and actual values. This correlation presents a powerful performance since it is tested with its original data used in the development of this correlation.
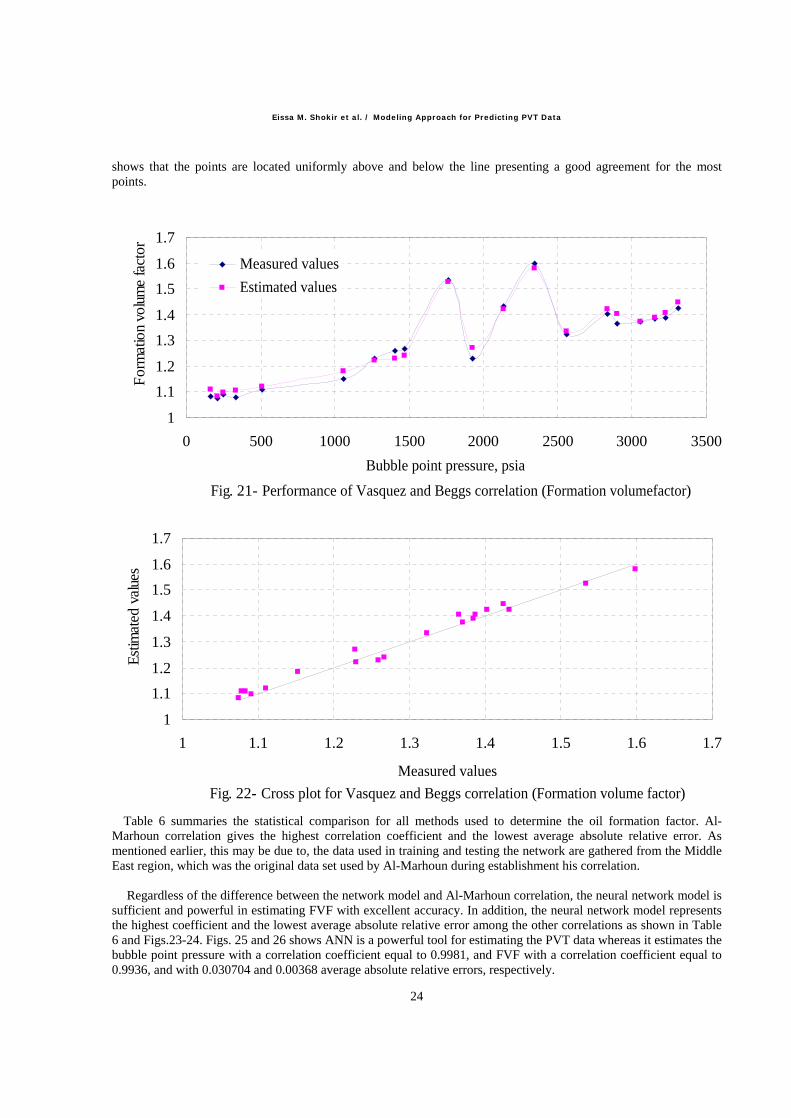
4. Vasquez and Beggs Correlation [1, 10, 11]
More than 6000 points are used to create this correlation. The correlation is given by the following equation: Bo = 1 + C1 Rs + C2 ( T 60 ) ( API / g ) + C3 Rs ( T 60 ) ( API / g ) The values of these constants depend on API as follows: If API > 30 C1 = 4.670 X 10⁻⁴ C2 = 1.1 X 10 5 C3 = 1.337 X 10⁻⁹
If API <= 30 C1 = 4.677 X 10⁻⁴ C 2 = 2.751 X 10⁻⁵ C3 = -1.811 X 10⁻⁸
The performance of Vasquez and Beggs correlation and the cross plot are shown in Figures 21 and 22, respectively. This correlation gives a suitable performance with small error along the entire of the curve. Figure 22
Fig. 19- Performance of Al-Marhoun correlation (Formation volume factor)
00.20.40.60.8
11.21.41.61.8
0 500 1000 1500 2000 2500 3000 3500
Bubble point pressure, psia
For
mat
ion
volu
me
Fac
tor
Measured values
Estimated values
Fig. 20- Cross plot for Al-Marhoun correlation (Formation Volume factor)
1
1.1
1.2
1.3
1.4
1.5
1.6
1.7
1 1.1 1.2 1.3 1.4 1.5 1.6 1.7Measured values
Est
imat
ed v
alue
s
Eissa M. Shokir et al. / Modeling Approach for Predicting PVT Data
24
shows that the points are located uniformly above and below the line presenting a good agreement for the most points.
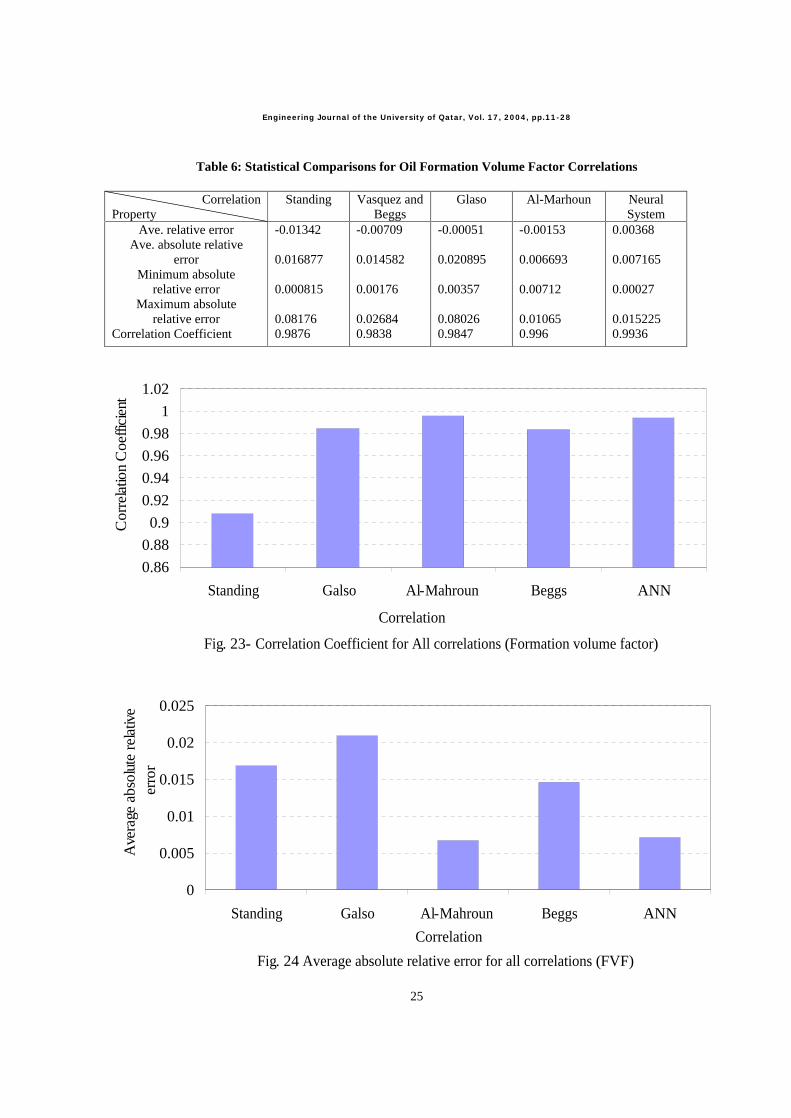
Table 6 summaries the statistical comparison for all methods used to determine the oil formation factor. Al-Marhoun correlation gives the highest correlation coefficient and the lowest average absolute relative error. As mentioned earlier, this may be due to, the data used in training and testing the network are gathered from the Middle East region, which was the original data set used by Al-Marhoun during establishment his correlation.
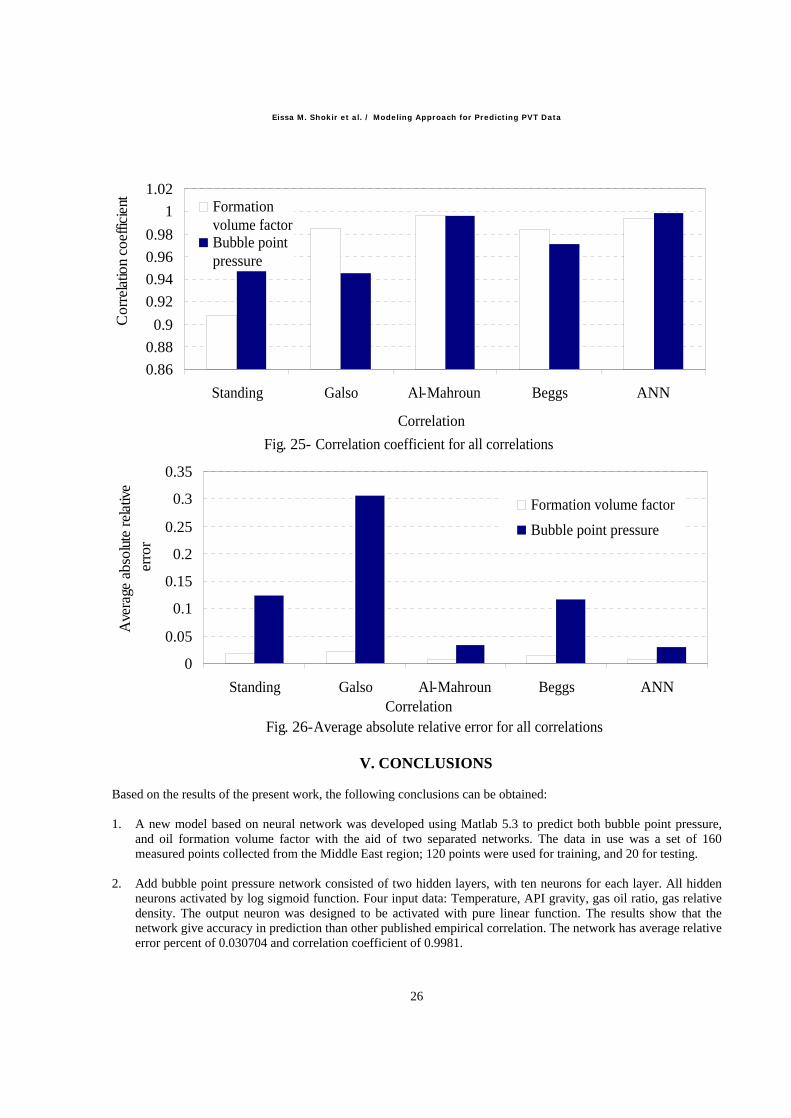
Regardless of the difference between the network model and Al-Marhoun correlation, the neural network model is sufficient and powerful in estimating FVF with excellent accuracy. In addition, the neural network model represents the highest coefficient and the lowest average absolute relative error among the other correlations as shown in Table 6 and Figs.23-24. Figs. 25 and 26 shows ANN is a powerful tool for estimating the PVT data whereas it estimates the bubble point pressure with a correlation coefficient equal to 0.9981, and FVF with a correlation coefficient equal to 0.9936, and with 0.030704 and 0.00368 average absolute relative errors, respectively.
Fig. 22- Cross plot for Vasquez and Beggs correlation (Formation volume factor)
1
1.1
1.2
1.3
1.4
1.5
1.6
1.7
1 1.1 1.2 1.3 1.4 1.5 1.6 1.7
Measured values
Est
imat
ed v
alue
s
Fig. 21- Performance of Vasquez and Beggs correlation (Formation volumefactor)
1
1.1
1.2
1.3
1.4
1.5
1.6
1.7
0 500 1000 1500 2000 2500 3000 3500
Bubble point pressure, psia
For
mat
ion
volu
me
fact
or
Measured values
Estimated values
Engineering Journal of the University of Qatar, Vol. 17, 2004, pp.11-28
25
Table 6: Statistical Comparisons for Oil Formation Volume Factor Correlations
Correlation Property
Standing Vasquez and Beggs
Glaso Al-Marhoun Neural System
Ave. relative error Ave. absolute relative
error Minimum absolute
relative error Maximum absolute
relative error Correlation Coefficient
-0.01342
0.016877
0.000815
0.08176 0.9876
-0.00709
0.014582
0.00176
0.02684 0.9838
-0.00051
0.020895
0.00357
0.08026 0.9847
-0.00153
0.006693
0.00712
0.01065 0.996
0.00368
0.007165
0.00027
0.015225 0.9936
Fig. 24 Average absolute relative error for all correlations (FVF)
0
0.005
0.01
0.015
0.02
0.025
Standing Galso Al-Mahroun Beggs ANN
Correlation
Ave
rage
abs
olut
e re
lativ
e er
ror
Fig. 23- Correlation Coefficient for All correlations (Formation volume factor)
0.86
0.88
0.9
0.92
0.94
0.96
0.98
1
1.02
Standing Galso Al-Mahroun Beggs ANN
Correlation
Cor
rela
tion
Coe
ffici
ent
Eissa M. Shokir et al. / Modeling Approach for Predicting PVT Data
26
V. CONCLUSIONS
Based on the results of the present work, the following conclusions can be obtained:
1. A new model based on neural network was developed using Matlab 5.3 to predict both bubble point pressure, and oil formation volume factor with the aid of two separated networks. The data in use was a set of 160 measured points collected from the Middle East region; 120 points were used for training, and 20 for testing.
2. Add bubble point pressure network consisted of two hidden layers, with ten neurons for each layer. All hidden neurons activated by log sigmoid function. Four input data: Temperature, API gravity, gas oil ratio, gas relative density. The output neuron was designed to be activated with pure linear function. The results show that the network give accuracy in prediction than other published empirical correlation. The network has average relative error percent of 0.030704 and correlation coefficient of 0.9981.
Fig. 25- Correlation coefficient for all correlations
0.86
0.88
0.9
0.92
0.94
0.96
0.98
1
1.02
Standing Galso Al-Mahroun Beggs ANN
Correlation
Cor
rela
tion
coef
ficie
nt Formationvolume factorBubble pointpressure
Fig. 26-Average absolute relative error for all correlations
0
0.05
0.1
0.15
0.2
0.25
0.3
0.35
Standing Galso Al-Mahroun Beggs ANNCorrelation
Ave
rage
abs
olut
e re
lativ
e er
ror
Formation volume factor
Bubble point pressure
Engineering Journal of the University of Qatar, Vol. 17, 2004, pp.11-28
27
3. Formation volume factor network used the same input data but with the estimated bubble point pressure to
predict oil formation volume factor. The use of eight hidden neurons with log sigmoid in two hidden layers and pure linear function in the output layer was the best architecture. The network has correlation coefficient of 0.9936, and average relative error of 0.007165. A comparison study between this network and some of empirical correlation showed that the network has high accuracy in the prediction task.
REFERENCES
1. Osman, E. A., Abdel-Wahhab, O. A., Al-Marhoun, M. A., Prediction of Oil Properties using Neural Networks , SPE Paper 68233, Presented at the SPE Middle East Oil Show Conference, Bahrain, 17-20 March, 2001.
2. Gharbi, R. B., El Sharkawy, A. M., Neural Network Model for Estimating the PVT Properties of Middle East Crude Oils, SPE Paper 37695, presented at the Middle East Oil Conference and Exhibition held in Manama, Bahrain, 17-20 March 1997.
3. Gharbi, B., El Sharkawy, M., Universal Neural Network Based Model For Estimating The PVT Properties of Crude Oil System, SPE Paper 38099, presented at Inc. SPE Asia Pacific Oil and Gas Conference held in Kuala Lumpur, Malaysia, 14-16 April, 1997.
4. Shokir, E.M. El-M., Neural Network Determines Shaly-Sand Hydrocarbon Saturation, Oil & Gas Journal, Vol. 99.17, 37-41, 23 April 2001.
5. Shokir, E. M. El-M., Goda, H. M., Sayyouh, M. H., Fattah, Kh. A. Selection and Evaluation of EOR Method Using Artificial Intelligent, SPE Paper 79163, Presented at the 26th Annual SPE International Technical Conference and Exhibition in Abuja, Nigeria, 5-7 August, 2002.
6. Beale, R., Jackson, T., Neural Computing: An Introduction, Adam Hilger Company, 1969. 7. Kay, Alexx., Artificial Neural Networks Computer world 35, February 2001. 8. Ali, J. K., Neural Networks: A New Tool for The Petroleum Industry, SPE Paper 27561, Presented at Inc.
European Petroleum Computer Conference held in Aberdeen, U.K., 15-17 March, 1994. 9. Buscema, Massimo., A Brief Overview and Introduction to Artificial Neural Networks Substance Use &
Misuse 37, 1093-1149, June 2002. 10. Danesh, A., PVT and Phase Behavior of Petroleum Reservoir Fluid, Elsevier Publishing Company, 1998. 11. Smith, C., Tracy, G., Farrar, R., Applied Reservoir Engineering, Volume 1, Oil & Gas Consultants
International, 1992. 12. Al-Marhoun, M., PVT Correlations for Middle East Crude Oils, Journal of Petroleum Technology, 650-666,
1992.

Eissa M. Shokir et al. / Modeling Approach for Predicting PVT Data
28


![Data Modeling [Comparison of data modeling techniques ] By Renjini Sindhuri](https://img.pdfslide.us/doc/110x75/5517cb1555034616658b4aae/data-modeling-comparison-of-data-modeling-techniques-by-renjini-sindhuri.jpg)