Embed Size (px)
DESCRIPTION
pure ethanol PVT data
Citation preview

DOI: 10.1007/s10765-007-0158-2International Journal of Thermophysics, Vol. 28, No. 1, February 2007 (© 2007)
PVT Measurements for Pure Ethanolin the Near-Critical and Supercritical Regions
A. R. Bazaev,1 I. M. Abdulagatov,1–3 E. A. Bazaev,1 andA. Abdurashidova1
Received October 18, 2006
The PV T properties of pure ethanol were measured in the near-critical andsupercritical regions. Measurements were made using a constant-volume pie-zometer immersed in a precision thermostat. The uncertainty of the densitymeasurements was estimated to be 0.15%. The uncertainties of the tempera-ture and pressure measurements were, respectively, 15 mK and 0.05%. Mea-surements were made along various near-critical isotherms between 373 and673 K and at densities from 91.81 to 497.67 kg · m−3. The pressure rangewas from 0.226 to 40.292 MPa. Using two-phase PV T results, the values ofthe saturated-liquid and -vapor densities and the vapor pressure for tempera-tures between 373.15 and 513.15 K were obtained by means of an analyticalextrapolation technique. The measured PV T data and saturated propertiesfor pure ethanol were compared with values calculated from a fundamentalequation of state and correlations, and with experimental data reported byother authors. The values of the critical parameters (TC,PC,ρC) were derivedfrom the measured values of saturated densities and vapor pressure near thecritical point. The derived values of the saturated densities near the criticalpoint for ethanol were interpreted in term of the “complete scaling” theory.
KEY WORDS: coexistence curve; critical point; equation of state; ethanol;saturated density; vapor pressure.
1. INTRODUCTION
Although ethanol is a common substance and often used for technologi-cal and scientific applications, its thermodynamic properties have not been
1 Institute for Geothermal Problems of the Dagestan Scientific Center of the RussianAcademy of Sciences, Shamilya Str. 39, 367003 Makhachkala, Dagestan, Russia.
2 Present address: Physical and Chemical Properties Division, National Institute ofStandards and Technology, 325 Broadway, Boulder, Colorado 80305, U.S.A.
3 To whom correspondence should be addressed. E-mail: [email protected]
194
0195-928X/07/0200-0194/0 © 2007 Springer Science+Business Media, LLC

PVT Measurements for Ethanol in the Critical Region 195
very well studied, especially at near-critical and supercritical conditions.Ethanol is a very interesting compound as a constituent of binary mix-tures because of its high polarity (highly associated fluid, gas-phase dipolemoment at normal boiling point (NBP) is 1.6909 D), and high acentricfactor (ω = 0.644). Therefore, the thermodynamic properties of mixtureswhere ethanol is one of the components are governed by hydrogen bond-ing which, in contrast to physical interactions, is short-ranged and highlydirectional. Mixtures of ethanol with other fluids form highly nonidealsystems, for example, excess molar properties and critical lines for eth-anol solute mixtures exhibit unusually large deviations from ideal mix-ture behavior. Ethanol is also used as a polar co-solvent in supercriticalfluid technologies to enhance the solubility of a solute and to improvethe selectivity of the supercritical solvent (effective polar modifiers) [1–8].Ethanol can be used as a renewable bio-fuel. Therefore, the design oftechnological equipment utilizing ethanol requires an accurate knowledgeof its thermodynamic properties. Due to its high polarity and strong self-association, ethanol has a complex structure and is a challenge to studyboth experimentally and theoretically. We do not have a sufficient under-standing of microscopic properties of associated fluids including the natureof hydrogen bonds and their effect on thermodynamic properties. A deeperunderstanding of the structure and nature of hydrogen bonding fluids andtheir effect on the thermodynamic behavior will lead to marked improve-ments in important practical applications in the environmental, mechani-cal, chemical, biological, and geothermal industries.
A survey of the literature reveals that measurements of the thermo-dynamic properties of pure ethanol in the near-critical and supercriticalregions are very scarce. Moreover, the available experimental data in thecritical region show large discrepancies. Available information on the crit-ical properties of ethanol and saturated densities near the critical point issomewhat sparse and is variable in quality. For example, the differencesbetween critical parameters (TC,PC,ρC) reported by different authors areas much as 14.3 K, 5.93 MPa, and 57.7 kg · m−3, respectively. The differ-ences between the reported values of saturated-liquid and -vapor densitiesin the critical region are as large as 20–50%.
1.1. PVT Measurements in the Critical and Supercritical Regions
Most reported experimental data for the density of pure ethanol coverthe temperature range below 373 K. PVT properties of pure ethanol above373 K and at high pressures were reported by several authors [9–15]. Sau-ermann et al. [13] reported PVT properties of ethanol (99.8 vol% purity) inthe temperature range from 263 to 483 K and at pressures up to 57 MPa.

196 Bazaev, Abdulagatov, Bazaev, and Abdurashidova
Measurements were made with a vibrating tube technique. The maximumuncertainty in density measurements is 0.06%. Lo and Stiel [12] used aconstant-volume method to measure the density of ethanol (99.95 mol%)in the temperature range from 473 to 623 K and at pressures up to69 MPa. The uncertainty of the measurements is 0.4%. The measurementsby Tamann and Ruhenbeck [14] cover a temperature range from 293 to673 K and a pressure range from 0.04 to 96 MPa. Kalafati et al. [11]employed a constant volume piezometer to measure the density of etha-nol (96 vol% purity) in the temperature range from 423 to 573 K and atpressures up to 20 MPa. The uncertainty in the specific volume measure-ments is within 0.1–0.3%. Golubev et al. [9] and Zolin et al. [10] reportedthe densities of liquid ethanol (99.89%, 0.07% H2O and 0.04% organiccompounds) in the temperature range from 194 to 571 K and at pressuresup to 50 MPa. Measurements were performed with a hydrostatic weigh-ing method. The uncertainty in density measurements is about 0.1% athigh densities (above 300 kg · m−3) and 0.3% at lower densities. Using anextrapolation technique, the values of saturated liquid densities were deter-mined in the temperature range from 194.7 to 506.4 K. Popov and Malov[15] measured the densities of ethanol in the temperature range from 273to 473 K and at pressures up to 30 MPa by using two cylindrical piezom-eters (with volumes of 10.903 and 11.019 cm3) inserted in a high precisionthermostat. The uncertainty in density measurements is about 0.5%.
1.2. Vapor Pressures and Saturated-Liquid and -Vapor Densities
Vapor-pressure data for pure ethanol at high temperatures (above373 K) were reported by various authors [10,11,13,16–31]. Saturated-liquid and -vapor densities for ethanol (above 373 K) were also reported[10,11,13,21,27,32–40]. Very limited data are available for the saturatedvapor of ethanol. Only six data sources were found for saturated vapordensities [10,21,27,37–39] in the critical region. Vapor pressures and sat-urated-liquid and -vapor densities for ethanol in the critical region werereported by Mousa [27], but the measurements are unreliable. Other ther-modynamic properties such as the isochoric heat capacity [37,39–42],sound speed [43], and enthalpy [31,44,45] of pure ethanol in the criticaland supercritical regions were also reported.
1.3. Equation of State and Correlations
A fundamental equation of state for the Helmholtz energy A(V,T )
of pure ethanol is reported by Dillon and Penoncello [46]. This equationof state represents the thermodynamic properties of pure ethanol in the

PVT Measurements for Ethanol in the Critical Region 197
temperature range from 250 to 650 K at pressures up to 280 MPa anddensities to 893.73 kg · m−3. The uncertainty of the calculated values ofdensity is 0.2%, and that of the saturated pressure and saturated densityis 0.5%. Ambrose and Walton [22] developed an equation for the vaporpressures of pure ethanol. Cibulka [47] reported a correlation equationfor saturated-liquid densities of pure ethanol. This correlation reproducedexperimental values of the saturated-liquid densities in the temperaturerange from the normal melting point (159 K) to 508.2 K with a stan-dard deviation of 0.161%. A Storbridge-type equation of state for ethanolwas also developed by Sauermann et al. [13]. They also reported a Wag-ner-type vapor-pressure equation for ethanol. A low-temperature (below490 K) correlation for the saturated-liquid density was developed by Halesand Ellender [32].
1.4. Critical Parameters
Polikhronidi et al. [37] and Gude and Teja [48] have reviewed the crit-ical properties (TC,PC,ρC) of pure ethanol. A large scatter of the avail-able critical parameter values of ethanol is found in the literature. Ananalysis of the reported values of the critical parameters for pure ethanolreveals that all of the reported data for the critical temperature lie between506.9 and 521.2 K, the critical density between 228.3 and 286 kg · m−3,and the critical pressure between 6.1309 and 12.06 MPa. Recently Polikh-ronidi et al. [37] reported values of the critical temperature and criticaldensity for ethanol from calorimetric (CV ) measurements in the criticalregion. The results are ρC = 282.33 ± 2 kg · m−3 and TC = 514.44 ± 0.02 K.These critical parameters are close to the values (ρC = 275 ± 2 kg · m−3,TC = 514.0 ± 0.2 K, and PC = 6.137 ± 0.02 MPa) recommended by Gudeand Teja [48]. The recommended values of Dillon and Penoncello [46] areρC = 276 kg · m−3, TC = 513.9 K, and PC = 6.148 MPa. A majority of thepublished values for the critical temperature for ethanol lie between 513.9and 516.7 K, the critical density lies within 275–277 kg · m−3, and the crit-ical pressure between 6.13 and 6.40 MPa. This is one of the reasons whyreported saturated-liquid and -vapor densities show large discrepancies (upto 50% and more for the saturated vapor and up to 10–20% for saturated-liquid densities) in the critical region.
Thus, the main objective of this paper is to provide accurate PV T
data in the critical and supercritical regions, the phase boundary (PS,TS,ρS),and critical properties (TC,PC,ρC) data for ethanol. The present measure-ments focused on the temperature range from 373 to 673 K, at pressuresup to 40 MPa and densities from 91.81 to 497.67 kg · m−3. The presentresults expand considerably the existing PVT database at near-critical and

198 Bazaev, Abdulagatov, Bazaev, and Abdurashidova
supercritical conditions for pure ethanol. We also provided a comprehen-sive analysis of all available experimental PVT data sets, and saturated andcritical property data for pure ethanol by detailed comparisons to deter-mine the reliability of published data and correlations. This work is a partof a continuing program on volumetric (PVT) and caloric (CV V T ) prop-erty measurements of alcohols and their aqueous solutions in the criticaland supercritical regions. The present PVT apparatus has been previouslyused for accurate measurements on other pure fluids and aqueous solu-tions in the critical and supercritical regions (Abdulagatov et al. [49–53],Bazaev et al. [54–58], and Rabezkii et al. [59]).
2. EXPERIMENTAL PROCEDURE
The apparatus used for PV T measurements of ethanol is similar tothat used in previous papers [49–59] to measure PV T properties of puremethanol, n-alkanes, and their aqueous solutions in the critical and super-critical regions. Detailed descriptions of the apparatus and the experi-mental procedure, and uncertainty assessment have been described in ourprevious publications [49–59]. The measurements were made using theconstant-volume method, with an extraction of the sample from the pie-zometer under isothermal conditions. The inner volume of the piezometerwas calculated by taking into consideration corrections of the elastic pres-sure deformation and thermal expansion. The internal volume of the pie-zometer was previously calibrated by filling it with pure water. The volumeof the piezometer VT0P0 = m(H2O)/ρ(H2O) at temperature T0 = 673.15 Kand pressure P0 =38.35 MPa was calculated from the well established (IA-PWS-95 formulation, Wagner and Pruß [60]) density ρ(H2O) and mass ofthe water m(H2O). The derived value of the volume at these conditionswas VT0P0 = (32.56 ± 0.02) cm3. It is necessary to know the volume of thepiezometer, VPT at a given temperature T and pressure P , for the pur-pose of calculating densities ρ(T ,P ) = m/VPT . Variations of the piezom-eter volume VPT with temperature T and pressure P were calculated byusing the thermal expansion coefficient of the piezometer material, α =1.56×10⁻⁵ K−1, and the pressure expansion coefficient of the piezometer,β =3.51×10⁻⁵ MPa−1. All masses were determined with an uncertainty of5 × 10−4 g. The volume of the piezometer at a given temperature T andpressure P was measured with an uncertainty of 0.01–0.02%.
The fluid under study was thermostated in a double-wall air bath.The fluid temperature (ITS-90) was measured with a 10 � platinum resis-tance thermometer (PRT-10). The maximum uncertainty in the measuredtemperature was 15 mK. The temperature inside the thermostat was main-tained uniform within 5 mK with the aid of guard heaters located between
PVT Measurements for Ethanol in the Critical Region 199
the thermostat walls and regulating heaters, which were mounted insidethe thermostat [61]. The pressure of the ethanol in the piezometer wasmeasured with a dead-weight oil gauge with an estimated uncertainty of0.05%.
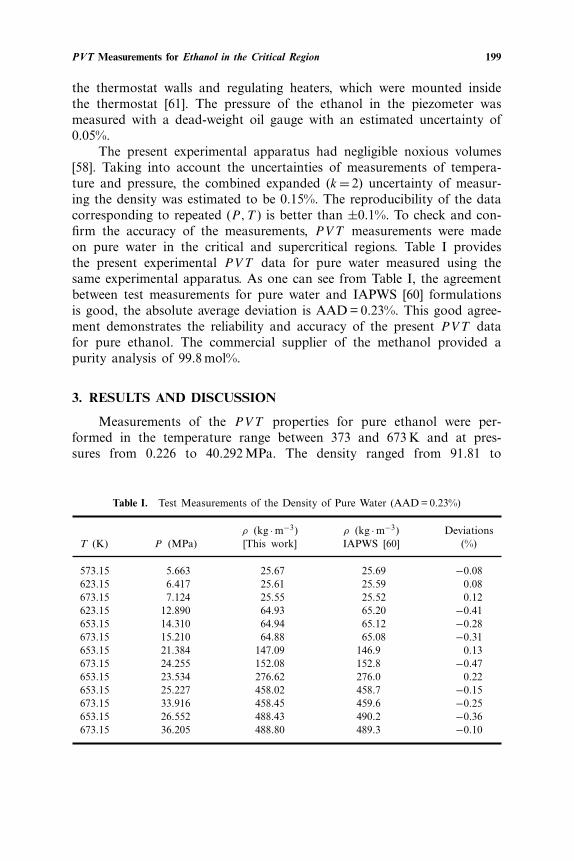
The present experimental apparatus had negligible noxious volumes[58]. Taking into account the uncertainties of measurements of tempera-ture and pressure, the combined expanded (k = 2) uncertainty of measur-ing the density was estimated to be 0.15%. The reproducibility of the datacorresponding to repeated (P,T ) is better than ±0.1%. To check and con-firm the accuracy of the measurements, PV T measurements were madeon pure water in the critical and supercritical regions. Table I providesthe present experimental PV T data for pure water measured using thesame experimental apparatus. As one can see from Table I, the agreementbetween test measurements for pure water and IAPWS [60] formulationsis good, the absolute average deviation is AAD = 0.23%. This good agree-ment demonstrates the reliability and accuracy of the present PV T datafor pure ethanol. The commercial supplier of the methanol provided apurity analysis of 99.8 mol%.
3. RESULTS AND DISCUSSION
Measurements of the PV T properties for pure ethanol were per-formed in the temperature range between 373 and 673 K and at pres-sures from 0.226 to 40.292 MPa. The density ranged from 91.81 to
Table I. Test Measurements of the Density of Pure Water (AAD = 0.23%)
ρ (kg · m−3) ρ (kg · m−3) DeviationsT (K) P (MPa) [This work] IAPWS [60] (%)
573.15 5.663 25.67 25.69 −0.08623.15 6.417 25.61 25.59 0.08673.15 7.124 25.55 25.52 0.12623.15 12.890 64.93 65.20 −0.41653.15 14.310 64.94 65.12 −0.28673.15 15.210 64.88 65.08 −0.31653.15 21.384 147.09 146.9 0.13673.15 24.255 152.08 152.8 −0.47653.15 23.534 276.62 276.0 0.22653.15 25.227 458.02 458.7 −0.15673.15 33.916 458.45 459.6 −0.25653.15 26.552 488.43 490.2 −0.36673.15 36.205 488.80 489.3 −0.10

200 Bazaev, Abdulagatov, Bazaev, and Abdurashidova
497.67 kg · m−3. The experimental temperature, density, and pressure valuesfor pure ethanol are presented in Table II and shown in Figs. 1–3in P –ρ and P –T planes along the various near-critical and supercriti-cal isotherms and quasi-isochores. These figures include also the valuesof PV T calculated with the fundamental equation of state by Dillon
Table II. Experimental Values of the PVT Properties of Pure Ethanol Along Near-Criticaland Supercritical Isotherms
ρ (kg · m−3) P (MPa) ρ (kg · m−3) P (MPa) ρ (kg · m−3) P (MPa) ρ (kg · m−3) P (MPa)
T =523.15 K T =573.15 K T =598.15 K T =623.15 K183.48 6.896 183.03 10.531 268.76 15.360 182.58 13.905229.90 7.053 229.90 11.753 275.40 15.638 228.74 16.019284.72 7.241 284.72 13.124 298.43 16.553 283.27 18.927338.77 7.505 338.77 15.106 298.42 16.550 336.99 22.541396.85 8.198 396.85 18.056 327.82 18.187 394.68 28.485462.15 10.95 462.15 24.481 – – 459.51 39.211325.46 7.450 324.61 14.445 – – 150.13 12.169276.57 7.206 275.87 12.868 – – 268.41 18.031189.75 6.922 189.28 10.658 – – 275.04 18.476386.40 8.029 385.36 17.431 – – 298.03 19.706138.64 6.564 138.30 9.119 – – 298.03 19.708
– – – – – – 327.39 21.748
T =673.15 K T =373.15 K T =423.15 K T =473.15 K91.806 9.6710 271.76 0.226a 126.23 0.978a 126.23 2.978a
267.73 23.941 301.79 0.225a 196.43 0.980a 196.43 2.970a
– – 338.61 0.227a 230.17 0.984a 230.17 2.965a
– – 430.89 0.224a 278.12 0.985a 278.12 2.972a
– – – – 306.37 0.986a 306.37 2.973a
– – – – 320.42 0.988a 320.42 2.967a
– – – – 334.39 0.982a 334.39 2.981a
– – – – 342.30 0.987a 342.30 2.983a
– – – – 386.74 0.985a 386.74 2.968a
– – – – 497.67 0.983a 497.67 2.967a
T =548.15 K T =533.15 K T =518.15 K T =515.15 K269.44 9.9710 92.420 5.899 92.487 5.417 150.922 6.189276.09 10.080 150.79 7.290 150.90 6.379 269.899 6.288299.20 10.400 206.81 7.819 269.85 6.630 276.556 6.289328.67 10.959 374.71 9.601 276.51 6.642 299.713 6.302335.71 11.212 – – 329.18 6.752 299.706 6.303427.14 14.904 – – 336.23 6.781 325.597 6.322269.44 9.9710 – – 375.01 6.988 276.685 6.301
– – – – 427.85 7.939 189.831 6.278– – – – – – 386.569 6.574– – – – – – 138.699 6.093

PVT Measurements for Ethanol in the Critical Region 201
Table II. (continued)
ρ (kg · m−3) P (MPa) ρ (kg · m−3) P (MPa) ρ (kg · m−3) P (MPa) ρ (kg · m−3) P (MPa)
T =503.15 K T =513.15 K T =508.15 K T =511.15 K92.554 4.915 150.94 6.053 207.06 5.584a 269.94 5.858a
151.01 5.148a 269.92 6.085a 269.99 5.580a 276.61 5.857a
207.12 5.142a 276.58 6.086a 276.65 5.599a – –270.05 5.146a 299.74 6.087a 329.35 5.583a – –276.72 5.143a 329.26 6.089a 336.40 5.585a – –329.43 5.147a 336.32 6.083a 375.20 5.579a – –336.49 5.149a 375.10 6.118 – – – –375.29 5.149a 427.96 6.821 – – – –428.19 5.168a – – – – – –
T =493.15 K T =498.15 K T =653.15 K T =647.15 K92.599 4.319a 270.12 4.718a 91.893 9.1410 205.64 16.675
207.22 4.315a 276.79 4.723a 205.58 17.126 268.09 20.369300.04 4.317a 299.96 4.731a 274.63 21.519 274.71 20.921
– – 329.51 4.707a 297.57 23.529 297.67 22.483– – 336.57 4.707a 326.88 26.102 – –– – 375.39 4.716a 372.32 31.184 – –– – – – 424.66 40.292 – –
T =613.15 K T =553.15 K T =528.15 K T =516.15 K205.98 14.190 92.33 6.528 276.37 7.801 206.98 6.364373.12 23.812 206.60 9.526 269.71 7.760 299.70 6.425425.61 29.869 – – – – – –
T =517.15 K T =398.15 K T =512.15 K T =543.15 K299.68 6.554 301.42 0.495a 207.02 5.954 92.376 6.211
– – 331.11 0.497a – – – –
T =563.15 K T =618.15 K T =638.15 K T =521.15 K92.288 6.805 92.046 8.359 91.959 8.910 206.93 6.800
T =583.15 K – – – – – –206.29 11.872 – – – – – –
a Two-phase values
and Penoncello [46] and the data reported by other authors (Fig. 3).The experimental and calculated values of the compressibility factor Z =PV/(RT ) as a function of pressure P are given in Fig. 4. This figuredemonstrates the good mutual consistency of the measured values of tem-perature T , pressure P , and specific volume V for each thermodynamicstate (P,V,T ) and the results of calculations using the Dillon and Pe-noncello [46] equation of state. Figure 5 shows the measured values ofPV T in the two-phase region (sub-critical region, along the sub-criticalisotherms). In order to determine the values of saturated densities and

202 Bazaev, Abdulagatov, Bazaev, and Abdurashidova
0 120 240 360 480 600 720-5
5
15
25
35
45
55
65P
, MP
aEthanol
623.15 K473.15 K423.15573.15 K523.15 K673.15 K647.15 K598.15 KDillon and Penoncello [46]Coexistence line [46]548.15 K
30 130 230 330 430 5304
5
6
7
8
9
10
11
12523.15 K515.15 K503.15 K518.15 K523.15 K533.15 Kcritical point513.15 K508.15 KDillon and Penoncello [46]511.15 K498.15 Kcoexistence curve [46]
30 110 190 270 350 430 5103
8
13
18
23
28
33
38
43
P, M
Pa
647.15 K553.15 K517.15 K516.15 K653.15 KCritical point613.15 K514.15 K511.15 K528.15 KDillon and Penoncello [46]coexistence curve [46]
40 150 260 3705.7
6.4
7.1
7.8
ρ, kg·m-3
ρ, kg·m-3 ρ, kg·m-3
Fig. 1. Measured values of pressure of ethanol as a function of density along the vari-ous near- and supercritical isotherms together with values calculated from the Dillon andPenoncello [46] fundamental equation of state.

PVT Measurements for Ethanol in the Critical Region 203
360 390 420 450 480 510 540 570 600 630 660 690
T, K
0
8
16
24
32
40
P, M
Pa
Ethanol C
206.93 kg·m-3
276.09 kg·m-3
150.94 kg·m-3
92.42 kg·m-3
462.15 kg·m-3
183.03 kg·m-3
386.74 kg·m-3
338.77 kg·m-3
138.70 kg·m-3
427.14 kg·m-3
TC=514.71 K
PC=6.268 MPa
ρ > ρ
Cρ = ρ
Cρ < ρ
Fig. 2. Measured values of pressure of ethanol as a function of temperature along thevarious near-critical isochores together with values calculated from the Dillon and Penon-cello [46] fundamental equation of state.
pressures, the two-phase experimental isotherms were analytically extrapo-lated to the vapor-pressure curve. Figure 6 demonstrates also the isother-mal break-point technique to determine values of the saturated propertyfrom P –T measurements in the two- and one-phase regions. The satura-tion properties were determined as the intersection of the two-phase andone-phase P –T curves (see Fig. 6). The saturated-liquid and -vapor den-sities and vapor-pressure data extracted from these two-phase PV T mea-surements are summarized in Table III and presented in Figs. 7 and 8together with reported data and values calculated with the Dillon and Pe-noncello [46] equation of state and correlations by other authors.
3.1. Comparisons with Other Data
The PVT data of ethanol measured in this work were compared withvalues reported by other authors. Detailed direct comparisons of the pres-ent PVT data with the equation of state (EOS) by Dillon and Penoncel-lo [46] and other reported data are shows in Figs. 1–4. The deviationsbetween the present measured densities and the values calculated from Dil-lon and Penoncello [46] EOS are given in Fig. 9 as a function of pressure

204 Bazaev, Abdulagatov, Bazaev, and Abdurashidova
0 80 160 240 320 400 480 560 640 720
ρ, kg·m-3
-5
5
15
25
35
45
55
65P,
MP
a
Ethanol
533.15 K
623.15 K
573.15 K
473.15 K
513.15 K
This workLo and Stiel [12]Zolin et al. [10]Dil lon and Penoncello [46]Kalafati et al. [11]
Fig. 3. Comparison of the present experimental pressures for ethanol with data reportedby other authors and calculated from the Dillon and Penoncello [46] fundamental equa-tion of state.
for various measured isotherms. The agreement between the present dataand the values of density calculated with the Dillon and Penoncello[46] EOS is satisfactory (AAD = 0.49%, Bias = 0.069%, St.Dev. = 0.58%,St.Err. = 0.067%) in the temperature range below 650 K where the EOSis applicable. Extrapolated to higher temperatures (out of the range ofvalidity of the EOS, above 650 K), the values of density calculated withthe EOS deviate from the present data within 2.19% with a maximumdeviation of 5%. In the immediate vicinity of the critical point (withinTC ±3 K), the discrepancy between the measured and calculated values ofdensity varies from 2.3 to 2.7%. The deviations between measured and cal-culated values of pressure are within 0.3% at low temperatures, while athigh temperatures the deviations increase to 2%, and in the extrapolationrange (above 650 K), the deviations are about 3–5%.
Detailed comparisons between the present data for vapor pressureand saturated density and the results reported by other authors andcalculated with various correlations are presented in Tables IV–VI. As onecan see from these tables, the majority of the reported and correlateddata deviate from the present values of vapor pressure within 0.33–0.61%.Good agreement with an AAD = 0.4% is found between the present data

PVT Measurements for Ethanol in the Critical Region 205
0 5 10 15 20 25 30 35 40 45 50
P, MPa
0.1
0.2
0.3
0.4
0.5
0.6
0.7
0.8
0.9
1.0Z
=P
V/(
RT
)Ethanol
515.15 K523.15 K533.15 K623.15 K573.15 KDil lon and Penoncello [46]548.15 K573.15 K598.15 K
Fig. 4. Compressibility factors, Z = PV/(RT ), of the ethanol as a function of pressureP along the supercritical isotherms together with values calculated with the Dillon andPenoncello [46] equation of state.
and the values calculated from the EOS of Dillon and Penoncello [46].Good agreement within 0.33% is also found between the present data andthose reported by Deak et al. [16]. Large differences up to 2.16 and 5.0%are found for the vapor pressures reported by Zolin et al. [10] and Mousa[27], respectively.
Details of comparisons between the present saturated-liquid and-vapor-density data and results reported by other authors and calcu-lated with various correlations are given in Tables V and VI. Basicallythe agreement between the present data and the most reliable reportedresults from the literature is good, except for the data reported by Mousa[27] (AAD = 14%) and the data by Skaates and Kay [21] (AAD = 3.42%).These tables show that our data are consistent with most reported val-ues. Excellent agreement with AADs of 0.09, 0.13, and 0.25% is observedbetween the present measurements and the values of saturated-liquid den-sities reported by Sauermann et al. [13] and calculated from the EOS byDillon and Penoncello [46] and correlation of Hales and Ellender [32],respectively. The measurements by Costello and Bowden [36] deviate fromthe present values within 0.23%. The data of Zolin et al. [10] and the

206 Bazaev, Abdulagatov, Bazaev, and Abdurashidova
0 80 160 240 320 400 480 560 640 7200
1
2
3
4
5
6
7
8P
, MP
aEthanol
ρ, kg·m-3
Fig. 5. Measured values of pressure of ethanol as a function of density along the var-ious near-sub-critical isotherms together with values calculated with the Dillon and Pe-noncello [46] fundamental equation of state. ♦, 373.15 K; �, 423.15 K; •, 473.15 K; �,493.15 K; �, 498.15 K; ∇, 503.15 K; ×, 508.15 K; ©, 511.15 K; �, 513.15 K; �, 515.15 K;(—), Dillon and Penoncello [46]; (– – – –), coexistence curve [46].
correlation by Cibulka [47] show deviations within 0.89% and 0.80%,respectively. The saturated temperature data in the critical region reportedby Gasanov [39] are systematically higher (by 7–8 K) than the presentand other published data. Relatively large deviations are found betweenthe present measurements of saturated-vapor densities and reported dataand correlations. The values of saturated-vapor density calculated with theEOS by Dillon and Penoncello [46] deviate from the present data within0.58%, while the data of Mousa [27] and Skaates and Kay [21] show devi-ations up to 13.9 and 22%, respectively. The measurements by Costelloand Bowden [36] for the saturated vapor-density deviate from the presentdata within 2.8%.
The shape of the coexistence curve in the critical region for ethanolreported by various authors from the literature together with the presentresults is depicted in Fig. 10. This figure contains also the values of sat-urated densities derived in our calorimetric experiments [37] in the criti-cal region. A large scatter (up to 10 K for the saturated temperature and50% for the saturated density) of the various data sets and correlations is

PVT Measurements for Ethanol in the Critical Region 207
373 443 513 583 653
T, K
0
5
10
15
20
25P
S,M
Pa
Ethanol
ρ =276.55 kg·m-3
ρ =386 kg·m-3
PS=6.152 MPa
TS=513.91 KPS=5.988 MPa
TS=511.71 K
390 460 530 600 670
T, K
0
5
10
15
20
25
357 427 497 567 637
T, K
0
5
10
15
20
25
PS,M
Pa
ρ =338 kg·m-3
PS=6.268 MPaTS=514.61 K
Fig. 6. Intercept (isochoric break points) of the two- and one-phase isochores forethanol.
observed near the critical point (see Fig. 10). The same character of devi-ations is found also for the reported critical temperatures and the criticaldensities (see Section 3.2). As one can see from this figure, the most prob-able values of the critical temperature and critical density of ethanol liebetween 514.0 and 514.7 K and between 273 and 283 kg · m−3, respectively.Probably this relatively large range is due to impurity and thermal decom-position effects on the measured properties at high temperatures.
3.2. Critical Parameter Determination
The derived values of the saturated densities and pressure near thecritical point were used to estimate the critical parameters for pureethanol. Figure 11 shows the density differences (saturated-liquid and -vapor densities), �ρS = ρ′
S − ρ′′S, at saturation as a function of tempera-
ture in the critical region. This figure also includes the measured data for�ρS reported by Costello and Bowden [36] and by Young [73]. The fit-ting procedure was used to calculate the values of the critical parameters(TC and ρC) for ethanol. In order to estimate the value of the critical tem-perature, the values of �ρS =ρ′
S −ρ′′S were analytically extrapolated to zero

208 Bazaev, Abdulagatov, Bazaev, and Abdurashidova
Table III. Temperatures, Pressures, and Densities at Saturation for Pure Ethanol
TS (K) PS (MPa) ρ′S (kg · m−3) ρ′′
S (kg · m−3)
373.15 0.226 712.93 3.7500398.15 0.498 – –423.15 0.983 647.87 15.230473.15 2.945 555.23 50.010493.15 4.315 495.58 80.510498.15 4.715 476.56 91.690503.15 5.145 453.07 104.99508.15 5.583 420.33 124.47511.15 5.860 392.86 140.95512.15 5.954 – –513.15 6.085 361.08 160.00
(�ρS → 0, where the densities of the liquid and vapor become identical)using a scaling-type equation (see below). The optimal value of the tem-perature when �ρS =0 (where the difference between the liquid and vapor
0 100 200 300 400 500 600 700 800300
330
360
390
420
450
480
510
T, K
Ethanol
This workDillon and Penoncello [46]Cibulka [47]Critical point (this work)Hales and Ellender [32]Sauermann et al. [13]Mousa [27]Kalafati et al. [11]Skaates and Kay [21]Polikhronidi et al. [37]Takiguchi et al. [28]Fiock et al. [30]Costello and Bowden [36] Young [73]
ρ, kg·m-3
Fig. 7. Comparisons of the present saturated-liquid and -vapor densities for ethanolwith data reported by other authors from the literature and calculated with various cor-relations.

PVT Measurements for Ethanol in the Critical Region 209
300 320 340 360 380 400 420 440 460 480 500 520
T, K
0
1
2
3
4
5
6
7
8P
S, M
Pa
Ethanol
This workDillon and Penoncello [46]Critical PointDaek et al. [16]Sauermann et al. [13]Mousa [27]Kalafati et al. [11]Skaates and Kay [21]Lydersen and Tsochev [17]Zolin et al. [10]Takiguchi et al. [28]Butcher and Robinson [20]Niesen et al. [19]Khurma et al. [18]Kolbe and Gmehling [26]Storvick and Smith [31]Fiock et al. [30]
Fig. 8. Comparisons of the present vapor pressures for ethanol with data reported byvarious authors and calculated with the Dillon and Penoncello [46] fundamental equationof state.
4 8 12 16 20 24 28-1.0
-0.5
0.0
0.5
1.0
P, MPa
Ethanol
563.15 K638.15 K618.15 K521.15 K583.15 K543.15 K
623.15 K615.15 K513.15 K548.15 K518.15 K573.15 K523.15 K
613.15 K533.15 K653.15 K553.15 K528.15 K647.15 K
δρ,%
Fig. 9. Percentage deviations, δρ = 100(
ρexp−ρcal
ρexp
)of the present experimental densities
for ethanol from values calculated with the Dillon and Penoncello [46] fundamental equa-tion of state.

210 Bazaev, Abdulagatov, Bazaev, and Abdurashidova
Tab
leIV
.C
ompa
riso
nof
Vap
or-P
ress
ure
(MP
a)M
easu
rem
ents
ofE
than
olw
ith
Sele
cted
Lit
erat
ure
Val
ues
Am
bros
eD
illon
and
Kal
afat
iL
yder
sen
and
Mou
saSa
uerm
ann
Dea
kSk
aate
san
dZ
olin
TS
(K)
Thi
sw
ork
etal
.[2
2–25
]P
enon
cello
[46]
etal
.[1
1]a
Tso
chev
[17]
[27]
etal
.[1
3]et
al.
[16]
Kay
[21]
etal
.[1
0]
373.
150.
226
0.22
370.
2253
–0.
2405
a0.
2339
0.22
51–
–0.
230
398.
150.
498
0.50
120.
4969
–0.
5037
a0.
6759
0.49
73–
–0.
572
423.
150.
983
0.97
880.
9823
0.98
40.
9667
a1.
0365
0.97
950.
981
–0.
965
473.
152.
945
2.95
732.
9871
2.98
72.
9220
a2.
9696
2.95
352.
963
–3.
060
493.
154.
315
4.28
884.
3323
4.33
34.
2241
4.15
794.
2821
4.34
34.
2775
4.38
549
8.15
4.71
54.
6845
4.72
914.
751
4.61
454.
4955
4.67
764.
727
4.67
604.
822
503.
155.
145
5.10
865.
1523
5.18
05.
0372
4.84
965.
1022
5.10
65.
0980
5.22
450
8.15
5.57
35.
5636
5.60
345.
620
5.48
915.
2203
5.55
865.
576
5.55
00–
511.
155.
860
5.85
275.
8884
5.90
65.
7748
5.45
075.
8493
5.86
05.
8430
–51
2.15
5.95
45.
9528
5.98
596.
100
5.92
845.
6486
5.95
025.
965
5.94
07–
513.
156.
085
6.05
306.
0847
6.11
05.
9715
5.60
776.
0511
6.07
06.
0405
–A
AD
(%)
0.0
0.48
0.40
0.87
1.55
5.00
0.42
0.33
0.61
2.16
TS
(K)
Thi
sw
ork
Kol
bean
dN
iese
nB
utch
eran
dT
akig
uchi
Khu
rma
Fio
cket
al.
[30]
Stor
vick
and
Gm
ehlin
g[2
6]et
al.
[19]
Rob
inso
n[2
0]et
al.
[28]
etal
.[1
8]Sm
ith
[31]
373.
150.
226
0.23
3a–
–0.
234a
0.22
9a0.
226a
––
398.
150.
498
0.51
0a–
–0.
502a
0.50
1a0.
503a
––
423.
150.
983
0.98
2a1.
007a
1.00
9a–
––
1.02
9a–
473.
152.
945
––
––
––
2.91
6a–
493.
154.
315
––
––
––
4.13
7–
498.
154.
715
––
––
––
4.55
1a–
503.
155.
145
––
––
–4.
986a
–50
8.15
5.57
3–
––
––
–5.
516a
–51
1.15
5.86
0–
––
––
––
–51
2.15
5.95
4–
––
––
––
–51
3.15
6.08
5–
––
––
––
–A
AD
(%)
0.0
1.86
1.01
1.01
2.50
0.95
0.5
2.93
–
aA
naly
tica
llyin
terp
olat
edva
lues
.
PVT Measurements for Ethanol in the Critical Region 211
Tab
leV.
Com
pari
son
ofSa
tura
ted-
Liq
uid-
Den
sity
(kg
·m−3
)M
easu
rem
ents
ofE
than
olw
ith
Sele
cted
Lit
erat
ure
Val
ues
Dill
onan
dC
oste
lloan
dZ
olin
Hal
esan
dSk
aate
san
dSa
uerm
ann
Tak
iguc
hiF
iock
Pen
once
lloB
owde
net
al.
Elle
nder
Kay
etal
.et
al.
etal
.T
S(K
)T
his
wor
kC
ibul
ka[4
7][4
6][3
6][1
0]M
ousa
[27]
[32]
[21]
[13]
[28]
[30]
373.
1571
2.93
713.
8571
3.14
715.
771
4.35
–71
3.82
–71
3.55
713.
4671
5.82
423.
1564
7.87
649.
5264
8.27
648.
065
0.15
685.
3864
9.54
–64
8.52
––
473.
1555
5.23
552.
8655
4.66
556.
855
3.72
613.
6955
3.04
––
––
493.
1549
5.58
493.
6249
6.07
–49
0.14
572.
8749
6.00
486.
3–
––
498.
1547
6.56
472.
7147
6.24
–47
0.19
537.
8747
8.30
466.
8–
––
503.
1545
3.07
447.
2845
2.12
–44
4.06
526.
1845
7.93
443.
2−
−−
508.
1542
0.33
410.
5442
0.15
–41
6.28
509.
4043
2.14
411.
3–
––
511.
1539
2.86
–39
2.57
––
473.
7740
9.03
368.
2–
––
513.
1536
1.08
–36
2.84
––
393.
0737
7.30
339.
5–
––
AA
D(%
)0.
00.
800.
130.
230.
8913
.90.
253.
420.
090.
070.
40

212 Bazaev, Abdulagatov, Bazaev, and Abdurashidova
Table VI. Comparison of Saturated-Vapor-Density Measurements of Ethanol with SelectedLiterature Values
Dillon and Kalafati Skaates and Fiock Costello andPenoncello et al. Kay et al. Bowden
TS (K) This work [46] [11] Mousa [27] [21] [30] [36]
373.15 3.7500 3.5300 – – – 3.602 3.602423.15 15.230 14.973 14.580 31.180 – – –473.15 50.010 49.801 47.664 59.580 – – 50.8493.15 80.510 80.488 – 99.110 89.70 – –498.15 91.690 91.770 – 111.79 104.3 – –503.15 104.99 105.85 – 114.97 122.6 – –508.15 124.47 124.96 – 120.96 149.3 – –511.15 140.95 141.68 – 141.21 187.3 – –513.15 160.00 158.84 – 193.25 212.6 – –
AAD (%) 0.0 0.58 13.90 21.70 4.1 2.8
phases vanishes), was accepted as the critical temperature for ethanol. Thederived value of the critical temperature is 514.71±0.2 K. Because the iso-thermal compressibility of the fluid is infinite (KT → +∞) at the criticalpoint, it is difficult to accurately measure the critical density directly. Tocalculate the value of the critical density ρC the values of the saturateddensity ρS were fitted to the “complete scaling” relation [62,63],
�ρ =±B0tβ ±B1t
β+� +B2t1−α −B3t +B4t
2β, (1)
where �ρ = (ρ −ρC) /ρC; ρC is the critical density (considered as anadjustable parameter); t = (TC −T ) /TC; TC = 514.71 ± 0.2 K (the criticaltemperature is derived as described above); β = 0.324, α = 0.11, and � =0.51 are the universal critical exponents; and Bi(i =0,4) are the adjustablecritical amplitudes. A Yang–Yang anomaly of strength Rμ =Aμ/(AP +Aμ)
effect on the coexistence curve diameter is given by [62,63]
ρd =1+(B2t
1−α −B3t +B4t2β
), (2)
where ρd = (ρ′
S +ρ′′S
)/2ρC is the reduced coexistence curve diameter; B4 ∝
Aμ/AP , where Aμ, AP are the critical amplitudes of second temperaturederivatives of vapor-pressure curve, (d2P/dT 2), and chemical potential,(d2μ/dT 2), respectively. A Yang–Yang anomaly (d2μ/dT 2 →±∞) impliesa leading correction ρd ∝ B4t
2β would dominate the previously expectedρd ∝ B2t
1−α correction [62,63]. In Eq. (1), ±B0tβ is the asymptotic
(symmetric) term, ±B1tβ+� is the nonasymptotic (symmetric Wegner’s

PVT Measurements for Ethanol in the Critical Region 213
45 125 205 285 365 445 525470
478
486
494
502
510
518
EthanolT
, K
C=273.21 kg·m-3
Polikhronidi et al. [37]Loktev [38]Gasanov [39]Kalafati et al. [11]Mousa [27]Skaates and Kay [21]This workAmirkhanov and Kerimov [40]Costello and Bowden [36]Young [73]Dillon and Penoncello [46]Hales and Ellender [32]Cibulka [47]This work (Eq. 1)
TC=514.71 K
ρ, kg·m-3
ρ
Fig. 10. Shape of the coexistence curve for ethanol near the critical point reported byvarious authors from the literature and calculated with various correlations.
correction) term; B2t1−α is the “singular diameter” the first nonanalyti-
cal contribution to liquid-gas asymmetry; B4t2β is the new nonanalytical
contribution of liquid-gas asymmetry (“complete scaling” term), and B3t
is the rectilinear diameter. According to the theory of “complete scaling”(Eq. (1)), the first temperature derivative of the coexistence-curve diameterdiverges as the isochoric heat capacity (dρd/dT )∝ t−α and as (dρd/dT )∝t2β−1 (2β −1≈−0.352), i.e., the divergence is shared among the two terms,B2t
1−α and B4t2β . We accurately determined the critical amplitudes B2
and B4 from the present experimental data for ethanol (see Table VII), i.e.,the singular contribution of both terms. Figure 12 demonstrates that both(B2t
1−α) and (B4t2β ) represent nonanalytical contributions of the singu-
lar diameter of ethanol. If we define the strength of the coexistence curvediameter singularity as Bμ = B4/ (B4 +B2), like the Yang–Yang anom-aly of strength Rμ = Aμ/(AP + Aμ), then at Bμ = 0, therefore, B4 = 0,the divergence of the coexistence curve diameter, dρd/dτ , is caused bydivergence of only the B2t
1−α term in Eq. (1). However, if Bμ = 0, i.e.,B4 =0, the divergence of the coexistence curve diameter, dρd/dτ , is caused

214 Bazaev, Abdulagatov, Bazaev, and Abdurashidova
370 400 430 460 490 520
T, K T, K
0
90
180
270
360
450
540
630
720Ethanol
TC=514.71 K
This workCritical point (this work)Costello and Bowden [36]Young [73]
370 400 430 460 490 5200
1
2
3
4
5
6
7PC=6.268 MPa
This workCritical point (this work)
PS
, M
Pa
ΔρS ,
kg·m
-3
Fig. 11. Saturated-liquid and -vapor density differences, �ρS = ρ′S − ρ′′
S , and vaporpressure of the ethanol near the critical point.
by divergence of both B2t1−α and B4t
2β terms in Eq. (1). As one cansee from Table VII, the value of B4 = 0; therefore, Bμ = 0 (Bμ = 0.13 forethanol). For ethanol, the value of the critical amplitude B4 (B4t
2β) issmall and negative (−0.9442), while the value of the critical amplitude B2is large and positive (6.2812). Therefore, both nonanalytical contributionsto the singular diameter of ethanol partially compensate each other, andas previously shown by Anisimov and Wang [64], create an illusion thatthe diameter is rectilinear (see Fig. 12). Thus, the present experimentaldata for the coexistence curve diameter exhibit slight deviations from thestraight lines (rectilinearity). As shown previously by Anisimov and Wang[64], for some fluids (for example, SF6, n-C7H16) the term B4t
2β is domi-nant, while for other fluids such as Ne, N2, and CH4, the contribution ofthe B4t
2β term is negative and small, such as our case for ethanol. Thus,the divergence of the coexistence curve diameter, dρd/dτ , for ethanol isshared between the terms B2t
1−α and B4t2β ; moreover, the contribution of
the B2t1−α term is dominant, although for some fluids depending on the
effect of their nature on coexistence curve asymmetry, the domination ofthe B4t
2β is possible (see, for example, Ref. 64).Usually, the value of the critical density determined from the singular
diameter law is less than that obtained from the linear extrapolation (fromrectilinear law). In some cases the resulting difference between “rectilinear”

PVT Measurements for Ethanol in the Critical Region 215
Table VII. Coefficients Biand Pi for Eqs. (1) and (3)
B0 B1 B2 B3 B4 Thermodynamic path
2.2992 −0.6732 6.2812 4.6700 −0.9442 Along the coexistence curveP1 P2 P3 – – Thermodynamic path183.6693 −146.3741 −56.1697 – – Vapor-pressure curve
TC = 514.71 ± 0.2 K, ρC = 273.21 ± 2 kg · m−3, PC = 6.268 ± 0.008 MPa; α = 0.11; β = 0.324;�=0.51
0.000 0.008 0.016 0.024 0.032 0.040 0.048t
0.80
0.88
0.96
1.04
1.12
1.20
1.28
(L+
V)/
2c
EthanolB2t1-α
B4t2
Eq. (2))(1- α term
2 term
d
β
ρ
ρρ
ρ
β
Fig. 12. Singular diameters for ethanol.
and “singular” diameter techniques for the critical density determination isabout 3–5%. For ethanol most available data for the critical density differby ±2 kg · m−3 (or about 1%). This is indirectly confirming that the diame-ter of the ethanol is close to rectilinear. The derived optimal value of ρC =273.21±2 kg · m−3 was accepted as the critical density for ethanol.
The present saturated-pressure values were analytically extrapolated,by using the scaling relation near the critical point,
PS =PC +P1t2−α +P2t
2−α+� +P3t (3)

216 Bazaev, Abdulagatov, Bazaev, and Abdurashidova
to the value of the derived critical temperature (TC = 514.71 K) (seeFig. 11b). The derived value of the critical pressure for ethanol is PC =6.268 ± 0.008 MPa. The values of the adjustable parameters of Eq. (3)are given in Table VII. The present derived values of the critical param-eters for pure ethanol (TC = 514.71 ± 0.2 K, ρC = 273.21 ± 2 kg · m−3, PC =6.268 ± 0.008 MPa) are in satisfactory agreement with the most reliablereported values. Differences between the critical temperature, density, andpressure recommended by Gude and Teja [48] and the present results are0.71 K, 0.65, and 2.1%, respectively. Dillon and Penoncello [46] recom-mended values of the critical parameters that deviate from the present databy 0.81 K, 1.0, and 1.95%, respectively. Our recent calorimetric measure-ment results for the critical parameters (TC and ρC) deviate from the pres-ent PVT experimental results within 0.27 K and 3.3%. The present resultsfor the critical parameters are also good (0.2–0.6 K, 0.02–0.08 MPa, and2–3 kg · m−3), based on comparisons with data reported by other authors[17,22,32,65–73]. Large differences (up to 2–3 K , for the critical tempera-ture) were found for data reported by other authors [17,31,36,74–82] and(10–45 kg · m−3 for the critical density) were found for data reported byPolikhronidi et al. [37], Battelli [66], and Ramsay and Young [77].
4. CONCLUSIONS
Densities of pure ethanol along 33 near-critical and supercritical iso-therms between 373 and 673 K and at pressures from 0.226 to 40.292 MPahave been measured with a constant-volume piezometer technique. Thedensity ranged from 91.81 to 497.67 kg · m−3. The measured values ofPVT in the two- and one-phase regions were used to accurately deter-mine the values of the vapor pressure and saturated-liquid and -vapordensities in the temperature range from 373 to 513 K by using analyti-cal extrapolation and the break-point technique. The critical parameters(TC =514.71±0.2 K, ρC =273.21±2 kg · m−3, PC =6.268±0.008 MPa) forpure ethanol were determined from measured values of saturation proper-ties using a fitting procedure. The measured PVT data and saturated prop-erties are in good agreement (AAD = 0.49%) with values calculated fromthe fundamental equation of state by Dillon and Penoncello [46]. Largediscrepancies (up to 10 K and 50%) were found between various reportedsaturated- and critical-properties data for ethanol in the critical region.Derived values of the saturation densities and vapor pressure were used todevelop scaling-type correlation equations in the critical region. The sin-gularity of the coexistence-curve diameter is caused by divergence of bothB2t
1−α and B4t2β terms in the “complete scaling” equation. For ethanol

PVT Measurements for Ethanol in the Critical Region 217
the value of the coexistence-diameter singularity strength defined as Bμ
is not zero. But, both nonanalytical contributions, B2t1−α and B4t
2β , ofthe singular diameter partially compensate each other (the coefficients B2and B4 have opposite signs), and the diameter of ethanol is very close torectilinear.
ACKNOWLEDGMENTS
One of us, I.M.A., thanks the Physical and Chemical Properties Divi-sion at the National Institute of Standards and Technology for the oppor-tunity to work as a Guest Researcher at NIST during the course of thisresearch. We also thank Dr. G. Rabadanov for the chromatography anal-ysis of the methanol sample before and after experiments.
REFERENCES
1. M. Budich and G. Brunner, J. Supercrit. Fluids 25:45 (2003).2. J. S. Lim and Y. Y. Lee, J. Supercrit. Fluids 7:219 (1994).3. N. Ikawa, Y. Nagase, T. Tada, S. Furuta, and R. Fukuzato, Fluid Phase Equilib. 83:167
(1993).4. R. Fukuzato, N. Ikawa, and Y. Nagase, in Value Adding through Solvent Extraction, D. C.
Shallcross, R. Painmin, and L. M. Prvcic, eds. (University of Melbourne, Australia, 1996),Vol. 2, p. 1011.
5. S. Hirohama, T. Takatsuka, S. Miyamoto, and T. Muto, J. Chem. Eng. Jpn. 26:243 (1993).6. S. Furuta, N. Ikawa, R. Furuzato, and N. Imanishi, Kagaku Kogaku Ronbunshu 15:519
(1989).7. J. Schanzenbacher, J. D. Taylor, and J. W. Tester, J. Supercrit. Fluids 22:139 (2002).8. O. J. Catchpole, N. B. Perry, B. M. T. de Silva, J. B. Grey, and B. M. Smallfield, J. Super-
crit. Fluids 22:129 (2002).9. I. F. Golubev, T. N. Vasil’kovskaya, and V. S. Zolin, Inzh.-Fiz. Zh. 38:668 (1980).
10. V. S. Zolin, T. N. Vasil’kovskaya, and I. F. Golubev, Thermophys. Prop. Subst. Mater.18:20 (1983).
11. D. D. Kalafati, D. S. Rasskazov, and E. K. Petrov, Teploenergetika 14:77 (1967).12. H. Y. Lo and L. I. Stiel, Ind. Eng. Chem. Fund. 8:713 (1969).13. P. Sauermann, K. Holzapfel, J. Oprzynski, F. Kohler, W. Poot, and Th. W. de Loos, Fluid
Phase Equilib. 112:249 (1995).14. V. G. Tamman and A. Ruhenbeck, Ann. Phys. 13:63 (1932).15. V. N. Popov and B. A. Malov , Trud. Moscow Power Eng. Institute (Moscow, MEI, 1971),
pp. 2–11.16. A. Deak, A. I. Victorov, and Th. W. de Loos, Fluid Phase Equilib. 107:277 (1995).17. A. L. Lydersen and V. Tsochev, Chem. Eng. Technol. 13:125 (1990).18. J. R. Khurma, O. Muthu, S. Munjal, and B. D. Smith, J. Chem. Eng. Data 28:100 (1983).19. V. Niesen, A. M. F. Palavre, A. J. Kidney, and V. F. Yesavage, Fluid Phase Equilib. 31:283
(1986).20. K. L. Butcher and W. I. Robinson, J. Appl. Chem. 16:289 (1966).21. J. M. Skaates and W. B. Kay, Chem. Eng. Sci. 19:431 (1964).

218 Bazaev, Abdulagatov, Bazaev, and Abdurashidova
22. D. Ambrose and J. Walton, Pure Appl. Chem. 61:1395 (1989).23. D. Ambrose and C. H. S. Sprake, J. Chem. Thermodyn. 2:631 (1970).24. D. Ambrose, J. H. Ellender, and C. H. S. Sprake, J. Chem. Thermodyn. 6:909 (1974).25. D. Ambrose, C. H. S. Sprake, and R. Townsend, J. Chem. Thermodyn. 7:185 (1975).26. B. Kolbe and J. Gmehling, Fluid Phase Equilib. 23:213 (1985).27. A. H. N. Mousa, J. Chem. Eng. Jap. 20:635 (1987).28. Y. Takiguchi, M. Kamiya, and M. Uematsu, Nippon Kikai Gakkai Ronbunshu B Hen
61:644 (1995).29. B. D. Smith and R. Srivastava, Thermodynamic Data for Pure Compounds (Elsevier,
Amsterdam, 1986).30. E. Fiock, D. C. Ginnings, and W. B. Holton, J. Res. Nat. Bur. Stand. 6:881 (1931).31. T. S. Storvick and J. M. Smith, J. Chem. Eng. Data 5:133 (1960).32. J. L. Hales and J. H. Ellender, J. Chem. Thermodyn. 8:1177 (1976).33. V. F. Nozdrev, Ultrasonic technique in molecular physics (Moscow, Nauka, 1958).34. Y. Takiguchi and M. Uematsu, Int. J. Thermophys. 16:205 (1995).35. Y. Takiguchi and M. Uematsu, J. Chem. Thermodyn. 28:7 (1996).36. J. M. Costello and S. T. Bowden, Rec. Trav. Chim. Pays-Bas 77:36 (1958)37. N. G. Polikhronidi, I. M. Abdulagatov, G. V. Stepanov, and R. G. Batyrova J. Supercrit.
Fluids (2007), submitted.38. S. M. Loktev, High Fat Alcohols (Khimiya, Moscow, 1970).39. N. S. Gasanov, Ph. D. Thesis (Dushanbe, 1972).40. Kh. I. Amirkhanov and A. M. Kerimov, Russ. J. Phys. Chem. 32:1697 (1958).41. A. M. Kerimov, M. K. Alieva, and N. S. Gasanov, Izv. AN Azerb. Ser. Phys. & Math.
4:149 (1971).42. H. Kitajima, N. Kagawa, S. Tsuruno, and H. Endo, Trans. Jpn. Soc. Mech. Eng. Ser. B
69:1921 (2003).43. K. G. Akhmetzyanov, Vest. Moscovskogo Universiteta 6:93 (1949)44. M. D. Vine and C. J. Wormald , J. Chem. Thermodyn. 21:1151 (1989).45. M. Radosz and A. Lydersen, Chem. Ing. Tech. 52:756 (1980).46. H. E. Dillon and S. G. Penoncello, Int. J. Thermophys. 25:321 (2004).47. I. Cibulka, Fluid Phase Equilib. 89:1 (1993).48. M. Gude and A. S. Teja, J. Chem. Eng. Data 40:1025 (1995).49. I. M. Abdulagatov, A. R. Bazaev, and A. E. Ramazanova, Int. J. Thermophys. 14:231
(1993).50. I. M. Abdulagatov, A. R. Bazaev, E. A. Bazaev, M. B. Saidakhmedova, and A. E. Ram-
azanova, J. Chem. Eng. Data 43:451 (1998).51. I. M. Abdulagatov, A. R. Bazaev, E. A. Bazaev, M. B. Saidakhmedova, and A. E. Ram-
azanova, Fluid Phase Equilib. 150:537 (1998).52. I. M. Abdulagatov, A. R. Bazaev, E. A. Bazaev, and M. G. Rabezkii, J. Supercrit. Fluids
19:219 (2001).53. I. M. Abdulagatov, A. R. Bazaev, J. W. Magee, S. B. Kiselev, and J. F. Ely, Ind. Eng.
Chem. Res. 44:1967 (2005).54. A. R. Bazaev, I. M. Abdulagatov, E. A. Bazaev, A. A. Abdurashidova, and A. E. Ram-
azanova, J. Supercrit. Fluids (in press).55. A. R. Bazaev, I. M. Abdulagatov, J. W. Magee, E. A. Bazaev, and M. G. Rabezkii, J.
Chem. Eng. Data 46:1089 (2001).56. A. R. Bazaev, I. M. Abdulagatov, J. W. Magee, E. A. Bazaev, and A. E. Ramazanova, J.
Supercrit. Fluids 26:115 (2003).57. A. R. Bazaev, I. M. Abdulagatov, J. W. Magee, E. A. Bazaev, A. E. Ramazanova, and A.
A. Abdurashidova, Int. J. Thermophys. 25:804 (2004).
PVT Measurements for Ethanol in the Critical Region 219
58. A. R. Bazaev, I. M. Abdulagatov, E. A. Bazaev, and A. A. Abdurashidova, J. Chem.Thermodyn. 39:385 (2007).
59. M. G. Rabezkii, A. R. Bazaev, I. M. Abdulagatov, J. W. Magee, and E. A. Bazaev, J.Chem. Eng. Data 46:1610 (2001).
60. W. Wagner and A. Pruß, J. Phys. Chem. Ref. Data 31:387 (2002).61. A. R. Bazaev, Heat Transfer 1:113 (1988).62. M. E. Fisher and G. Orkoulas, Phys. Rev. Lett. 85:696 (2000).63. Y. C. Kim, M. E. Fisher, and G. Orkoulas, Phys. Rev. E 67:061506 (2003).64. M. A. Anisimov and J. Wang, Phys. Rev. Lett. 97:025703-1 (2006).65. R. Fischer and T. Reichel, Mikrochemie 31:102 (1943).66. A. Battelli, Mem. Torino 44:57 (1893).67. R. F. Mocharnyuk, Zh. Obsh. Khim. 30:1098 (1960).68. R. C. Wilhoit and B. J. Zwolinski, J. Phys. Chem. Ref. Data 2:(1973), Supplement I.69. D. J. Rosenthal and A. S. Teja, Ind. Eng. Chem. Res. 28:1693 (1989).70. T. Hu, Zh. Qin, G. Wang, X. Hou, and J. Wang, J. Chem. Eng. Data 49:1809 (2004).71. S. M. Loktev, High Fat Alcohols (Khimiya, Moscow, 1970).72. Yu. V. Efremov, Russ. J. Phys. Chem. 40:1240 (1966).73. S. Young, Sci. Proc. Roy. Dublin Soc. 21:374 (1910).74. J. Griswold, J. D. Haney, and V. A. Klein, Ind. Eng. Chem. 35:701 (1943).75. A. Z. Golik, S. D. Ravikovich, and A. V. Orishchenko, Ukr. Khim. Zh. 21:167 (1955).76. V. F. Nozdrev, Akust. Zh. 2:209 (1956).77. W. Ramsay and S. Young, Phyl. Trans. Roy. Soc. (London) A 178:313 (1887).78. L. Crismer, Bull. Soc. Chim. Belg. 18:18 (1904).79. M. T. Ratzsch and G. Strauch, Z. Phys. Chem. (Leipzig) 249:243 (1972).80. W. L. Marshall and E. V. Jones, Inorg. Nucl. Chem. 36:2319 (1974).81. H. K. Ross, Ind. Eng. Chem. 46:601 (1954).82. K. A. Kobe and R. E. Lynn, Chem. Rev. 52:117 (1953).