Embed Size (px)
Citation preview
Modeling phosphorus in the upper Etowah River basin:identifying sources under uncertainty
Z. Lin*, D.E. Radcliffe** , M.B. Beck*** and L.M. Risse****
*BCI Engineers & Scientists, Inc., Lakel and, FL 33803, USA (E-mail: [email protected])
**Department of Crop and Soil Sciences, University of Georgia, Athens, GA 30602, USA
(E-mail: [email protected])
***Warnell School of Forestry and Natural Resources, University of Georgia, Athens, GA 30602, USA
(E-mail: [email protected])
****Department of Biological and Agricultural Engineering, University of Georgia, Athens, GA 30602, USA
(E-mail: [email protected])
Abstract The Uniform Covering by Probabilistic Rejection (UCPR) algorithm was used, in conjunction with
the Soil and Water Assessment Tool (SWAT) model, to identify P loads from point source and nonpoint
source polluters in the upper Etowah River basin (UERB) in Georgia. The key findings of the research are as
follows. The mean absolute error was preferred over the root mean square error as a search criterion for the
UCPR algorithm when water quality observations are scarce. The undocumented P load from point sources
in the UERB was consistently estimated as about 43 kg/d by the proposed method; but the method was not
able to identify the broiler litter application rate to the poultry/beef operation pastures. Point sources (both
documented and undocumented), poultry/beef operation pastures, and forests are the three major
contributors of P. During 1992-1996, on average they accounted for 36.4, 31.7, and 17.2% of P load from
the UERB, respectively.
Keywords Etowah River basin; phosphorus; SWAT; total maximum daily load; uniform covering by
probabilistic rejection
Introduction
Rapid population and economic growth around the Atlanta area in the past decades
have imposed increasing threats to the water quality of surrounding water bodies. Lake
Allatoona, a reservoir built on the Etowah River, is located about 50 km northwest of
Metropolitan Atlanta. It supplies drinking water for Atlanta suburban counties and
receives stormwater and wastewater treatment plant discharges from these areas. A
comprehensive study of water quality in Lake Allatoona (the Lake Allatoona Phase I
Clean Lakes Diagnostic Feasibility Study, referred to hereafter as the Clean Lakes Study)
was conducted under two Clean Lakes Section 319 projects during the 1990’s (Rose,
1999). From May 1992 to April 1993, infrequent samples of phosphorus (P) concen-
trations and stream flow were measured at the points where the 11 main tributaries enter
Lake Allatoona. Annual loads were calculated by summing the products of the measured
P concentration, measured flow, and interval between sampling dates. The Clean Lakes
Study classified Lake Allatoona as being in transition between mesotrophic and eutrophic,
with P being the primary limiting nutrient for algal growth (Rose, 1999). It was
concluded that unless measures were taken to control P inputs to the lake, Lake Allatoona
would be unfit for drinking or recreational purposes within ten years. As a result, the
Georgia Environmental Protection Division (GAEPD) has imposed a P load restriction of
not more than 4.79 mg/L (1.3 lb/acre-ft) of lake volume per year (GAEPD, 2004) and
has listed the entire lake as “not fully supporting the designated uses”(GAEPD, 2006).
Water
Science
&T
echnolo
gy
Vo
l5
6N
o6
pp
29
–3
7Q
IWA
Pub
lishing2
00
7
29doi: 10.2166/wst.2007.584
A lake-wide Total Maximum Daily Load (TMDL) for P is scheduled to be developed
by 2009.
The Clean Lakes Study also concluded that, among the 11 main tributaries to Lake
Allatoona, the upper Etowah River basin (UERB) contributed about 80 percent of the total P
loading to the lake. The UERB is also a place where more than 50 million chicken broilers
are raised in a year (2005 Georgia Farm Gate Value Reports, http://www.agecon.uga.edu/
, caed/staffreports.htm, last accessed on 20 June 2007). A typical broiler operation also
raises beef cattle on pastures where broiler litter is applied. Pierson et al. (2001) showed that
application of broiler litter to grasslands can significantly increase dissolved reactive phos-
phorus concentrations in surface runoff. However, it is extremely difficult to estimate P loads
from the poultry/beef operation pastures, because the areas of pastures receiving broiler litter
and the rate of the broiler litter application to the pasture are usually unknown. Moreover,
contrary to the common perception that point source pollution is easier to quantify, it is
difficult to estimate the P loads from poultry processing or rendering plants located in the
UERB. It was common that these plants were not required by their National Pollutant Dis-
charge Elimination System permits to monitor or remove phosphorus from their effluent.
According to the GAEPD Cartersville Regional Office’s archives (Buckles, 2005, personal
communication), only one poultry processing plant in the UERB has been required to moni-
tor P concentrations in the plant’s discharge and report them in the Discharge Monthly
Reports (DMRs) since 2002. Two previous studies (Rose, 1999; Harned et al., 2004) sub-
stantially underestimated the percentage of P loads from point sources vs. the total P load
from the UERB to Lake Allatoona because of incomplete point source data.
In a TMDL development and implementation program, it is important to be able to differ-
entiate the P loading sources in the watershed of interest so that the most effective and optimal
watershed management strategies can be adopted. Because of such an inherently uncertain
situation, it is proposed to use the set-theoretic Uniform Covering by Probabilistic Rejection
(UCPR) algorithm, in conjunction with the SWAT model, to systematically estimate the P
loads from point source and nonpoint source polluters in the UERB to provide valuable infor-
mation for the subsequent P load estimation and TMDL development for Lake Allatoona.
Materials and methods
The upper Etowah River basin model
In this research, the SWAT model (Arnold et al., 1998) was used to simulate P transport
in the UERB. From the U.S. Geological Survey (USGS) gauging station at Canton, GA,
an area was delineated called the upper Etowah River basin that covered approximately
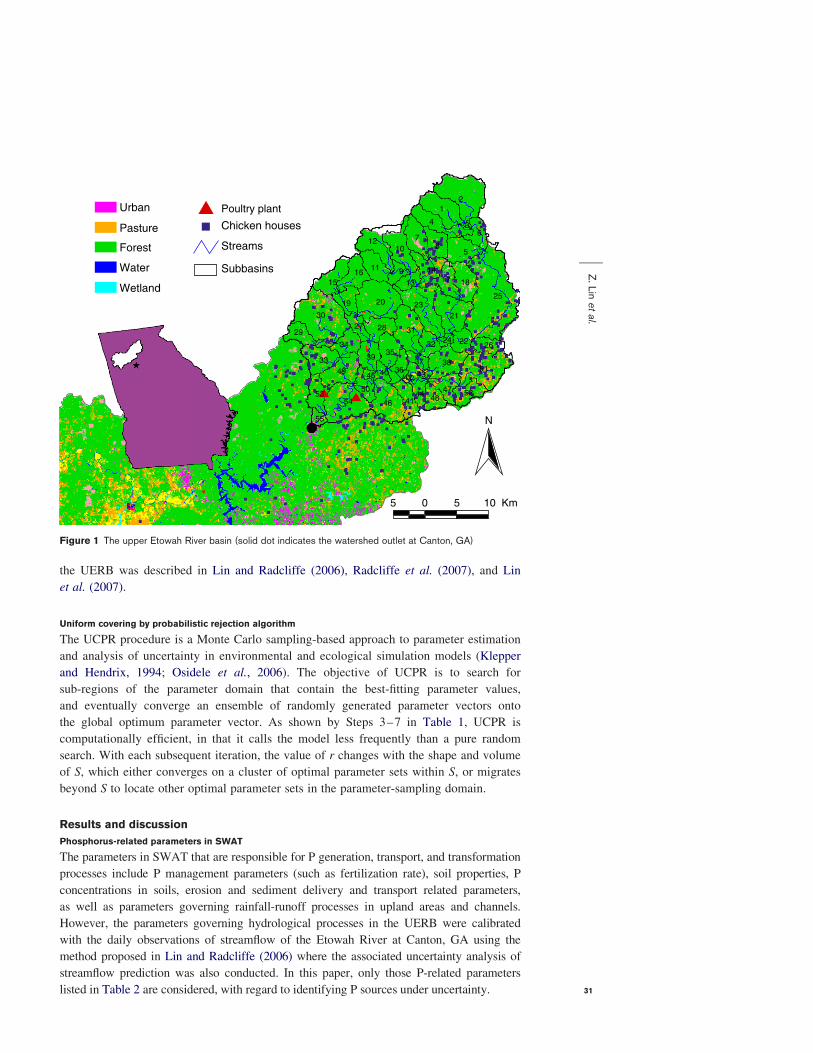
1619 square kilometres. The watershed was subdivided into 55 sub-basins (Figure 1) and
291 HRUs. The primary land covers were forest (90.3%), grassland/pasture (7.8%), and
urban (1.6%); row crop agriculture land use was about 0.3%. The land use data were
obtained from the National Land Cover Dataset from 1991 to 1992 and the soils data
were obtained from the State Soil Geographic (STATSGO) database. The major soil
associations in the UERB are sandy loams, loams, and clayey loams, with Natural
Resources Conservation Service hydrologic group categories of B and C, having slow to
moderate infiltration rates. Precipitation and temperature data from six National Oceanic
and Atmospheric Administration weather stations were obtained to drive the UERB
SWAT model. Historic average annual precipitation in the UERB is about 1,500 mm;
while the historic average yearly minimum and maximum atmospheric temperatures
are around 214.5 and 34.5 8C. Daily stream flow observations were obtained from
the USGS gauging station at Canton, GA (No. 02392000). Infrequent total P concen-
tration observations at the same station were measured by the Clean Lakes Study during
May 1992-May 1996 (Rose, 1999). The modeling of hydrology and phosphorus for
Z.Lin
etal.
30
the UERB was described in Lin and Radcliffe (2006), Radcliffe et al. (2007), and Lin
et al. (2007).
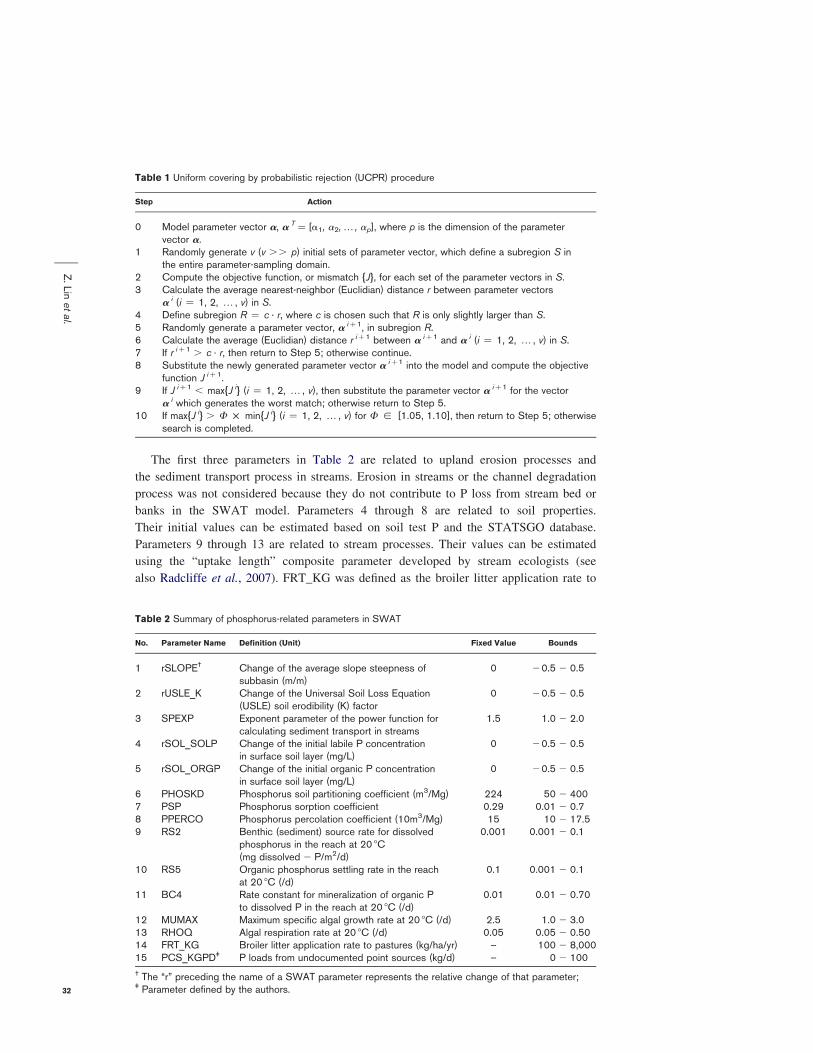
Uniform covering by probabilistic rejection algorithm
The UCPR procedure is a Monte Carlo sampling-based approach to parameter estimation
and analysis of uncertainty in environmental and ecological simulation models (Klepper
and Hendrix, 1994; Osidele et al., 2006). The objective of UCPR is to search for
sub-regions of the parameter domain that contain the best-fitting parameter values,
and eventually converge an ensemble of randomly generated parameter vectors onto
the global optimum parameter vector. As shown by Steps 3–7 in Table 1, UCPR is
computationally efficient, in that it calls the model less frequently than a pure random
search. With each subsequent iteration, the value of r changes with the shape and volume
of S, which either converges on a cluster of optimal parameter sets within S, or migrates
beyond S to locate other optimal parameter sets in the parameter-sampling domain.
Results and discussion
Phosphorus-related parameters in SWAT
The parameters in SWAT that are responsible for P generation, transport, and transformation
processes include P management parameters (such as fertilization rate), soil properties, P
concentrations in soils, erosion and sediment delivery and transport related parameters,
as well as parameters governing rainfall-runoff processes in upland areas and channels.
However, the parameters governing hydrological processes in the UERB were calibrated
with the daily observations of streamflow of the Etowah River at Canton, GA using the
method proposed in Lin and Radcliffe (2006) where the associated uncertainty analysis of
streamflow prediction was also conducted. In this paper, only those P-related parameters
listed in Table 2 are considered, with regard to identifying P sources under uncertainty.
Figure 1 The upper Etowah River basin (solid dot indicates the watershed outlet at Canton, GA)
Z.Lin
etal.
31
The first three parameters in Table 2 are related to upland erosion processes and
the sediment transport process in streams. Erosion in streams or the channel degradation
process was not considered because they do not contribute to P loss from stream bed or
banks in the SWAT model. Parameters 4 through 8 are related to soil properties.
Their initial values can be estimated based on soil test P and the STATSGO database.
Parameters 9 through 13 are related to stream processes. Their values can be estimated
using the “uptake length” composite parameter developed by stream ecologists (see
also Radcliffe et al., 2007). FRT_KG was defined as the broiler litter application rate to
Table 1 Uniform covering by probabilistic rejection (UCPR) procedure
Step Action
0 Model parameter vector a, a T ¼ [a1, a2,… , ap], where p is the dimension of the parametervector a.
1 Randomly generate v (v .. p) initial sets of parameter vector, which define a subregion S inthe entire parameter-sampling domain.
2 Compute the objective function, or mismatch {J}, for each set of the parameter vectors in S.3 Calculate the average nearest-neighbor (Euclidian) distance r between parameter vectors
a i (i ¼ 1, 2, … , v) in S.4 Define subregion R ¼ c · r, where c is chosen such that R is only slightly larger than S.5 Randomly generate a parameter vector, a iþ1, in subregion R.6 Calculate the average (Euclidian) distance r iþ1 between a iþ1 and a i (i ¼ 1, 2, … , v) in S.7 If r iþ1 . c · r, then return to Step 5; otherwise continue.8 Substitute the newly generated parameter vector a iþ1 into the model and compute the objective
function J iþ1.9 If J iþ1 , max{J i} (i ¼ 1, 2, … , v), then substitute the parameter vector a iþ1 for the vector
a i which generates the worst match; otherwise return to Step 5.10 If max{J i} . F £ min{J i} (i ¼ 1, 2, … , v) for F [ [1.05, 1.10], then return to Step 5; otherwise
search is completed.
Table 2 Summary of phosphorus-related parameters in SWAT
No. Parameter Name Definition (Unit) Fixed Value Bounds
1 rSLOPE† Change of the average slope steepness ofsubbasin (m/m)
0 20.5 2 0.5
2 rUSLE_K Change of the Universal Soil Loss Equation(USLE) soil erodibility (K) factor
0 20.5 2 0.5
3 SPEXP Exponent parameter of the power function forcalculating sediment transport in streams
1.5 1.0 2 2.0
4 rSOL_SOLP Change of the initial labile P concentrationin surface soil layer (mg/L)
0 20.5 2 0.5
5 rSOL_ORGP Change of the initial organic P concentrationin surface soil layer (mg/L)
0 20.5 2 0.5
6 PHOSKD Phosphorus soil partitioning coefficient (m3/Mg) 224 50 2 4007 PSP Phosphorus sorption coefficient 0.29 0.01 2 0.78 PPERCO Phosphorus percolation coefficient (10m3/Mg) 15 10 2 17.59 RS2 Benthic (sediment) source rate for dissolved
phosphorus in the reach at 20 8C(mg dissolved 2 P/m2/d)
0.001 0.001 2 0.1
10 RS5 Organic phosphorus settling rate in the reachat 20 8C (/d)
0.1 0.001 2 0.1
11 BC4 Rate constant for mineralization of organic Pto dissolved P in the reach at 20 8C (/d)
0.01 0.01 2 0.70
12 MUMAX Maximum specific algal growth rate at 20 8C (/d) 2.5 1.0 2 3.013 RHOQ Algal respiration rate at 20 8C (/d) 0.05 0.05 2 0.5014 FRT_KG Broiler litter application rate to pastures (kg/ha/yr) – 100 2 8,00015 PCS_KGPD‡ P loads from undocumented point sources (kg/d) – 0 2 100
† The “r” preceding the name of a SWAT parameter represents the relative change of that parameter;‡ Parameter defined by the authors.
Z.Lin
etal.
32
poultry/beef operation pastures. But it does not necessarily represent the P source solely
from the poultry/beef operations. It also serves as a surrogate of nonpoint sources of P
that were not taken into account by the UERB SWAT model. It may include any non-
point sources of P which do not consist of a constant flow of P load to a receiving water
body. PCS_KGPD represents the P load from the undocumented point sources, for which
any monitoring data were not available. These sources could include leaking sewer lines
or malfunctioning septic systems. The documented point source P loads estimated based
on DMRs were already incorporated into the UERB SWAT model as fixed values which
were not subject to subsequent uncertainty analysis.
Selecting a search criterion for UCPR
The usage of the UCPR algorithm for model calibration and uncertainty analysis depends
on a suitable criterion, which is a measure of the model’s performance in fitting obser-
vations, to guide the algorithm in searching for a cluster of optimal parameter sets in the
model’s parameter domain. A single-valued (weighted) objective function or a binary
classification of “acceptable” or “unacceptable” model simulation in comparison with
the observed data can be used. In this paper, three types of single-valued objective
functions that measure the discrepancy between the SWAT simulated and the observed P
concentrations in the Etowah River at Canton, GA were evaluated. They are Root Mean
Square Error (RMSE), Mean Absolute Error (MAE), and Matching Ratio (MR). The first
two criteria are commonly used in flow and water quality modeling and need no further
explanation. The third criterion was designed to treat each observation of P concentration
equally, regardless of its numerical magnitude. The denominator of MR is the total
number of P observations; while the numerator of MR is a summation of a unit function,
which takes the value of unity whenever the simulated P concentration at a given time is
close enough to the observed P concentration at the same time (a “match”); otherwise it
is zero (no “match”). A “match” is defined as a simulated P concentration at a given time
that falls within the error bound of the observed P concentration. Harmel et al. (2006)
suggested that the error bound for P could be as high as ^90%.
In the analysis, except for FRT_KG and PCS_KGPD, all P-related parameters took
their fixed values listed in Table 2. Based on the Georgia Farm Gate Value Reports, the
total broiler litter produced annually by the poultry/beef operations in the UERB
was about 63,000 ton/yr. It was also estimated that there were 8,400 ha of poultry/beef
pastures in the UERB. Therefore, the upper limit of the broiler litter application rate
(FRT_KG) was selected as 8,000 kg/ha/yr. On the other hand, the total P load from the
documented point sources was about 55 kg/d estimated from the DMRs. But the DMRs
for the two poultry processing or rendering plants located in the UERB (see Figure 1)
were only available after their wastewater treatment units were upgraded in the early
21st century. It is believed that the P loads from these plants could have been much
higher during the 1992 to 1996 modeling period. This may compose the major com-
ponent of the P load from the undocumented point sources. Hence, 100 kg/d was selected
as the upper limit for PCS_KGPD.
The results of using the three different criteria to guide the search of the UCPR
algorithm are shown in Figure 2. It is not surprising that the RMSE produced a conver-
gence for parameter FRT_KG since it was heavily influenced by the high values of P
concentration recorded under storm flow condition which, in turn, resulted from the
nonpoint sources of P loads from the uplands. But RMSE failed to further narrow down
the range of PCS_KGPD, the undocumented point sources of P. On the contrary, MR
converged on PCS_KGPD, but failed on FRT_KG. This is because the majority of the P
concentration measurements were recorded under baseflow condition. Only 10 out of 41
Z.Lin
etal.
33
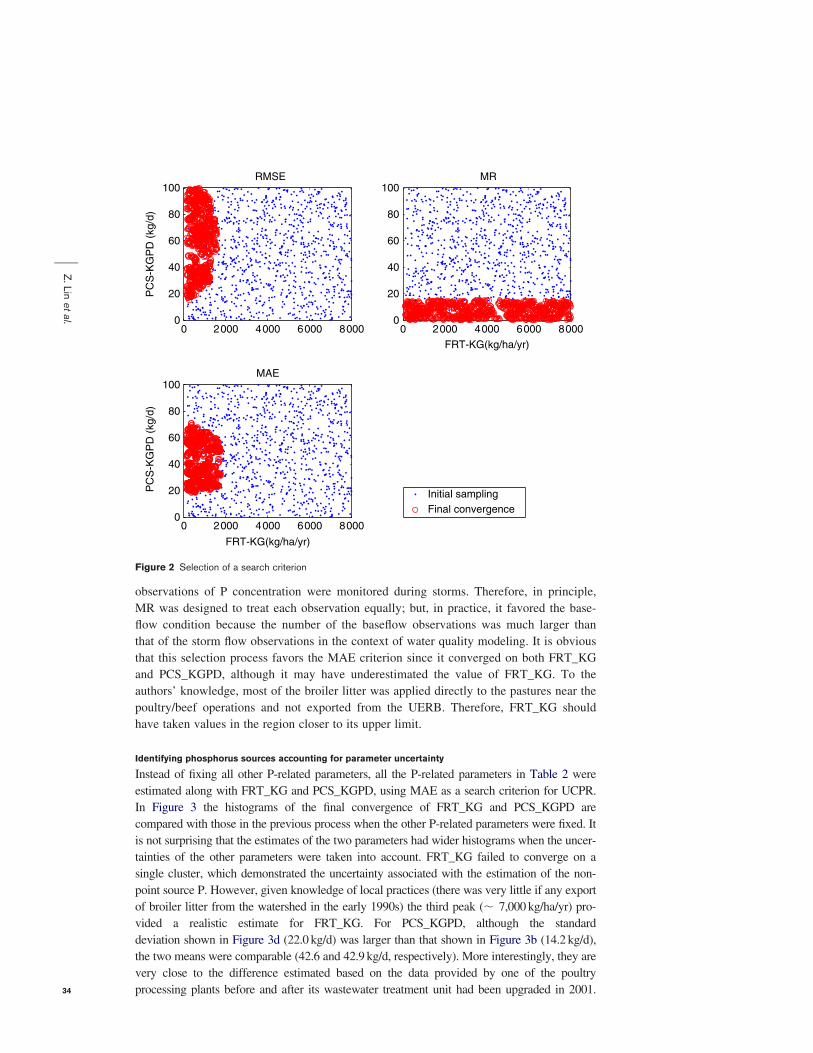
observations of P concentration were monitored during storms. Therefore, in principle,
MR was designed to treat each observation equally; but, in practice, it favored the base-
flow condition because the number of the baseflow observations was much larger than
that of the storm flow observations in the context of water quality modeling. It is obvious
that this selection process favors the MAE criterion since it converged on both FRT_KG
and PCS_KGPD, although it may have underestimated the value of FRT_KG. To the
authors’ knowledge, most of the broiler litter was applied directly to the pastures near the
poultry/beef operations and not exported from the UERB. Therefore, FRT_KG should
have taken values in the region closer to its upper limit.
Identifying phosphorus sources accounting for parameter uncertainty
Instead of fixing all other P-related parameters, all the P-related parameters in Table 2 were
estimated along with FRT_KG and PCS_KGPD, using MAE as a search criterion for UCPR.
In Figure 3 the histograms of the final convergence of FRT_KG and PCS_KGPD are
compared with those in the previous process when the other P-related parameters were fixed. It
is not surprising that the estimates of the two parameters had wider histograms when the uncer-
tainties of the other parameters were taken into account. FRT_KG failed to converge on a
single cluster, which demonstrated the uncertainty associated with the estimation of the non-
point source P. However, given knowledge of local practices (there was very little if any export
of broiler litter from the watershed in the early 1990s) the third peak (, 7,000 kg/ha/yr) pro-
vided a realistic estimate for FRT_KG. For PCS_KGPD, although the standard
deviation shown in Figure 3d (22.0 kg/d) was larger than that shown in Figure 3b (14.2 kg/d),
the two means were comparable (42.6 and 42.9 kg/d, respectively). More interestingly, they are
very close to the difference estimated based on the data provided by one of the poultry
processing plants before and after its wastewater treatment unit had been upgraded in 2001.
Figure 2 Selection of a search criterion
Z.Lin
etal.
34
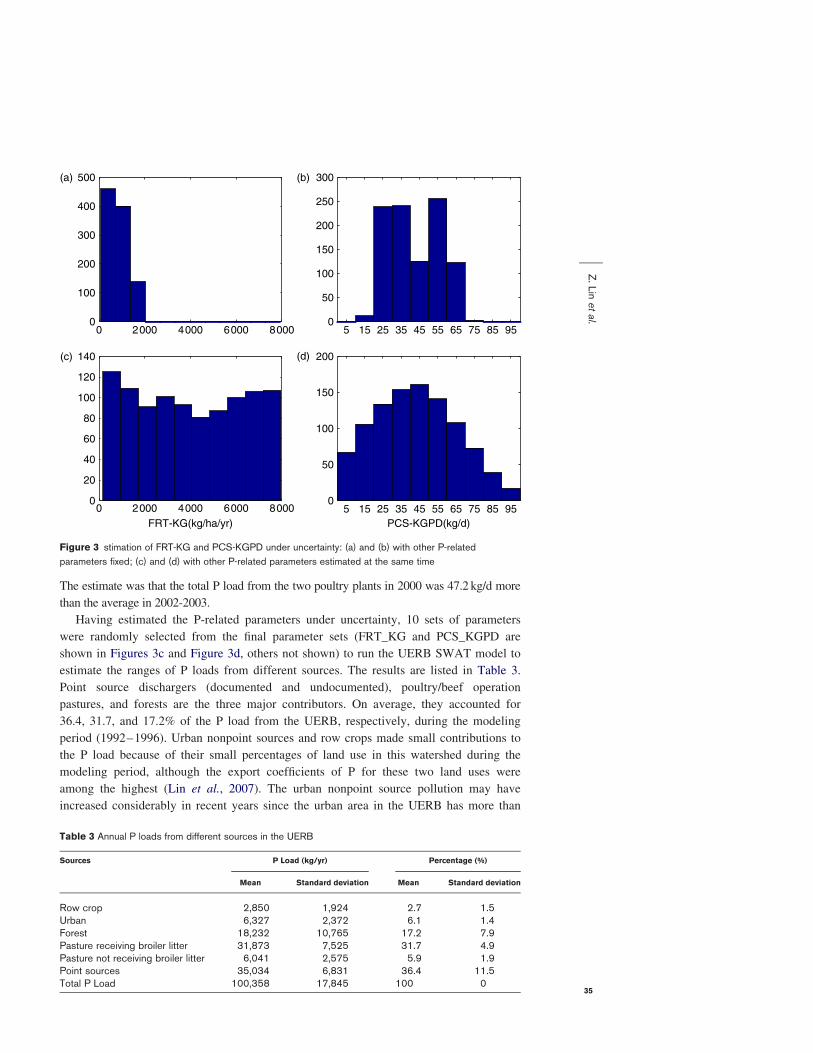
The estimate was that the total P load from the two poultry plants in 2000 was 47.2 kg/d more
than the average in 2002-2003.
Having estimated the P-related parameters under uncertainty, 10 sets of parameters
were randomly selected from the final parameter sets (FRT_KG and PCS_KGPD are
shown in Figures 3c and Figure 3d, others not shown) to run the UERB SWAT model to
estimate the ranges of P loads from different sources. The results are listed in Table 3.
Point source dischargers (documented and undocumented), poultry/beef operation
pastures, and forests are the three major contributors. On average, they accounted for
36.4, 31.7, and 17.2% of the P load from the UERB, respectively, during the modeling
period (1992–1996). Urban nonpoint sources and row crops made small contributions to
the P load because of their small percentages of land use in this watershed during the
modeling period, although the export coefficients of P for these two land uses were
among the highest (Lin et al., 2007). The urban nonpoint source pollution may have
increased considerably in recent years since the urban area in the UERB has more than
Figure 3 stimation of FRT-KG and PCS-KGPD under uncertainty: (a) and (b) with other P-related
parameters fixed; (c) and (d) with other P-related parameters estimated at the same time
Table 3 Annual P loads from different sources in the UERB
Sources P Load (kg/yr) Percentage (%)
Mean Standard deviation Mean Standard deviation
Row crop 2,850 1,924 2.7 1.5Urban 6,327 2,372 6.1 1.4Forest 18,232 10,765 17.2 7.9Pasture receiving broiler litter 31,873 7,525 31.7 4.9Pasture not receiving broiler litter 6,041 2,575 5.9 1.9Point sources 35,034 6,831 36.4 11.5Total P Load 100,358 17,845 100 0
Z.Lin
etal.
35
tripled from 1992 to 2001. The average annual P load to Lake Allatoona from the UERB
was about 100 metric tons. It is smaller than the P load (158 metric tons) estimated by
the Clean Lakes Study (Rose, 1999) based on the infrequent samples from May 1992 to
April 1993.
Conclusions
The UCPR algorithm was used, in conjunction with SWAT, to systematically estimate
the P loads from point source and nonpoint source polluters in the upper Etowah River
basin in Georgia to provide valuable information for subsequent P load estimation and
TMDL development for Lake Allatoona. Given the fact that the water quality obser-
vations are scarce (41 measurements of P concentration in 5 years), especially during
storm flows, the key findings of this research were as follows. First, the mean absolute
error was preferred over the commonly used root mean square error as a search criterion
for UCPR. Second, the undocumented P load from point sources in the UERB was
consistently quantified by this method as about 43 kg/d. However, the method was
not able to identify the broiler litter application rate to the pasture, partly because the P
concentration samples are extremely rare under high flow conditions (10 measurements
in 5 years). Third, point sources (documented and undocumented), poultry/beef operation
pastures, and forests were the three major contributors of P. During 1992–1996, on aver-
age they accounted for 36.4, 31.7, and 17.2% of the P load from the UERB, respectively.
Acknowledgements
The research was sponsored by a USDA CSREES Water Quality grant # GEO-2003-
04944 entitled “A Framework for Trading Phosphorus Credits in the Lake Allatoona
Watershed”. The authors want to thank John Starkey with the U.S. Poultry and Egg
Association for his endeavor in mining of point source data in the upper Etowah River
basin. Z. Lin is currently contracting with St. Johns River Water Management District,
Florida. M. B. Beck is currently Visiting Professor in the Department of Civil
and Environmental Engineering at the Imperial College of Science, Technology and
Medicine, London.
ReferencesArnold, J.G., Srinivasan, R., Muttiah, R.S. and Williams, J.R. (1998). Large area hydrologic modeling and
assessment - part 1: model development. Journal of the American Water Resources Association, 34,
73–89.
GAEPD (2004). Rules and Regulations for Water Quality Control, Chapter 391-3-6, Georgia Environmental
Protection Division, Atlanta, GA.
GAEPD (2006). Draft 2006 Lakes/Reservoirs not Fully Supporting Designated Uses, Georgia Environmental
Protection Division, Atlanta, GA.
Harmel, R.D., Cooper, R.J., Slade, R.M., Haney, R.L. and Arnold, J.G. (2006). Cumulative uncertainty in
measured streamflow and water quality data for small watersheds. Transactions of the ASABE, 49,
689–701.
Harned, D.A., Atkins, J.B. and Harvill, J.S. (2004). Nutrient mass balance and trends, Mobile River Basin,
Alabama, Georgia, and Mississippi. Journal of the American Water Resources Association, 40, 765–793.
Klepper, O. and Hendrix, E.M.T. (1994). A method for robust calibration of ecological models under
different types of uncertainty. Ecological Modelling, 74, 161–182.
Lin, Z. and Radcliffe, D.E. (2006). Automatic calibration and predictive uncertainty analysis of a semi-
distributed watershed model. Vadose Zone Journal, 5, 248–260.
Lin, Z., Radcliffe, D.E., Risse, L.M., Romeis, J.J. and Jackson, C.R. (2007). Modeling phosphorus in Lake
Allatoona watershed using SWAT: II. effect of landuse change. Journal of Environmental Quality
(submitted).
Z.Lin
etal.
36
Osidele, O.O., Zeng, W. and Beck, M.B. (2006). A random search methodology for examining parametric
uncertainty in water quality models. Water Science and Technology, 53(1), 33–40.
Pierson, S.T., Cabrera, M.L., Evanylo, G.K., Kuykendall, H.A., Hoveland, C.S., McCann, M.A. and West,
L.T. (2001). Phosphorus and ammonium concentrations in surface runoff from grasslands fertilized with
broiler litter. Journal of Environmental Quality, 30, 1784–1789.
Radcliffe, D.E., Lin, Z., Risse, L.M., Romeis, J.J. and Jackson, C.R. (2007). Modeling phosphorus in Lake
Allatoona watershed using SWAT: I. developing phosphorus parameter values. Journal of Environmental
Quality (submitted).
Rose, P. (1999). Lake Allatoona Phase I Diagnostic-Feasibility Study Report 1992-1997, A.L. Burruss
Institute of Public Service, Kennesaw State University, Kennesaw, GA.
Z.Lin
etal.
37