Embed Size (px)
Citation preview
Chemical Industry & Chemical Engineering Quarterly
Available on line at Association of the Chemical Engineers of Serbia AChE www.ache.org.rs/CICEQ
Chem. Ind. Chem. Eng. Q. 25 (3) 217−228 (2019) CI&CEQ
217
IVANA ČEKOVIĆ1
NEBOJŠA MANIĆ2
DRAGOSLAVA STOJILJKOVIĆ2
MARTA TRNINIĆ2 DUŠAN TODOROVIĆ2
ALEKSANDAR JOVOVIĆ2
1Innovation Center, Faculty of Mechanical Engineering, Belgrade,
Serbia 2Faculty of Mechanical
Engineering, University of Belgrade, Serbia
SCIENTIFIC PAPER
UDC 621.8.036:674:519
MODELING OF WOOD CHIPS GASIFICATION PROCESS IN ASPEN PLUS WITH MULTIPLE VALIDATION APPROACH
Article Highlights • Modeling of wood chips gasification in downdraft gasifier was carried out in ASPEN
Plus • Due to the mathematical model development issues, three cases are considered and
described • Experimental work was carried out within commercial small-scale CHP system • Multiple validation approach was applied for model verification Abstract
A thermochemical equilibrium model is formulated for wood chips downdraft gasification. Steady state ASPEN Plus simulator was utilized to evaluate pro-ducer gas composition and low heating value. Three cases are considered, due to mathematical model developed issues, and described in details. Experi-mental work was carried out within commercial small-scale CHP system where twelve beech wood samples were taken. Equivalence ratio is between 0.32 and 0.38 and air-fuel ratio ranges from 1.49 to 1.81, when gasifier capacity is optimal, at 250 kW. Mole fractions of CO2, H2, CO, CH4 and N2, in dry producer gas, are respectively, 16.06-17.64, 17.98-20.33, 13.71-17.26, 1.65-2.89 and 43.21-48.36. Multiple validation approach was applied for model verification. The results are in reasonable agreement with different literature sources (experimental work and modeling) and in a great agreement with the modified equilibrium model developed in Engineering Equation Solver found in the lite-rature. Result deviations are explained by two major facts: wood downdraft gasification experiments are to a certain extent different and the model para-meters could not be adjusted enough to fully minimize differences between model results. Predicted low heating value of dry producer gas is between 4.67-5.61 MJ/Nm3.
Keywords: ASPEN, downdraft gasification, experiment, modeling, multi validation approach, wood chips.
The efficient utilization of biomass is of great importance when it comes to replacing fossil fuels that are still used in large amounts [1,2]. Thermo-chemical conversions of biomass fuels are challen-ging not only in terms of physical and chemical trans-formations, but also in terms of a large number of pro-duct species [3]. Biomass gasification is a thermo-chemical process and a highly efficient way of con- Correspondence: I. Čeković, Innovation Center, Faculty of Mech-anical Engineering, Kraljice Marije 16, 11120 Belgrade, Serbia. E-mail: [email protected] Paper received: 9 July, 2018 Paper revised: 21 November, 2018 Paper accepted: 10 December, 2018
https://doi.org/10.2298/CICEQ180709034C
verting biomass, in the presence of air, oxygen or steam, into a mixture of combustible (CO, H2 and CH4) and non-combustible (CO2 and N2) gases in a gasifier [4]. Beside the mentioned gas mixtures, the products of gasification are water vapor, other gase-ous hydrocarbons, small quantities of char, ash, con-densable compounds (tars and oils), etc. [5]. It is a complex process of partial oxidation of biomass fol-lowed by sequential and parallel physical processes and chemical reactions [6]. Generated gas could be classified as producer gas or syngas. In general, pro-ducer gas is formed at a low gasification temperature, <1000 °C, and syngas is formed at high gasification temperature, >1200 °C [7]. Both producer gas and
I. ČEKOVIĆ et al.: MODELING OF WOOD CHIPS GASIFICATION… Chem. Ind. Chem. Eng. Q. 25 (3) 217−228 (2019)
218
syngas can be standardized in their quality and can be used to power gas engines and gas turbines (e.g., combined heat and power (CHP) systems) or as a chemical feedstock (e.g., liquid fuel production), which means that gasification adds value to low- or negative-value feedstock by converting it into market-able fuels and products [5]. Since biomass gasific-ation within CHP system is in the focus of this paper, it is important to emphasize the importance of such systems in terms of climate change mitigation, energy security and increasing energy efficiency [2]. Good quality gas has high heating value and low tar con-tent. The gas quality is affected by parameters such as biomass characteristics (size, density, ultimate and proximate analysis), process parameters (biomass consumption rate, equivalence ratio (ER) and gasific-ation temperature and pressure) and gasifier design [4,5,8]. Depending on the direction of biomass and producer gas/syngas flow in the gasifier, fixed-bed gasifiers can be generally categorized as updraft, downdraft and cross-draft [6,7,9]. Since the downdraft gasifier is in the focus of investigation, other types of fixed-bed gasifiers will not be discussed. Typically, downdraft gasifiers have a capacity of 10 kW–1 MW [4]. Biomass feedstock is fed from the top. Gasifying agent, typically air, oxygen or steam, is fed from the top (open-core) or from the side (throated), Figure 1 [10]. The main advantages of downdraft gasifiers are easy fabrication and operation, suitability for biomass with low moisture content and low tar and ash content in a produced gas. On the other side, disadvantages are related to biomass type and feed size limitations, moisture content sensitivity, low heating value of pro-duced gas, scale limitations, appearance of grate blocking, channeling and bridging [4,5,11,12].
Figure 1. Downdraft gasifiers: a) open-core; b) throated.
Due to the complexity of biomass gasification, simulation and prediction of the process performance are continuously developing research areas and sub-jects of lots of studies. Mathematical modeling of gasification could be categorized into thermodynamic equilibrium model, kinetic model, artificial neural net-
work (ANN) model and computational fluid dynamic model (CFD) approaches. Diverse to the thermodyn-amic equilibrium models that are predicting maximum possible product quantity, kinetic models are predict-ing product quality features (composition and fract-ions of products in different reactor zones). There are parameters within kinetic models that are limiting their application. On the other side, thermodynamic equi-librium models are suitable for investigating different parameter impact on producer gas/syngas compo-sition and are not limited with gasifier design. Still, difficulties caused by low process temperatures (low outlet gas temperatures) may occur while reaching thermodynamic equilibrium [5,13]. In this study, equi-librium modeling was carried out within Aspen Plus with a purpose to investigate wood chips gasification in downdraft gasifier in order to determine gas com-position and heating value of producer gas. ASPEN Plus was very convenient for such an investigation because it is reliable, problem-oriented and a user-friendly process simulator and a great tool for utiliz-ation when there is a need to avoid complex pro-cesses such as gasification and to develop very simple models. There are also process model simul-ators that are combining thermodynamic equilibrium model and kinetic model approaches. Within Aspen Plus, there is such a possibility, but it was not con-sidered in this study.
Theoretical background
Broadly speaking, the principle stages of gasific-ation are drying, devolatilization (pyrolysis), oxidation (combustion) and reduction, Figure 2 [5]. Normally, suitable moisture content of biomass for downdraft gasifiers ranges from 5 to 35% [4,5,9]. Drying stage occurs at about 100–200 °C, when the moisture starts converting into water vapor, and it takes place due to the heat transfer from the hotter oxidation zone [4].
Figure 2. Stages of gasification inside the downdraft gasifier.
I. ČEKOVIĆ et al.: MODELING OF WOOD CHIPS GASIFICATION… Chem. Ind. Chem. Eng. Q. 25 (3) 217−228 (2019)
219
Higher moisture content requires more heat for dry-ing. The rate of drying depends on the surface area of the biomass feed, the temperature difference between the feed and its external environment and the internal diffusivity of moisture within the feed. It is important to point out that drying is not a discreet process and it also occurs alongside pyrolysis as tem-perature increases [10]. Devolatilization (pyrolysis) occurs at about 200–700 °C in the absence of a gas-ification (oxidation) agent. Biomass starts decom-posing irreversibly, due to the partial oxidation heat released (thermal degradation), into a mixture of non-condensable gases (CO, H2, CO2 and CH4), tar and char. Decomposition of tar into gas, char and liquid occurs in the secondary tar-cracking reactions [4]. The release of volatiles begins at about 250 °C, until under the conditions in a downdraft gasifier, 80-95% of the original mass is converted, leaving 5-20% highly reactive charcoal [10]. During this stage, both homogeneous and heterogeneous reactions take place. Oxidation (combustion) provides heat not only for drying and pyrolysis, but also for endothermic gas-
ification reactions during the reduction stage. It occurs between solid carbonized biomass and air, oxygen or steam, at about 800–1400 °C, resulting in formation of CO2, CO and H2O [4,5,9]. The volatile products of pyrolysis are partially oxidized in highly exothermic reactions resulting in rapid temperature increase. The oxidation reactions of volatiles are very rapid and oxy-gen is consumed before it can diffuse to the surface of the char. Therefore, no oxidation of the char can take place [10]. Combustible gases in producer gas/ /syngas are formed during the reduction stage when main gasification reactions occur. Reduction occurs at about 800–1000 °C followed by endothermic reactions in majority [4,5,9]. Solid char is converted into gas by reactions with the hot gases from zones above. Gases are reduced to form a greater proportion of H2 and CO. The gasification reactions of the liquid pro-ducts of pyrolysis are complex and are not widely dis-cussed in literature [10]. Characteristic reactions of the gasification process and the principle stages are presented in Table 1.
Table 1. Characteristic gasification reactions [4,5,8,9]
Drying and Devolatilization (pyrolysis)
⎯⎯⎯→ + + + Heatgas liquid2Biomass H O C H O C H O Chara b c x y z
Oxidation (combustion)
+ → −2 2kJ
1:C O CO 394mol
R
+ → −21 kJ
C O CO 1112 mol
+ → −2 2 21 kJ
H O H O 2422 mol
Reduction
Main reactions
+ ↔ + kJC CO 2CO 1722 mol
- Bouduard reaction
+ ↔ + +2 2kJ
C H O CO H 131mol
Water-gas reaction
+ ↔ + −2 2 2kJ
CO H O CO H 41.2mol
– Water-gas Shift reaction
+ ↔ −2 4kJ
C 2H CH 74.8mol
Methane reaction
Additional reactions of importance
Oxidation reaction
+ ↔ + −4 2 2 2kJ
CH 2O CO 2H O 803mol
Methanization reactions
+ → + −2 4 2kJ
R2 : 2CO 2H CH CO 247mol
I. ČEKOVIĆ et al.: MODELING OF WOOD CHIPS GASIFICATION… Chem. Ind. Chem. Eng. Q. 25 (3) 217−228 (2019)
220
Table 2. Continued
Methanization reactions
+ ↔ + −2 4 2kJ
CO 3H CH H O 206mol
+ → + −2 2 4 2kJ
CO 4H CH 2H O 165mol
Steam reactions
+ ↔ + +4 2 2kJ
CH H O CO 3H 206mol
+ → + −4 2 21 kJ
CH O CO 2H 362 mol
MATERIALS AND METHODS
Experimental setup within the CHP facility
The experiment was performed within a com-
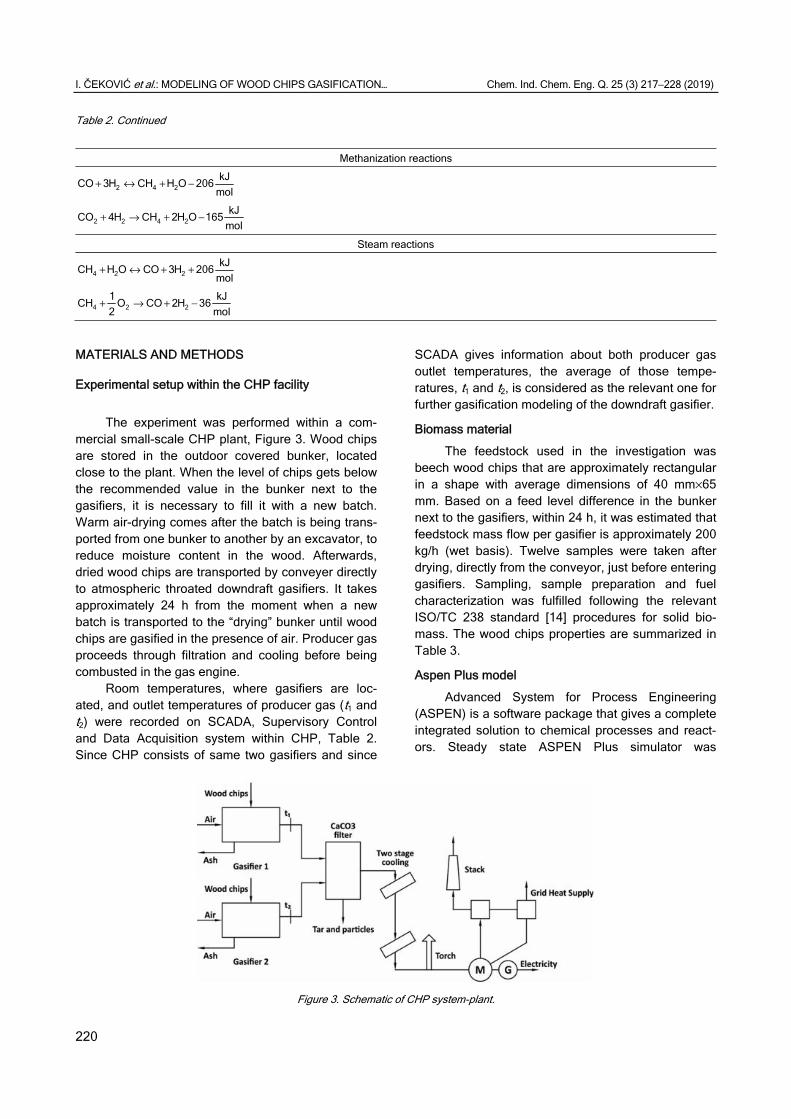
mercial small-scale CHP plant, Figure 3. Wood chips are stored in the outdoor covered bunker, located close to the plant. When the level of chips gets below the recommended value in the bunker next to the gasifiers, it is necessary to fill it with a new batch. Warm air-drying comes after the batch is being trans-ported from one bunker to another by an excavator, to reduce moisture content in the wood. Afterwards, dried wood chips are transported by conveyer directly to atmospheric throated downdraft gasifiers. It takes approximately 24 h from the moment when a new batch is transported to the “drying” bunker until wood chips are gasified in the presence of air. Producer gas proceeds through filtration and cooling before being combusted in the gas engine.
Room temperatures, where gasifiers are loc-ated, and outlet temperatures of producer gas (t1 and t2) were recorded on SCADA, Supervisory Control and Data Acquisition system within CHP, Table 2. Since CHP consists of same two gasifiers and since
SCADA gives information about both producer gas outlet temperatures, the average of those tempe-ratures, t1 and t2, is considered as the relevant one for further gasification modeling of the downdraft gasifier.
Biomass material
The feedstock used in the investigation was beech wood chips that are approximately rectangular in a shape with average dimensions of 40 mm×65 mm. Based on a feed level difference in the bunker next to the gasifiers, within 24 h, it was estimated that feedstock mass flow per gasifier is approximately 200 kg/h (wet basis). Twelve samples were taken after drying, directly from the conveyor, just before entering gasifiers. Sampling, sample preparation and fuel characterization was fulfilled following the relevant ISO/TC 238 standard [14] procedures for solid bio-mass. The wood chips properties are summarized in Table 3.
Aspen Plus model
Advanced System for Process Engineering (ASPEN) is a software package that gives a complete integrated solution to chemical processes and react-ors. Steady state ASPEN Plus simulator was
Figure 3. Schematic of CHP system-plant.
I. ČEKOVIĆ et al.: MODELING OF WOOD CHIPS GASIFICATION… Chem. Ind. Chem. Eng. Q. 25 (3) 217−228 (2019)
221
developed to evaluate producer/syngas constituents [15]. After placing the blocks, models of specific pro-cess operations, on the flowsheet, the user is speci-fying material, inlet and outlet streams of the blocks. As the ASPEN Plus process simulator does not have a built-in gasifier model, a number of reactor types defined in ASPEN are used to model each zone of gasification [16].
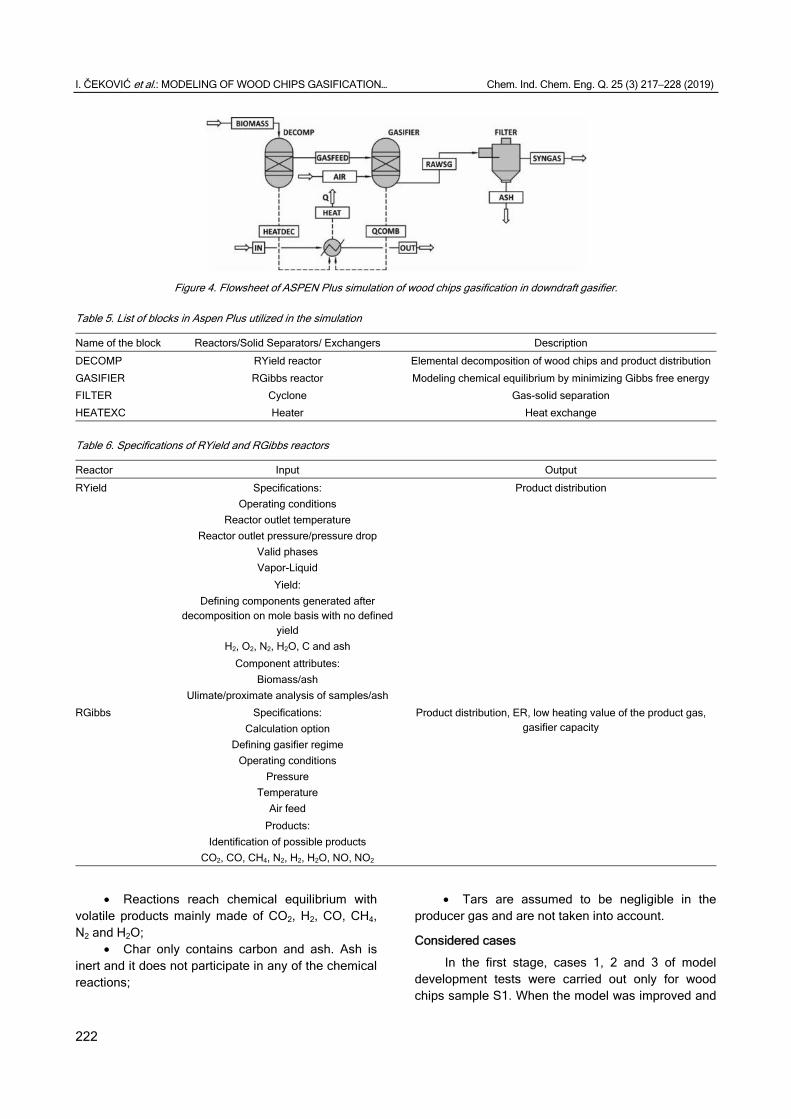
In order to simulate wood chips gasification in a downdraft gasifier based on the experiment that was carried out, four different blocks were considered, Figure 4. The first one: wood decomposition (DECOMP block), within RYield reactor, where wood is con-verted into its components including carbon, hydro-gen, oxygen, nitrogen, moisture and ash, according to its ultimate analysis. This type of reactor is used when reaction stoichiometry or reaction kinetics are unknown or unimportant, while the yield distribution is known [17]. The second one: volatile reactions with air (combustion and reduction stages) (GASIFIER
block), within RGibbs reactor, where the raw producer gas (RAWSG stream) is generated. This type of reactor is used when reaction stoichiometry is unknown, while temperature and pressure in the reactor are known [17]. The third one: Solid Separ-ator-Cyclone (FILTER block), in which the separation of ash from the raw producer gas occurs, resulting with SYNGAS and ASH streams. The fourth one: Heat Exchanger (HEATEXC block), heat generated from the decomposition (HEATDEC stream) and from combustion and reduction processes in gasifier (QCOMB stream) is used for water heating water from 20 to 100 °C, Table 4. More detailed specifications of each of the reactors, RYield and RGibbs, are pre-sented in Table 5.
The following assumptions [18] were considered while modeling the gasification process:
• The whole process is steady state and iso-thermal in the same section;
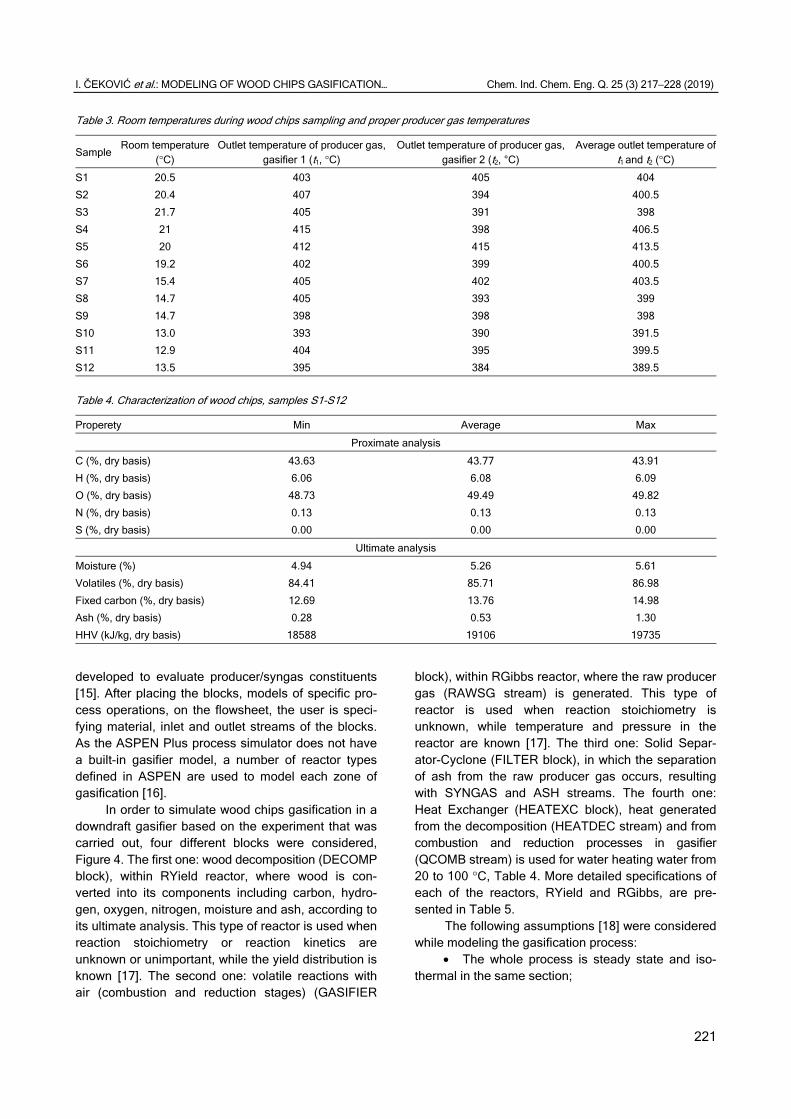
Table 3. Room temperatures during wood chips sampling and proper producer gas temperatures
Sample Room temperature
(°C) Outlet temperature of producer gas,
gasifier 1 (t1, °C) Outlet temperature of producer gas,
gasifier 2 (t2, °C) Average outlet temperature of
t1 and t2 (°C)
S1 20.5 403 405 404
S2 20.4 407 394 400.5
S3 21.7 405 391 398
S4 21 415 398 406.5
S5 20 412 415 413.5
S6 19.2 402 399 400.5
S7 15.4 405 402 403.5
S8 14.7 405 393 399
S9 14.7 398 398 398
S10 13.0 393 390 391.5
S11 12.9 404 395 399.5
S12 13.5 395 384 389.5
Table 4. Characterization of wood chips, samples S1-S12
Properety Min Average Max
Proximate analysis
C (%, dry basis) 43.63 43.77 43.91
H (%, dry basis) 6.06 6.08 6.09
O (%, dry basis) 48.73 49.49 49.82
N (%, dry basis) 0.13 0.13 0.13
S (%, dry basis) 0.00 0.00 0.00
Ultimate analysis
Moisture (%) 4.94 5.26 5.61
Volatiles (%, dry basis) 84.41 85.71 86.98
Fixed carbon (%, dry basis) 12.69 13.76 14.98
Ash (%, dry basis) 0.28 0.53 1.30
HHV (kJ/kg, dry basis) 18588 19106 19735
I. ČEKOVIĆ et al.: MODELING OF WOOD CHIPS GASIFICATION… Chem. Ind. Chem. Eng. Q. 25 (3) 217−228 (2019)
222
• Reactions reach chemical equilibrium with volatile products mainly made of CO2, H2, CO, CH4, N2 and H2O;
• Char only contains carbon and ash. Ash is inert and it does not participate in any of the chemical reactions;
• Tars are assumed to be negligible in the producer gas and are not taken into account.
Considered cases
In the first stage, cases 1, 2 and 3 of model development tests were carried out only for wood chips sample S1. When the model was improved and
Figure 4. Flowsheet of ASPEN Plus simulation of wood chips gasification in downdraft gasifier.
Table 5. List of blocks in Aspen Plus utilized in the simulation
Name of the block Reactors/Solid Separators/ Exchangers Description
DECOMP RYield reactor Elemental decomposition of wood chips and product distribution
GASIFIER RGibbs reactor Modeling chemical equilibrium by minimizing Gibbs free energy
FILTER Cyclone Gas-solid separation
HEATEXC Heater Heat exchange
Table 6. Specifications of RYield and RGibbs reactors
Reactor Input Output
RYield Specifications: Operating conditions
Reactor outlet temperature Reactor outlet pressure/pressure drop
Valid phases Vapor-Liquid
Product distribution
Yield: Defining components generated after
decomposition on mole basis with no defined yield
H2, O2, N2, H2O, C and ash Component attributes:
Biomass/ash Ulimate/proximate analysis of samples/ash
RGibbs Specifications: Calculation option
Defining gasifier regime Operating conditions
Pressure Temperature
Air feed
Product distribution, ER, low heating value of the product gas, gasifier capacity
Products: Identification of possible products
CO2, CO, CH4, N2, H2, H2O, NO, NO2
I. ČEKOVIĆ et al.: MODELING OF WOOD CHIPS GASIFICATION… Chem. Ind. Chem. Eng. Q. 25 (3) 217−228 (2019)
223
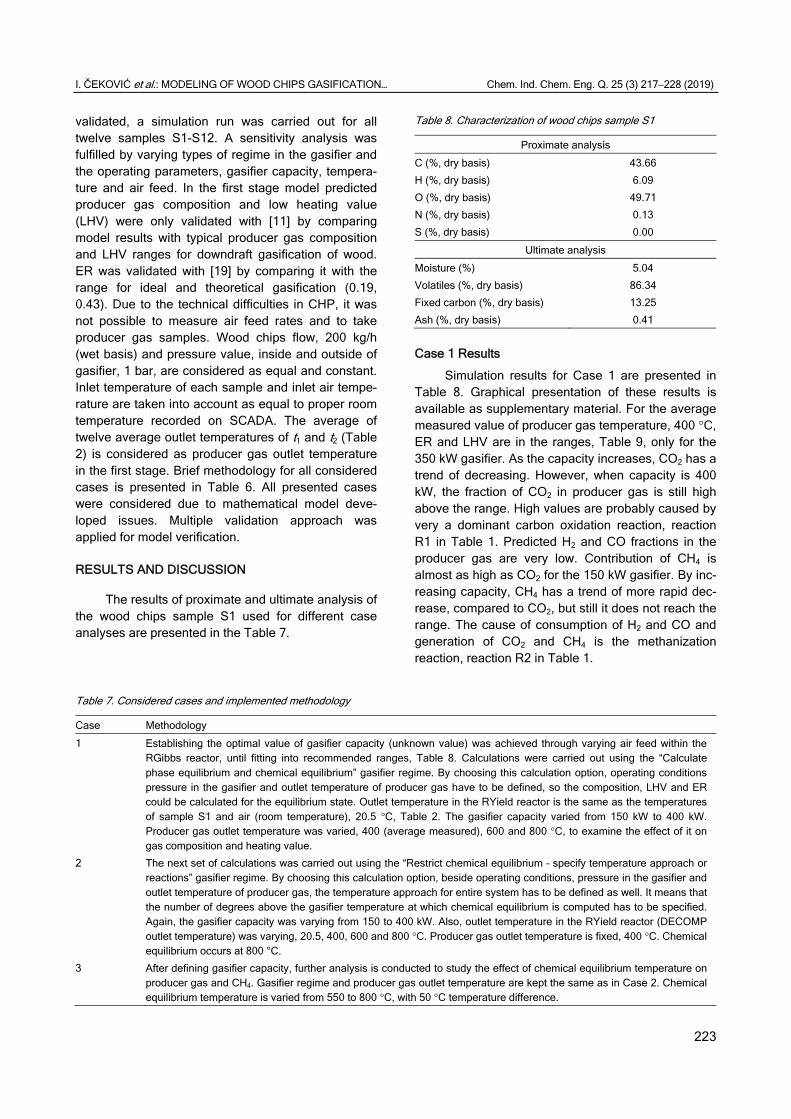
validated, a simulation run was carried out for all twelve samples S1-S12. A sensitivity analysis was fulfilled by varying types of regime in the gasifier and the operating parameters, gasifier capacity, tempera-ture and air feed. In the first stage model predicted producer gas composition and low heating value (LHV) were only validated with [11] by comparing model results with typical producer gas composition and LHV ranges for downdraft gasification of wood. ER was validated with [19] by comparing it with the range for ideal and theoretical gasification (0.19, 0.43). Due to the technical difficulties in CHP, it was not possible to measure air feed rates and to take producer gas samples. Wood chips flow, 200 kg/h (wet basis) and pressure value, inside and outside of gasifier, 1 bar, are considered as equal and constant. Inlet temperature of each sample and inlet air tempe-rature are taken into account as equal to proper room temperature recorded on SCADA. The average of twelve average outlet temperatures of t1 and t2 (Table 2) is considered as producer gas outlet temperature in the first stage. Brief methodology for all considered cases is presented in Table 6. All presented cases were considered due to mathematical model deve-loped issues. Multiple validation approach was applied for model verification.
RESULTS AND DISCUSSION
The results of proximate and ultimate analysis of the wood chips sample S1 used for different case analyses are presented in the Table 7.
Table 8. Characterization of wood chips sample S1
Proximate analysis
C (%, dry basis) 43.66
H (%, dry basis) 6.09
O (%, dry basis) 49.71
N (%, dry basis) 0.13
S (%, dry basis) 0.00
Ultimate analysis
Moisture (%) 5.04
Volatiles (%, dry basis) 86.34
Fixed carbon (%, dry basis) 13.25
Ash (%, dry basis) 0.41
Case 1 Results
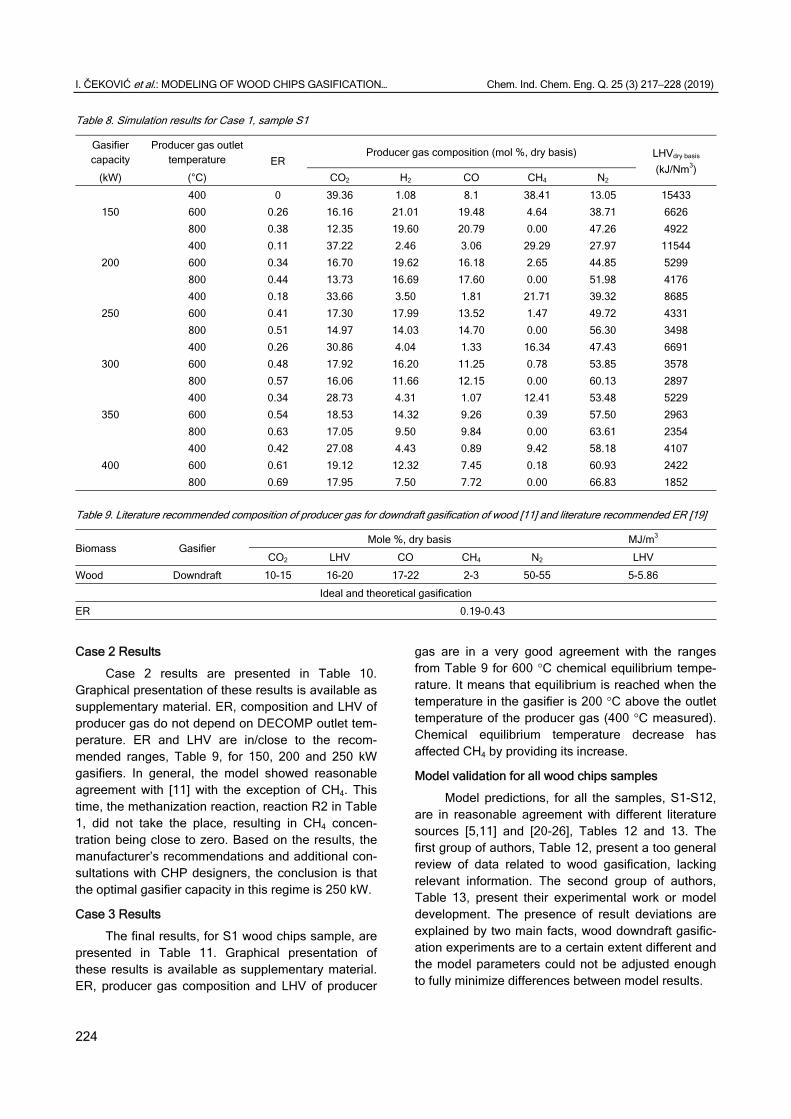
Simulation results for Case 1 are presented in Table 8. Graphical presentation of these results is available as supplementary material. For the average measured value of producer gas temperature, 400 °C, ER and LHV are in the ranges, Table 9, only for the 350 kW gasifier. As the capacity increases, CO2 has a trend of decreasing. However, when capacity is 400 kW, the fraction of CO2 in producer gas is still high above the range. High values are probably caused by very a dominant carbon oxidation reaction, reaction R1 in Table 1. Predicted H2 and CO fractions in the producer gas are very low. Contribution of CH4 is almost as high as CO2 for the 150 kW gasifier. By inc-reasing capacity, CH4 has a trend of more rapid dec-rease, compared to CO2, but still it does not reach the range. The cause of consumption of H2 and CO and generation of CO2 and CH4 is the methanization reaction, reaction R2 in Table 1.
Table 7. Considered cases and implemented methodology
Case Methodology
1 Establishing the optimal value of gasifier capacity (unknown value) was achieved through varying air feed within the RGibbs reactor, until fitting into recommended ranges, Table 8. Calculations were carried out using the “Calculate phase equilibrium and chemical equilibrium” gasifier regime. By choosing this calculation option, operating conditions pressure in the gasifier and outlet temperature of producer gas have to be defined, so the composition, LHV and ER could be calculated for the equilibrium state. Outlet temperature in the RYield reactor is the same as the temperatures of sample S1 and air (room temperature), 20.5 °C, Table 2. The gasifier capacity varied from 150 kW to 400 kW. Producer gas outlet temperature was varied, 400 (average measured), 600 and 800 °C, to examine the effect of it on gas composition and heating value.
2 The next set of calculations was carried out using the “Restrict chemical equilibrium – specify temperature approach or reactions” gasifier regime. By choosing this calculation option, beside operating conditions, pressure in the gasifier and outlet temperature of producer gas, the temperature approach for entire system has to be defined as well. It means that the number of degrees above the gasifier temperature at which chemical equilibrium is computed has to be specified. Again, the gasifier capacity was varying from 150 to 400 kW. Also, outlet temperature in the RYield reactor (DECOMP outlet temperature) was varying, 20.5, 400, 600 and 800 °C. Producer gas outlet temperature is fixed, 400 °C. Chemical equilibrium occurs at 800 °C.
3 After defining gasifier capacity, further analysis is conducted to study the effect of chemical equilibrium temperature on producer gas and CH4. Gasifier regime and producer gas outlet temperature are kept the same as in Case 2. Chemical equilibrium temperature is varied from 550 to 800 °C, with 50 °C temperature difference.
I. ČEKOVIĆ et al.: MODELING OF WOOD CHIPS GASIFICATION… Chem. Ind. Chem. Eng. Q. 25 (3) 217−228 (2019)
224
Case 2 Results
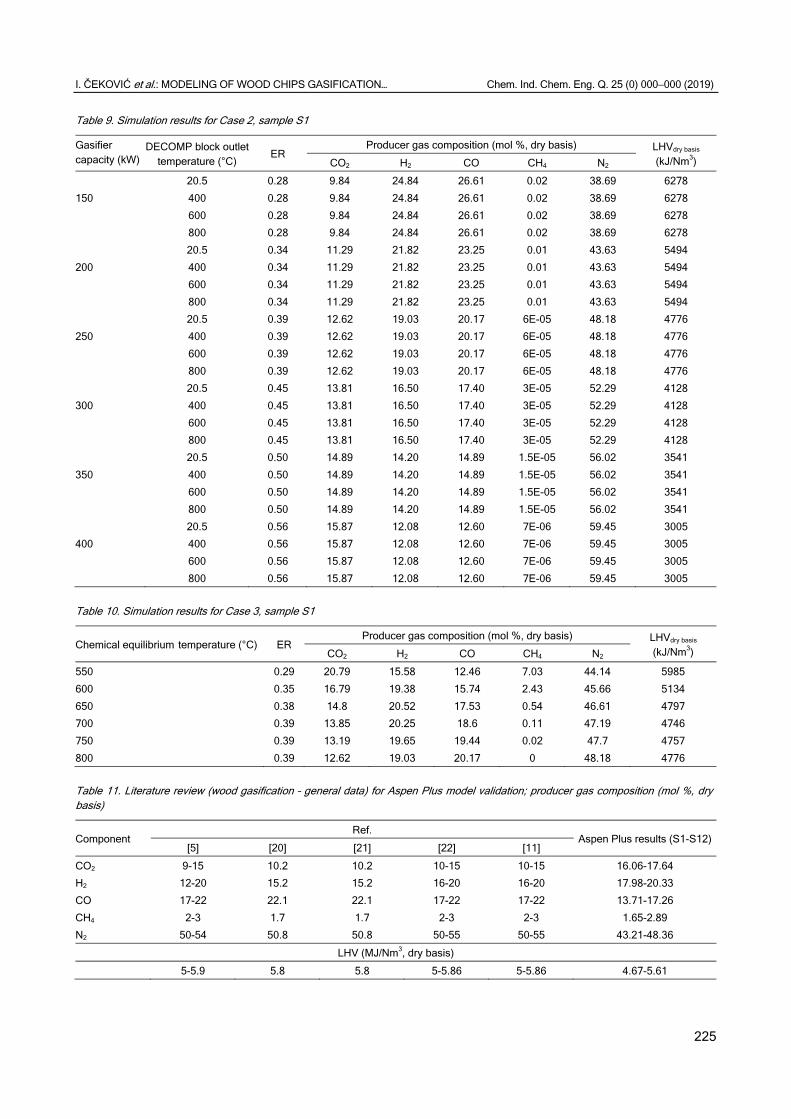
Case 2 results are presented in Table 10. Graphical presentation of these results is available as supplementary material. ER, composition and LHV of producer gas do not depend on DECOMP outlet tem-perature. ER and LHV are in/close to the recom-mended ranges, Table 9, for 150, 200 and 250 kW gasifiers. In general, the model showed reasonable agreement with [11] with the exception of CH4. This time, the methanization reaction, reaction R2 in Table 1, did not take the place, resulting in CH4 concen-tration being close to zero. Based on the results, the manufacturer’s recommendations and additional con-sultations with CHP designers, the conclusion is that the optimal gasifier capacity in this regime is 250 kW.
Case 3 Results
The final results, for S1 wood chips sample, are presented in Table 11. Graphical presentation of these results is available as supplementary material. ER, producer gas composition and LHV of producer
gas are in a very good agreement with the ranges from Table 9 for 600 °C chemical equilibrium tempe-rature. It means that equilibrium is reached when the temperature in the gasifier is 200 °C above the outlet temperature of the producer gas (400 °C measured). Chemical equilibrium temperature decrease has affected CH4 by providing its increase.
Model validation for all wood chips samples
Model predictions, for all the samples, S1-S12, are in reasonable agreement with different literature sources [5,11] and [20-26], Tables 12 and 13. The first group of authors, Table 12, present a too general review of data related to wood gasification, lacking relevant information. The second group of authors, Table 13, present their experimental work or model development. The presence of result deviations are explained by two main facts, wood downdraft gasific-ation experiments are to a certain extent different and the model parameters could not be adjusted enough to fully minimize differences between model results.
Table 8. Simulation results for Case 1, sample S1
Gasifier capacity
Producer gas outlet temperature ER
Producer gas composition (mol %, dry basis) LHVdry basis (kJ/Nm3)
(kW) (°C) CO2 H2 CO CH4 N2
400 0 39.36 1.08 8.1 38.41 13.05 15433
150 600 0.26 16.16 21.01 19.48 4.64 38.71 6626
800 0.38 12.35 19.60 20.79 0.00 47.26 4922
400 0.11 37.22 2.46 3.06 29.29 27.97 11544
200 600 0.34 16.70 19.62 16.18 2.65 44.85 5299
800 0.44 13.73 16.69 17.60 0.00 51.98 4176
400 0.18 33.66 3.50 1.81 21.71 39.32 8685
250 600 0.41 17.30 17.99 13.52 1.47 49.72 4331
800 0.51 14.97 14.03 14.70 0.00 56.30 3498
400 0.26 30.86 4.04 1.33 16.34 47.43 6691
300 600 0.48 17.92 16.20 11.25 0.78 53.85 3578
800 0.57 16.06 11.66 12.15 0.00 60.13 2897
400 0.34 28.73 4.31 1.07 12.41 53.48 5229
350 600 0.54 18.53 14.32 9.26 0.39 57.50 2963
800 0.63 17.05 9.50 9.84 0.00 63.61 2354
400 0.42 27.08 4.43 0.89 9.42 58.18 4107
400 600 0.61 19.12 12.32 7.45 0.18 60.93 2422
800 0.69 17.95 7.50 7.72 0.00 66.83 1852
Table 9. Literature recommended composition of producer gas for downdraft gasification of wood [11] and literature recommended ER [19]
Biomass Gasifier Mole %, dry basis MJ/m3
CO2 LHV CO CH4 N2 LHV
Wood Downdraft 10-15 16-20 17-22 2-3 50-55 5-5.86
Ideal and theoretical gasification
ER 0.19-0.43
I. ČEKOVIĆ et al.: MODELING OF WOOD CHIPS GASIFICATION… Chem. Ind. Chem. Eng. Q. 25 (0) 000−000 (2019)
225
Table 9. Simulation results for Case 2, sample S1
Gasifier capacity (kW)
DECOMP block outlet temperature (°C)
ER Producer gas composition (mol %, dry basis) LHVdry basis
(kJ/Nm3) CO2 H2 CO CH4 N2
20.5 0.28 9.84 24.84 26.61 0.02 38.69 6278
150 400 0.28 9.84 24.84 26.61 0.02 38.69 6278
600 0.28 9.84 24.84 26.61 0.02 38.69 6278
800 0.28 9.84 24.84 26.61 0.02 38.69 6278
20.5 0.34 11.29 21.82 23.25 0.01 43.63 5494
200 400 0.34 11.29 21.82 23.25 0.01 43.63 5494
600 0.34 11.29 21.82 23.25 0.01 43.63 5494
800 0.34 11.29 21.82 23.25 0.01 43.63 5494
20.5 0.39 12.62 19.03 20.17 6E-05 48.18 4776
250 400 0.39 12.62 19.03 20.17 6E-05 48.18 4776
600 0.39 12.62 19.03 20.17 6E-05 48.18 4776
800 0.39 12.62 19.03 20.17 6E-05 48.18 4776
20.5 0.45 13.81 16.50 17.40 3E-05 52.29 4128
300 400 0.45 13.81 16.50 17.40 3E-05 52.29 4128
600 0.45 13.81 16.50 17.40 3E-05 52.29 4128
800 0.45 13.81 16.50 17.40 3E-05 52.29 4128
20.5 0.50 14.89 14.20 14.89 1.5E-05 56.02 3541
350 400 0.50 14.89 14.20 14.89 1.5E-05 56.02 3541
600 0.50 14.89 14.20 14.89 1.5E-05 56.02 3541
800 0.50 14.89 14.20 14.89 1.5E-05 56.02 3541
20.5 0.56 15.87 12.08 12.60 7E-06 59.45 3005
400 400 0.56 15.87 12.08 12.60 7E-06 59.45 3005
600 0.56 15.87 12.08 12.60 7E-06 59.45 3005
800 0.56 15.87 12.08 12.60 7E-06 59.45 3005
Table 10. Simulation results for Case 3, sample S1
Chemical equilibrium temperature (°C) ER Producer gas composition (mol %, dry basis) LHVdry basis
(kJ/Nm3) CO2 H2 CO CH4 N2
550 0.29 20.79 15.58 12.46 7.03 44.14 5985
600 0.35 16.79 19.38 15.74 2.43 45.66 5134
650 0.38 14.8 20.52 17.53 0.54 46.61 4797
700 0.39 13.85 20.25 18.6 0.11 47.19 4746
750 0.39 13.19 19.65 19.44 0.02 47.7 4757
800 0.39 12.62 19.03 20.17 0 48.18 4776
Table 11. Literature review (wood gasification – general data) for Aspen Plus model validation; producer gas composition (mol %, dry basis)
Component Ref.
Aspen Plus results (S1-S12)[5] [20] [21] [22] [11]
CO2 9-15 10.2 10.2 10-15 10-15 16.06-17.64
H2 12-20 15.2 15.2 16-20 16-20 17.98-20.33
CO 17-22 22.1 22.1 17-22 17-22 13.71-17.26
CH4 2-3 1.7 1.7 2-3 2-3 1.65-2.89
N2 50-54 50.8 50.8 50-55 50-55 43.21-48.36
LHV (MJ/Nm3, dry basis)
5-5.9 5.8 5.8 5-5.86 5-5.86 4.67-5.61
I. ČEKOVIĆ et al.: MODELING OF WOOD CHIPS GASIFICATION… Chem. Ind. Chem. Eng. Q. 25 (3) 217−228 (2019)
226
Table 12. Literature review (experimental work and modeling of wood gasification) for Aspen Plus validation; producer gas composition (mol %, dry basis)
Component
Ref. Aspen Plus results (S1-S12)
[23] [24] [24,25] [24,26]
Experiment Model Experiment Experiment Model
CO2 15.3 9.4-15.3 14-16 9.6-11 16.06-17.64
H2 16.5 9.8-16.8 12-16 10-14 17.98-20.33
CO 15.9 18.5-20.3 18-20 18-21 13.71-17.26
CH4 2.1 2.4-4.5 2.5 2.5-4.8 1.65-2.89
N2 50.2 43-60 45-49 52-54 43.21-48.36
LHV (MJ/Nm3, dry basis)
4.61-5.02 – ≈4.80-5.28 4.84-5.32 4.67-5.61
ER 0.32-0.37 – ≈0.22-0.31 0.24-0.31 0.32-0.38
Air/Fuel ≈1.78-2 1.4-2.2 1-2 1.4-1.82 1.49-1.81
Table 13. Literature review (experimental work and modelling of wood gasification) for Aspen Plus validation
Component
Ref. Aspen Plus results (S1-S12)
[23] [24] [24,25] [24,26]
Experiment Model Experiment Experiment Model
CO2 15.3 9.4-15.3 14-16 9.6-11 16.06-17.64
H2 16.5 9.8-16.8 12-16 10-14 17.98-20.33
CO 15.9 18.5-20.3 18-20 18-21 13.71-17.26
CH4 2.1 2.4-4.5 2.5 2.5-4.8 1.65-2.89
N2 50.2 43-60 45-49 52-54 43.21-48.36
LHV (MJ/Nm3, dry basis)
4.61-5.02 – ≈4.80-5.28 4.84-5.32 4.67-5.61
ER 0.32-0.37 – ≈0.22-0.31 0.24-0.31 0.32-0.38
Air/Fuel ≈1.78-2 1.4-2.2 1-2 1.4-1.82 1.49-1.81
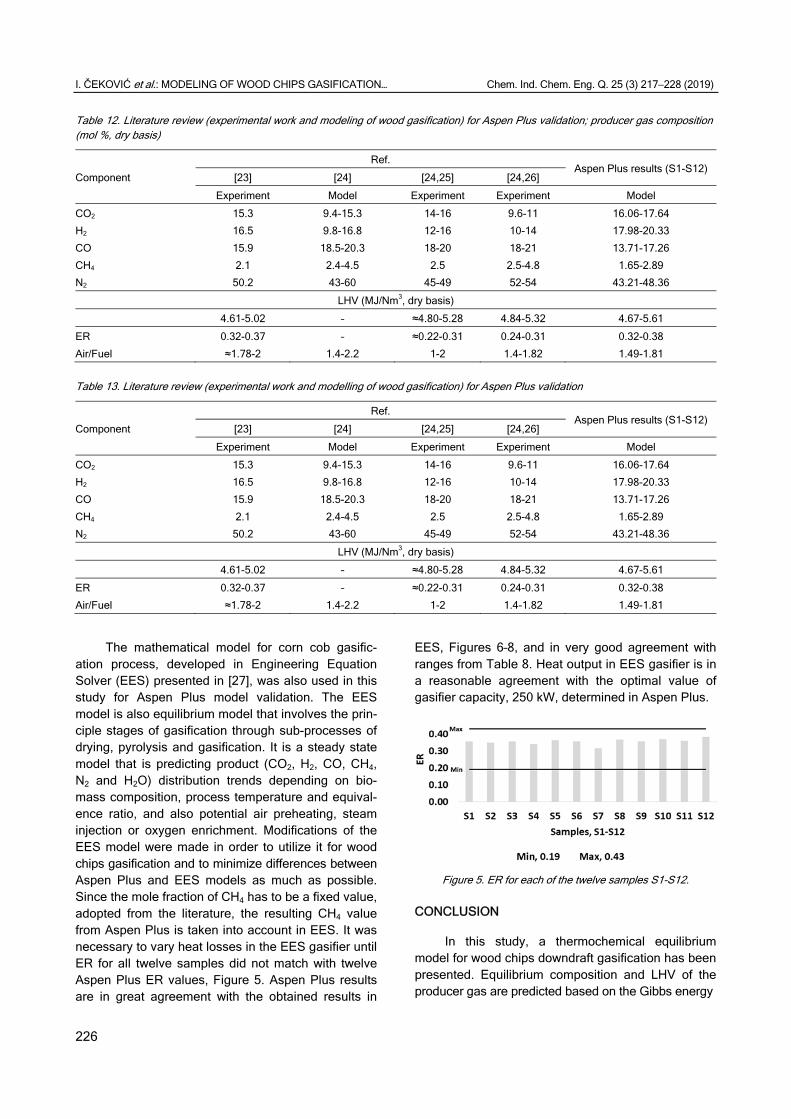
The mathematical model for corn cob gasific-
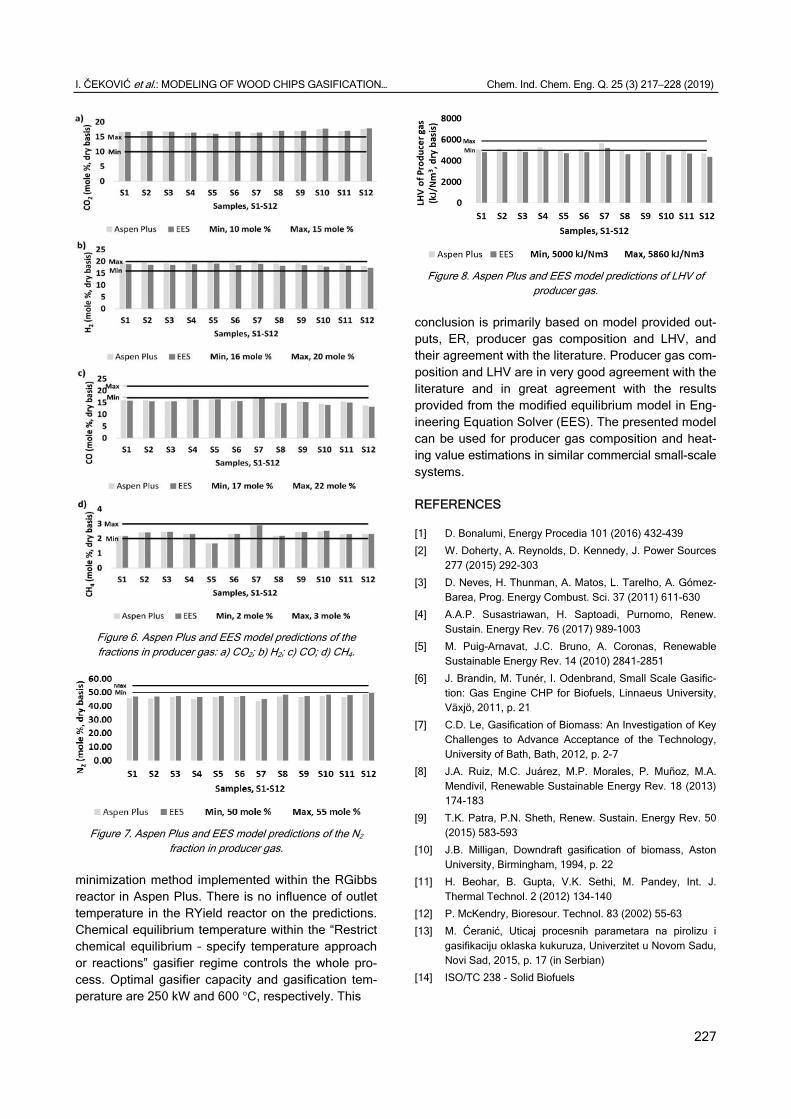
ation process, developed in Engineering Equation Solver (EES) presented in [27], was also used in this study for Aspen Plus model validation. The EES model is also equilibrium model that involves the prin-ciple stages of gasification through sub-processes of drying, pyrolysis and gasification. It is a steady state model that is predicting product (CO2, H2, CO, CH4, N2 and H2O) distribution trends depending on bio-mass composition, process temperature and equival-ence ratio, and also potential air preheating, steam injection or oxygen enrichment. Modifications of the EES model were made in order to utilize it for wood chips gasification and to minimize differences between Aspen Plus and EES models as much as possible. Since the mole fraction of CH4 has to be a fixed value, adopted from the literature, the resulting CH4 value from Aspen Plus is taken into account in EES. It was necessary to vary heat losses in the EES gasifier until ER for all twelve samples did not match with twelve Aspen Plus ER values, Figure 5. Aspen Plus results are in great agreement with the obtained results in
EES, Figures 6–8, and in very good agreement with ranges from Table 8. Heat output in EES gasifier is in a reasonable agreement with the optimal value of gasifier capacity, 250 kW, determined in Aspen Plus.
Figure 5. ER for each of the twelve samples S1-S12.
CONCLUSION
In this study, a thermochemical equilibrium model for wood chips downdraft gasification has been presented. Equilibrium composition and LHV of the producer gas are predicted based on the Gibbs energy
I. ČEKOVIĆ et al.: MODELING OF WOOD CHIPS GASIFICATION… Chem. Ind. Chem. Eng. Q. 25 (3) 217−228 (2019)
227
Figure 6. Aspen Plus and EES model predictions of the fractions in producer gas: a) CO2; b) H2; c) CO; d) CH4.
Figure 7. Aspen Plus and EES model predictions of the N2
fraction in producer gas.
minimization method implemented within the RGibbs reactor in Aspen Plus. There is no influence of outlet temperature in the RYield reactor on the predictions. Chemical equilibrium temperature within the “Restrict chemical equilibrium – specify temperature approach or reactions” gasifier regime controls the whole pro-cess. Optimal gasifier capacity and gasification tem-perature are 250 kW and 600 °C, respectively. This
Figure 8. Aspen Plus and EES model predictions of LHV of
producer gas.
conclusion is primarily based on model provided out-puts, ER, producer gas composition and LHV, and their agreement with the literature. Producer gas com-position and LHV are in very good agreement with the literature and in great agreement with the results provided from the modified equilibrium model in Eng-ineering Equation Solver (EES). The presented model can be used for producer gas composition and heat-ing value estimations in similar commercial small-scale systems.
REFERENCES
[1] D. Bonalumi, Energy Procedia 101 (2016) 432-439
[2] W. Doherty, A. Reynolds, D. Kennedy, J. Power Sources 277 (2015) 292-303
[3] D. Neves, H. Thunman, A. Matos, L. Tarelho, A. Gómez-Barea, Prog. Energy Combust. Sci. 37 (2011) 611-630
[4] A.A.P. Susastriawan, H. Saptoadi, Purnomo, Renew. Sustain. Energy Rev. 76 (2017) 989-1003
[5] M. Puig-Arnavat, J.C. Bruno, A. Coronas, Renewable Sustainable Energy Rev. 14 (2010) 2841-2851
[6] J. Brandin, M. Tunér, I. Odenbrand, Small Scale Gasific-tion: Gas Engine CHP for Biofuels, Linnaeus University, Växjö, 2011, p. 21
[7] C.D. Le, Gasification of Biomass: An Investigation of Key Challenges to Advance Acceptance of the Technology, University of Bath, Bath, 2012, p. 2-7
[8] J.A. Ruiz, M.C. Juárez, M.P. Morales, P. Muñoz, M.A. Mendívil, Renewable Sustainable Energy Rev. 18 (2013) 174-183
[9] T.K. Patra, P.N. Sheth, Renew. Sustain. Energy Rev. 50 (2015) 583-593
[10] J.B. Milligan, Downdraft gasification of biomass, Aston University, Birmingham, 1994, p. 22
[11] H. Beohar, B. Gupta, V.K. Sethi, M. Pandey, Int. J. Thermal Technol. 2 (2012) 134-140
[12] P. McKendry, Bioresour. Technol. 83 (2002) 55-63
[13] M. Ćeranić, Uticaj procesnih parametara na pirolizu i gasifikaciju oklaska kukuruza, Univerzitet u Novom Sadu, Novi Sad, 2015, p. 17 (in Serbian)
[14] ISO/TC 238 - Solid Biofuels
I. ČEKOVIĆ et al.: MODELING OF WOOD CHIPS GASIFICATION… Chem. Ind. Chem. Eng. Q. 25 (3) 217−228 (2019)
228
[15] A.J. Keche, A.P.R. Gaddale, R.G. Tated, Clean Technol. Environ. Policy 17 (2015) 465-473
[16] S.M. Atnaw, S.A. Sulaiman, S. Yusup, J. Appl. Sci. 11 (2011) 1913-1920
[17] C. Panda, ASPEN Plus Simulation and Experimental Studies on Biomass Gasification, National Institute of Technology Rourkela, Rourkela, 2012, p. 12
[18] F. Paviet, F. Chazarenc, M. Tazerout, Int. J. Chem. React. Eng. 7 (2009) 1-16
[19] Z.A. Zainal, A. Rifau, G.A. Quadir, K.N. Seetharamu, Biomass Bioenergy 23 (2002) 283-289
[20] N.L. Panwar, R. Kothari, V.V. Tyagi, Renew. Sustain. Energy Rev. 16 (2012) 1801-1816
[21] T.B. Reed, A. Das, Handbook of Biomass Downdraft Gasifier Engine Systems, The Biomass Energy Found-ation Press, Colorado, 1988, p. 24
[22] A.K. Rajvanshi, in Alternative Energy in Agriculture, D.Y. Goswami, CRC Press, Greensboro, 1986, p. 83
[23] Y.-I. Son, S. J. Yoon, Y. K. Kim, J.-G. Lee, Biomass Bioenergy 35 (2011) 4215 ̶ 4220
[24] C.D. Blasi, Chem. Eng. Sci. 55 (2000) 2931-2944
[25] W.P. Walawender, S.M. Chern, L.T. Fan, in Fundam-entals of Thermochemical Biomass Conversion, R.P. Overend, T.A. Milne, L.K. Mudge, Springer, Dordrecht, 1985, p. 911
[26] Y. Wang, C.M. Kinoshita, in Advances in Thermochem-ical Biomass Conversion, Springer, A.V. Bridgwater, Dordrecht, 1993, p. 280
M.R. Trninić, Modeling and optimisation of corn cob pyrolysis, University of Belgrade, Belgrade, 2015, p. 215.
IVANA ČEKOVIĆ1
NEBOJŠA MANIĆ2
DRAGOSLAVA STOJILJKOVIĆ2 MARTA TRNINIĆ2
DUŠAN TODOROVIĆ2
ALEKSANDAR JOVOVIĆ2
1Inovacioni centar Mašinskog fakulteta, Kraljice Marije 16, 11120 Beograd,
Srbija 2Mašinski fakultet Univerziteta u
Beogradu, Kraljice Marije 16, 11120 Beograd, Srbija
NAUČNI RAD
MODELOVANJE PROCESA GASIFIKACIJE DRVNE SEČKE U ASPEN PLUS PAKETU METODOM VIŠESTRUKOG VALIDACIJSKOG PRISTUPA
Termodinamički ravnotežni model razvijen je za proces istosmerne gasifikacije drvne sečke. Stacionarni ASPEN Plus simulator korišćen je za procenu sastava i donje top-otne moći proizvedenog gasa. Razmatrana su tri slučaja, usled različitih pretpostavki uvedenih tokom razvoja matematičkog modela, i svi su detaljno opisani. Eksperimen-talni deo realizovan je u manjem komercijalnom CHP postrojenju, pri čemu je uzorko-vano dvanaest uzoraka bukove sečke. Koeficijent viška vazduha je u opsegu od 0,32 do 0,38 i odnos vazduh-gorivo od 1,49 do 1,81, za optimalan kapacitet gasifikatora, od 250 kW. Molski udeli CO2, H2, CO, CH4 i N2, u suvom gasu, su redom 16,06-17,64, 17,98-–20,33, 13,71-17,26, 1,65-2,89 i 43,21-48,36. Višestruki validacijski pristup korišćen je za potvrdu modela. Rezultati su u dovoljnoj meri saglasni sa različitim literarturnim izvo-rima (eksperimenti i modelovanje) i u velikoj meri sa modifikovanim ravnotežnim mode-lom iz literature razvijenim u Engineering Equation Solver paketu. Odstupanja u rezulta-tima mogu se objasniti na dva načina. Eksperimenti istosmerne gasifikacije drveta su u određenoj meri različiti i parametri modela se ne mogu u dovoljnoj meri podesiti kako bi se smanjile razlike. Donja toplotna moć proizvedenog gasa kreće se u opsegu od 4,67-–5,61 MJ/Nm3.
Ključne reči: ASPEN, istosmerna gasifikacija, eksperiment, modelovanje, više-struki validacijski pristup, drvna sečka.