Embed Size (px)
Citation preview

1
TRAINING DUBROVNIK, CROATIA - APRIL, 27 - 29 2009
SIMULATION & ANALYSIS OF POWER SYSTEM TRANSIENTS WITH
EMTP-RV
Modeling of Transmission Line and Substation for
Insulation Coordination Studies
Prof. Ivo Uglešić
Faculty of Electrical Engineering and Computing
University of Zagreb, Croatia
2
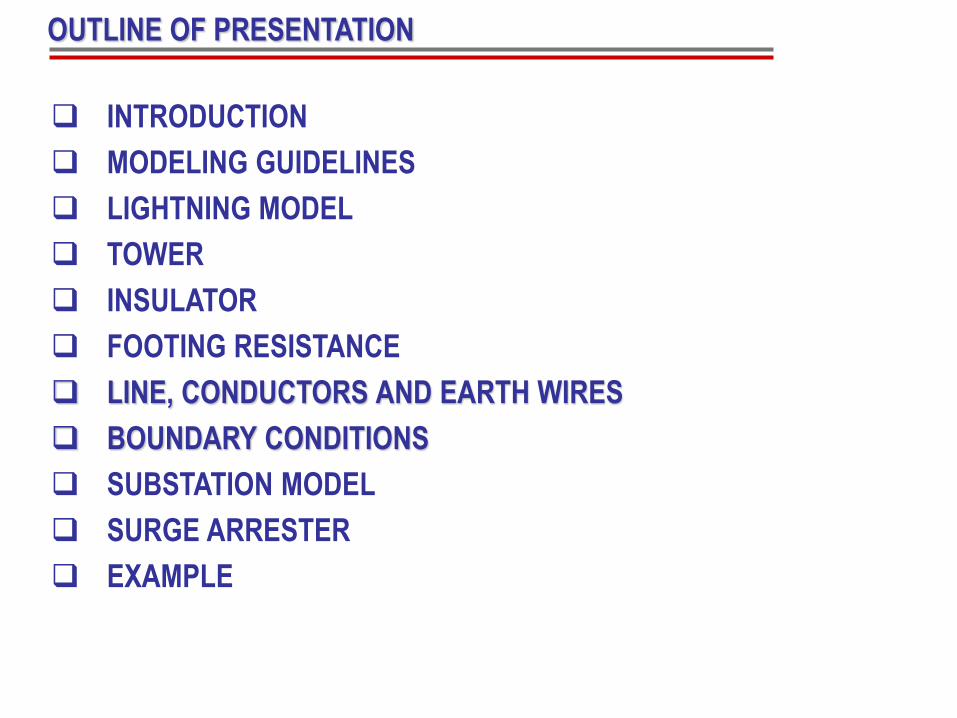
OUTLINE OF PRESENTATION
INTRODUCTION
MODELING GUIDELINES
LIGHTNING MODEL
TOWER
INSULATOR
FOOTING RESISTANCE
LINE, CONDUCTORS AND EARTH WIRES
BOUNDARY CONDITIONS
SUBSTATION MODEL
SURGE ARRESTER
EXAMPLE

3
INTRODUCTION
Computer modeling of transmission lines and substation helps
engineers understand how protection systems behave during
disturbances and faults.
Any transient disturbance, such as lightning stroke terminating on a
phase conductor can be analyzed by use of traveling wave.
A lightning stroke to a conductor or the closing of a circuit breaker
produces traveling waves of voltage u(t) and current i(t) that are related
by a surge impedance Z equal to formula that travels along the
conductor at the speed of light c.
)(
)(
ti
tuZ

4
I, tf
Back-flashover
I, tf
Shielding failure
Induced overvoltage
I, tf
INTRODUCTION (Lightning overvoltages on HV transmission lines)

5
Definitions of insulation coordination:
Insulation coordination is the selection of the insulation strength.
Insulation coordination is the “selection of the dielectric strength of the equipment in relation to the voltages which can appear on the system for which equipment is intended and taking into account the service environment and the characteristics of the available protective devices (*) ”.
(*) IEC 60071-1-1993-12: Insulation coordination – Part 1: Definitions, principles and rules.
Line insulation coordination; transmission and distribution lines.
Substation insulation coordination; generation, transmission and
distribution substation.
INTRODUCTION

6
MODELLING GUIDELINES
There are various modeling strategies for lightning transient
studies have been presented elsewhere.
The summary of modeling guidelines that had been adapted:
• IEC/TR 60071-4 Edition 1.0 (2004-06): Insulation co-ordination -
Part 4: Computational guide to insulation co-ordination and
modeling of electrical networks;
• IEEE PES Task Force on Data for Modeling System Transients
of IEEE PES Working Group on Modeling and Analysis of System
Transients Using Digital Simulation: Parameter Determination for
Modeling System Transients, IEEE Transactions on Power
Delivery, Vol. 20, No. 3, July 2005.

7
MODELLING GUIDELINES
• CIGRE, Working Group 01 of Study Committee 33: Guide to
Procedures for Estimating the Lightning Performance of
Transmission lines, Paris, October 1991.
• IEEE Working Group 15.08.09: Modeling and Analysis of System
Transients Using Digital Programs, 1998.
• IEEE Working Group: A Simplified Method for Estimating
Lightning Performance of Transmission Lines, IEEE Transactions
on Power Apparatus and System, Vol. 104, No. 4, April 1985.

8
LIGHTNING MODEL
Lightning stroke is represented as
a current source with magnitudes
between a few kA to over 200 kA.
Peak current magnitude and tail
time are important when
observing energy stresses of SA
(simplest representation is double
ramp).
Current wavefront is an important
parameter with regard to insulator
flashover.
CIGRE model describes well the
concave wavefront of a lightning
current.t90t30 th
I30
I50
I90
I100
Ip
t (ms)
I (kA)
th t (ms)
I50
I100
IpI (kA)
tf
Double ramp shape
tf – front time
th – time to half-value

9
A statistical approach considering the ground flash density at the
location is used for the determination of lightning parameters
such as:
– crest value;
– front time;
– maximum current steepness;
– duration.
The probability that a certain peak current will be equal or greater
than a current I can be determined by Anderson’s distribution:
6.2
311
1
I
P
Where:
P(I) = the probability that the peak current in any stroke will exceed I
I = the specified crest current of the stroke in kA.
LIGHTNING MODEL
10
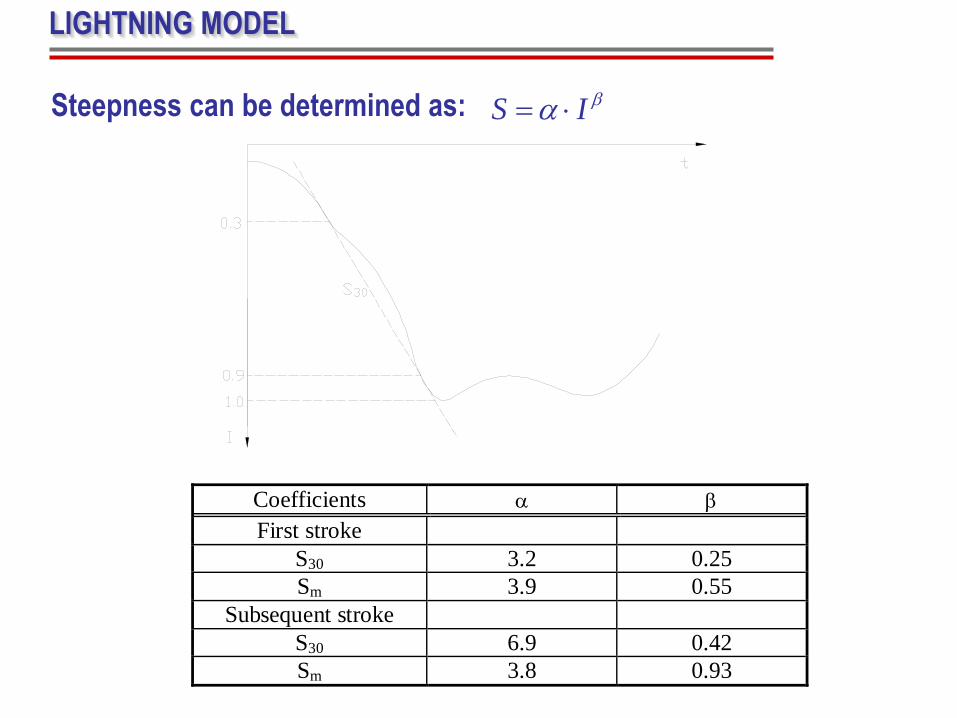
Steepness can be determined as:
Coefficients
First stroke
S30 3.2 0.25
Sm 3.9 0.55
Subsequent stroke
S30 6.9 0.42
Sm 3.8 0.93
IS
LIGHTNING MODEL
11
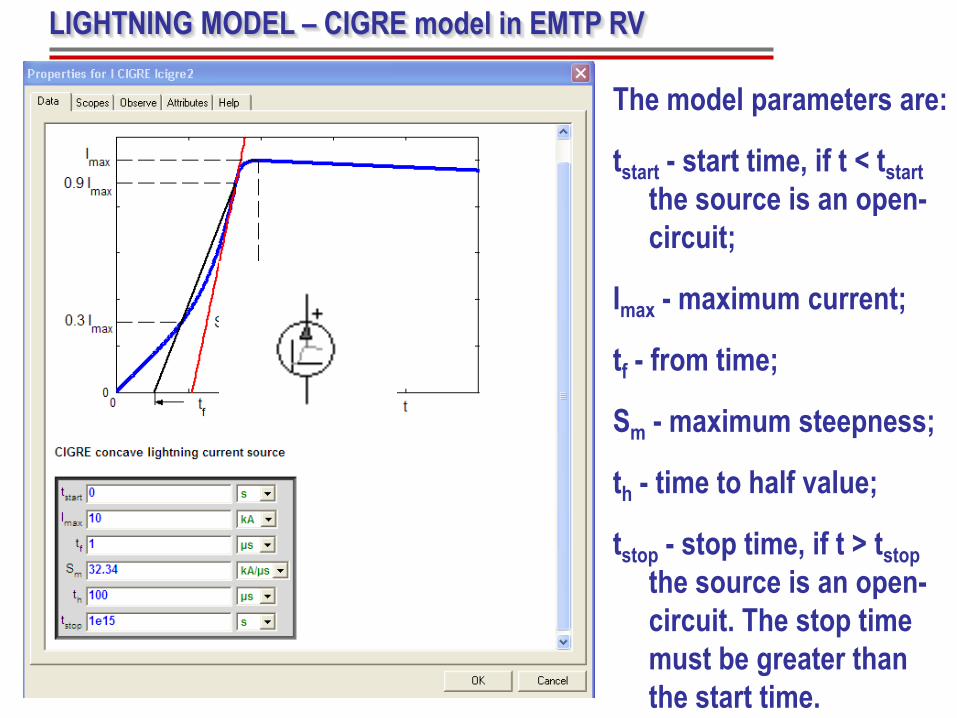
LIGHTNING MODEL – CIGRE model in EMTP RV
The model parameters are:
tstart - start time, if t < tstart
the source is an open-
circuit;
Imax - maximum current;
tf - from time;
Sm - maximum steepness;
th - time to half value;
tstop - stop time, if t > tstop
the source is an open-
circuit. The stop time
must be greater than
the start time.

12
Extensive research has been performed on the response of
vertical towers to lightning strokes, and research is still
continuing.
The response of a tower is an electromagnetic problem, although
its study often relies on the circuit approach and models that are
simple to apply in transient simulations:
simple distributed line model,
multistory tower model.
Simple distributed line model provides a constant value of surge impedance and the constant velocity of travel along the tower.
Different formulas are applied for various tower types.
TOWER

13
1r
2r
3r
1h
2h
R
H
– half-angle of cone,
H – tower height [m],
R – tower base radius [m].
TOWER - Simple Distributed Line Model
The tower surge impedance depends on the direction of wave
propagation and the shape of a lightning current.
The average surge impedance recommended by IEEE and CIGRE:
H
RZ
1tan
2
1cotln60
2cotln60
HRR
HZ
1ln60
H
hrHrhrR
)( 13221
Radius R is calculated by dividing the tower into
upper and lower truncated cones:
An approximation of surge impedance equation is determined by
equivalently replacing the tower with a cylinder.

14
TOWER - Multistory Tower Model
Multistory tower model is developed
for representing towers of UHV
transmission lines (*). Its parameters
were revised according to the results
of experimental studies (**).
The model is composed of four
sections representing the tower
sections between cross-arms.
Each section consists of a lossless
line in series with a parallel R-L circuit,
included for attenuation of the
traveling waves.
1l
2l
3l
4l
1R 1L
1tZ
2tZ
4R 4L
2R
3R
fR
2L
3L
1tZ
1tZ
(*) M. Ishii, T. Kawamura, T. Kouno, E. Ohsaki, K. Shiokawa, K. Murotani, and T. Higuchi, “Multistory transmission tower model for lightning surge analysis,” IEEE Trans. Power Delivery, vol. 6, July 1991, pp. 1327–1335
(**) Yamada, T.; Mochizuki, A.; Sawada, J.; Zaima, E.; Kawamura, T.; Ametani, A.; Ishii, M.; Kato, S.; „Experimental evaluation of a UHV tower model for lightning surge analysis“ IEEE Trans. Power Delivery, Vol. 10, No. 1, Jan. 1995 pp 393 – 402
15
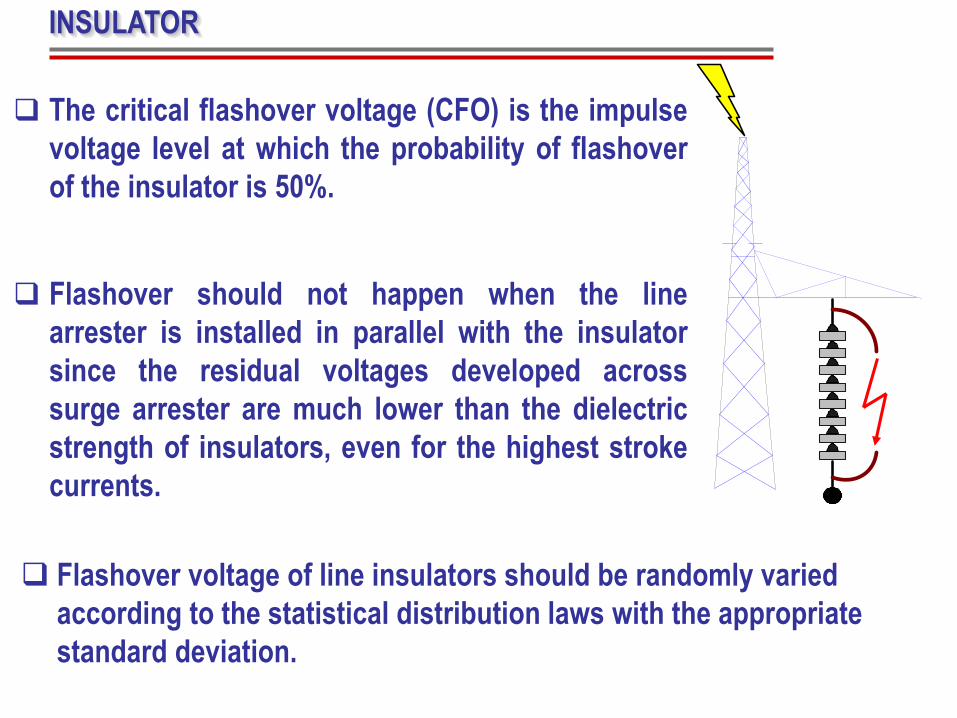
INSULATOR
The critical flashover voltage (CFO) is the impulse
voltage level at which the probability of flashover
of the insulator is 50%.
Flashover should not happen when the line
arrester is installed in parallel with the insulator
since the residual voltages developed across
surge arrester are much lower than the dielectric
strength of insulators, even for the highest stroke
currents.
Flashover voltage of line insulators should be randomly varied
according to the statistical distribution laws with the appropriate
standard deviation.
16
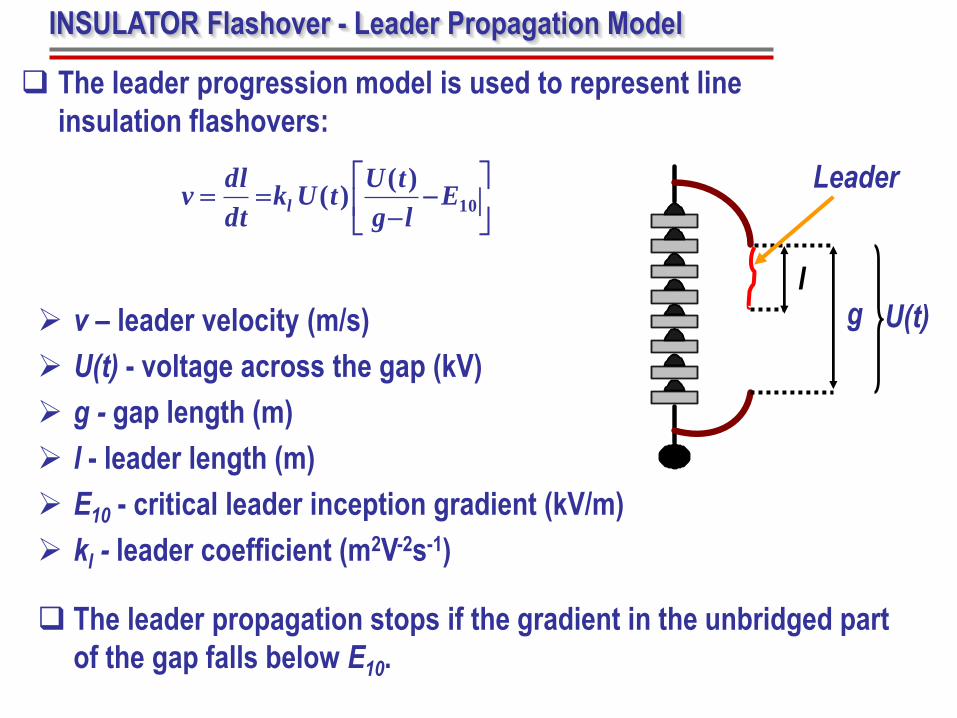
INSULATOR Flashover - Leader Propagation Model
v – leader velocity (m/s)
U(t) - voltage across the gap (kV)
g - gap length (m)
l - leader length (m)
E10 - critical leader inception gradient (kV/m)
kl - leader coefficient (m2V-2s-1)
The leader propagation stops if the gradient in the unbridged part
of the gap falls below E10.
10
)()( E
lg
tUtUk
dt
dlv l
lg U(t)
Leader
The leader progression model is used to represent line
insulation flashovers:
17
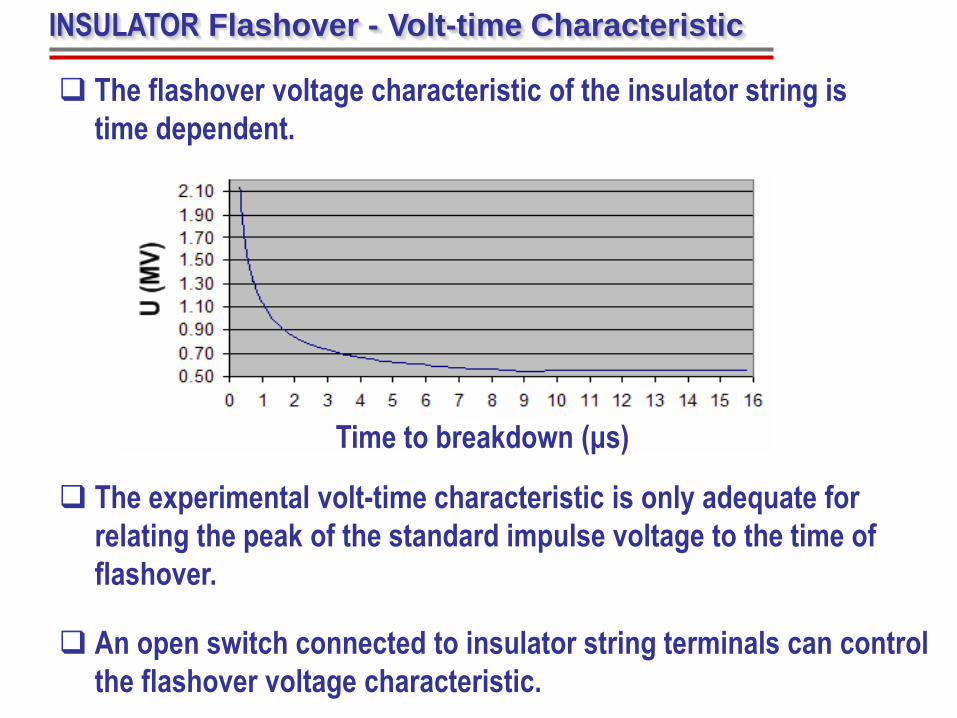
INSULATOR Flashover - Volt-time Characteristic
The flashover voltage characteristic of the insulator string is
time dependent.
The experimental volt-time characteristic is only adequate for
relating the peak of the standard impulse voltage to the time of
flashover.
An open switch connected to insulator string terminals can control
the flashover voltage characteristic.
Time to breakdown (μs)

18
INSULATOR Flashover - Area Criterion Model
The method allows the applied nonstandard waveform to be taken
into account.
It involves determining the instant of breakdown using a formula:
DdtVtV k
t
T
gap ))(( 0
0
(*) IEC 60071-4: Insulation co-ordination – Part 4: Computational guide to insulation co-ordination and modeling of electrical networks, 2004.
Vgap(t) - voltage applied at the time t, to the terminals of the air gap,
V0 - minimum voltage to be exceeded before any breakdown process
can start or continue,
T0 - time from which Vgap(t) > V0,
k, V0, D - constants corresponding to an air gap configuration and
overvoltage polarity (*).
Flashover occurs when the integral becomes greater or equal to D.
The parameters V0, k and D are determined by using the voltage-
time curve.

19
TOWER - Example
HR
R
HZ
1ln60
Tower surge impedances are calculated using equation:
Each tower is divided in four
parts. First part is from tower top
to upper arm, second one from
upper arm to middle arm, third
part from middle arm to lower arm
and the last part from lower arm to
ground. On this way it is possible
to calculate transient voltages of
tower arms.

20
TOWER

21
It can be represented as:
constant resistor (conservative approach),
current and frequency dependable resistor.
The ionization model takes into account the soil ionization caused by the lightning currents.
Tower grounding non-linear resistor should be represented as:
g
oi
I
I
RR
1
- soil resistivity m;
E0 - is the soil ionization gradient, recommended value: 400 kV/m.
20
2 o
gR
EI
- limiting current to initiate sufficient soil ionization kA.
Ro- footing resistance at low current and low frequency, i.e. 50 or 60 Hz ;
I - stroke current through the resistance kA;
Arc StreamerElectrolytic
conductivity
Constant
conductivityEarth surface
FOOTING RESISTANCE
22
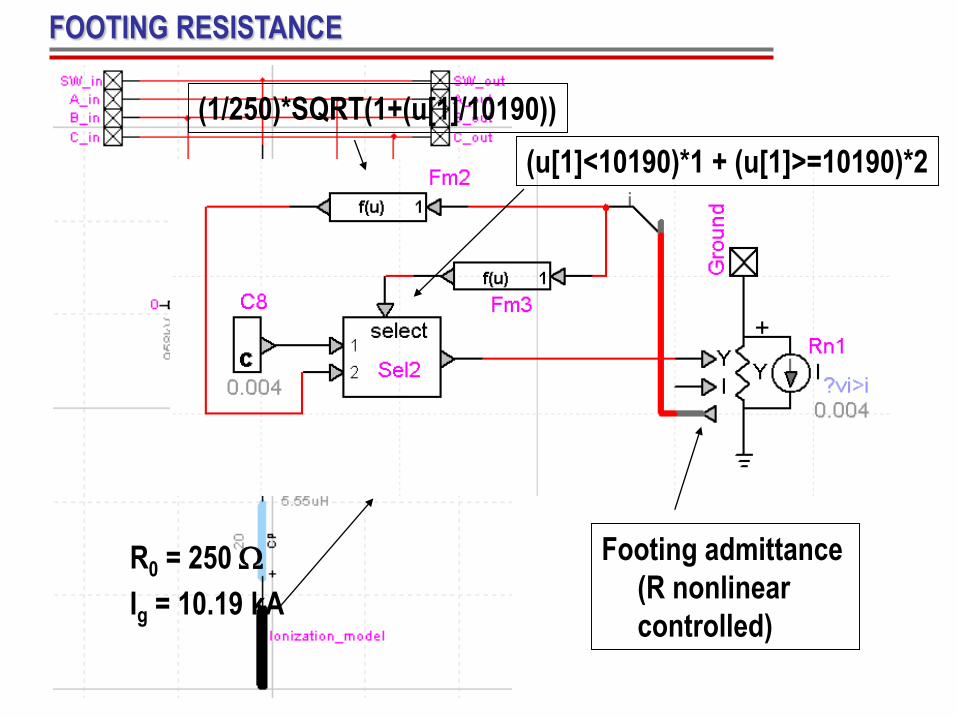
FOOTING RESISTANCE
Footing admittance
(R nonlinear
controlled)
(1/250)*SQRT(1+(u[1]/10190))
R0 = 250
Ig = 10.19 kA
(u[1]<10190)*1 + (u[1]>=10190)*2

23
LINE, CONDUCTORS AND EARTH WIRES
The transmission line, conductors and
earth wire have to be represented by
frequency-dependent parameters of
multi-phase untransposed distributed
line.
A line termination should be connected
on the modeled line to prevent
reflections that could affect the
simulated overvoltages.
Several line spans in front of substation
should be modeled when observing the
overvoltages in substation.
4.65 m
3 m
3 m
20 m
5.55 m
4.8 m
4 m

24
LINE, CONDUCTORS AND EARTH WIRES

25
LINE, CONDUCTORS AND EARTH WIRES
26
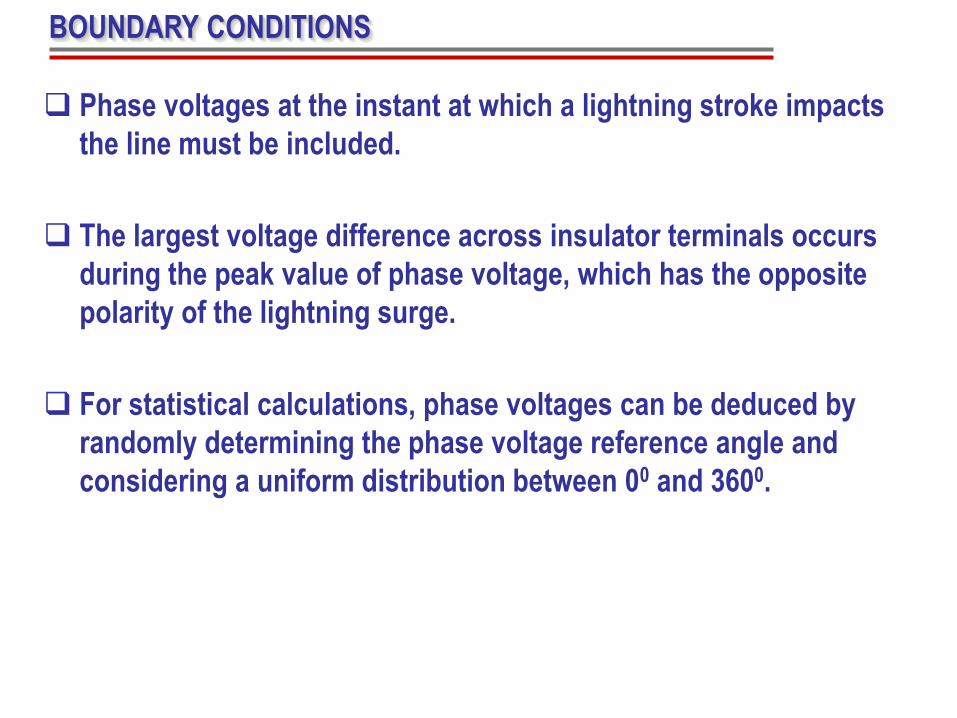
BOUNDARY CONDITIONS
Phase voltages at the instant at which a lightning stroke impacts
the line must be included.
The largest voltage difference across insulator terminals occurs
during the peak value of phase voltage, which has the opposite
polarity of the lightning surge.
For statistical calculations, phase voltages can be deduced by
randomly determining the phase voltage reference angle and
considering a uniform distribution between 00 and 3600.

27
BOUNDARY CONDITIONS
28
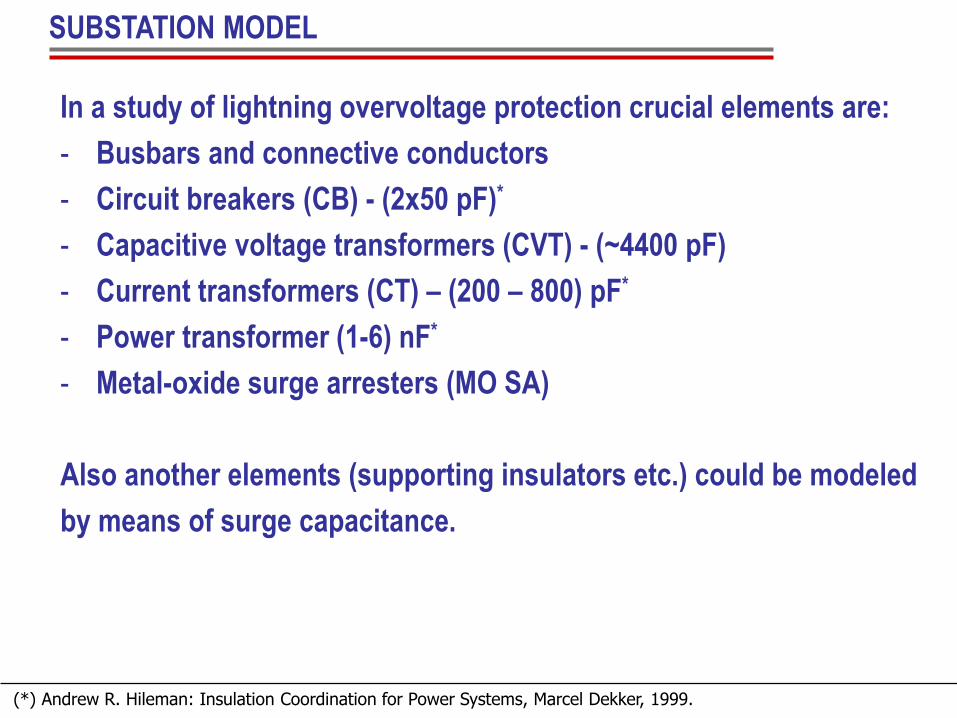
SUBSTATION MODEL
In a study of lightning overvoltage protection crucial elements are:
- Busbars and connective conductors
- Circuit breakers (CB) - (2x50 pF)*
- Capacitive voltage transformers (CVT) - (~4400 pF)
- Current transformers (CT) – (200 – 800) pF*
- Power transformer (1-6) nF*
- Metal-oxide surge arresters (MO SA)
Also another elements (supporting insulators etc.) could be modeled
by means of surge capacitance.
(*) Andrew R. Hileman: Insulation Coordination for Power Systems, Marcel Dekker, 1999.
29
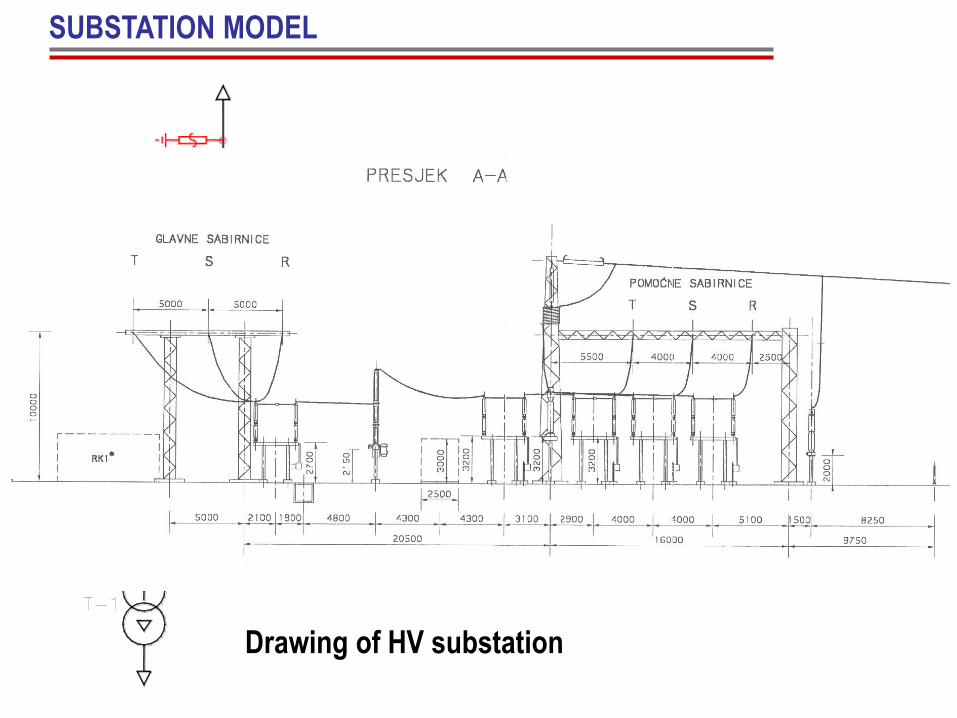
SUBSTATION MODEL
1
2
Drawing of HV substation

30
SUBSTATION MODEL

31
The non-linear behaviour is represented by the U-I characteristic.
SURGE ARRESTER - Gapless Type
The arrester leads can be modeled as conductors whose lumped
parameter inductances have a value of approximately 1 µH/m.

32
0R
0L
0AC
1R
1L
1A
The frequency-dependent arrester model proposed by IEEE WG
takes into account its dynamic behaviour.
IEEE model needs iterative procedure for identification of parameters.
Simplified IEEE model uses data reported on manufacturers’ datasheets.
Capacitance is eliminated and the two resistances in parallel with the inductances are replaced by one resistance R.
Complete IEEE model Simplified IEEE model *
0L
0A
1L
1ARR
*P. Pinceti, M. Giannettoni, “A simplified model for zinc oxide surge arrester”, IEEE Trans. Power Delivery, Vol. 14,No. 2, April 1999, pp 545 – 550
SURGE ARRESTER - Gapless Type
33
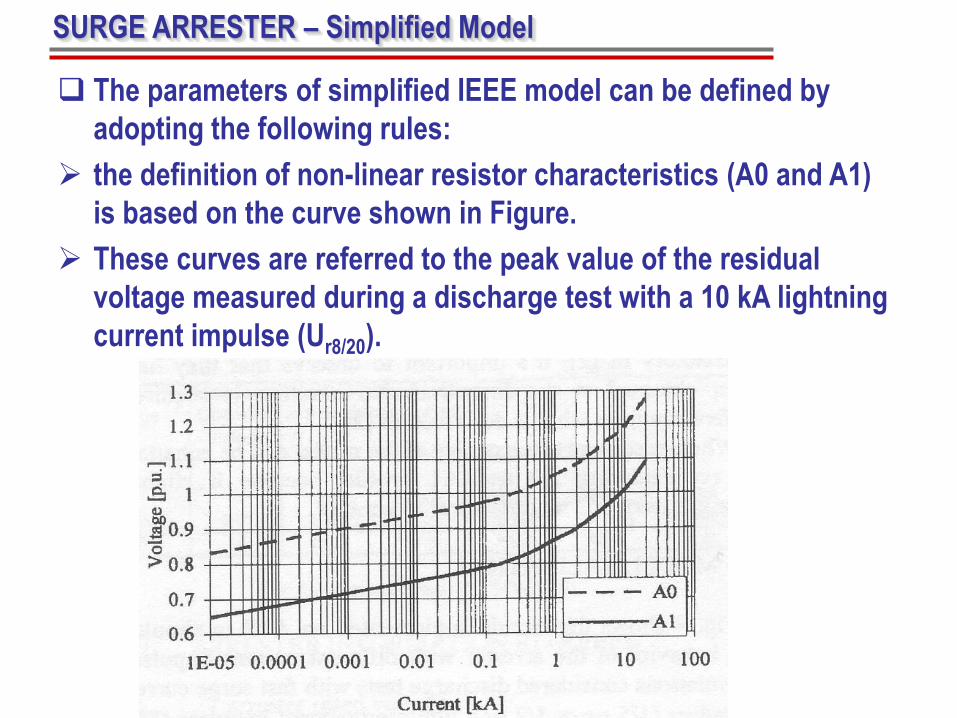
The parameters of simplified IEEE model can be defined by
adopting the following rules:
the definition of non-linear resistor characteristics (A0 and A1)
is based on the curve shown in Figure.
These curves are referred to the peak value of the residual
voltage measured during a discharge test with a 10 kA lightning
current impulse (Ur8/20).
SURGE ARRESTER – Simplified Model

34
The following equations can be used to define the inductances
(values are in µH):
r
/r
/rT/rU
U
UUL
208
2081
12
4
1
r
/r
/rT/rU
U
UUL
208
2081
02
12
1
where:
Ur is the arrester rated voltage,
Ur1/T2 is the residual voltage at 10 kA fast-front current surge (1/T2
μs). The decrease time T2 may have different values, which don’t
have any influence, since the peak value of the residual voltage
appears on the rising front of the impulse,
Ur8/20 residual voltage at 10 kA current surge with 8/20 µs shape.
SURGE ARRESTER – Simplified Model

35
SURGE ARRESTER

36
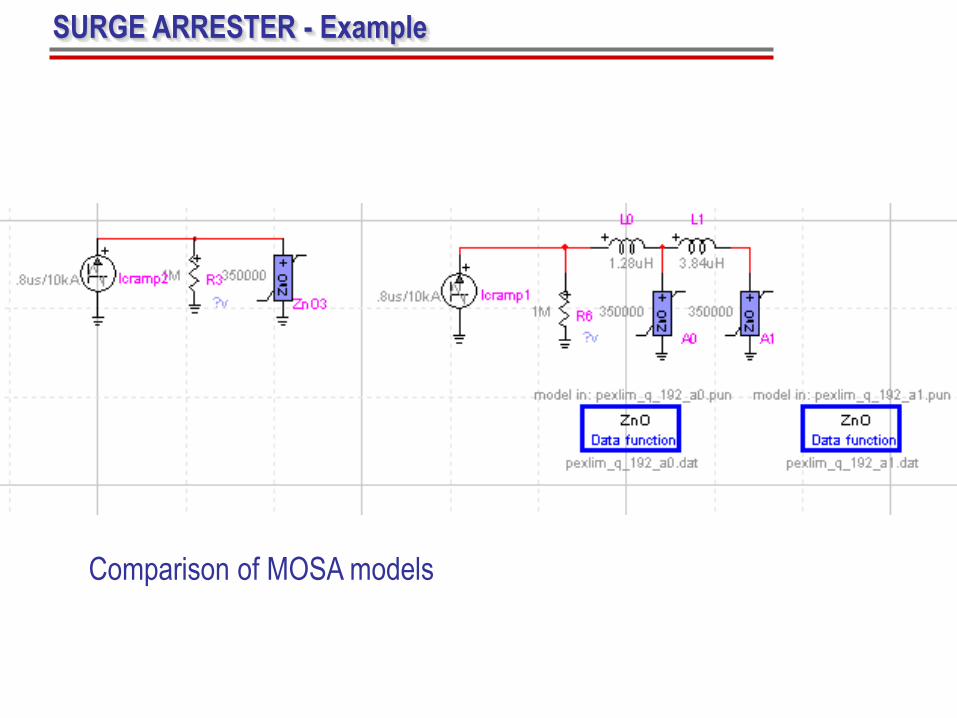
SURGE ARRESTER - Example
Current (A) Voltage (V)
1000 419100
2000 435600
5000 471900
10000 479200
20000 546700
40000 610500
Residual voltage for MOSA of Ur=192 kV
37
SURGE ARRESTER - Example
Comparison of MOSA models

38
EXAMPLE – Shielding failure case
- Stroke 10 kA, 32.34 kA/µs,
- CVT voltage without MO SA in line bay.

39
EXAMPLE – Shielding failure case
- Stroke 10 kA, 32.34 kA/µs,
- CVT voltage with MO SA in line bay.
40
TRAINING DUBROVNIK, CROATIA - APRIL, 27 - 29 2009
SIMULATION & ANALYSIS OF POWER SYSTEM TRANSIENTS WITH
EMTP-RV
Modeling of Transmission Line and Substation for
Insulation Coordination Studies
Prof. Ivo Uglešić
Faculty of Electrical Engineering and Computing
University of Zagreb, Croatia


![July 2012 Buchanan Creek Substation Transmission Project Creek... · Buchanan Creek Substation Transmission Project 1 ... new substation and approximately 150 metres of new ... (kV)],](https://img.pdfslide.us/doc/110x75/5ae59a7b7f8b9ae1578c809f/july-2012-buchanan-creek-substation-transmission-creekbuchanan-creek-substation.jpg)