Embed Size (px)
Citation preview
Journal of Geographic Information System, 2014, 6, 404-413 Published Online August 2014 in SciRes. http://www.scirp.org/journal/jgis http://dx.doi.org/10.4236/jgis.2014.64035
How to cite this paper: Sultan, S., Wu, R.G., Ahmad, I. and Ahmad, M.F. (2014) Modeling of Diffuse Solar Radiation and Impact of Complex Terrain over Pakistan Using RS/GIS. Journal of Geographic Information System, 6, 404-413. http://dx.doi.org/10.4236/jgis.2014.64035
Modeling of Diffuse Solar Radiation and Impact of Complex Terrain over Pakistan Using RS/GIS Shahzad Sultan1,2, Renguang Wu1,3, Iftikhar Ahmad4, M. Fahim Ahmad5 1Institute of Space and Earth Information Science, Chinese University of Hong Kong, Hong Kong, China 2Pakistan Meteorological Department, Islamabad, Pakistan 3Shenzhen Research Institute, Chinese University of Hong Kong, Hong Kong, China 4Department of Geography, University of Balochistan, Quetta, Pakistan 5Nanjing University of Information Science and Technology, Nanjing, China Email: [email protected] Received 28 April 2014; revised 28 May 2014; accepted 25 June 2014
Copyright © 2014 by authors and Scientific Research Publishing Inc. This work is licensed under the Creative Commons Attribution International License (CC BY). http://creativecommons.org/licenses/by/4.0/
Abstract Diffuse solar radiation is subject to the combined influence of ground and sky factors, such as to-pography, geography of the area and cloud cover. This study attempts to quantify the impacts of topography, sky factors and the cloud cover on the distribution of diffuse solar radiation over Pakistan. Distributed modeling approach by considering anisotropy scattering mechanism was adopted. Digital elevation model and observed data are used to derive average monthly diffuse solar radiation values over the rugged terrains of Pakistan. Extraterrestrial solar radiation model, sky view factor model (openness model) and digital elevation model (DEM) are applied to inves-tigate the impacts of ground factors, while diffuse solar radiation model for horizontal surface was considered for sky factors. Furthermore, corrected MODIS cloud fraction data are incorporated using GIS plat form. Results show that the highest amount of diffused solar radiation occurs during the monsoon months along the eastern side of the River Indus, when the sky is covered by clouds of various heights and densities. The variation due to topography is evident in mountainous areas, particularly in the North Pakistan and over the Baluchistan Plateau.
Keywords Rugged Terrain, Diffuse Radiation, Pakistan, GIS, DEM
S. Sultan et al.
405
1. Introduction Pakistan is the 33rd largest country (803,940 km2) with more than twice the size of Japan featuring heterogene-ous terrain from 0 m altitude in coastal belts to 8000 m in Himalaya ranges [1]. The whole country has only 5 meteorological stations measuring solar radiation and none of them have diffuse solar radiation measurements. It is, therefore, imperative to find other ways to estimate the solar radiation over such complex terrain.
Terrain is an important factor in describing the distribution of energy fluxes. Global irradiance on a slope is the sum of its direct (beam), diffuse and ground-reflected components. After the solar radiation enters the earth’s atmosphere, it is partially scattered and partially absorbed. The scattered radiation is called diffuse radiation. Es-timation of that is variable from day to day. Diffuse cloud radiation appears to only contribute a minor part to radiation energy from above the mid-visible to the infrared spectrum, but can contribute up to 40% of the radia-tion energy from the mid-visible through mid-ultraviolet spectrum [2].
It is obvious that the relative proportion of direct to diffuse radiation depends on the geographical location, season of the year, elevation from the mean sea level, and time of the day. On a clear-sky day, the diffuse com-ponent of solar radiation will be about 10% - 20% of the total radiation, but during an overcast day, it may reach up to 100%. This implies, practically, that in the solar radiation and energy calculations, weather, meteorological and climatological conditions implications must be taken into consideration in addition to the astronomical. The instantaneous total radiation can vary considerably through the day depending on the cloud cover, dust concen-tration, humidity, etc. [3]. That is why monthly mean values are often considered.
Diffuse sky irradiance under cloud-free conditions may be estimated by assuming an isotropic sky and calcu-lating the proportion of the sky seen from a point that is using the equivalent of the view-shed operation in GIS [4]. Under cloudy or partly cloudy conditions, diffuse radiation is anisotropic and may be explicitly modeled. The applications of digital elevation model (DEM) data provide a new means for diffuse solar radiation (DSR) calculation over the complex terrain [4]-[6].
2. Study Area Pakistan lies between 24˚ to 37˚N latitude and 62˚ to 75˚E longitude, covering a total land area of 796,096 km2 (Pakistan official website). The topography of Pakistan is a combination of landscapes varying from plains to deserts, forests, hills, and plateaus ranging from the coastal areas of the Arabian Sea in the south to the lofty mountains including Hindu-Kush, Karakoram and Himalaya ranges in the north. Pakistan is divided into three major geographic areas: the northern highlands, the Indus River plain, and the Baluchistan Plateau. The northern highlands of Pakistan contain the Karakoram, Hindu Kush and Pamir mountain ranges, which have some of the world’s highest peaks, including K2 (8611 m/28,251 ft) and Nanga Parbat (8126 m/26,660 ft) [7]. The Balu-chistan Plateau lies to the West, and the Thar Desert in the East. The vast alluvial plains were laid down through ages by the River Indus and its tributaries in Punjab and Sindh. The 1609 km (1000 mi) long. The Indus River and its tributaries flow through the country from the Kashmir region to the Arabian Sea [8] [9].
3. Data and Method 3.1. Meteorological Data The daily global solar radiation data from 1978 to 2000 and the monthly cloud cover and monthly sunshine du-ration data from 1979 to 2008 were obtained from Pakistan Meteorological Department (PMD). The data for cloud cover and sunshine duration are available from 21 stations, while data for solar radiation are obtained from 6 meteorological observatories of Pakistan (only Global Solar Radiation) and 5 Meteorological stations of China (Diffuse and Global). Data quality from Pakistan remains a pronounced concern of apprehension due to lack of funds and modern infrastructure with trained personals. The continuity of solar radiation data can be categorized into two groups, one from 1979 to 2000 and other from 2001 to 2008. The data in group one are used for simulation due to relatively more consistency in terms of availability.
3.2. Satellite and DEM Data DEM data for Pakistan are obtained from Shuttle Radar Topography Mission (SRTM) (ftp://e0mss21u.ecs.nasa.gov/srtm/). The data of 3 Arc-Second, almost with 900 m cell size, are employed in this
S. Sultan et al.
406
research. The cloud-fraction data were retrieved from Moderate Resolution Imaging Spectroradiometer (MODIS) Level-2 product to estimate cloud cover over Pakistan at are solution of about 1 km.
3.2.1. Methodology From the models of Hay (1979) [10], Gueymard (1987) [11], Skartveit et al. (1985) [12] and Perez et al. (1986) [13], we can calculate the global and diffuse radiation on an inclined (slope) surface. Hay’s model distinguishes from the three other models by its simple structure and the small number of input values.
The Hay’s model is structured as follows
0
1b bd d b d
o
H H H HH H R H V
H Hαβ
− −= + −
(1)
where dH αβ is the diffuse solar radiation quantity on rugged terrain;
dH is the diffuse solar radiation quantity reaching the flat surface (horizontal plane); H is the global solar radiation quantity on a horizontal plane;
bH is the direct solar radiation quantity on a horizontal plane; 0H is extraterrestrial solar radiation quantity on a horizontal surface;
bR is the ratio of extraterrestrial solar radiation quantity on rugged terrain ( )dH αβ to that on a horizontal
surface ( )0H , i.e. 0
0b
HR
Hαβ= , which is also known as the conversion factor;
V is topographic openness. If the sky is overcast, theoretically the direct irradiation will be zero, therefore, 0dH H− = . That leads to
changes the anisotropic model into the isotropic model and for 0dH H H− → , the anisotropic model ap-proaches to the circumsolar model. Considering the topographic openness model (sky view factor) V and conversion factor bR , Equation (1) is a universal model for calculating diffuse solar radiation (DSR) quantity on rugged terrain.
3.2.2. Model of Fitting Horizontal Surface Diffuse Solar Radiation ( )bH Even in mountainous area, meteorological stations usually situate at open flat having no obstacles in certain slope. Therefore, observations show the horizontal-surface characteristics. Our fitting model is based on station
dH observations. DSR is an important component of the surface-received global solar radiation so that both are closely related
[14]. Referring to the researches of decomposition models, we present the function for simulating dH , as fol-lows,
( ) ( )1 exp
1
c
dbsH H a
sα
−= + − −
(2)
There, a, b and c are empirical coefficients, s the percentage of sunshine and H the global solar radiation over a horizontal surface and dH is the diffuse solar radiation at horizontal plane.
Equation (2) is of explicit physical implication. For entirely overcast weather (s = 0), there is no direct in-coming solar radiation such that solar radiation striking a horizontal surface is composed completely of diffused solar radiation, i.e., dH H= . On a fine day ( )1s → the horizontal surface received solar radiation is all made up mainly of direct radiation, with DSR component reaching a minimum [7].
The empirical coefficients a, b and c of Equation (2) are determined by measurements [15]. For investigating the time dependent characteristics of empirical coefficients, we take advantage of two kinds of data sets for es-tablishing separately, a unified and a monthly model.
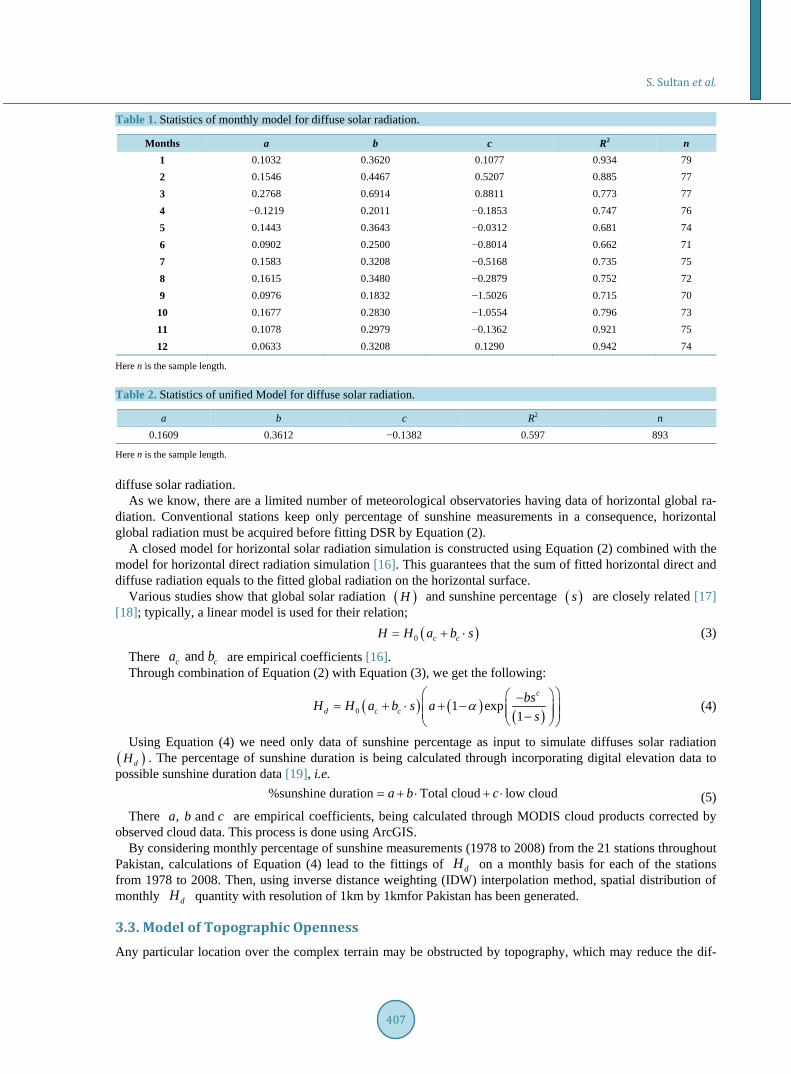
The unified model (Table 2) is formulated with all monthly dH data from all stations concerned as one sample. The monthly model (Table 1) is constructed on the data of the same respective month from all the sta-tions.
From Table 2, by considering the changing characteristics of empirical coefficients with time, monthly mod-els can improve the accuracy of dH simulation effectively. Hence for the locations having data of horizontal global radiation ( )H , we use monthly model with conjunction of percentage sunshine duration to simulate the
S. Sultan et al.
407
Table 1. Statistics of monthly model for diffuse solar radiation.
Months a b c R2 n 1 0.1032 0.3620 0.1077 0.934 79 2 0.1546 0.4467 0.5207 0.885 77 3 0.2768 0.6914 0.8811 0.773 77 4 −0.1219 0.2011 −0.1853 0.747 76 5 0.1443 0.3643 −0.0312 0.681 74 6 0.0902 0.2500 −0.8014 0.662 71 7 0.1583 0.3208 −0.5168 0.735 75 8 0.1615 0.3480 −0.2879 0.752 72 9 0.0976 0.1832 −1.5026 0.715 70 10 0.1677 0.2830 −1.0554 0.796 73 11 0.1078 0.2979 −0.1362 0.921 75 12 0.0633 0.3208 0.1290 0.942 74
Here n is the sample length. Table 2. Statistics of unified Model for diffuse solar radiation.
a b c R2 n 0.1609 0.3612 −0.1382 0.597 893
Here n is the sample length. diffuse solar radiation.
As we know, there are a limited number of meteorological observatories having data of horizontal global ra-diation. Conventional stations keep only percentage of sunshine measurements in a consequence, horizontal global radiation must be acquired before fitting DSR by Equation (2).
A closed model for horizontal solar radiation simulation is constructed using Equation (2) combined with the model for horizontal direct radiation simulation [16]. This guarantees that the sum of fitted horizontal direct and diffuse radiation equals to the fitted global radiation on the horizontal surface.
Various studies show that global solar radiation ( )H and sunshine percentage ( )s are closely related [17] [18]; typically, a linear model is used for their relation;
( )0 c cH H a b s= + ⋅ (3)
There and c ca b are empirical coefficients [16]. Through combination of Equation (2) with Equation (3), we get the following:
( ) ( ) ( )0 1 exp1
c
d c cbsH H a b s a
sα
−= + + − −
⋅
(4)
Using Equation (4) we need only data of sunshine percentage as input to simulate diffuses solar radiation ( )dH . The percentage of sunshine duration is being calculated through incorporating digital elevation data to possible sunshine duration data [19], i.e.
%sunshine duration Total cloud low clouda b c= + ⋅ + ⋅ (5) There , and a b c are empirical coefficients, being calculated through MODIS cloud products corrected by
observed cloud data. This process is done using ArcGIS. By considering monthly percentage of sunshine measurements (1978 to 2008) from the 21 stations throughout
Pakistan, calculations of Equation (4) lead to the fittings of dH on a monthly basis for each of the stations from 1978 to 2008. Then, using inverse distance weighting (IDW) interpolation method, spatial distribution of monthly dH quantity with resolution of 1km by 1kmfor Pakistan has been generated.
3.3. Model of Topographic Openness Any particular location over the complex terrain may be obstructed by topography, which may reduce the dif-
S. Sultan et al.
408
fuse irradiance from its corresponding sky directions. This obstruction can either from self-shadowing by the slope (shading) itself or from adjacent terrain (shadowing). The topographic openness model for sky view factor V can be calculated to give the ratio of diffuse sky irradiance at a point to that on an unobstructed horizontal surface [4].
In rugged terrains, slope-received diffuse solar radiation from particles in the sky is associated with shielding of the surrounding terrain. In previous studies, typically, the topographic openness V for a slope is as follow-ing
1 cos2
V α−= (6)
where α is the grade of slope. The model (Equation (6)) gives just the self-shielding of a single slope with an infinite length of itself. How-
ever, the topographic openness is also dependent on the inter-shielding of terrains around. Thus, the shielding effect requires numerical integration within 2π azimuth. The topographic openness model for a point P over the rugged surface is given below,
1) With ∆Φ (degrees) as the step length of the azimuth, we divide 2π circumference into n azimuths
360intn = ∆Φ (7)
where ( )int is a function which gets the integer part of the value 360∆Φ
.
2) With south as the start direction, i.e. 0 0Φ = , and ∆Φ as step length of azimuth, in a clockwise direction, the n azimuths can be given by
0 0,1, 2, , 1i i i nΦ = Φ + ⋅∆Φ = − (8) 3) Calculation of the openness iV at the direction iΦ , Fu (1983) [20] proved that openness of point P at
the direction of iΦ is
1 sini iV α= − (9)
where iα denotes the largest elevation angle of P at the direction of iΦ , i.e., the largest shielding angle caused by terrain at the direction of iΦ .
Starting from P and drawing a straight line iL in the direction of iΦ , then, we can compare elevation an-gles of P at the points along iL to find the maximum. In calculation, terrain elevations are obtained from the DEM that consists of grids with constant length and width. In our proposed model, a space step length L∆ is used in determining the elevation angles along iL . The minimal grid length and width are used as L∆ which is denoted as:
( )min size ,sizeL x y∆ = (10)
where sizex is the resolution of DEM in the -axisx , while sizey the resolution of DEM in the -axisy . With L∆ as the space step length, the elevation of point j is
( ), 1, 2, ,ij p p yZ Z x j L y j L j Nω= + ∆ + ∆ = (11)
where Lω∆ and yL∆ are the increase of the space step lengths in the and x y direction, respectively, with ( ) ( )sin and cosi y iL L L Lω∆ = ∆ × Φ ∆ = ∆ × Φ . Therefore, for point P , the shielding angle of point j is as
follows;
( ) ( ), ,arctan p p y p p
ij
Z x j L y j L Z x y
j Lωα
+ ∆ + ∆ − = ∆
(12)
For point P , the greatest shielding angle caused by terrains in the direction of iL∆ is
( )max 1, 2, ,i i j j Nα α= = (13)
The length of iL is not essentially infinite, but taking a certain shielding radius R is enough to meet the
S. Sultan et al.
409
needs of calculation and N in Equation (11) and Equation (13) stands for the number of calculations, depend-ing on the screening radius R and the step length L∆ .
Since tangential function increases monotonously in the bound ( )π 2, π 2− , the following expressions are used to increase efficiency of calculation.
( ) ( ), ,max 1, 2, ,p p y p p
i
Z x j L y j L Z x yH j N
jω
+ ∆ + ∆ − = =
(14)
arctan ii
HL
α = ∆ (15)
Then Equation (9) is employed to compute the openness iV of the point P at the direction of iΦ . The impossibility to ensure and p p yx j L y j Lω+ ∆ + ∆ in integers leads to the fact that
( ),p p yZ x j L y j Lω+ ∆ + ∆ has to be obtained with resample method. Bilinear interpolation method [21] is used
in the calculation. 4) Calculation of topographic openness of point P : we make averaging of openness iV at iΦ along 2π
circumference, resulting in the topographic openness of P , that is 1
0
1 n
ii
V Vn
−
=
= ∑ (16)
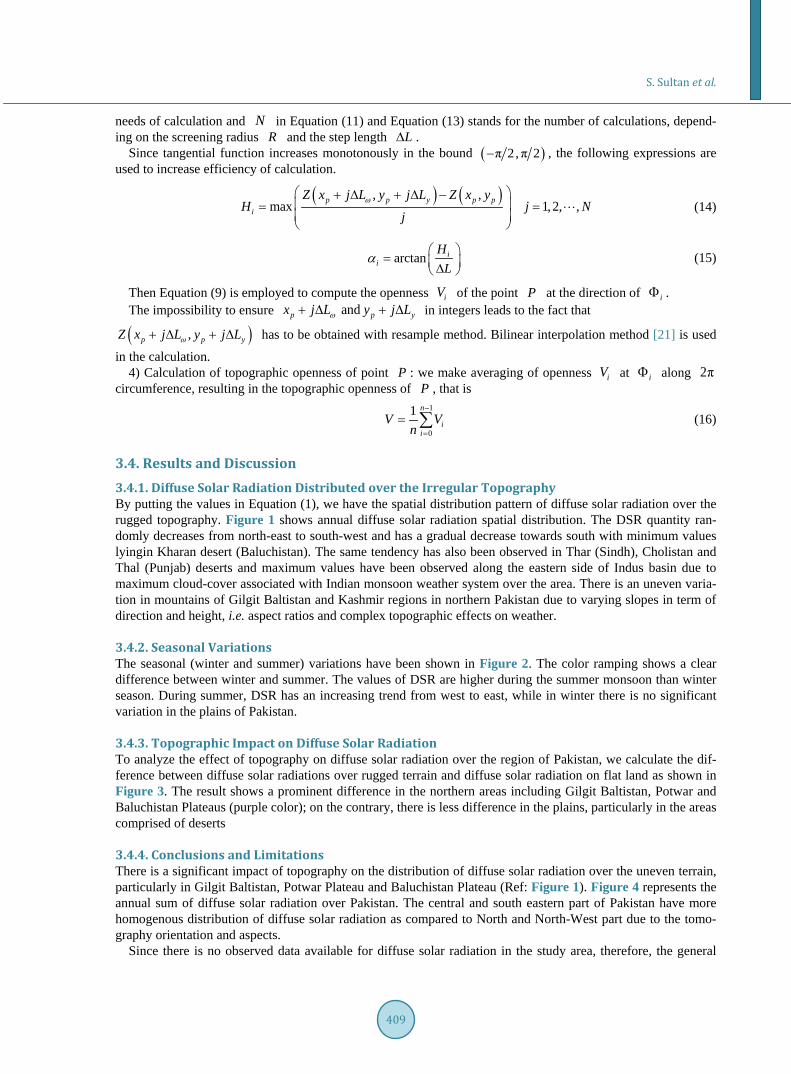
3.4. Results and Discussion 3.4.1. Diffuse Solar Radiation Distributed over the Irregular Topography By putting the values in Equation (1), we have the spatial distribution pattern of diffuse solar radiation over the rugged topography. Figure 1 shows annual diffuse solar radiation spatial distribution. The DSR quantity ran-domly decreases from north-east to south-west and has a gradual decrease towards south with minimum values lyingin Kharan desert (Baluchistan). The same tendency has also been observed in Thar (Sindh), Cholistan and Thal (Punjab) deserts and maximum values have been observed along the eastern side of Indus basin due to maximum cloud-cover associated with Indian monsoon weather system over the area. There is an uneven varia-tion in mountains of Gilgit Baltistan and Kashmir regions in northern Pakistan due to varying slopes in term of direction and height, i.e. aspect ratios and complex topographic effects on weather.
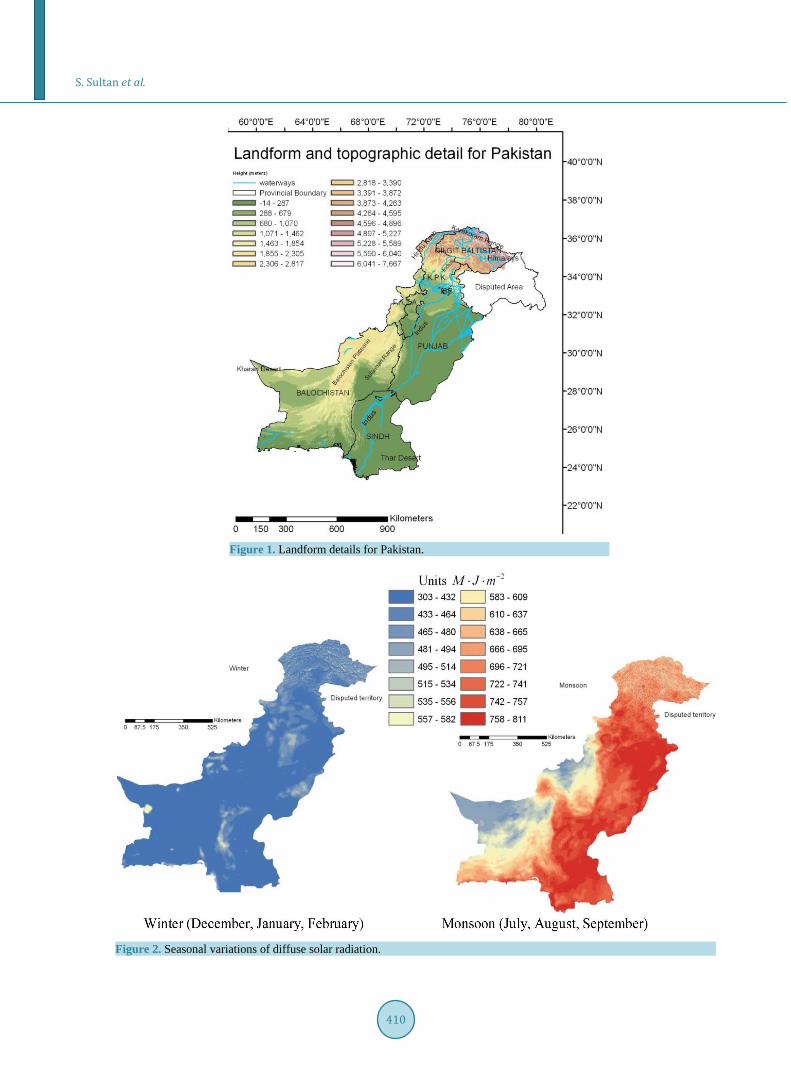
3.4.2. Seasonal Variations The seasonal (winter and summer) variations have been shown in Figure 2. The color ramping shows a clear difference between winter and summer. The values of DSR are higher during the summer monsoon than winter season. During summer, DSR has an increasing trend from west to east, while in winter there is no significant variation in the plains of Pakistan.
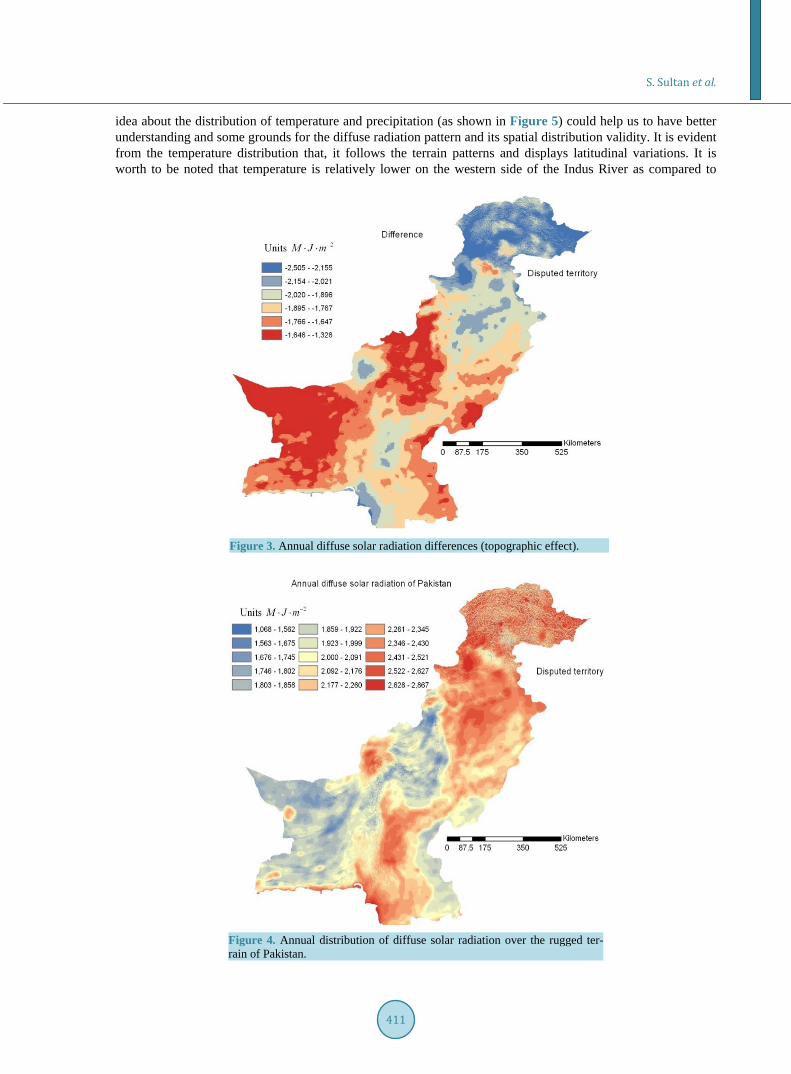
3.4.3. Topographic Impact on Diffuse Solar Radiation To analyze the effect of topography on diffuse solar radiation over the region of Pakistan, we calculate the dif-ference between diffuse solar radiations over rugged terrain and diffuse solar radiation on flat land as shown in Figure 3. The result shows a prominent difference in the northern areas including Gilgit Baltistan, Potwar and Baluchistan Plateaus (purple color); on the contrary, there is less difference in the plains, particularly in the areas comprised of deserts
3.4.4. Conclusions and Limitations There is a significant impact of topography on the distribution of diffuse solar radiation over the uneven terrain, particularly in Gilgit Baltistan, Potwar Plateau and Baluchistan Plateau (Ref: Figure 1). Figure 4 represents the annual sum of diffuse solar radiation over Pakistan. The central and south eastern part of Pakistan have more homogenous distribution of diffuse solar radiation as compared to North and North-West part due to the tomo-graphy orientation and aspects.
Since there is no observed data available for diffuse solar radiation in the study area, therefore, the general
S. Sultan et al.
410
Figure 1. Landform details for Pakistan.
Figure 2. Seasonal variations of diffuse solar radiation.
S. Sultan et al.
411
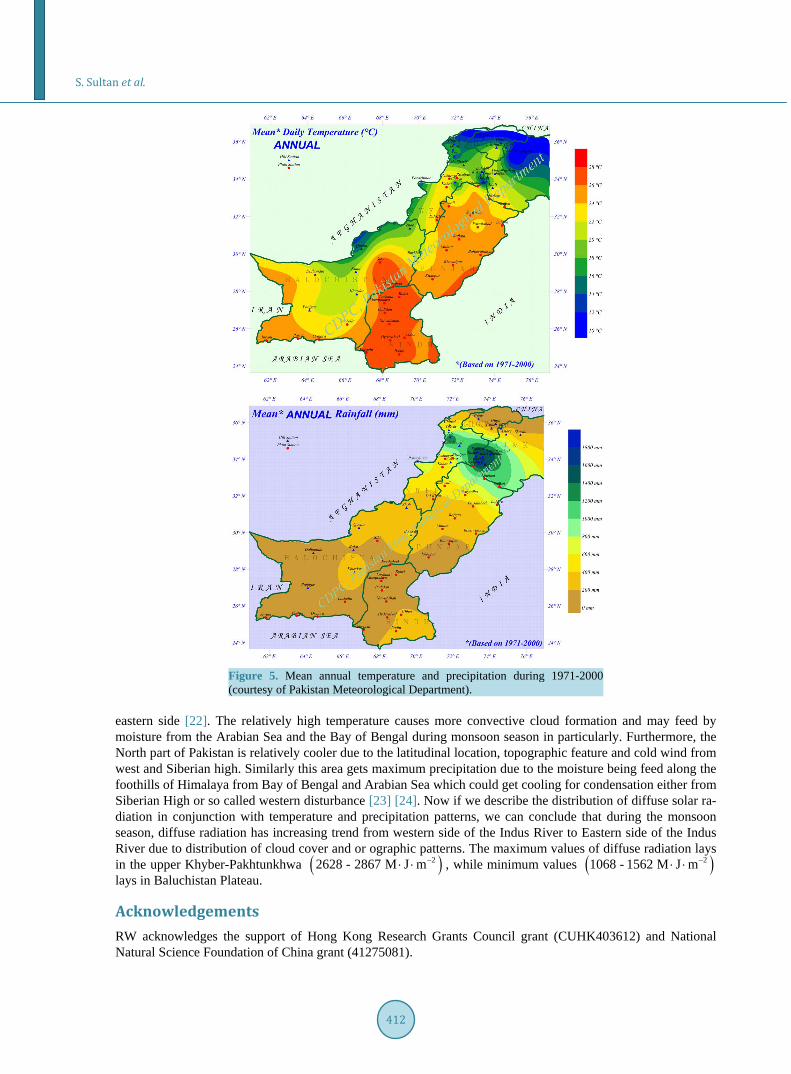
idea about the distribution of temperature and precipitation (as shown in Figure 5) could help us to have better understanding and some grounds for the diffuse radiation pattern and its spatial distribution validity. It is evident from the temperature distribution that, it follows the terrain patterns and displays latitudinal variations. It is worth to be noted that temperature is relatively lower on the western side of the Indus River as compared to
Figure 3. Annual diffuse solar radiation differences (topographic effect).
Figure 4. Annual distribution of diffuse solar radiation over the rugged ter- rain of Pakistan.
S. Sultan et al.
412
Figure 5. Mean annual temperature and precipitation during 1971-2000 (courtesy of Pakistan Meteorological Department).
eastern side [22]. The relatively high temperature causes more convective cloud formation and may feed by moisture from the Arabian Sea and the Bay of Bengal during monsoon season in particularly. Furthermore, the North part of Pakistan is relatively cooler due to the latitudinal location, topographic feature and cold wind from west and Siberian high. Similarly this area gets maximum precipitation due to the moisture being feed along the foothills of Himalaya from Bay of Bengal and Arabian Sea which could get cooling for condensation either from Siberian High or so called western disturbance [23] [24]. Now if we describe the distribution of diffuse solar ra-diation in conjunction with temperature and precipitation patterns, we can conclude that during the monsoon season, diffuse radiation has increasing trend from western side of the Indus River to Eastern side of the Indus River due to distribution of cloud cover and or ographic patterns. The maximum values of diffuse radiation lays in the upper Khyber-Pakhtunkhwa ( )22628 - 2867 M J m−⋅ ⋅ , while minimum values ( )21068 - 1562 M J m−⋅ ⋅ lays in Baluchistan Plateau.
Acknowledgements RW acknowledges the support of Hong Kong Research Grants Council grant (CUHK403612) and National Natural Science Foundation of China grant (41275081).
S. Sultan et al.
413
References [1] Blood, P. (1994) Pakistan: A Country Study. Federal Research Division of the Library of Congress.
http://countrystudies.us/pakistan/23.htm [2] Barbour, M., Burk, J. and Pitts, W. (1978) Terrestrial Plant Ecology. 2nd Edition, Menlo Park, Cummings. [3] Zekai, S. (2008) Solar Energy Fundamentals and Modeling Techniques. Springer, London. [4] Dubayaha, R. and Richb, P.M. (1995) Topographic Solar Radiation Models for GIS. International Journal of Geo-
graphical Information Science, 9, 405-419. [5] Dozier, J. (1980) A Clear-Sky Spectral Solar Radiation Model for Snow-Covered Mountainous Terrain. Water Re-
sources Research, 16, 709-718. http://dx.doi.org/10.1029/WR016i004p00709 [6] Bocqust, G. (1984) Method of Study and Cartography of the Potential Sunny Periods in Mountainous Areas. Journal of
Climatology, 1, 587-596. [7] Sultan, S., Renguang, W. and Ahmad, I. (2014) Impact of Terrain and Cloud Cover on the Distribution of Incoming
Direct Solar Radiation over Pakistan. Journal of Geographic Information System, 6, 70-77. http://dx.doi.org/10.4236/jgis.2014.61008
[8] Amir, N.K. (2010) Climate Change Adaptation and Disaster Risk Reduction in Pakistan. In: Rajib Shaw, J.M.P.J.J.P., Ed., Climate Change Adaptation and Disaster Risk Reduction: An Asian Perspective, Vol. 5, Emerald Group Publish-ing Limited, 197-215.
[9] Sultan, S. and Ahmad, I. (2008) Determination of Daily Regional Scale Actual Evapotranspiration for Indus Sub-Basin Using Landsat ETM +. Pakistan Journal of Meteorology, 4, 49-58.
[10] Hay, J. (1979) Calculation of Monthly Mean Solar Radiation for Horizontal and Inclined Surfaces. Solar Energy, 23, 301-307.
[11] Gueymard, C. (1987) An Anisotropic Solar Irradiance Model for Tilted Surfaces and Its Comparison with Selected Engineering Algorithms. Solar Energy, 38, 367-386. http://dx.doi.org/10.1016/0038-092X(87)90009-0
[12] Skartveit, A. and Olseth, J. (1985) Modelling Slope Irradiance at High Latitudes. Solar Energy, 36, 333-344. http://dx.doi.org/10.1016/0038-092X(86)90151-9
[13] Perez, R., Stewart, R., Arbogast, C., Seals, R. and Scott, J. (1986) An Anisotropic Hourly Diffuse Radiation Model for Sloping Surfaces: Description, Performance Validation, Site Dependency Evaluation. Solar Energy, 36, 481-497. http://dx.doi.org/10.1016/0038-092X(86)90013-7
[14] Bartoli, B., Cuomo, V., Amato, U., Barone, G. and Mattarelli, P. (1982) Diffuse and Beam Components of Daily Global Radiation in Genova and Macerata. Solar Energy, 28, 307-311. http://dx.doi.org/10.1016/0038-092X(82)90304-8
[15] Liu, B. and Jordan, R. (1960) The Interrelationship and Characteristic Distribution of Direct, Diffuse and Total Solar Radiation. Solar Energy, 4, 1-19. http://dx.doi.org/10.1016/0038-092X(60)90062-1
[16] Shahzad, S. (2011) Distribution of Global Solar Radiation over the Rugged Terrain of Pakistan. M.S. Thesis, Nanjing University of Information Science and Technology (NUIST), Nanjing.
[17] Wong, L.T. and Chow, W. (2001) Solar Radiation Model. Applied Energy, 69, 191-224. http://dx.doi.org/10.1016/S0306-2619(01)00012-5
[18] Weng, D. (1997) Studies on Radiation Climate of China. China Meteorological Press, Beijing. (In Chinese) [19] Wang, L. and Qiu, X. (2009) Distributed Modeling of Direct Solar Radiation of Rugged Terrain Based on GIS. The 1st
International Conference on Information Science and Engineering (ICISE), Nanjing, 26-28 December 2009, 2042- 2045.
[20] Fu, B.P. (1983) Mountain Climate. Meteorology Press, Beijing. (In Chinese) [21] Zhang, Y.S. (2000) Information Systems of Remotely Sensing Imagery. Science Press, Beijing. (In Chinese) [22] Qamar-uz-Zaman, C., Arif, M., Ghulam, R. and Muhammad, A. (2009) Climate Change Indicators of Pakistan. Paki-
stan Meteorological Department, Islamabad. [23] Rashed, M. and Shuanglin, L. (2012) Response of Summer Rainfall in Pakistan to Dust Aerosols in an Atmospheric
General Circulation Model. Quarterly Journal of Hungarian Meteorological Science, 116, 323-333. [24] Wang, S.Y., Robert, D., Gillies, R. and Jin, J.M. (2011) Changing Monsoon Extremes and Dynamics: Example in
Pakistan. 36th NOAA Annual Climate Diagnostics and Prediction Workshop, Fort Worth, TX, 3-6 October 2011, 61-68.